Article

Small-Scale Abiotic Factors Influencing the Spatial Distribution of Phytophthora cinnamomi under Declining Quercus ilex Trees

by
Rafael Sánchez-Cuesta
*,†,
Rafael M. Navarro-Cerrillo
,
José L. Quero
and
Francisco J. Ruiz-Gómez
Department of Forest Engineering, Laboratory of Dendrochronology, Silviculture and Global Change-DendrodatLab-ERSAF, University of Córdoba, Campus de Rabanales, Ctra. N-IV, km. 396, E-14071 Córdoba, Spain
*
Author to whom correspondence should be addressed.
Both authors contributed equally.
Forests 2020, 11(4), 375; https://doi.org/10.3390/f11040375
Submission received: 13 February 2020 / Revised: 20 March 2020 / Accepted: 24 March 2020 / Published: 27 March 2020
(This article belongs to the Special Issue Phytophthora Infestations in Forest Ecosystems)

Abstract

:
Phytophthora root rot is considered one of the main factors associated with holm oak (Quercus ilex L.) mortality. The effectiveness and accuracy of soilborne pathogen and management could be influenced by soil spatial heterogeneity. This factor is of special relevance in many afforestation of southwestern Spain, which were carried out without phytosanitary control of the nursery seedlings. We selected a study area located in a 15 year-old afforestation of Q. ilex, known to be infested by Phytophthora cinnamomi Rands. Soil samples (ntotal = 132) were taken systematically from a grid under 4 trees, and analysed to quantify 12 variables, the colony forming units (cfu) of P. cinnamomi plus 11 physical and chemical soil properties. The combined analysis of all variables was performed with linear mixed models (GLMM), and the spatial patterns of cfu were characterised using an aggregation index (Ia) and a clustering index (ν) by SADIE. Cfu values ranged from 0 to 211 cfu g−1, and the GLMM built with the variables silt, P, K and soil moisture explained the cfu distribution to the greatest extent. The spatial analysis showed that 9 of the 12 variables presented spatial aggregation (Ia > 1), and the clustering of local patches (νi ≥ 1.5) for organic matter, silt, and Ca. The spatial patterns of the P. cinnamomi cfu under planted holm oak trees are related to edaphic variables and canopy cover. Small-scale spatial analysis of microsite variability can predict which areas surrounding trees can influence lower oomycetes cfu availability.

1. Introduction

Mediterranean-like savannas of the southern Iberian Peninsula (hereafter dehesas) are important ecosystems threatened by socioeconomic, climatic and phytosanitary factors. Currently, dehesas are affected by tree mortality caused by root rot [1,2]. After three decades of research and development, holm oak (Quercus ilex subsp. ballota (Desf.) Samp.) decline remains the most-important cause of tree loss in southern Spain and Portugal [3]. Oak decline has been related to management factors, as well as to the influence of climatic factors, such as severe droughts [4]. However, there is a broad consensus that biotic agents (pests and diseases) act as triggers for mortality episodes, in the context of a continuously-deteriorating ecosystem with limited regeneration capacity [5,6].
The root rot caused by soilborne pathogens from the genera Phytophthora spp. and Pythium spp. is considered one of the most-important causes triggering mortality of holm oak [2,7,8], causing rot of fine-roots, leading to water and nutritive stress [9], and therefore changes in tree physiology [10] which are visible in terms of defoliation and chlorosis, and in many cases tree death. These oomycetes remain as resistance structures either in soil, infected roots or debris under unfavourable conditions [11], waiting for suitable biotic and abiotic conditions for germination, leading to sporangia production and the subsequent release of zoospores which then infect new host roots [12].
Due to the heterogeneity of the holm oak fine root distribution, and thus the heterogeneity of the soil rhizosphere in dehesas, it is often necessary to carry out large sampling efforts to avoid false negative outcomes in diagnosis of root rot caused by Phytophthora spp. [13,14]. This soil heterogeneity has been proved to be related with the horizontal canopy distribution in several Quercus spp. [15,16]. Biotic and abiotic factors such as soil microbiota community [17,18,19], and soil moisture and mineral nutrients [20,21,22,23] are also related to the spatial distribution of the tree canopy, mainly due to the differences in the soil exposure to solar radiation and its contribution to processes involved in organic matter formation and mineral deposition [24].
The spatial distribution of the pathogen inoculum in the soil appears to be influenced by rhizosphere heterogeneity, but there is a lack of studies of soil microbiota spatial distribution in forest soils at a small-scale [25,26]. Colony forming units (hereafter, cfu) is the number of propagules which produce countable colonies after sowing in selective medium plates [27]. It is often used as an indicator of the abundance of the inoculum of Phytophthora spp. and other oomycetes in the soil. The density of cfu of Phytophthora cinnamomi Rands has been related to calcium content or plant diversity in Mediterranean oak forests [25,28]. Thus, it has been hypothesized that the spatial distribution of soil physicochemical properties associated with the tree crown may influence the density of the oomycete cfu concentration, and therefore the small-scale spatial distribution of the soil pathogen [20,21,22,23].
Furthermore, the afforestation programmes implemented in Spain at the end of the 20th century and the beginning of the 21st, in the context of the European Economic Community’s aid scheme for forestry measures in agriculture (directives EEC-2080/92, and 1698/2005) have led to 232 000 ha of tree plantations in Andalusia, of which 82 775 ha are Q. ilex [29]. The afforestation programme funded plantation costs, conservation and maintenance, without paying attention to the phytosanitary control of the nursery seedlings at the time of planting. This lack of phytosanitary control is considered a threat to seedling survival and a reason for the spread of potential soil pathogens [11,30], especially when dealing with invasive alien pathogens such as Phytophthora spp., since biological invasion is one of the main drivers of global change in Mediterranean climates [31].
The main objective of this study was to evaluate the effect of several soil and plant parameters on the spatial distribution and aggregation of P. cinnamomi cfu in holm oak. For this purpose, we selected as a case-study an afforestation on former agricultural land, to take advantage of the homogeneity of plant genotype and age, climatic variables and soil conditions among the selected individuals. The specific objectives were: (i) to evaluate the effect of the tree crown cover and the soil physicochemical characteristics on the spatial distribution of the cfu; and (ii) to model the relationships between spatial patterns of cfu, tree crown cover and soil variables to evaluate the predictive capacity of these variables. Once these objectives were met, we intended to ascertain which microsite variables are potentially more important regarding the presence and spatial distribution of P. cinnamomi. This could help to guide the sampling effort for the diagnosis of root rot, and to determine the predisposition of soils to host the pathogen according to their physical and chemical characteristics.

2. Material and Methods

2.1. Study Zone

The study was carried out in a Q. ilex afforestation site located in Puebla de Guzmán (Andalusia - southern Spain, coordinates ETRS89, UTM30N: 120 500 mW, 4 167 500 mN, 185–188 masl). The area is characterised by a mean annual temperature of 16.8 °C and a mean annual rainfall of 570 mm (Meteorological Station of IFAPA, Puebla de Guzman, coordinates ETRS89, UTM30N: 124 659 mW, 4 164 620 mN; 195 masl. Institute of Agronomic and Fishery Research and Training-IFAPA, Junta de Andalusia), with a dry thermo-Mediterranean climate (120–150 biologically-dry days) with hot and dry summers and mild winters. The area has an undulating relief (slope between 5 and 10%, Supplementary Material, Table S1). Soils are shallow and acidic in nature, with rocky outcrops of slate and schists, an almost total absence of free calcium carbonate and sometimes a slight surface layer of organic matter. The site was cropped periodically before 1990 and has been left fallow since this date, supporting a mixture of native herbaceous species associated with former agricultural land and shrubs (Cistus ladanifer L.). A holm oak plantation was established in 1995. The planting area was sub-soiled, using a ripper with a single tine, to a depth of 60 cm and soil clods were broken up using a spring harrow and culta-mulcher, to provide a more-level surface for the plantation. The planting was done by hand following a systematic spatial pattern of distribution, with a density of 312 plants ha−1 (4 × 8 m spacing), using tree shelter. No additional soil treatments were carried out after the afforestation.

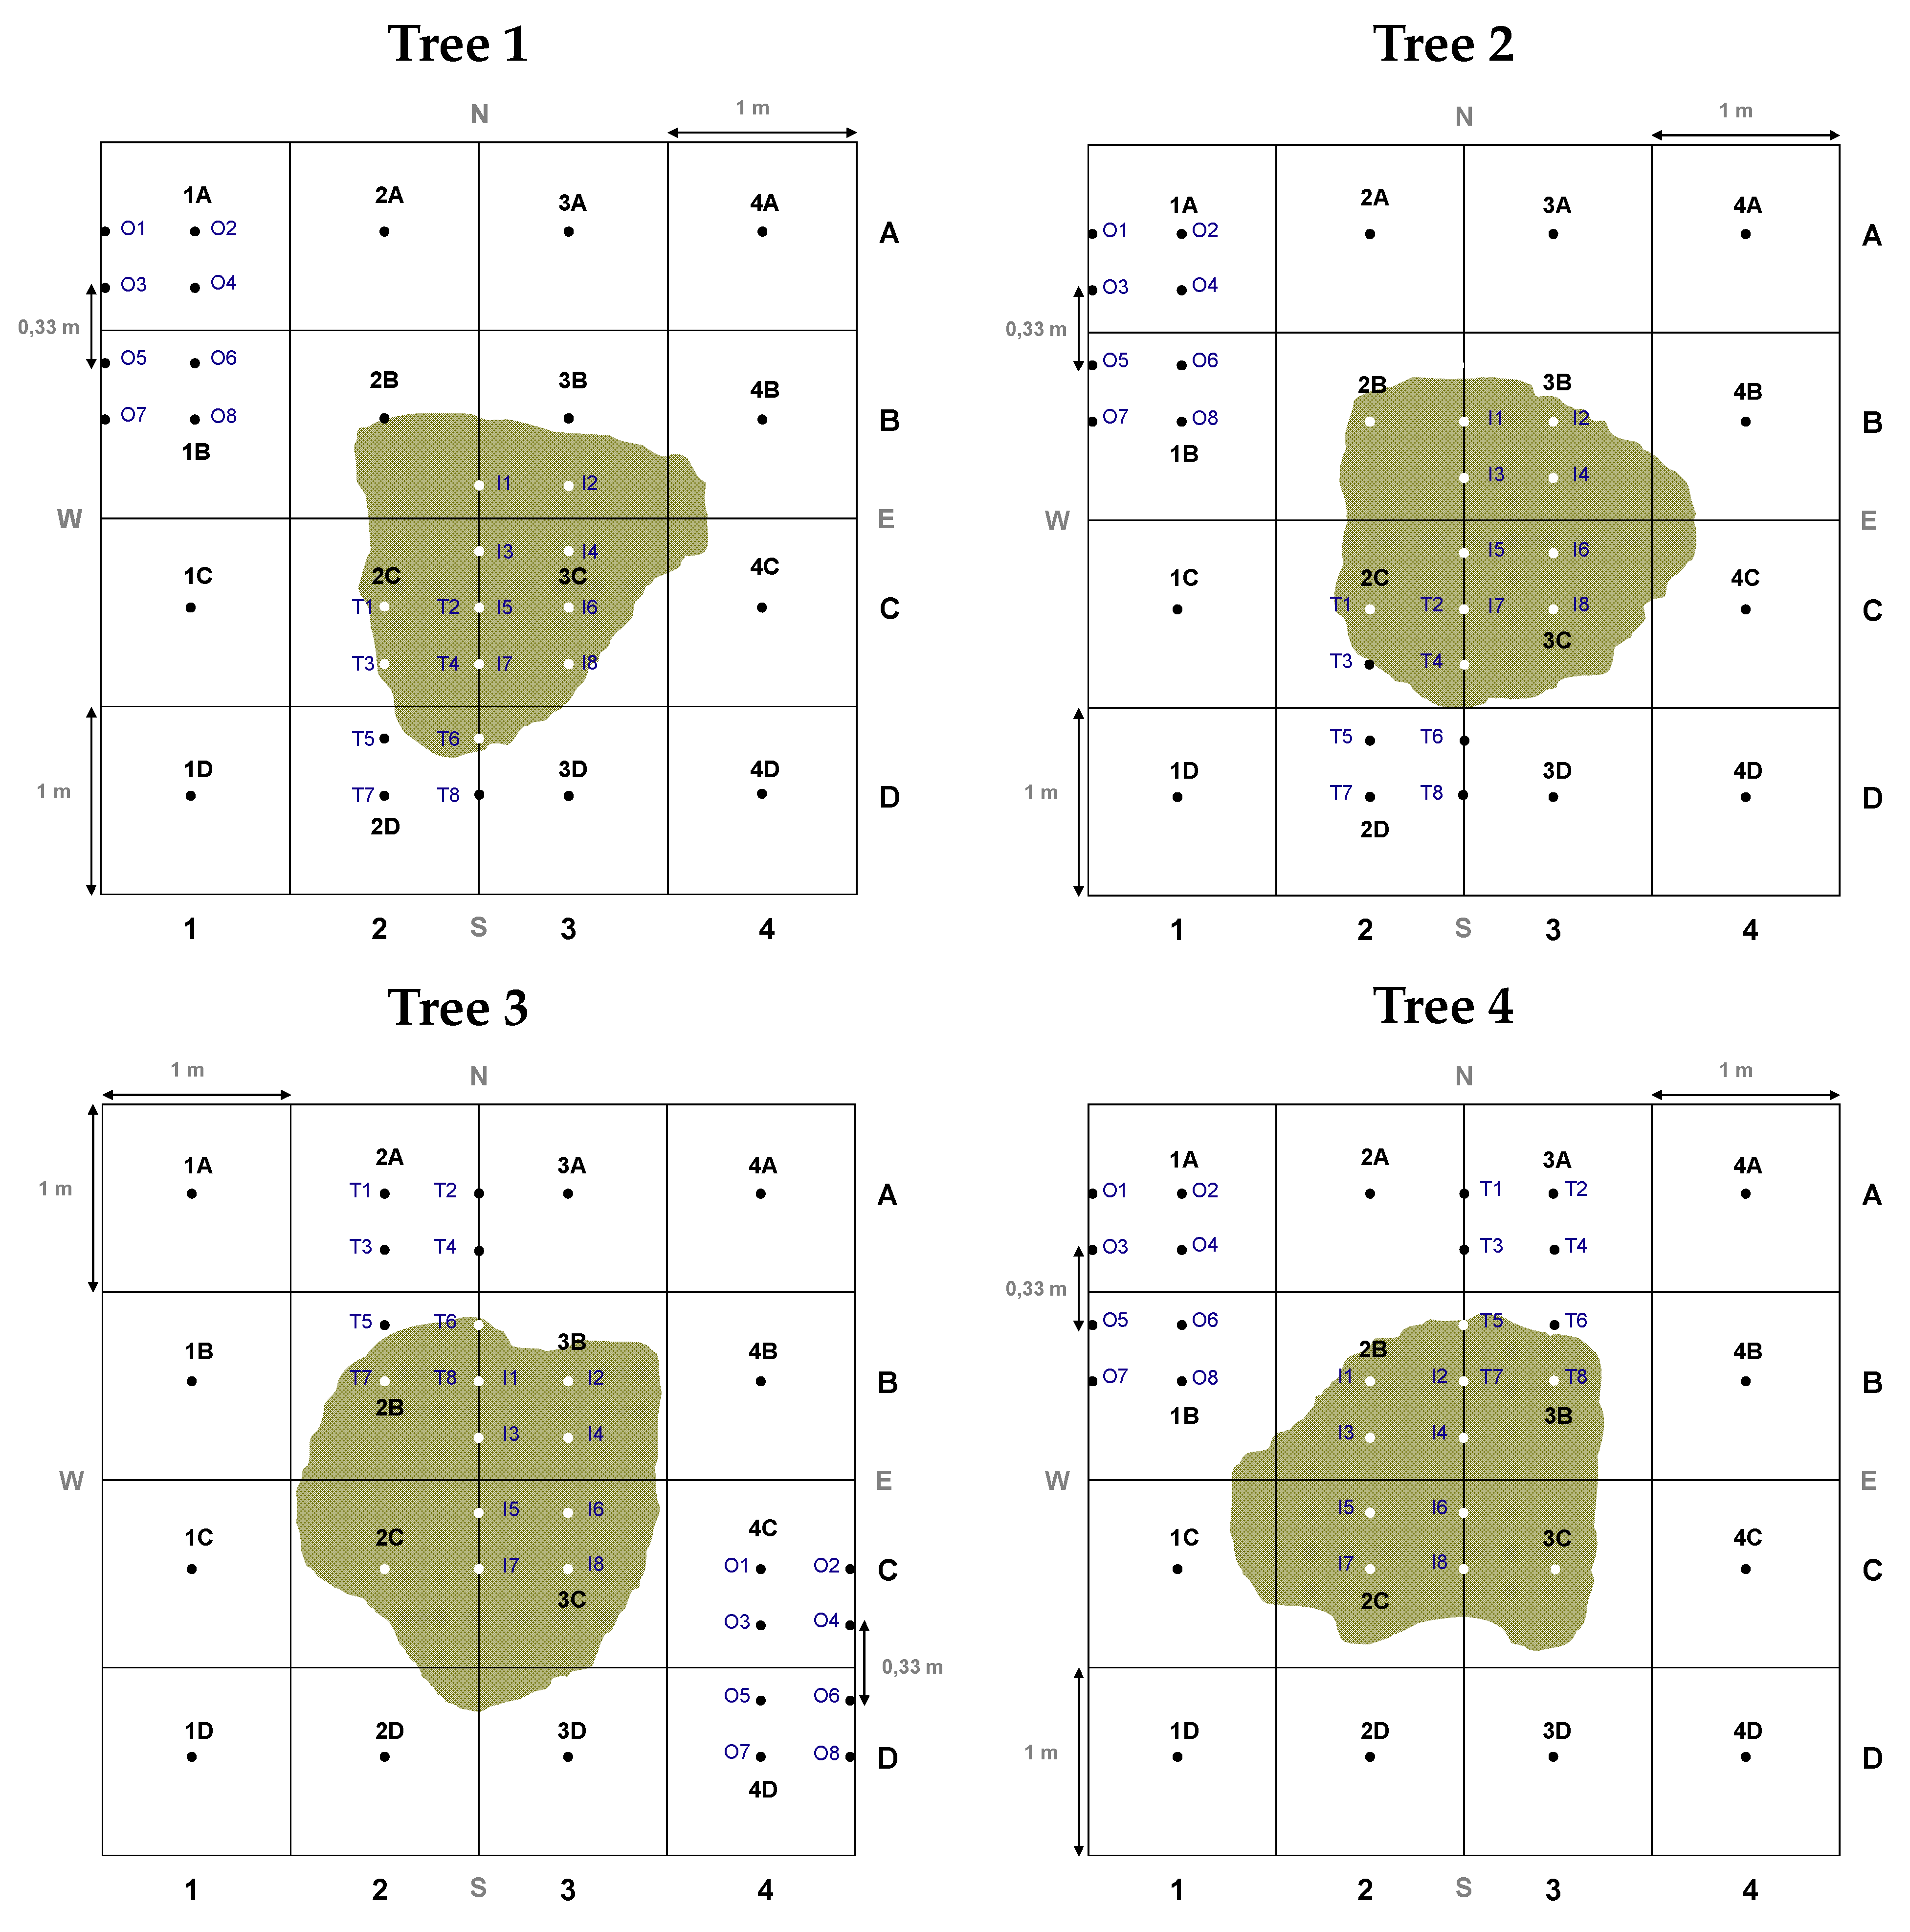
2.2. Soil Sampling Design

In spring (April) 2010, the plot (100 m2) was established to include four Q. ilex trees with symptoms of oak decline (mean defoliation 30%) and previously shown to be infested by P. cinnamomi (Newbiotechnic S.A., NBT-No. 41/04/PR/PSX). The effects of practices carried out during cultivation and plantation management were homogeneous for the selected trees. The four trees were regular in size (DBH = 9.5 ± 0.5 cm; H = 2.5 ± 0.1 m). Visual phytosanitary assessment was carried out following the European Network of Damage in Forest Masses manual [32]. The trees ranged in crown damage (defoliation) from Class 1 (10 < slight defoliation ≤ 25%) to Class 3 (60 < severe defoliation ≤ 95%) (Supplementary Material, Table S1). Apart from P. cinnamomi, no other biotic agents contributing to the aboveground symptoms were identified during the visual inspection. The presence of root rot was confirmed in all cases through roots diagnosis (loss of secondary fine roots, discoloration and softness).
Under each tree crown, a sampling grid was established north facing, following the methodology proposed by Gallardo [20], and included two grid sizes (Figure 1): a general grid (G) 1 × 1 m (n = 16) in a 4 × 4 m quadrat centred in the trunk, and 0.5 × 0.33 m (n = 24) grid, which were concentrated within the general sampling quadrat according to the crown cover (crown position: O = Outside, T = Transition and I = Inside). Some of the points of the general and concentrated grids were the same, with a total of 33 points sampled per tree (n) (Figure 1). Finally, two categories were established: outside of the crown cover (OC, n = 22) and inside of the crown cover (IC, n = 11). The tree crown projection was obtained with the help of a plumb line, marking the vertical projection of the crown margins over the grid. Regarding orientation, all the points belonging to the A and B quadrats were considered as North points (N) and the ones located in the C and D quadrats, as South points (S).

2.3. Processing and Analysis of Soil Samples

In spring (April) 2010, soil samples were taken at each point of the grid (ntotal = 132). The soil surface layer and the decomposing organic matter layer were removed from a square of 30 × 30 cm centred on the grid point, and a homogeneous soil sample of approximately 1 kg was extracted from the mineral horizon, over the point, to a depth of 20 cm, with the help of a spade [13]. Each sample was placed in a sealed plastic bag to prevent loss of moisture, properly labelled and preserved in an ice-cooler (in the absence of light, at approximately 4 °C) during its transfer to the laboratory. The soil samples were air-dried at room temperature for 48 h and then processed by hand, eliminating the rough fraction after mechanical milling and crushing. Prior to aliquot separation, the fine fraction was homogenised and passed through a 2-mm-Ø sieve. In total, 12 variables (11 edaphic variables plus cfu abundance) were evaluated for each soil sample. First, one aliquot of approximately 100 g was separated for quantification of P. cinnamomi cfu, and other aliquot of approximately 500 g, was sent to Innoagral laboratories, Grupo Hespérides Biotech S.L., (Sevilla, Spain) for the analysis of 10 soil physicochemical variables (% of clay, silt, and sand, pH, organic matter in soil, total nitrogen, carbon-nitrogen ratio and amount of phosphorus, calcium and potassium) (Supplementary Material, Table S2).
Finally, soil moisture (% volumetric content of water) was measured at a depth of 12 cm at all of the sampling points, with a Time Domain Reflectometry (TDR) sensor (Field Scout TDR 100, Spectrum Technologies, Inc. Aurora, IL, USA), at the same time as the collection of soil samples.

2.4. Quantification of Cfu

Ten grams of each homogenised aliquot of soil for cfu analysis, previously dried at room temperature, was suspended in 100 mL 0.2% agar solution, as described in Romero et al. [27]. The solution was gently shaken and 1 mL of the soil suspension was plated with a 1000 µl pipette on 10 Petri plates for each soil sample, containing NARPH selective medium [14]. The soil suspension was carefully distributed over the surface of the selective medium with the help of an inoculation loop. The plates were incubated at room temperature in darkness for 24 h, after which the soil suspension was removed with sterile water. Colonies growing on each plate were counted after an additional 72 h of incubation after washing.
The hyphal bodies that had grown in the culture medium were quantified visually by light contrast with a 10 × 1 magnifying glass (Nikon SMZ800, Nikon Corp., Tokyo, Japan) and a millimetre mesh. Some growing structures were identified through the observation of aleatory chosen NARPH dishes under microscope (Motic BA310E, Motic Instruments Co., Ltd., Chengdu, China) to ensure that no other organisms different from P. cinnamomi were counted. This species was easy identified through the characteristic aseptate coralloid hyphae with clustered hyphal swellings. The sum of the cfu for the 10 replicates per sample was expressed as cfu/g of dry soil. Due to the positive identification of P. cinnamomi on the soil, through molecular methods, and the results of the checking of aleatorily chosen NARPH plates, all the cfu counted were considered directly related with P. cinnamomi cfu abundance.

2.5. Statistical Analysis

All the variables were examined for normality (Shapiro-Wilk test, P < 0.05) and homoscedasticity (Levene test, P < 0.05). When the data did not fit to a normal distribution, the variable was subjected to a square root or logarithmic transformation. Once the normality and homoscedasticity requirements were met, the variables N, OM, C/N, percentage of silt and sand, pH and Ca were analysed using one-way analysis of variance (ANOVA), considering crown position and orientation as independent factors. In those cases where the variables were significant, Tukey’s test for multiple comparisons of means was used to check for differences [33]. In the case of the non-normal variables (cfu, clay percentage, P, K and moisture), a Kruskal-Wallis (H) mean comparison test and the Mann-Whitney U test were applied for pairs of independent groups (P < 0.05). When Mann-Whitney U test was used for mean comparisons on the I-O-T grids, the α threshold to reject the null hypothesis was corrected according to Bonferroni (P < 0.0167) [34]. Specific correlations between the soil variables and cfu were determined using a non-parametric Spearman rho coefficient (ρ) at a significance level of 5% (P < 0.05), including soil variables that did not follow a normal distribution. Statistical analysis was performed using “R” version 3.3.1. [35].
The spatial patterns of cfu were characterised using Spatial Analysis by Distance Indices (SADIE), implemented in the program “SADIEShell v2.0” and the aggregation index (Ia) and clustering index (ν) were calculated per plot [36,37]. The Ia provides information on the overall spatial pattern of each environmental variable. According to Quero et al., [38] the spatial pattern is aggregated if Ia > 1, random if Ia is close to one and regular if Ia < 1. The index ν measures the degree of clustering of the data into patches (mean νi: areas of high values of the target variable) and gaps (mean νj: areas of low values). Then, ν was contoured by kriging in a two-dimensional map showing their spatial distribution of patches (ν ≥ 1.5) and gaps (ν ≤ −1.5) using Surfer 10.1 (Golden Software, CO, USA). An independent SADIE analysis was performed for each variable and tree. Afterwards the mean values of Ia for all the variables in the four trees were calculated and were also represented using the bilinear interpolation method in Surfer 10.1.
Finally, the relationship of the soil variables with the inoculum concentration and crown cover was assessed through a generalized linear mixed model (GLMM). This methodology allows the analysis of non-normal data that involve fixed or random effects [39]. The GLMM was implemented through the “lme4” package. The cfu variable was modelled through Poisson distribution with log transformation. The independent variables were previously filtered using a Variance Inflation Factor (VIF) threshold of 10, and the tree and crown position were selected as random effects [40]. Despite the relevance of crown position as the main factor of this study explaining spatial distribution of several variables, this factor did not present significant influence over the cfu variable when used in the model as fixed effect. Different model configurations were tested, providing the use of crown position and tree as random effects the best result. Autocorrelation of the output model was evaluated through the analysis of model residuals and correlation matrix of fixed effects. The model was selected based on the lowest value of Akaike’s Information Criterion (AIC), which indicates the optimal fit, and the influence of effects was tested through a likelihood ratio test [41]. Comparison between Random Effects influence was performed through ANOVA linear model deleting each effect with glmerControl optimization type “bobyqa” (package “lmer4”) and the influence of single fixed factors through automatic model reduction and Chi-squared test.

3. Results

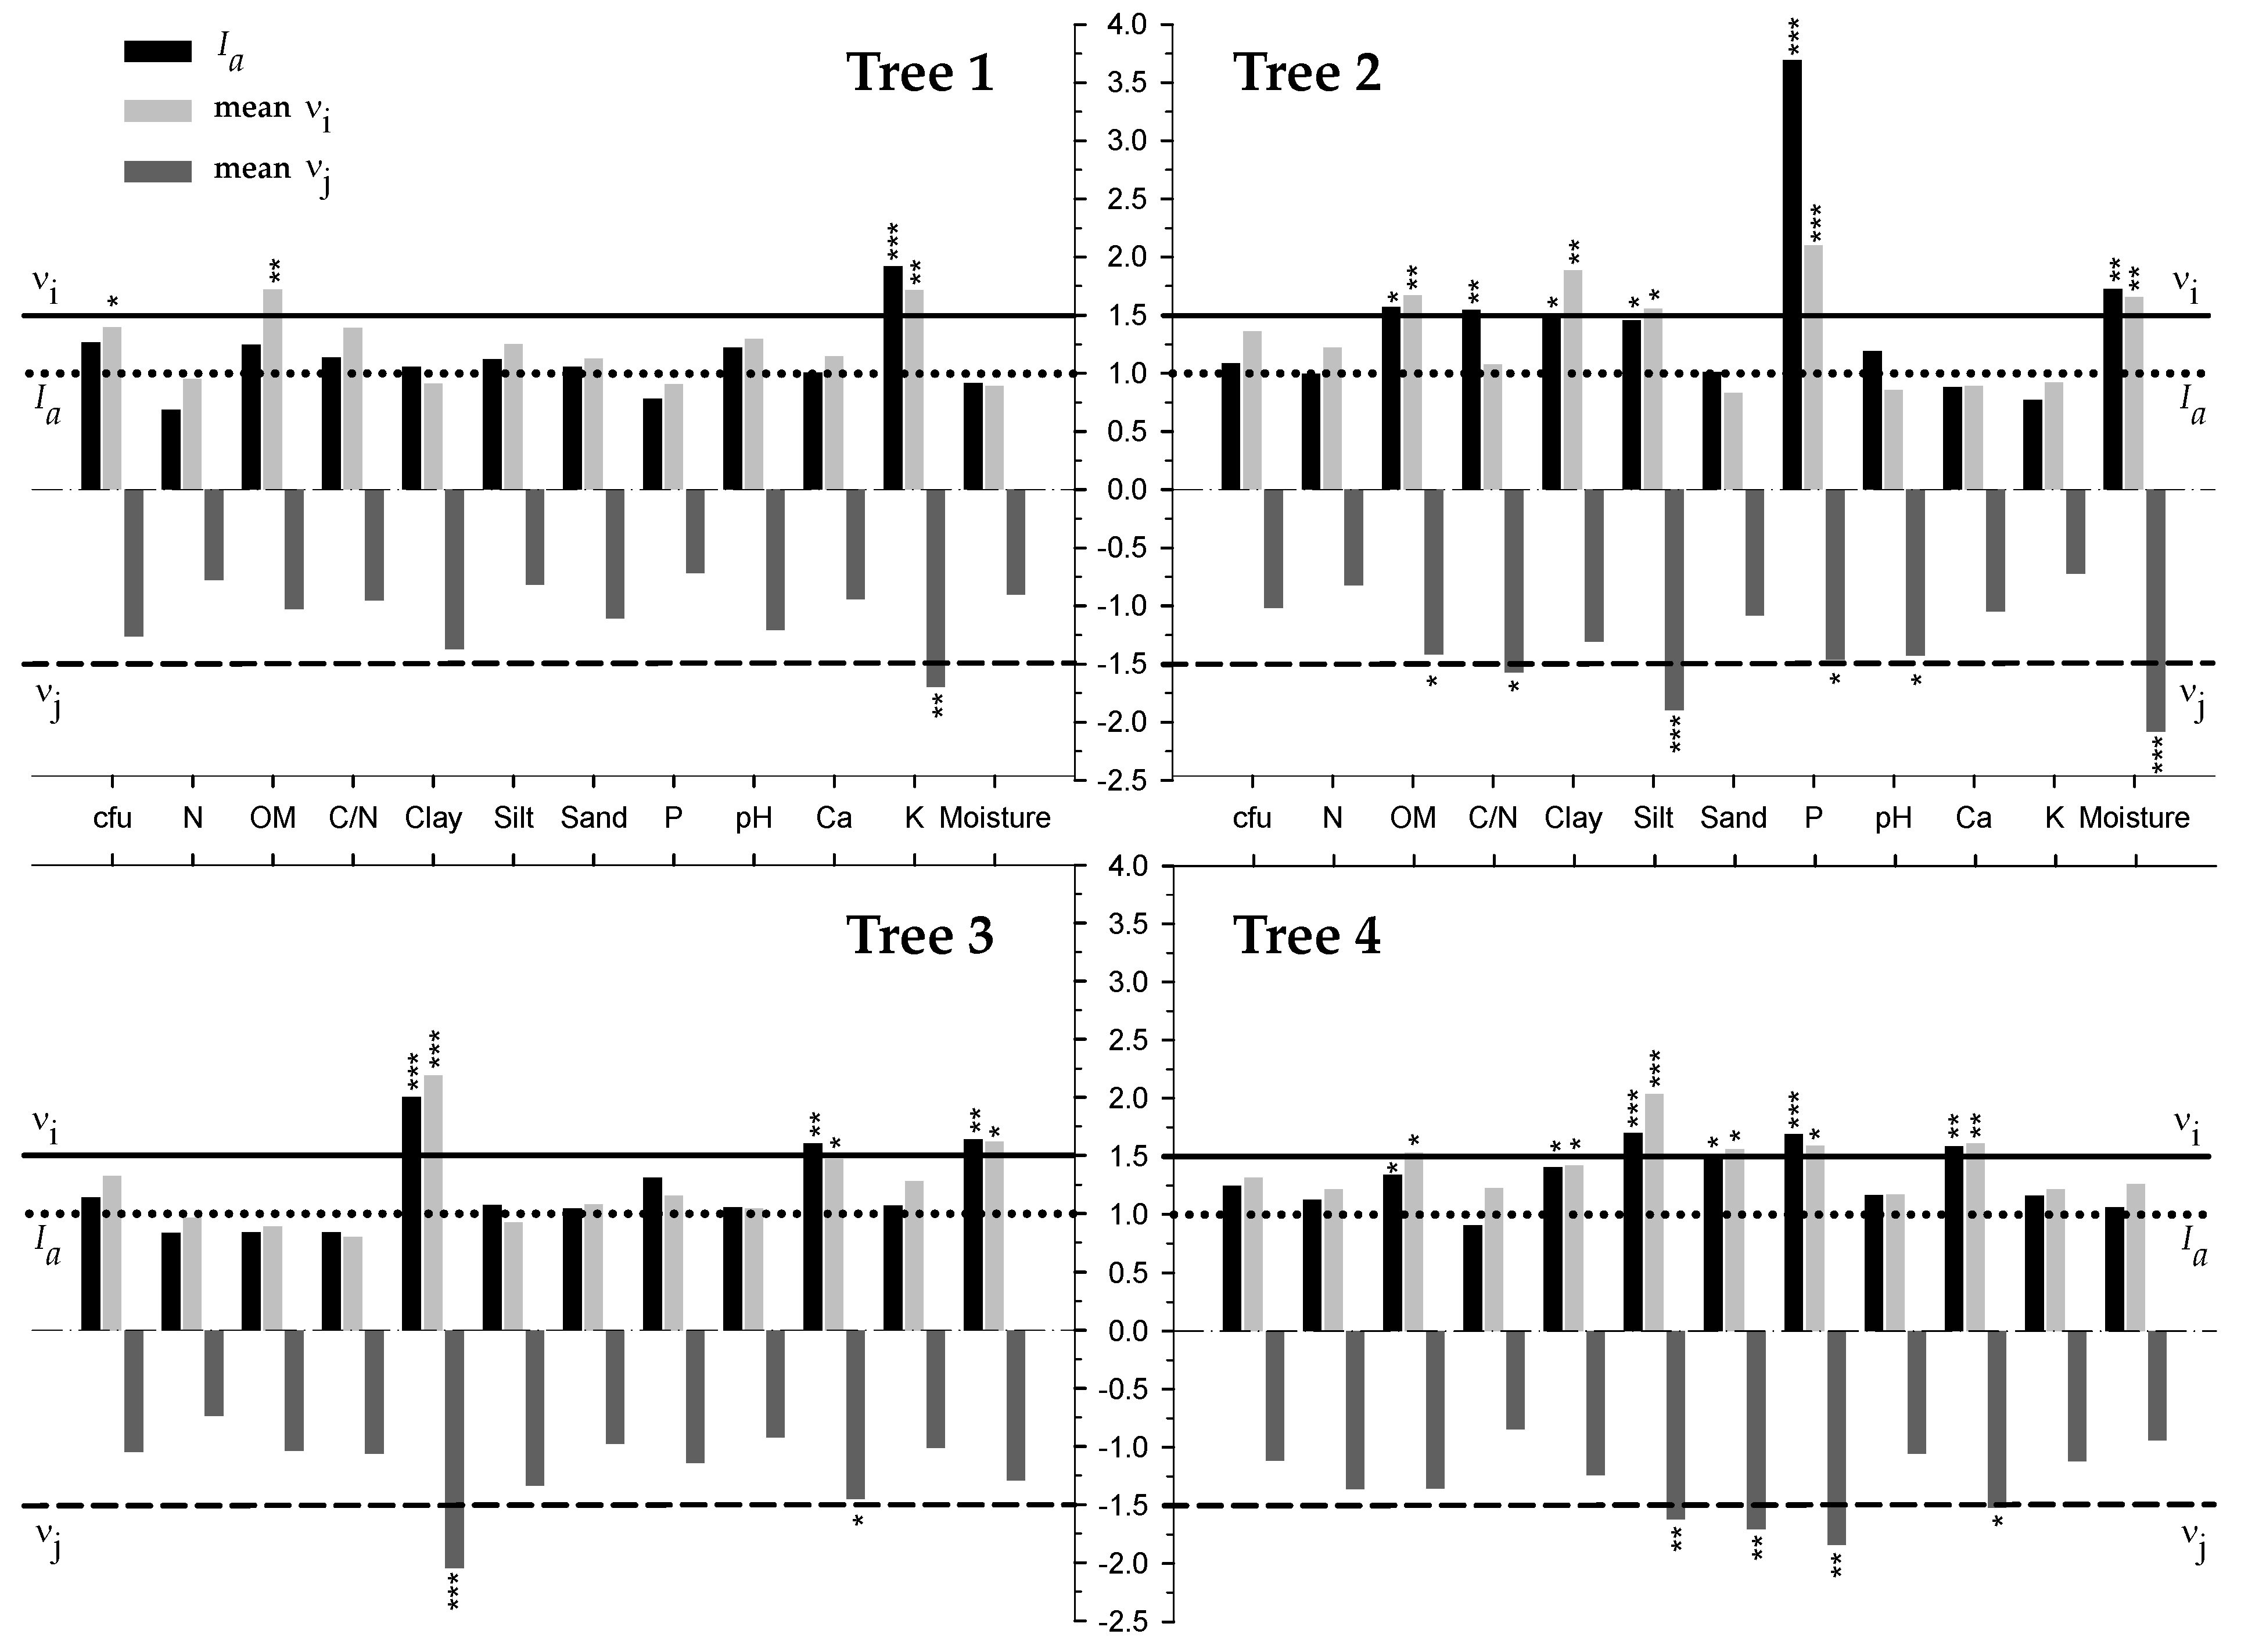
3.1. Spatial Distribution of the Cfu

The cfu values of soil samples ranged from 0 to 211 cfu g−1, for all four trees, showing significant correlation with the tree defoliation level (ρ = 0.986, P < 0.05). Moreover, cfu showed significant differences according to the crown cover factor (I, T and O; HI-O = 20.886, PI-O < 0.001; HO-T = 20.491, PO-T < 0.001; HI-T = 7.549, PI-T < 0.01). The I-grid showed a significant greater concentration of cfu than O grid in all cases (UI-O = 174.5, PI-O < 0.001), and the T-grid presented more variability in its results depending on the tree (Table 1). Moreover, a significantly higher cfu value in the IC grid was observed with respect to OC (HIC-OC = 27.4; UIC-OC = 882.5, PIC-OC < 0.001).
The highest value of cfu in the T-grid occurred in trees with higher level of defoliation (trees 3 and 4, 35 and 70%, respectively). As in the I-grid, the cfu value of IC samples was directly proportional to the defoliation level, being significantly higher for tree 4. Moreover, cfu was significantly higher in points located on the north side of the grid (Hcfu = 8.422, P < 0.01).

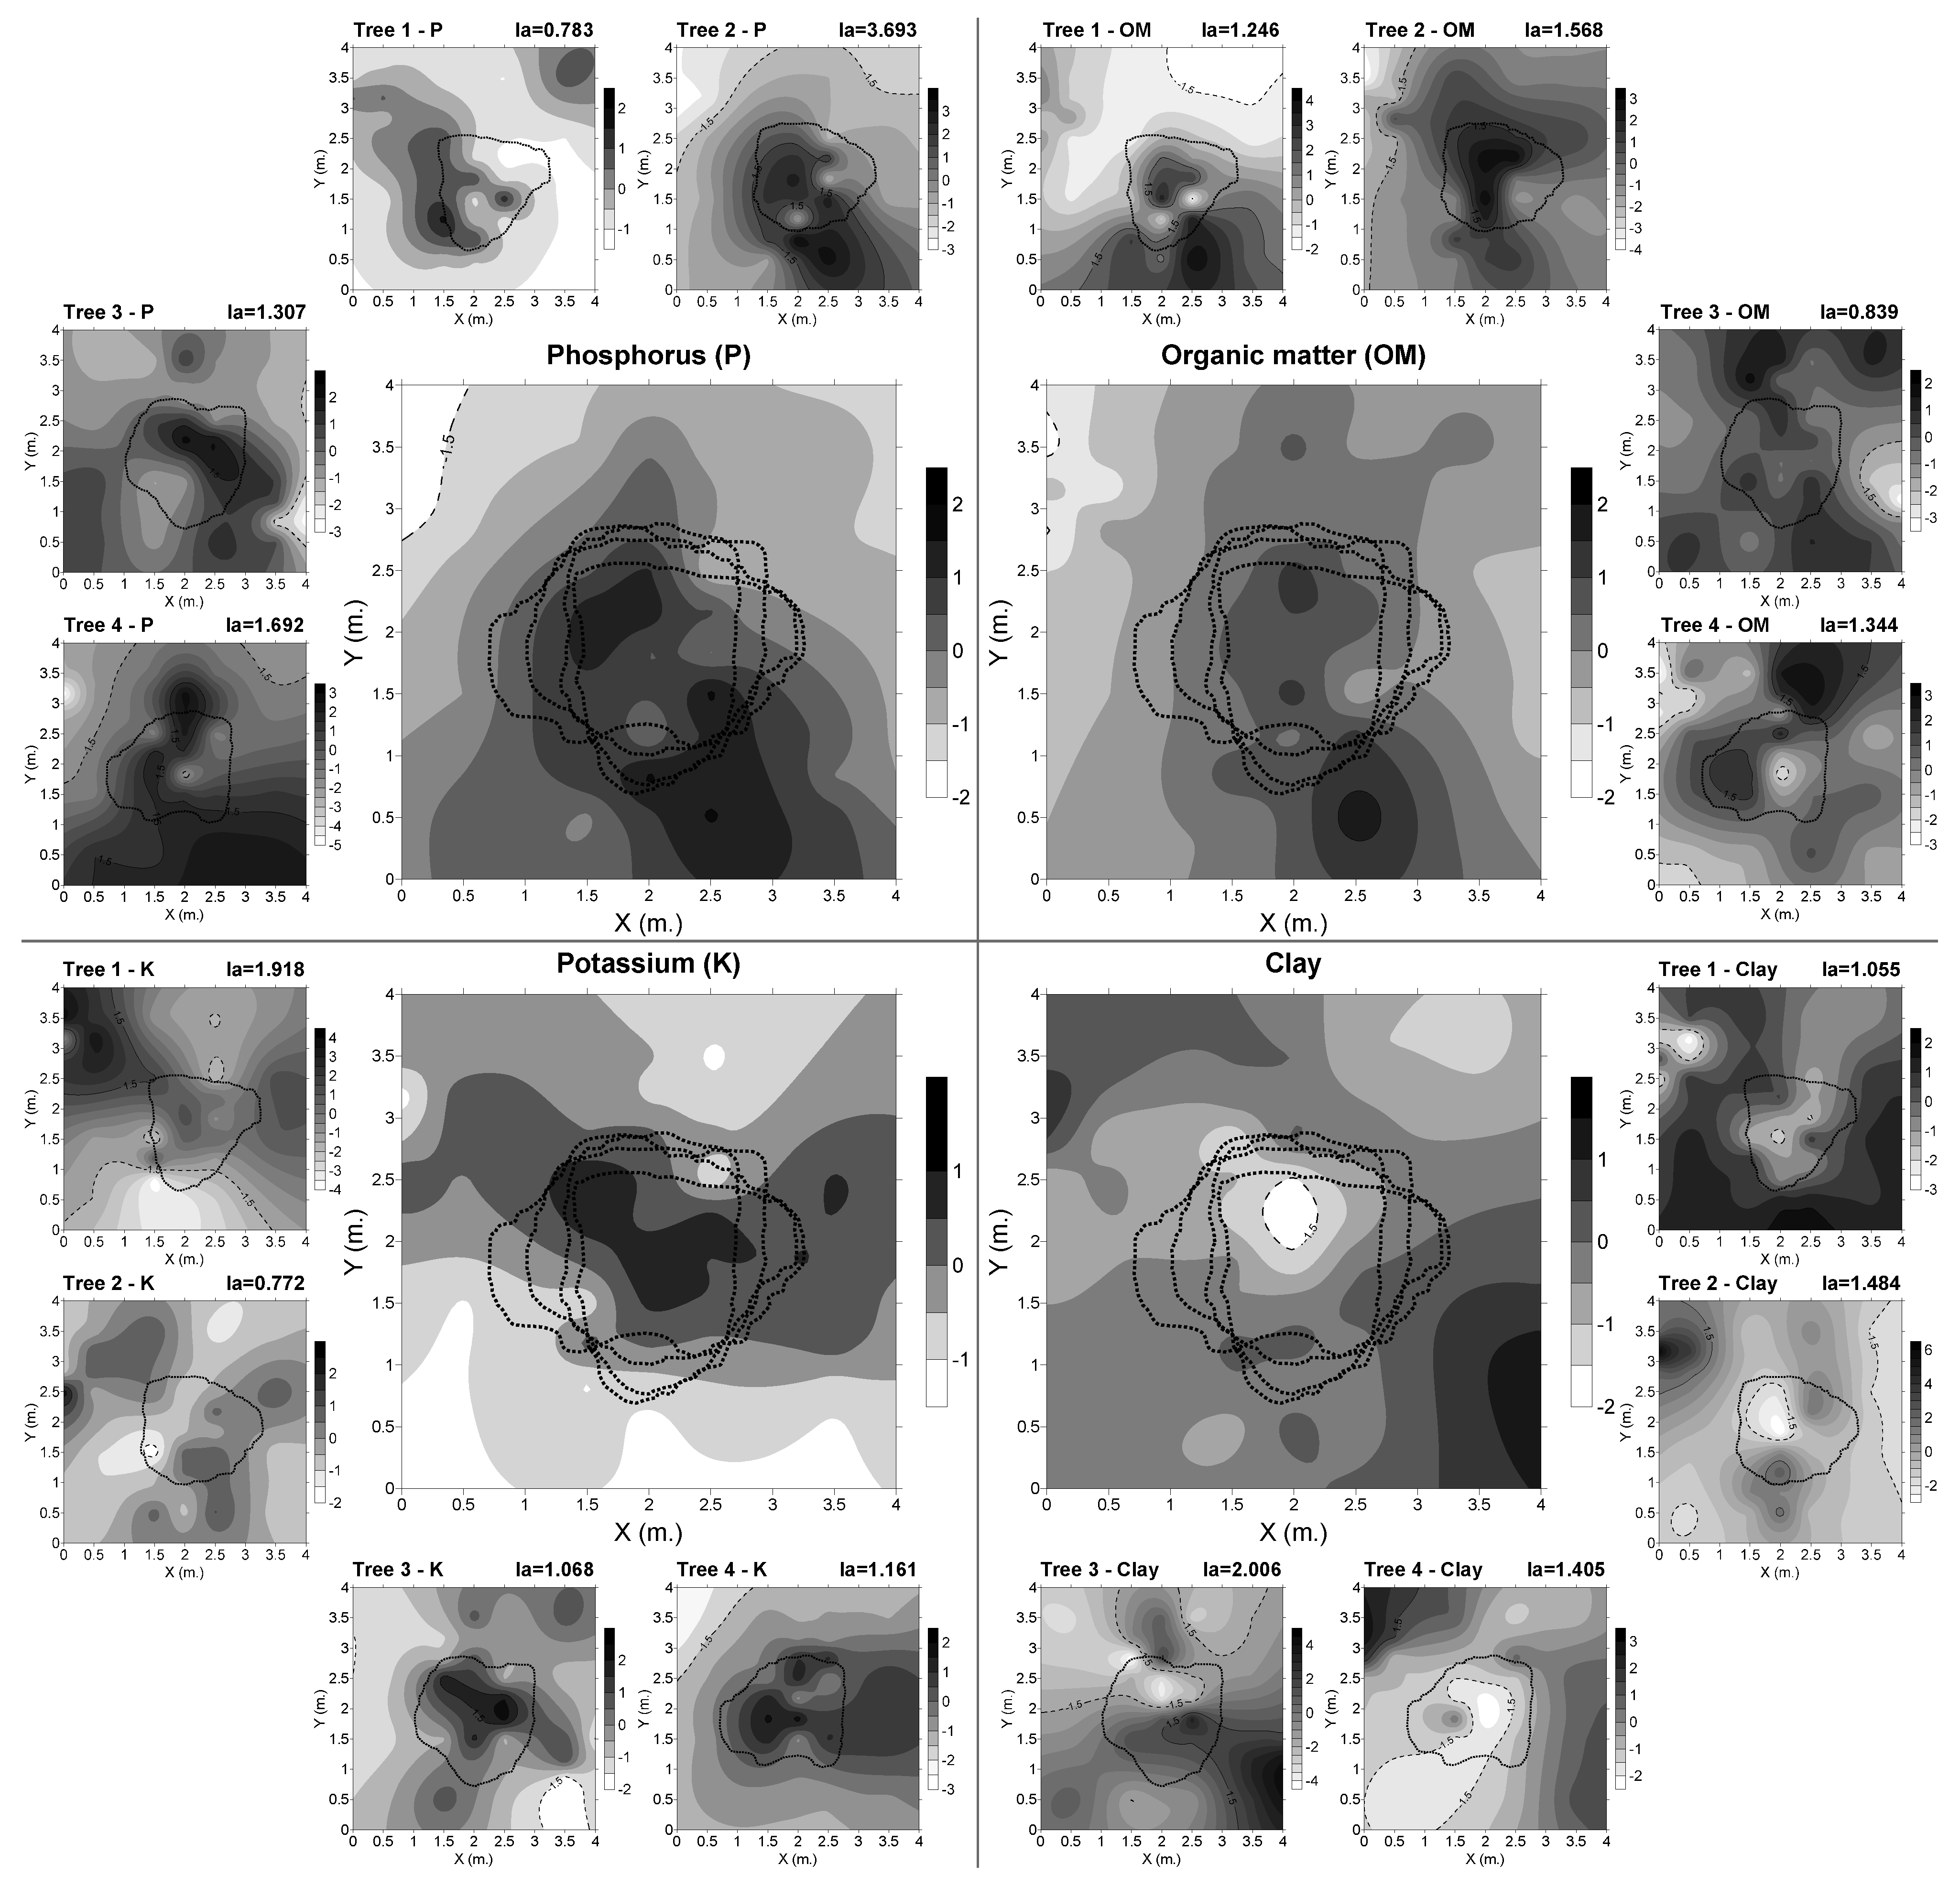
3.2. Spatial Distribution of Edaphic Variables

Significant differences were found between the overall positions for all variables, except for N, C/N, silt and moisture (Table 2). Clay, P and K were also significantly different between IC and OC (Hclay = 6.3, Pclay < 0.05; HP = 4.6, PP < 0.05; and HK = 4.2, PK < 0.0167), but regarding the concentrated grids (I, T and O positions) only OM, Clay and P presented differences. OM, clay and phosphorus were higher at points of the I grid in a significant extent to O grid (FI-O (OM) = 5.5, PI-O (OM) < 0.0167; UI-O (clay) = 318.0, PI-O (clay) < 0.0167; UI-O (P) = 327.0, PI-O (P) < 0.0167).
The Kruskal-Wallis test showed significant differences for clay, P and K relative to the IC and OC grids (Hclay = 6.304, Pclay < 0.05; HP = 4.564, PP < 0.05; HK = 4.232, PK < 0.05). Similarly, to the cfu results (Table 1), P and K had significantly higher concentrations under the crown cover, while clay had significantly lower percentages (Table 2). Regarding orientation, OM (FOM = 6.049, P < 0.05), pH (FpH = 5.543, P < 0.05), Ca (FCa = 14.792, P < 0.05) and K (HK = 2746, P < 0.01) presented significant differences between North and South sides, with higher values in North side, except in the case of OM.
Moreover, the analysis of the Spearman’s bivariate correlations showed a significant and positive relationship between cfu and sand (ρ = 0.242, P < 0.01), pH (ρ = 0.319, P < 0.001), Ca (ρ = 0.374, P < 0.001) and K (ρ = 0.352, P < 0.001), and a significant and negative one with clay (ρ = −0.398, P < 0.001).

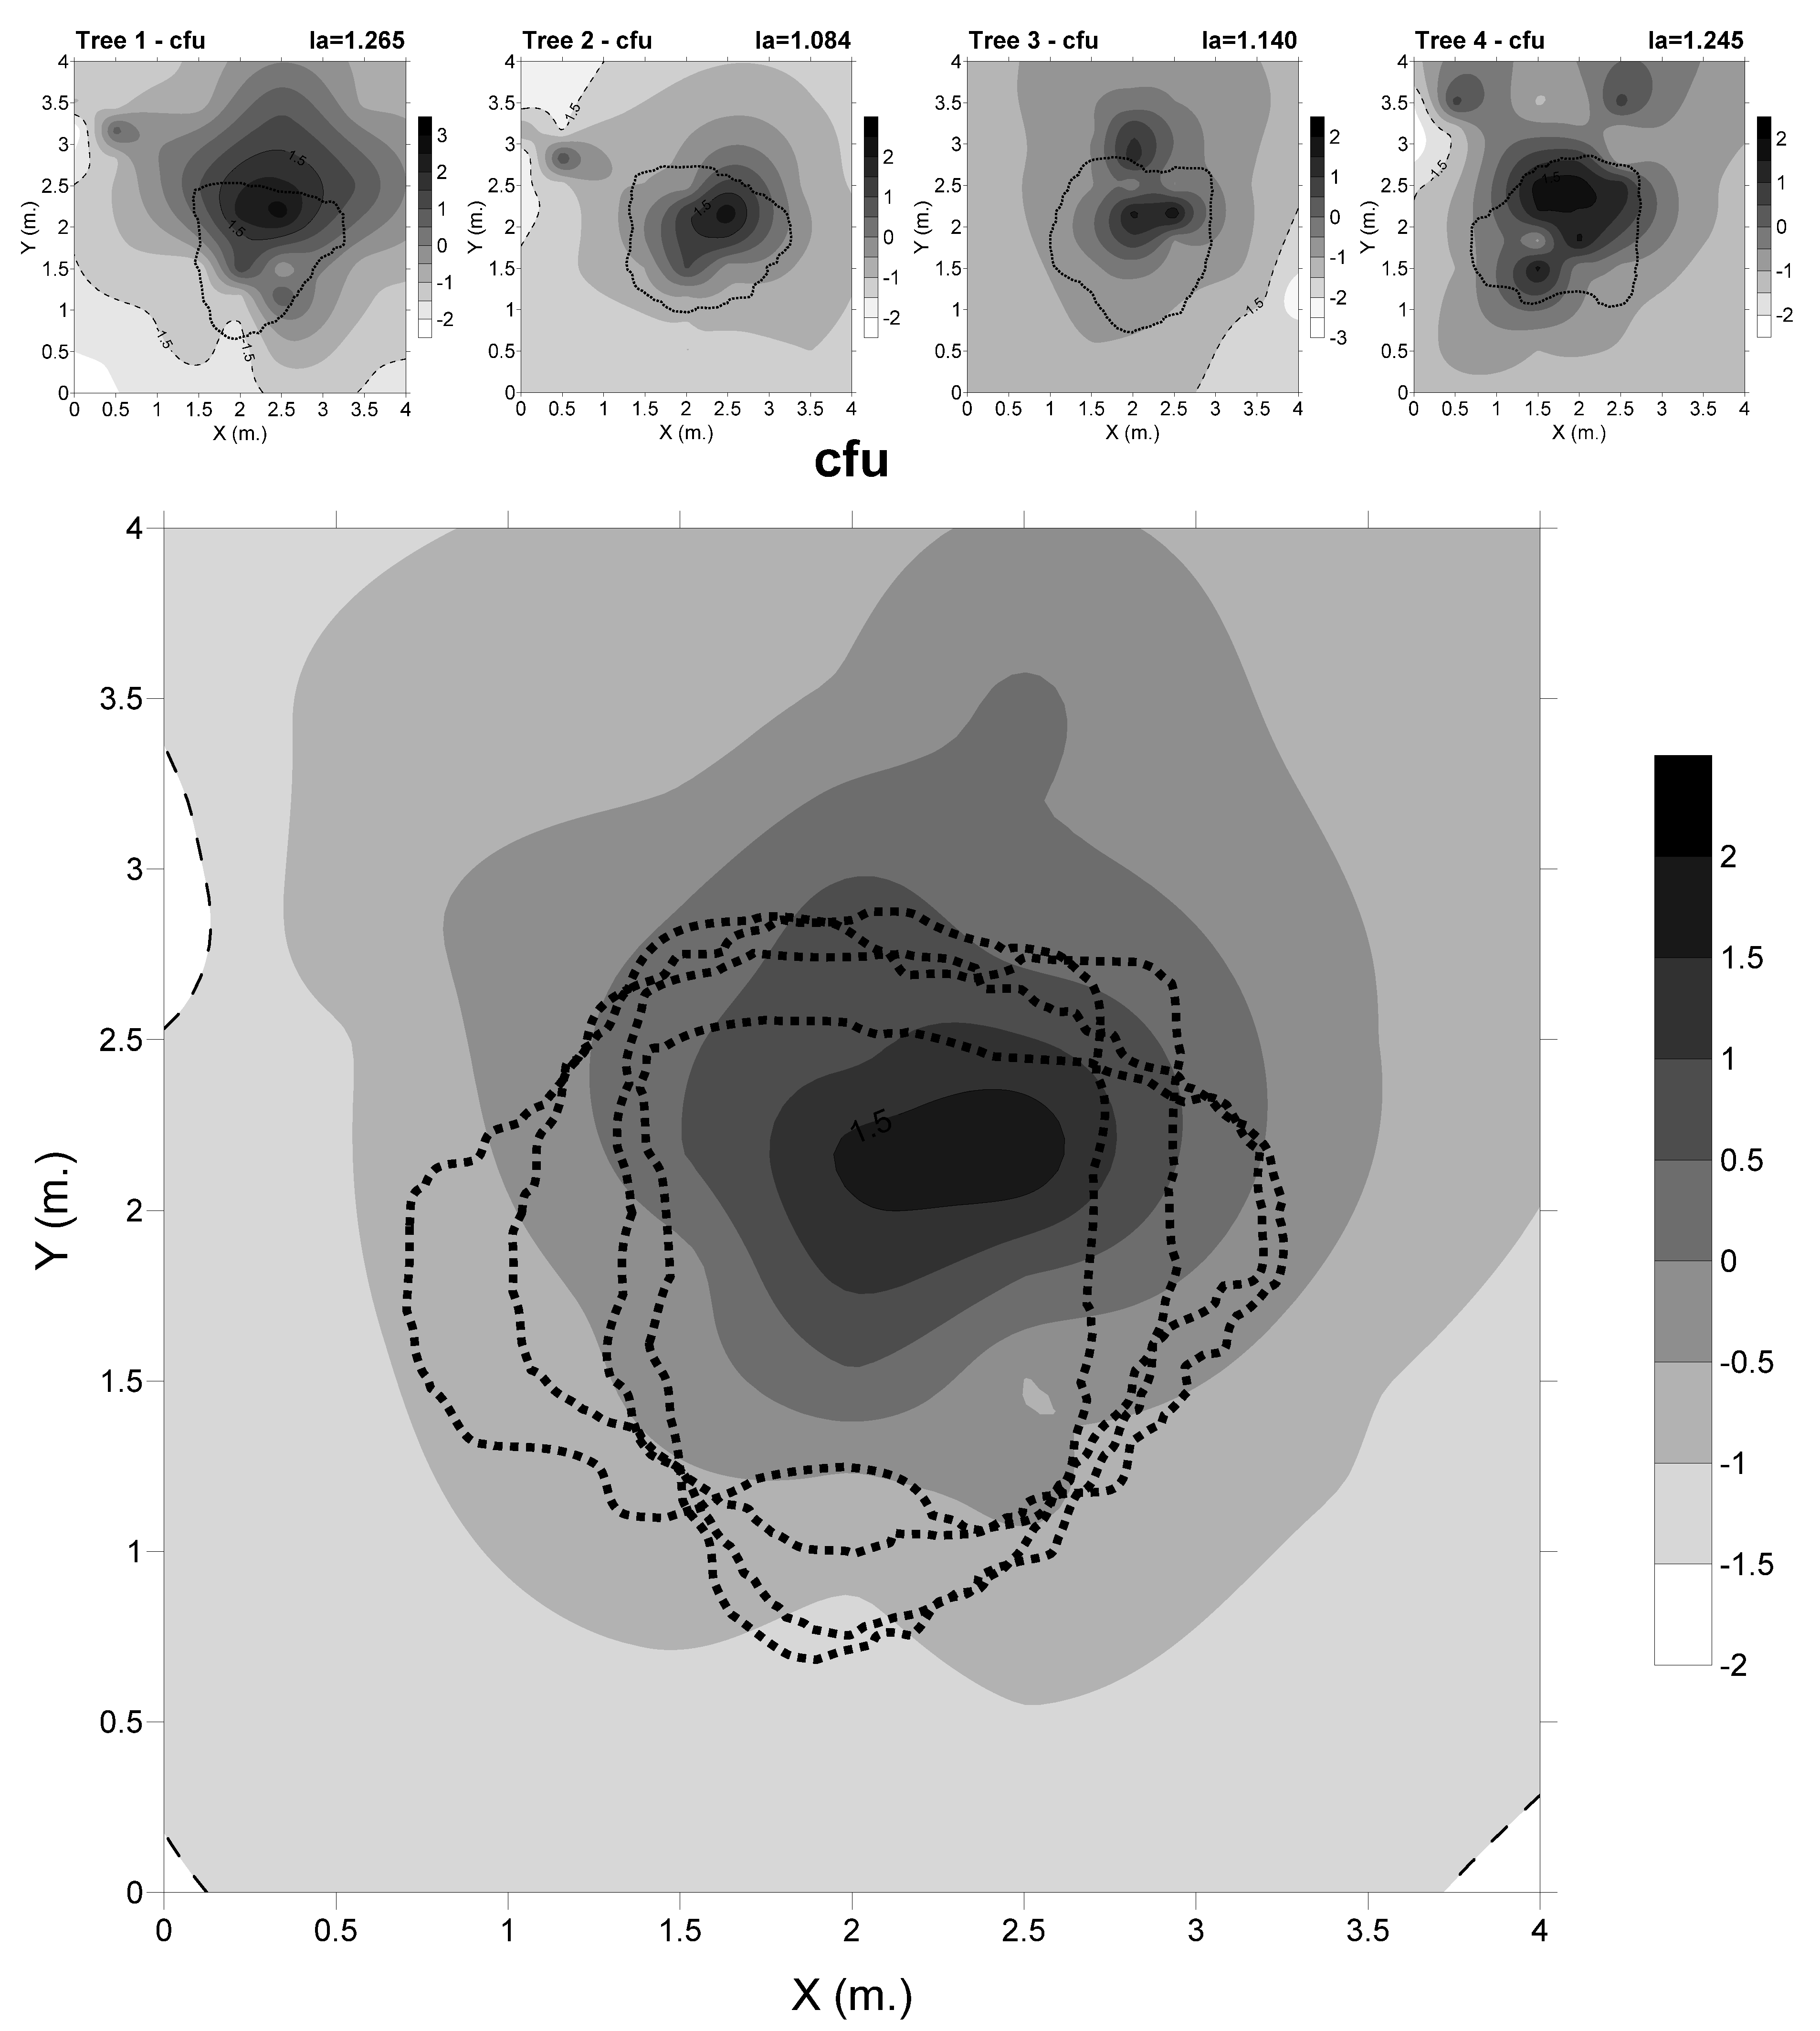
3.3. Spatial Analysis and Location of Edaphic Variables and Relationship with Cfu

All variables showed spatial aggregation (Ia > 1) in at least one tree (Figure 2). The aggregation was significant (P < 0.05) for clay in trees 2, 3 and 4; OM, P and silt in trees 2 and 4; Ca in trees 3 and 4; the soil moisture for trees 2 and 3; and K and sand only in trees 1 and 4, respectively. In all other options, the variables tend to be random (Ia ≈ 1, P > 0.05, Figure 2). Overall, nine of the twelve variables analysed with SADIE presented significant spatial aggregation patterns and up to six did so for trees 2 and 4, with the latter the most defoliated.
The clustering indices (ν) showed the presence of patches (νi ≥ 1.5) and/or gaps (νj ≤ −1.5) for all variables with Ia > 1 (Figure 2; Supplementary Material, Figure S1). Clay showed significant patches (P < 0.05) for trees 2 and 3 and gaps also for tree 3 under the crown cover, tending to cluster in tree 4. Organic matter showed clustering patches for trees 1, 2 and 4, as well as gaps for tree 2. Phosphorus and silt showed significant patches and gaps for trees 2 and 4, and Ca for trees 3 and 4, tending also to gaps in these trees. Soil moisture showed significant patches for trees 2 and 3 as well as gaps for tree 2, and K showed significant patches and gaps only for tree 1.
The remaining edaphic variables (N, C/N, sand, pH, Ca, K and moisture) did not show any significant aggregation patterns (Ia ≈ 1) or significant clustering of patches and gaps, for all trees.
On the other hand, cfu showed a local aggregated distribution pattern (Ia > 1) that was not strong enough to contribute significantly (P > 0.05) to the overall aggregation of the influence of the crown area (Figure 2), but these clustering patches (ν > 1.5) were found under the crown cover of all trees as well as in the immediate transition zone (Figure 3).
The variables that presented the most aggregated mean pattern were P, OM, K and clay (Figure 4). Phosphorous and OM tended to accumulate under crown cover as well as in the transition zone, with this tendency being obvious in trees 2-4, and to a lesser extent in tree 1. Potassium showed a tendency to be clustered under crown cover, being more evident in trees 3 and 4, which had higher levels of defoliation (35 and 70%, respectively).
Clay showed a dominance of gaps under the crown cover, which is clearer in trees 2 and 4, with patches and gaps in tree 2 (νi = 1.884) and 3 (νi = 2.187; νj = −2.045) and smaller gaps with a tendency to randomness in tree 1. Potassium showed, under the crown, a dominance of spots in trees 3 and 4 and a tendency to be in gaps in tree 1 (νj = −1.698) and 2. For P there was, under the crown, a dominance of spots in trees 2 (νi = 2.098), 3 and 4 (νi = 1.592), and a tendency to randomness in tree 1. Organic matter showed a dominance of patches under the crown in tree 1 (νi = 1.721) and 2 (νi = 1.669), small patches and gaps in tree 4 (νi = 1.532) and a tendency to randomness in tree 3.
The remaining edaphic variables (N, C/N, silt, sand, pH, Ca, and moisture) showed randomness in spatial distribution of patches and gaps for the most trees (Supplementary Material, Figure S1).

3.4. Generalized Linear Mixed Model for Cfu

Eight out the 11 edaphic variables (OM, C/N, clay, silt, P, Ca, K and moisture) were selected to test different mixed models using the tree and the position under the crown (IC/OC) as random effects. Finally, the generalised mixed model that fitted best to the cfu distribution was the one constructed by the variables silt, P, K and moisture as fixed effects, considering both tree and position as random effects, which presented model variances of 1.205 and 1.229, respectively (dimensionless). The likelihood ratio test showed also the significant influence of both random effects in the overall model (Table 3).
Although the deletion of silt only produced marginal differences in the resulting model (Table 3), this parameter was finally included in the output model because of the lower AIC compared with the model constructed without this variable. Moreover, when the four selected variables, including silt were considered as fixed effects, they contributed significantly (P < 0.05) to the model (Table 4).
No significant correlation was found between the fixed effects, and the residuals showed a normal distribution (D = 0.122, P = 0.099), showing therefore the absence of autocorrelation between fixed factors. The final model showed also a strong Intraclass Correlation Coefficient (Adjusted ICC = 0.975) indicating that clustering by position under the crown accounted for a high proportion of the total variability, and data within each cluster were well correlated.

4. Discussion

This work shows the existence of small-scale spatial patterns in the distribution of cfu of P. cinnamomi under holm oak trees, related to texture, P, pH, Ca, K and moisture distribution in soil. Our results are consistent with those obtained in other studies, where the canopy cover of woody plants has been shown to have an important effect on soil properties [20,23,42,43] and these, in turn, on soil microorganisms [22,25]; in this case, on the frequency of P. cinnamomi [3]. Additionally, our results show a significant linear relationship between the values of the cfu and the edaphic variables (texture, P, pH, Ca, K and moisture), which correlate with the presence in soil of these oomycetes [44].
Although crown defoliation is usually the main factor assessed when studying holm oak health status in relation to root rot [45,46], this factor was not considered in our work. This analysis would have required different experimental design, considering a plot with a wider range of crown defoliation and health status, a healthy plot with similar soil conditions as a control, and more biological repetitions for each defoliation level. Such increase in the number of repetitions would have been a big challenge regarding the sampling intensity established under each tree in our study. In this work the plot was chosen by its homogeneous conditions in order to determine if soil microsite changes driven by crown cover influence were related with cfu distribution. Thus, we assumed that our chosen plots had similar disease conditions. Moreover, SADIE or spatial analysis use in few plots can be assessed because of an implicitly high sample size [47]. Notwithstanding, and despite the relevance of our findings, it is important to indicate that the low number of trees used in our study would limit the transferability of the results.

4.1. The Abundance of Cfu and Soil Parameters are Influenced by the Canopy Cover

The soil samples were collected in spring (April) 2010, in an area severely affected by root rot in Andalusia [48], and showed cfu values similar or slightly superior to those obtained in comparable work in the Iberian Peninsula, with inoculum concentrations ranging between 3 and 130 cfu g−1 [1,49,50]. In this sense, the observed defoliation level in the absence of other biotic agents (pests and diseases) is considered to be caused mainly by the root pathogen P. cinnamomi [27,44].
The sampled trees were located in a 15 year-old plantation at low density (≈ 312 trees ha−1) with scattered shrub cover (Cistus ladanifer L.). The low presence of herbaceous and shrub species allows the existence of a homogeneous root system with abundant fine roots, which in the case of the holm oak rhizosphere, is allocated mainly in the area under the canopy cover [19]. In previous studies, it has been found a significant relationship between soil biological components and the rhizosphere under the crown [25,26].
Moreover, there was a tendency for the highest concentration of cfu to group under the crown on the northern side, independently of the different slopes present in the studied trees. This aggregation of cfu might be related with the microclimate that the tree crown’s shade generates on the ground, driven by differences in nutrients and organic matter. Other authors have reported similar aggregation patterns in soils under holm and cork oaks [20,23,42]. Furthermore, the greater presence of fine roots under the crown cover [51,52] agrees with the fine root distribution observed in several Mediterranean oak species [53], and should be considered another relevant driver influencing this cfu distribution pattern. Woody plant cover influences the edaphic properties, as well as the related plant and faunal communities [20,23,54], establishing an important and direct relationship between the fertility and presence of soilborne pathogens and thus influencing the health status of the tree [25,55]. Moreover, other soil characteristics such as texture, porosity, fertility, organic matter, cultivation methods and the presence of host plants are other factors involved in the presence of resistant structures in the soil [56]. In our work, some outliers detected in the cfu values outside the crown were closely related to the presence of clusters of Cistus ladanifer (data not shown). Those data were not eliminated from the analysis because it might be considered that the effects of the presence of the shrub clusters on the studied variables should be similar to the effect of the presence of the trees [57].
The spatial analysis showed that 9 out of the 12 variables analysed with SADIE presented spatial aggregation (Ia > 1, P < 0.05) in some of the studied trees, and 11 out of the 12 variables did so for the most defoliated tree (#4), but only 6 with significant probability. Results on the spatial distribution of nutrients in the current study agreed with those observed by Gallardo [20] and Andivia et al. [23], where all variables showed spatial heterogeneity. Nitrogen and OM tended to be clumped under the crown cover for all trees, except tree 4 in the case of N. The N cycle is closely related to the processes of organic matter in soils, although it seems to be little influenced by the presence of roots and mycorrhizae [19]. The soil content of P is also linked to soil biological and chemical processes, and forms clusters under the crown cover in three (trees 1, 2 and 4) of the four trees studied. Roots and mycorrhizae play an important role in the mineralisation of the P in organic matter through the activity of phosphatases [58]; thus, the probable extension of roots beyond the crown cover could explain P distribution within and around the crown [59,60]. In this sense, soil N and P concentrations depend on the rate of mineralisation and their uptake by roots and microorganisms [20,61], and on the interactions with soil mineral components in the case of P [61,62]. Potassium should show less spatial dependence on the tree crown than the rest of the essential elements as it is not linked to the organic soil components; however, it showed aggregation of clusters in trees 3 and 4. These contrasting results among trees may be related with other processes such as the cortical runoff of K leaching from leaves and other aboveground plant organs [20,61,63].

4.2. Concentrarion of Cfu was Influenced by the Spatial Distribution of Edaphic Variables

The significant correlations between the concentration of cfu and the edaphic variables, clay, P, OM and K, were related to differences in general values and/or significant aggregation patterns with respect to crown cover. These results provide evidence of the influence of crown cover on soil conditions and cfu. The lifecycle of P. cinnamomi and other oomycetes is driven by soil conditions, persists in the soil as resistance structures when the conditions are unfavourable, and proliferates through zoospores when soil temperature and moisture are adequate [55]. Therefore, the influence of crown cover on soil conditions might have an indirect influence on the number of cfu.
For all trees, the concentration of clay was lower under the crown cover. Locations under the tree cover showed higher cfu levels accompanied with lower clay and higher sand percentages. Other studies have reported loam medium texture under crown cover and clay-loam medium texture outside [64]. Although the differences in soil texture were significant for the crown cover, the effect of those differences on cfu concentration would be lower than the effect of the presence of fine roots, which are supposed to be concentrated under the crown. The root rot of Q. ilex affects mostly the fine roots, the most serious effects being on roots growing in relatively dry soils, eventually undergo short flooding due to extreme precipitation events [9,31,64]. Therefore, it might be considered that the presence of fine roots and soil moisture are more influential environmental drivers for the presence of microorganisms compared with changes in soil texture.
In our study pH and Ca showed a positive correlation with cfu. High concentrations of Ca and high pH values in the soil are related on the literature with the inhibition of the pathogen growth and the accumulation of survival structures of oomycetes [28,31,65]. However, the overall values we found for pH and Ca did not differ regarding crown position and presented small variations among all the samples. All the soil samples analysed were acidic (5.1 < pH < 5.5) and the Ca2+ values ranged from 0.56 to 0.78 meq 100 g−1 (from 0.28 to 0.4 mMol Ca each 100 g of soil) (Table 2). The pH was very close to the interval established as the optimum for the development and infection of several soilborne pathogen oomycetes in laboratory tests, including P. cinnamomi (optimum pH between 5.5 and 6.0) [66], and the concentration of Ca was 100 fold lower than the necessary to inhibit the mycelium growth of P. cinnamomi on in vitro tests [28]. Therefore, Ca and pH should not be considered in our case as factors influencing the distribution of cfu, since the range of Ca and pH values could not produce differences in the behaviour of the pathogen.
The cfu values were predicted to a significant extent by the GLMM using silt and moisture as variables, together with P and K, demonstrating that there is an influence of soil conditions on cfu abundance apart from tree crown influence. The output model might be considered site-specific because it is dependent on a set of microsite characteristics. However, the results suggest that there exists a significant influence of the soil variables contributing to the suitability of the microsite environment for P. cinnamomi.
The levels of P and K were significantly different due to crown position, presenting higher values under the tree crown. However, when the influence of crown position was taken out of the analysis, considering it as a random effect in the mixed model, both P and K concentration explained to a significant extent the cfu values. Both P and K were present in higher concentrations under the crown, following the same trend as cfu. Other studies showed that N, P, K, OM and the biomass of microorganisms tend to concentrate under the crown [21,67]. It could be considered that the influence of these soil parameters on the number of cfu is related to the suitability of the microenvironment for oomycetes to complete their lifecycle. Some oomycetes species, including several pathogenic Phytophthora spp., have the ability to either survive or complete their lifecycle as saprobes [19,68,69], despite their poor ability to compete with other saprophytic organisms [70]. Therefore, higher levels of organic matter and nutrients might lead to an increase of oomycete resistance structures under a saprophytic environment.
The cfu distribution seems to be favoured mainly by the grouping of silt patches. Silt is considered to equilibrate the clay-sand trend of the soil. Texture and porosity are directly influenced by the silt percentage in intermediate textured soils. In our study, the crown cover did not significantly influence soil moisture or aggregation patterns. However, the mixed model showed that crown cover clearly influenced the cfu abundance. The same occurred with silt, when it was considered as fixed effect in the model. Soils with higher silt percentage retain more water [64,71], and with higher water content oomycetes are more readily able to produce sporangia and release zoospores [72,73]. In contrast, as these soils become drier, oomycetes produce resistant survival structures.

5. Conclusions

The distribution of P. cinnamomi cfu in soils associated with Q. ilex was not random in the soil but showed distribution patterns predictable to some degree, influenced by the crown cover, orientation and the levels of soil moisture and fertility. Our results could be useful to increase the sampling efficiency of the field surveys. Soil sampling searching for P. cinnamomi in holm oak dehesas would be oriented to those areas most likely to contain the pathogen identified in our work, allowing a greater number of trees to be sampled. This work also highlights the dynamics of soil properties in the presence of tree cover. Clear differences and aggregated spatial patterns in key soil elements were where shown to be influenced by canopy cover. The cfu tend to concentrate in the North side, probably influenced by the shadow of the crown cover, and in zones with more organic matter, nutrients and well-textured soils. In our case, the influence of the texture was driven mainly by silt concentration due to the low variation of clay and sand in the studied area.
Due to the homogeneity of environmental conditions in the selected plot, the output GLMM must be considered site-specific, but we demonstrate that it is a useful tool to study the influence of soil parameters in the distribution of microbial community due to the elimination of random effects, mainly the influence of canopy cover. The spatial analysis of the biotic and abiotic factors involved in oak root rot processes can be an effective management tool predicting favourable areas regarding spatial heterogeneity, quantification and distribution for those parameters that limit the development of P. cinnamomi, thus favouring oak establishment and survival in afforestation practices. However, further research is needed to assess the abundance of Phytophthora spp. and other oomycetes in soils with more heterogeneous conditions, in order to clarify whether generalized models can be used to predict cfu amounts, particularly in Mediterranean dehesa and montados ecosystems and in oak afforestation.

Supplementary Materials

The following are available online at https://www.mdpi.com/1999-4907/11/4/375/s1, Figure S1: Maps of clustering indices (ν) of the edaphic variables. By columns: N (nitrogen), C/N (carbon/nitrogen ratio), silt, sand, pH, Ca (calcium) and moisture. By rows, trees 1 to 4 (projected to 4 × 4 m surface). Darker areas show clustering spots of edaphic variables (ν > 1.5) are delimited by a continuous line, and the light areas show edaphic variables clustering gaps (ν < −1.5) are delimited by a discontinuous line. The dotted line represents the crown cover of each tree. In the upper right corner of each sampling unit, the general aggregation pattern (Ia) is indicated. Legend has no units. Table S1: Visual symptomatology and morphological parameters of the four trees selected for this study. Table S2: Soil Physicochemical parameters and analytical technique used.

Author Contributions

R.S.-C. and R.M.N.-C. designed the study. R.S.-C. and F.J.R.-G. performed the laboratory analysis. R.S.-C., R.M.N.-C. and J.L.Q. conducted the statistical analysis. R.M.N.-C. and J.L.Q. obtained the funds for the research. R.S.-C., R.M.N.-C., F.J.R.-G., and J.L.Q. participated in the writing and editing of the manuscript. R.S.-C. and R.M.N.-C. contributed equally in this work. All authors have read and agreed to the published version of the manuscript.

Funding

This study was conducted with support from the project ESPECTRAMED (CGL2017-86161-R), funded by the Spanish Ministry of Economy, Industry and Competitivity.

Acknowledgments

This project was funded through the ESPECTRAMED (CGL2017-86161-R) project. Thanks, are given to the University of Cordoba and Spanish Ministry of Economy and Competitiveness for financial support. We also acknowledge the institutional support of the University of Cordoba-Campus de Excelencia CEIA3, the “Agencia de Medio Ambiente y Agua” (“Consejería de Medioambiente y Ordenación del Territorio”-Junta de Andalucía) for their help, and especially to Campo Baldio S.L. for providing access to the field plot and for data support. We also thank Joaquín Duque Lazo for his valuable assistance during statistical analysis.

Conflicts of Interest

The authors declare no conflicts of interest.

References

  1. Jiménez, J.J.; Serrano, M.S.; Vicente, M.; Fernández, P.; Trapero Casas, A.; Sánchez Hernández, E. Nuevas especies de Pythium que causan podredumbre radical de Quercus en España y Portugal. Bol. Sanid. Veg. Plagas 2008, 34, 549–562. [Google Scholar]
  2. Camilo-Alves, C.d.S.e.P.; Clara, M.I.E.d.; Ribeiro, N.M.C.d.A. Decline of Mediterranean oak trees and its association with Phytophthora cinnamomi: A review. Eur. J. For. Res. 2013, 132, 411–432. [Google Scholar] [CrossRef]
  3. Ruiz-Gómez, F.J.; Navarro Cerrillo, R.M.; Lara Gómez, M.A.; Sánchez-Cuesta, R. Aislamiento e identificación de oomicetos en focos de podredumbre radical de Andalucía y Extremadura. Cuad. Soc. Esp. Cienc. For. 2016, 43, 363–376. [Google Scholar] [CrossRef]
  4. González-Alonso, C. Analysis of the Oak Decline in Spain-La Seca. Bachelor’s Thesis, Forest Management, Swedish University of Agricultural Sciences, Uppsala, Sweden, 2008. [Google Scholar]
  5. Vettraino, A.M.; Barzanti, G.P.; Bianco, M.C.; Ragazzi, A.; Capretti, P.; Paoletti, E.; Luisi, N.; Anselmi, N.; Vannini, A. Occurrence of Phytophthora species in oak stands in Italy and their association with declining oak trees. For. Pathol. 2002, 32, 19–28. [Google Scholar] [CrossRef]
  6. Pérez-Sierra, A.; López-García, C.; León, M.; García-Jiménez, J.; Abad-Campos, P.; Jung, T. Previously unrecorded low-temperature Phytophthora species associated with Quercus decline in a Mediterranean forest in eastern Spain. For. Pathol. 2013, 43, 331–339. [Google Scholar] [CrossRef]
  7. Navarro Cerrillo, R.M.; Fernández Rebollo, P.; Trapero, A.; Caetano, P.; Romero, M.A.; Sánchez, M.E.; Fernández Cancio, A.; Sánchez, I.; López Pantoja, G. Los Procesos de Decaimiento de Encinas y Alcornoques; Dirección General de Gestión del Medio Natural. Consejería de Medio Ambiente; Junta de Andalucía: Sevilla, Spain, 2004; ISBN 84-95785-89-7. [Google Scholar]
  8. Trapero, A.; Sánchez, M.E.; Pérez de Algaba, A.; Romero, M.A.; Navarro, N.; Varo, R.; Gutiérrez, J. Enfermedades de especies forestales en Andalucía. Agricultura 2000, 821, 822–824. [Google Scholar]
  9. Oßwald, W.; Fleischmann, F.; Rigling, D.; Coelho, A.C.; Cravador, A.; Diez, J.; Dalio, R.J.; Horta Jung, M.; Pfanz, H.; Robin, C.; et al. Strategies of attack and defence in woody plant—Phytophthora interactions. For. Pathol. 2014, 44, 169–190. [Google Scholar] [CrossRef]
  10. Ruiz Gómez, F.; Pérez-de-Luque, A.; Sánchez-Cuesta, R.; Quero, J.; Navarro Cerrillo, R. Differences in the response to acute drought and Phytophthora cinnamomi Rands Infection in Quercus ilex L. seedlings. Forests 2018, 9, 634. [Google Scholar] [CrossRef] [Green Version]
  11. Jung, T.; Orlikowski, L.; Henricot, B.; Abad-Campos, P.; Aday, A.G.; Aguín Casal, O.; Bakonyi, J.; Cacciola, S.O.; Cech, T.; Chavarriaga, D.; et al. Widespread Phytophthora infestations in European nurseries put forest, semi-natural and horticultural ecosystems at high risk of Phytophthora diseases. For. Pathol. 2016, 46, 134–163. [Google Scholar] [CrossRef] [Green Version]
  12. Marais, L.J.; Menge, J.A.; Bender, G.S.; Faber, B. Phytophthora Root Rot; AvoResearch California Avocado Commission Publishing: Irvine, CA, USA, 2002; Volume 2, pp. 3–6. [Google Scholar]
  13. Zamora Rojas, E.; Andicoberry de los reyes, S.; Sánchez Clemente, M.E. Anexo A.1. IV. El decaimiento y la podredumbre radical en las dehesas andaluzas. In Ecosistemas de Dehesa: Desarrollo de Políticas y Herramientas Para la Gestión y Conservación de la Biodiversidad (Life Biodehesa Project); Consejería de Medio Ambiente y Ordenación del Territorio: Sevilla, Spain, 2014. [Google Scholar]
  14. Hüberli, D.; Tommerup, I.C.; Hardy, G.E.S.J. False-negative isolations or absence of lesions may cause mis-diagnosis of diseased plants infected with Phytophthora cinnamomi. Australas. Plant Pathol. 2000, 29, 164–169. [Google Scholar] [CrossRef] [Green Version]
  15. Ashton, M.S.; Larson, B.C. Germination and seedling growth of Quercus (section Erythrobalanus) across openings in a mixed-deciduous forest of southern New England, USA. For. Ecol. Manag. 1996, 80, 81–94. [Google Scholar] [CrossRef]
  16. Mauer, O.; Houškova, K.; Mikita, T. The root system of pedunculate oak (Quercus robur L.) at the margins of regenerated stands. J. For. Sci. 2017, 63, 22–33. [Google Scholar]
  17. Aponte, C.; Matías, L.; González-Rodríguez, V.; Castro, J.; García, L.V.; Villar, R.; Marañón, T. Soil nutrients and microbial biomass in three contrasting Mediterranean forests. Plant Soil 2014, 380, 57–72. [Google Scholar] [CrossRef]
  18. Carranca, C.; Castro, I.V.; Figueiredo, N.; Redondo, R.; Rodrigues, A.R.F.; Saraiva, I.; Maricato, R.; Madeira, M.A.V. Influence of tree canopy on N2 fixation by pasture legumes and soil rhizobial abundance in Mediterranean oak woodlands. Sci. Total Environ. 2015, 506–507, 86–94. [Google Scholar] [CrossRef] [Green Version]
  19. Ruiz Gómez, F.J.R.; Navarro-Cerrillo, R.M.; Pérez-de-Luque, A.; Oβwald, W.; Vannini, A.; Morales-Rodríguez, C. Assessment of functional and structural changes of soil fungal and oomycete communities in holm oak declined dehesas through metabarcoding analysis. Sci. Rep. 2019, 9, 5315. [Google Scholar] [CrossRef] [Green Version]
  20. Gallardo, A. Effect of tree canopy on the spatial distribution of soil nutrients in a Mediterranean Dehesa. Pedobiologia 2003, 47, 117–125. [Google Scholar] [CrossRef]
  21. Cubera, E.; Moreno, G. Effect of land-use on soil water dynamic in dehesas of Central–Western Spain. Catena 2007, 71, 298–308. [Google Scholar] [CrossRef]
  22. Quero, J.L.; Maestre, F.T.; Ochoa, V.; García-Gómez, M.; Delgado-Baquerizo, M. On the importance of shrub encroachment by sprouters, climate, species richness and anthropic factors for ecosystem multifunctionality in semi-arid Mediterranean ecosystems. Ecosystems 2013, 16, 1248–1261. [Google Scholar] [CrossRef] [Green Version]
  23. Andivia, E.; Fernández, M.; Alejano, R.; Vázquez-Piqué, J. Tree patch distribution drives spatial heterogeneity of soil traits in cork oak woodlands. Ann. For. Sci. 2015, 72, 549–559. [Google Scholar] [CrossRef] [Green Version]
  24. Cappai, C.; Kemanian, A.R.; Lagomarsino, A.; Roggero, P.P.; Lai, R.; Agnelli, A.E.; Seddaiu, G. Small-scale spatial variation of soil organic matter pools generated by cork oak trees in Mediterranean agro-silvo-pastoral systems. Geoderma 2017, 304, 59–67. [Google Scholar] [CrossRef]
  25. Gómez-Aparicio, L.; Ibáñez, B.; Serrano, M.S.; De Vita, P.; Ávila, J.M.; Pérez-Ramos, I.M.; García, L.V.; Sánchez, M.E.; Marañón, T. Spatial patterns of soil pathogens in declining Mediterranean forests: Implications for tree species regeneration. New Phytol. 2012, 194, 1014–1024. [Google Scholar] [CrossRef] [PubMed] [Green Version]
  26. Ibáñez, B.; Gómez-Aparicio, L.; Ávila, J.M.; Pérez-Ramos, I.M.; García, L.V.; Marañón, T. Impact of tree decline on spatial patterns of seedling-mycorrhiza interactions: Implications for regeneration dynamics in Mediterranean forests. For. Ecol. Manag. 2015, 353, 1–9. [Google Scholar] [CrossRef]
  27. Romero, M.A.; Sánchez, J.E.; Jiménez, J.J.; Belbahri, L.; Trapero, A.; Lefort, F.; Sánchez, M.E. New Pythium taxa causing root rot on Mediterranean Quercus species in South-West Spain and Portugal. J. Phytopathol. 2007, 155, 289–295. [Google Scholar] [CrossRef]
  28. Serrano, M.S.; De Vita, P.; Fernández-Rebollo, P.; Sánchez-Hernández, M.E. Calcium fertilizers induce soil suppressiveness to Phytophthora cinnamomi root rot of Quercus ilex. Eur. J. Plant Pathol. 2012, 132, 271–279. [Google Scholar] [CrossRef]
  29. Vadell, E.; de-Miguel, S.; Pemán, J. Large-scale reforestation and afforestation policy in Spain: A historical review of its underlying ecological, socioeconomic and political dynamics. Land Use Policy 2016, 55, 37–48. [Google Scholar] [CrossRef]
  30. Lehtijärvi, A.; Aday Kaya, A.G.; Woodward, S.; Jung, T.; Doğmuş Lehtijärvi, H.T. Oomycota species associated with deciduous and coniferous seedlings in forest tree nurseries of Western Turkey. For. Pathol. 2017, 47, e12363. [Google Scholar] [CrossRef]
  31. Burgess, T.I.; Scott, J.K.; Mcdougall, K.L.; Stukely, M.J.C.; Crane, C.; Dunstan, W.A.; Brigg, F.; Andjic, V.; White, D.; Rudman, T.; et al. Current and projected global distribution of Phytophthora cinnamomi, one of the world’s worst plant pathogens. Glob. Chang. Biol. 2017, 23, 1661–1674. [Google Scholar] [CrossRef] [Green Version]
  32. Eichhorn, J.; Roskams, P.; Potočić, N.; Timmermann, V.; Ferretti, M.; Mues, V.; Szepesi, A.; Durrant, D.; Seletković, I.; Schroeck, H.-W.; et al. Part IV: Visual assessment of crown condition and damaging agents. In UNECE ICP Forests Programme Co-ordinating Centre. Manual on Methods and Criteria for Harmonized Sampling, Assessment, Monitoring and Analysis of the Effects of Air Pollution on Forests; Thünen Institute of Forest Ecosystems: Eberswalde, Germany, 2017; p. 54. ISBN 978-3-86576-162-0. [Google Scholar]
  33. Jeffers, S.N.; Martin, S.B. Comparison of two media selective for Phytophthora and Pythium species. Plant Dis. 1986, 70, 1038–1043. [Google Scholar] [CrossRef]
  34. Rohlf, F.J.; Sokal, R.R. Statistical Tables; W. H. Freeman: San Francisco, CA, USA, 1981. [Google Scholar]
  35. R Core Team. R: A Language and Environment for Statistical Computing; R Foundation for Statistical Computing: Vienna, Austria, 2013. [Google Scholar]
  36. Quero, J.L. La heterogeneidad en ecología: Herramientas de cuantificación y aplicaciones para la restauración. Acta Granatense 2006, 4, 107–114. [Google Scholar]
  37. Winder, L.; Alexander, C.; Griffiths, G.; Holland, J.; Woolley, C.; Perry, J. Twenty years and counting with SADIE: Spatial Analysis by Distance Indices software and review of its adoption and use. Rethink. Ecol. 2019, 4, 1–16. [Google Scholar] [CrossRef]
  38. Perry, J.N.; Dixon, P.M. A new method to measure spatial association for ecological count data. Écoscience 2002, 9, 133–141. [Google Scholar] [CrossRef]
  39. Bates, D.; Mächler, M.; Bolker, B.; Walker, S. Fitting Linear Mixed-Effects Models using lme4. arXiv 2014, arXiv:1406.5823. [Google Scholar]
  40. Bolker, B.M.; Brooks, M.E.; Clark, C.J.; Geange, S.W.; Poulsen, J.R.; Stevens, M.H.H.; White, J.S.S. Generalized linear mixed models: A practical guide for ecology and evolution. Trends Ecol. Evol. 2009, 24, 127–135. [Google Scholar] [CrossRef] [PubMed]
  41. Schielzeth, H. Simple means to improve the interpretability of regression coefficients: Interpretation of regression coefficients. Methods Ecol. Evol. 2010, 1, 103–113. [Google Scholar] [CrossRef]
  42. Gea-Izquierdo, G.; Allen-Díaz, B.; San Miguel, A.; Canellas, I. How do trees affect spatio-temporal heterogeneity of nutrient cycling in Mediterranean annual grasslands? Ann. For. Sci. 2010, 67, 112. [Google Scholar] [CrossRef] [Green Version]
  43. Simón, N.; Montes, F.; Díaz-Pinés, E.; Benavides, R.; Roig, S.; Rubio, A. Spatial distribution of the soil organic carbon pool in a Holm oak dehesa in Spain. Plant Soil 2013, 366, 537–549. [Google Scholar] [CrossRef] [Green Version]
  44. Sánchez, M.; Caetano, P.; Ferraz, J.; Trapero, A. Phytophthora disease of Quercus ilex in south-western Spain. For. Pathol. 2002, 32, 5–18. [Google Scholar] [CrossRef]
  45. González, M.; Romero, M.; Ramo, C.; Serrano, M.S.; Sánchez, M.E. Control of Phytophthora Root Rot on Mediteranean Quercus spp. Using Fosetyl-Al Trunk Injections. M; Firenze University Press: Firenze, Italy, 2017. [Google Scholar]
  46. Navarro-Cerrillo, R.M.; Varo-Martínez, M.Á.; Acosta, C.; Palacios Rodriguez, G.; Sánchez-Cuesta, R.; Ruiz Gómez, F.J. Integration of WorldView-2 and airborne laser scanning data to classify defoliation levels in Quercus ilex L. dehesas affected by root rot mortality: Management implications. For. Ecol. Manag. 2019, 451, 117564. [Google Scholar] [CrossRef]
  47. Maestre, F.T.; Quero, J.L. Análisis espacial mediante índices de distancia (SADIE). In Introducción al Análisis Espacial de Datos en Ecología y Ciencias Ambientales: Métodos y Aplicaciones; Universidad Rey Juan Carlos: Madrid, Spain, 2008; pp. 637–648. ISBN 978-84-9849-308-5. [Google Scholar]
  48. Sánchez, M.E.; Caetano, P.; Ferranz, J.; Trapero Casas, A. El decaimiento y muerte de encinas en tres dehesas de la provincia de Huelva. Bol. Sanid. Veg. Plagas 2000, 26, 447–464. [Google Scholar]
  49. Rodríguez, M.; Sánchez, M.E.; Trapero, A. Desarrollo de un método eficaz para la cuantificación de Phytophthora cinnamomi en muestras de suelo. In Proceedings of the XII Congreso de la Sociedad Española de Fitopatología, Girona, Spain, 26 September–1 October 2004. [Google Scholar]
  50. Serrano, M.S.; Leal, R.; Vita, P.D.; Fernández-Rebollo, P.; Sánchez, M.E. Control of Phytophthora cinnamomi by soil application of calcium fertilizers in a Dehesa ecosystem in Spain. Integr. Prot. Oak For. IOBC-WPRS Bull. 2014, 101, 139–143. [Google Scholar]
  51. Canadell, J.; Rodà, F. Root biomass of Quercus ilex in a montane Mediterranean forest. Can. J. For. Res. 1991, 21, 1771–1778. [Google Scholar] [CrossRef] [Green Version]
  52. Silva, J.S.; Rego, F.C. Root to shoot relationships in Mediterranean woody plants from Central Portugal. Biologia (Bratislava) 2004, 59, 109–115. [Google Scholar]
  53. Lopez, B.; Sabate, S.; Gracia, C. Fine roots dynamics in a Mediterranean forest: Effects of drought and stem density. Tree Physiol. 1998, 18, 601–606. [Google Scholar] [CrossRef] [PubMed] [Green Version]
  54. Eldridge, D.J.; Bowker, M.A.; Maestre, F.T.; Roger, E.; Reynolds, J.F.; Whitford, W.G. Impacts of shrub encroachment on ecosystem structure and functioning: Towards a global synthesis. Ecol. Lett. 2011, 14, 709–722. [Google Scholar] [CrossRef] [PubMed]
  55. Corcobado, T. Influencia de Phytophthora cinnamomi Rands en el Decaimiento de Quercus ilex L. y su Relación con las Propiedades del Suelo y las Ectomicorrizas. Ph.D. Thesis, Universidad de Extremadura, Plasencia, Spain, 2013. [Google Scholar]
  56. García Moreno, A.M.; Fernández Rebollo, P.; Ortiz Berrocal, F.; Carbonero Muñoz, M.D. Podredumbre Radical, Descripción y Control Aplicado a Los Ecosistemas de Dehesa; Instituto de Investigación y Formación Agraria y Pesquera, Consejería de Agricultura, Pesca y Desarrollo Rural, Junta de Andalucía: Córdoba, Spain, 2016. [Google Scholar]
  57. Moreira, A.C.; Martins, J.M.S. Influence of site factors on the impact of Phytophthora cinnamomi in cork oak stands in Portugal. For. Pathol. 2005, 35, 145–162. [Google Scholar] [CrossRef]
  58. Satyaprakash, M.; Nikitha, T.; Reddi, E.U.B.; Sadhana, B.; Vani, S.S. Phosphorous and phosphate solubilising bacteria and their role in plant nutrition. Int. J. Curr. Microbiol. Appl. Sci. 2017, 6, 2133–2144. [Google Scholar]
  59. Rodà, F.; Retana, J.; Gracia, C.A.; Bellot, J. Ecology of Mediterranean Evergreen Oak Forests; Springer Science & Business Media: Berlin/Heidelberg, Germany, 1999; Volume 137, ISBN 3-540-65019-9. [Google Scholar]
  60. Shen, J.; Yuan, L.; Zhang, J.; Li, H.; Bai, Z.; Chen, X.; Zhang, W.; Zhang, F. Phosphorus dynamics: From soil to plant. Plant Physiol. 2011, 156, 997–1005. [Google Scholar] [CrossRef] [Green Version]
  61. Sardans, J.; Peñuelas, J. Plant-soil interactions in Mediterranean forest and shrublands: Impacts of climatic change. Plant Soil 2013, 365, 1–33. [Google Scholar] [CrossRef] [Green Version]
  62. Delgado-Baquerizo, M.; Maestre, F.T.; Gallardo, A.; Bowker, M.A.; Wallenstein, M.D.; Quero, J.L.; Ochoa, V.; Gozalo, B.; García-Gómez, M.; Soliveres, S.; et al. Decoupling of soil nutrient cycles as a function of aridity in global drylands. Nature 2013, 502, 672–676. [Google Scholar] [CrossRef]
  63. Aber, J.A.; Melillo, J.M. Terrestrial Ecosystems, 2nd ed.; Brooks/Cole Publishing: Pacific Grove, CA, USA, 2001; ISBN 978-0-12-041755-1. [Google Scholar]
  64. Brown, R.B. Soil Texture; Soil and Water Science Department, Florida Cooperative Extension Service, Institute of Food and Agriculture Sciences, University of Florida: Gainesville, FL, USA, 2003. [Google Scholar]
  65. Serrano, M.S.; Fernández-Rebollo, P.; De Vita, P.; Sánchez, M.E. Calcium mineral nutrition increases the tolerance of Quercus ilex to Phytophthora root disease affecting oak rangeland ecosystems in Spain. Agrofor. Syst. 2013, 87, 173–179. [Google Scholar] [CrossRef]
  66. Zentmyer, G.A. Phytophthora Cinnamomi and the Diseases It Causes; Monograph, American Phytopathological Society: Riverside, CA, USA, 1980; ISBN 0-89054-030-6. [Google Scholar]
  67. Gallardo, A.; Rodríguez-Saucedo, J.J.; Covelo, F.; Fernández-Alés, R. Soil nitrogen heterogeneity in a Dehesa ecosystem. Plant Soil 2000, 222, 71–82. [Google Scholar] [CrossRef]
  68. Hardham, A.R. Phytophthora cinnamomi. Mol. Plant Pathol. 2005, 6, 589–604. [Google Scholar] [CrossRef] [PubMed]
  69. Cerri, M.; Sapkota, R.; Coppi, A.; Ferri, V.; Foggi, B.; Gigante, D.; Lastrucci, L.; Selvaggi, R.; Venanzoni, R.; Nicolaisen, M.; et al. Oomycete communities associated with reed die-back syndrome. Front. Plant Sci. 2017, 8, 1550. [Google Scholar] [CrossRef] [PubMed]
  70. Dunstan, W.A.; Rudman, T.; Shearer, B.L.; Moore, N.A.; Paap, T.; Calver, M.C.; Dell, B.; Hardy, G.E.S.J. Containment and spot eradication of a highly destructive, invasive plant pathogen (Phytophthora cinnamomi) in natural ecosystems. Biol. Invasions 2010, 12, 913–925. [Google Scholar] [CrossRef]
  71. Garrido Valero, M.S. Interpretación de Análisis de Suelos; Ministerio de Agricultura, Pesca y Alimentación: Madrid, Spain, 1994; ISBN 84-341-0810-0. [Google Scholar]
  72. Tecon, R.; Or, D. Biophysical processes supporting the diversity of microbial life in soil. FEMS Microbiol. Rev. 2017, 41, 599–623. [Google Scholar] [CrossRef]
  73. Jeon, S.; Krasnow, C.S.; Kirby, C.K.; Granke, L.L.; Hausbeck, M.K.; Zhang, W. Transport and retention of Phytophthora capsici zoospores in saturated porous media. Environ. Sci. Technol. 2016, 50, 9270–9278. [Google Scholar] [CrossRef]
Figure 1. Soil sample design (according to Gallardo et al. [20] at two different scales: general grid (1 × 1 m) (G, n = 16) and specific position grid (0.5 × 0.33 m) corresponding to inside of the crown cover (I, n = 8), transition (T, n = 8), and outside of the crown cover (O, n = 8) for each of the four sampled trees. The black points belong to the group outside of the crown cover (OC, n = 22) and the white points belong to the group inside of the crown cover (IC, n = 11). The letters N, E, S and W, indicate the cardinal points.
Forests 11 00375 g001
Figure 2. Aggregation indices (Ia) and clustering indices (ν) for the study of 12 variables in the four sampled oaks. The horizontal dotted line Ia = 1 indicates the limit of the type of distribution pattern of the variable (Ia > 1 aggregated, Ia < 1 regular and Ia = 1 random). The horizontal continuous line (mean νi ≥ 1.5) indicates the limit for which the index ν is grouped into patches, i.e., higher values of a given variable. The horizontal discontinuous line (mean νj ≤ −1.5) indicates the limit for which the index ν is grouped into gaps, i.e., lower values of a given variable. * - P < 0.05; ** - P < 0.01; *** - P < 0.001.
Forests 11 00375 g002
Figure 3. Maps of clustering indices (ν) of the cfu for the four sampled trees (top) and the mean for all the trees (bottom). The dark areas show cfu clustering patches (ν > 1.5) delimited by a continuous line, and the light areas show clustering gaps (ν < −1.5) delimited by a discontinuous line. The dotted lines represent the crown cover of each tree. (Ia): General aggregation index. Legend (ν) is unitless.
Forests 11 00375 g003
Figure 4. Maps of clustering indices (ν) of the edaphic variables whose aggregation index (Ia) presents statistical significance in at least two trees (Figure 2) and significant differences in mean value between grids regarding crown cover (Table 2). By columns: P (phosphorus), OM (organic matter), silt and clay. By rows, trees 1 to 4 (projected to 4 × 4 m surface). The darker areas show clustering patches of edaphic variables (ν > 1.5) are delimited by a continuous line, and the light areas show edaphic variables clustering gaps (ν < −1.5) are delimited by a discontinuous line. The dotted lines represent the crown cover of each tree. In the upper right corner of each sampling unit, the overall general aggregation pattern (Ia) is indicated. Legend (ν) is unitless.
Forests 11 00375 g004
Table 1. Colony forming units of each tree (cfu sample−1, mean ± standard error) according to sample grid and sample position with respect to tree crown cover. Mean cfu: mean value of cfu considering all the samples; n: number of soil samples per grid under each tree; I: inside crown intensive grid; T: transition intensive grid; O: outside crown intensive grid; IC: all samples inside crown cover; OC: all samples outside crown cover. Different lowercase letters in superscript indicate significant differences between position with respect to crown cover (Mann-Whitney U Test, P < 0.05 for IC-OC comparisons and P < 0.0167 for I-O-T comparisons). No comparisons were made between means corresponding to different factors (I, O and T with IC and OC).
Position Respect to Crown Cover
TreeMean cfu
n = 33
I
n = 8
T
n = 8
O
n = 8
IC
n = 11
OC
n = 22
112 ± 322 ± 5 a6 ± 4 b5 ± 2 b23 ± 7 a6 ± 2 b
213 ± 534 ± 13 a4 ± 3 b3 ± 2 b26 ± 10 a7 ± 6 b
319 ± 838 ± 20 a39 ± 26 a0 ± 0 b44 ± 21 a5 ± 4 b
444 ± 10119 ± 26 a49 ± 11 b16 ± 6 c100 ± 22 a16 ± 4 b
Mean22 ± 453 ± 11 a24 ± 8 b6 ± 2 b48 ± 9 a9 ± 2 b
Table 2. Edaphic variables. Mean values (mean ± standard error) according to sample grid and position respect to tree crown cover. n: total number of samples. I: inside crown grid; T: transition grid; O: outside crown grid. IC: samples inside crown cover; OC: samples outside crown cover; (ρ): Spearman correlation coefficient between cfu (n = 132) and physicochemical soil parameters. Different letters in superscript indicate significant differences with respect to crown cover (Tukey test for normal distributed variables, P < 0.05 and Mann-Whitney U Test for non-normal distributed variables, P < 0.05 for IC-OC comparisons and P < 0.0167 for I-O-T comparisons †). No comparisons were made between means corresponding to different factors (I, O and T with IC and OC).
Position with Respect to Crown Cover
VariableI
n = 32
T
n = 32
O
n = 32
IC
n = 44
OC
n = 88
Corr. coef.
(ρ)
N (%)0.19 ± 0.01 a0.18 ± 0.01 a0.18 ± 0.01 a0.19 ± 0.01 a0.17 ± 0.01 a−0.045
OM (%)1.91 ± 0.11 b1.47 ± 0.12 b1.77 ± 0.11 a1.78 ± 0.08 a1.61 ± 0.07 a−0.008
C/N6.67 ± 0.52 a5.13 ± 0.49 a6.25 ± 0.54 a6.09 ± 0.39 a5.98 ± 0.36 a0.020
Clay † (%)27.17 ± 1.01 b28.21 ± 0.90 a,b26.85 ± 1.33 a25.43 ± 0.84 a,*28.66 ± 0.67 b,*−0.398 ***
Silt (%)37.28 ± 1.36 a38.86 ± 1.16 a37.68 ± 1.28 a38.49 ± 1.23 a37.25 ± 0.69 a−0.026
Sand (%)35.54 ± 2.03 a32.93 ± 1.34 a35.48 ± 2.17 a36.08 ± 1.72 a34.09 ± 1.07 a0.242 **
P † (mg/kg)32.45 ± 9.05 b7.41 ± 3.38 b19.58 ± 6.94 a27.07 ± 6.55 a,*12.19 ± 3.31 b,*0.109
pH5.13 ± 0.06 a5.17 ± 0.04 a5.20 ± 0.05 a5.13 ± 0.04 a5.19 ± 0.03 a0.319 ***
Ca (meq/100 g)0.70 ± 0.04 a0.59 ± 0.03 a0.73 ± 0.05 a0.64 ± 0.03 a0.67 ± 0.03 a0.374 ***
K † (meq/100 g)0.50 ± 0.13 a0.20 ± 0.02 a0.22 ± 0.05 a0.41 ± 0.09 a,*0.19 ± 0.02 b,*0.352 ***
Moisture † (%)15.04 ± 1.24 a15.75 ± 0.65 a15.24 ± 0.77 a15.25 ± 0.84 a15.30 ± 0.46 a0.066
*: Significant at P < 0.05; **: Significant at P < 0.01 ***: Significant at P < 0.001.
Table 3. Generalized Linear Mixed Model effects Chi-squared test. First row shows the optimal model Akaike Information Criteria (AIC). Df: Degrees of freedom. P: Significance level.
Single Effects InfluenceDfAICP
None 2703.8
Random effectsTree64876.2<0.001
Position64103.0<0.001
Fixed effectsSilt12704.80.082
K12754.4<0.001
P12933.8<0.001
Moisture13864.5<0.001
Table 4. Generalized linear mixed model adjusted by maximum likelihood between colony forming units (cfu, n = 132) and the explanatory variables (silt, phosphorus, potassium and moisture). P: Significance level.
EstimateStd. Errorz ValueP
(Intercept)2.5010.9572.612<0.01
Silt0.0440.0261.737<0.05
P0.8030.05115.877<0.001
K−0.1880.027−6.983<0.001
Moisture1.0810.03233.881<0.001

