Abstract
Vegetation plays a significant role in controlling soil erosion. However, the effects of each vegetation type on soil erosion have not been fully investigated. In order to explore the influence of multiple vegetation covers on soil erosion and surface runoff generation, 10 different vegetation types, typical of the Nverzhai small basin, have been selected for this study. Regional precipitation, surface runoff, and sediment yield were measured from 2007 to 2018. The wettest year recorded was 2012. Recorded data confirmed that July was the wettest month in this region while January and December were the driest months. Furthermore, surface runoff and sediment yield associated with different vegetation types gradually decreased after 2013, which is the quantification of the consequences due to afforestation processes started in this area. Surface runoff and sediment content recorded for the configuration of sloping farmland were the largest between the different investigated vegetation types. The smallest were the broad-leaved mixed forest, the coniferous mixed forest, and shrubs. Finally, a significant linear positive correlation was found between rainfall and surface runoff, as well as sediment yield (R2 = 0.75). This suggests that climate change implications could be limited by using the more efficient vegetation covering. This research indicates that the ground cover is a key element in controlling soil and water loss, as well as vegetation measures, with high ground cover (i.e., broad-leaved trees). These measures should be strongly recommended for soil erosion control and surface runoff reduction. Moreover, these outcomes can be very helpful for vegetation restoration and water conservation strategies if implemented by local authorities.
1. Introduction
Surface runoff is associated with water that flows due to excess of stormwater, specifically when the soil is saturated to full capacity and the rain arrives quicker than the soil can absorb it [1,2]. During a rainfall event, the kinetic energy of the raindrops is the initial driver of the soil erosion, which is then typically aggravated by the intensity of the runoff generated under each rainfall condition [3]. Soil erosion can cause serious damages to ecosystems such as forests, crops, or pastures [4] because by reducing the water holding capacity, nutrients, and valuable soil biota—essential for plants and animals—are lost. Due to climate change and consequent increase of rainfall intensities [5,6], the erosive power of rainfall is expected to gain a higher magnitude [7]. During the erosion process, the rain kinetic energy derives from the kinetic energy components of each single raindrop that strikes the soil [8]. These raindrops, falling directly into the soil, generate the dispersion of soil particles, which reduce the capacity of infiltration for the soil and increase the runoff [9]. Being an important part of water cycle in every forest ecosystem, the amount of runoff directly impacts the hydrological characteristics of each affected basin. This hydrological parameter is also an important indicator to measure, in each forest, the amount of water conservation, soil conservation, and flood peak reduction [10]. These are all important elements of the water balance.
The coverage of surface vegetation is an effective way to control soil erosion caused by water [11,12] and its role can be divided into two components: (i) leaves and stems can help intercepting the raindrops reducing their kinetic energy and (ii) roots and litter can improve the physical and chemical properties of the soil, alleviating the erosion effect of rainfall and the effect of runoff on the soil [13,14]. To date, multiple studies conducted have demonstrated the capacity of forest vegetation to increase infiltration rates, providing an essential role for water conservation [15,16,17,18,19,20,21,22,23]. Moreover, additional work has been completed to further investigate runoff generation and the role that vegetation covers have on its magnitude and frequency [24,25,26,27,28]. The amount of runoff has been found to be affected by rainfall characteristics (size and intensity), vegetation conditions, soil topography, climate, and meteorological conditions and other soil characteristics [29,30,31].
However, to date, research on forest runoff has focused mainly on large regions and large basins [32]. Thus, there is a lack in literature for research on long-term surface runoff in small basins. Additionally, there is a need to establish relationships between vegetation covers and soil erosion, with corresponding studies on artificial vegetation and planting methods of different crops [33].
To fill this gap, this work presents an analysis of the impact on runoff generation of 10 different vegetation types, collected in 12 years in the small basin of Nverzhai, Western Hunan. The paper is organized as follows: Section 2 introduces the field datasets collected describing the methods applied and the analysis conducted. Section 3 presents the effects of different vegetation covers on annual sediment yield and runoff. Section 4 provides a discussion of the results obtained. Lastly, Section 5 produces a brief summary and concluding remarks of the whole study.
2. Materials and Methods
2.1. Study Area
The experimental site was located in the small basin of Nverzhai (111°12′42.836″ E; 29°25′27.582″ N) in the Wuling mountain area of the Western Hunan Province, China (Figure 1). This site is in Liangxi village (Lingyang Town, Cili County, Zhangjiajie City, China) and it is about 7 km from Cili County, in the northwest direction. The basin belongs to the secondary tributary of Lishui. The total area of the basin is 2.81 km2. The lowest elevation (at the outlet of the main ditch) is 210 m, while the highest elevation is 917.4 m. Furthermore, the length of the main ditch is ≈ 1.2 km, and the longitudinal gradient of the main ditch is about 28.4 ‰. The forest area covers more than 80% of the entire basin and the types of vegetation in situ are typical of the Pinus massoniana forest, the Eucommia ulmoides forest, the Citrus reticulata forest, and miscellaneous shrub forests in the basin. In this area, the parent rock is a mainly sand shale and the soil types is a mainly red soil. All the experimental datasets collected for this study were gathered in proximity of the National Observation and Research Station of Cili Forest Ecosystem in Hunan Province.
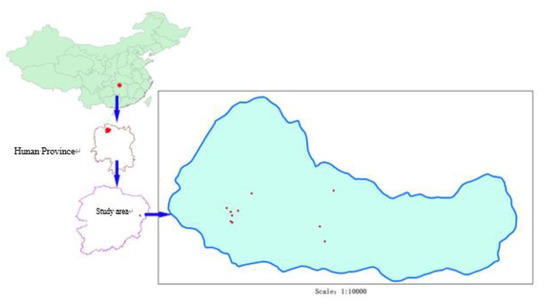
Figure 1.
Location of the case study in Hunan Province, China.
2.2. Microclimate Monitoring
To characterize the typical features of each forest configuration, the observation site had to be open. It was not influenced by dissimilar vegetation that could have complicated the quantifications of the measured variables. The distance between the observation site and the surrounding isolated obstacles had to be at least three times the height of the obstacles. Additionally, high pole crops could not be planted around to ensure regular air flow conditions. To achieve this, a fence with a height of 1.2 m was set around the observation site. According to the standard of the National Meteorological Observatory Station, the area of each microclimate observation site had to be 25 × 25 m2. The site was maintained as flat and kept with a uniform layer of grass whose height could not exceed 20 cm. Moreover, no crops were allowed to be planted. Air temperature (maximum, minimum), air humidity (dry bulb temperature, wet bulb temperature), ground temperature (maximum, minimum), temperature in the soil at 5 cm, 10 cm, 15 cm, and 20 cm, wind speed, wind direction, evaporation, and precipitation were recorded at each site location.
2.3. Surface Runoff and Sediment Yield Measurement
The surface runoff measurements collected for this study were based on the national standard procedure of the People’s Republic of China called “Methodology for field long-term observation of forest ecosystem (GB33027-2016)”. According to different vegetation types, three 100 m2 fixed slope runoff plots were setup to monitor slope runoff and sediment. The runoff area on the slope was 5 m wide (parallel to the contour line) and 20 m long (horizontal projection along the slope). A 2 m wide isolation protection belt was left around the runoff area on the slope (Figure 2). The water collecting tank was located at the water-retaining wall downstream the runoff area. As a supplementary monitoring method to the fixed runoff area procedure, the size of the temporary runoff area was 5 × 10 m2. The long side was perpendicular to the contour line and the short side was parallel to the contour line. The surface runoff was measured with a QT-50 mL tipper type surface runoff meter.
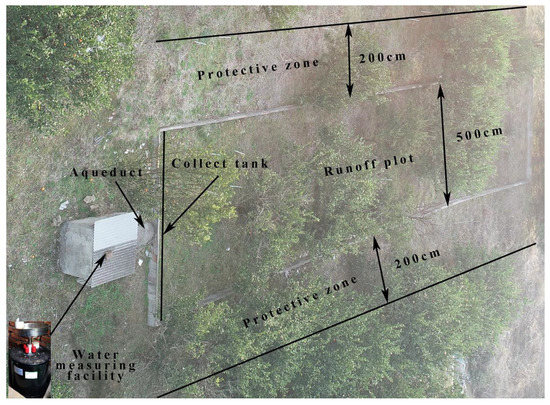
Figure 2.
Scheme of the experimental setup.
The calculation formula for the surface runoff converted to forest land is displayed as follows (1):
where: Sr is the surface runoff of forest land (t/hm2); P is the runoff of runoff plot (m3); α is the concentration (g/mL) (the calculation method is presented in Equation (3)); A is the area of the runoff plot (m2); and 1000 and 10,000 are unit conversion coefficients.
Sr = (P × α/1000)/(A/10,000)
To measure the sediment yield (Equations (2)–(4)), there was a collection tank (Figure 2) in the slope’s runoff area, which was used to collect surface runoff. The area of the collection tank was fixed. After each rainfall, a steel ruler was used to measure the water depth to obtain the volume of surface runoff. After, water in the collection tank was fully mixed and a sample of the mixed solution was taken and filtered. The sediment collected was dried at 105 °C for 12 h and weighed to obtain the volume of sediment content. Finally, this value was firstly related to the total amount of volume in the collection tank to obtain the sediment content collected and secondly to the total runoff area per hectare.
These are the formulae used to quantify the sediment content:
where: G is the weight of sediment in the sampling bottle (g); G1 is the weight of filtered paper with sediment (g); G2 is the weight of the paper (g); g is the weight of the container with filtered paper (g); α is the sediment concentration (g/mL); St is the total amount of sediment in the forest land (t/hm2); R is the volume of sediment in the inner diameter of the collecting tank (mL); A is the area of the runoff plot (m2); and 10,000 is a conversion coefficient.
G = G1 − G2 − g
α = g/500
St = α × R/(A/10,000)
2.4. Vegetation Types
Different vegetation types were considered for this study. The list included slope farmland (SF-Figure 3a); Eucommia ulmoides forest (EUF-Figure 3b); Vernicia fordii forest (VVF); broad-leaved secondary forest (BLMF); wasteland (WL); citrus reticulata forest (CRF-Figure 3c); Pinus massoniana forest shrub (PMF); coniferous and broad-leaved mixed forest (CBMF); and broad-leaf mixed forest (BMF-Figure 3d). Crucial parameters typical of each configuration are listed and summarized in Table 1.
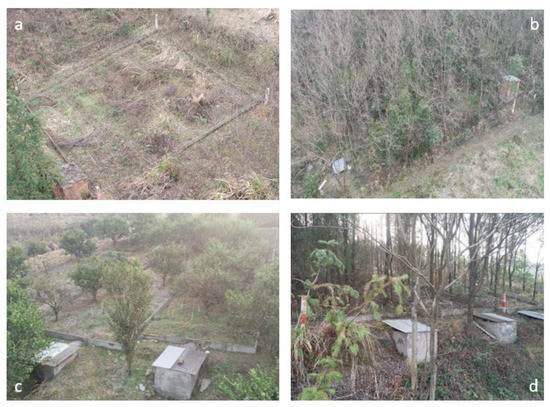
Figure 3.
(a) Slope farmland (SF); (b) Eucommia ulmoides forest (EUF); (c) citrus reticulata forest (CRF); and (d) broad-leaf mixed forest (BMF).

Table 1.
Overview of different vegetation types in Nverzhai small basin.
3. Results
3.1. Characterization of Rainfall Patterns in the Nverzhai Basin
Figure 4 shows the rainfall variations from 2007 to 2018 in the basin of Nverzhai. The values in Figure 5 confirms that the 12-year rainfall rates in the Nverzhai basin were within 1007.30–1975.47 mm, with the wettest year in 2012 and the “driest” years in 2009 and 2011, when the rainfall was recorded to be below 1100 m. The average rainfall was 1373.84 mm in the first five monitored years (2007–2011) and 1622.51 mm in the last seven monitored years (2012–2018). The trend highlighted during the last seven years confirms how rainfall is relatively constant within values typical of wet years. This may also be due to the effects provided by the afforestation process established within the area, which may have contributed to improve the local climate. Although some authors believe that these considerations may be correct, it is possible that the short time period (2012–2018) was too short and that more times is needed to characterize rain pattern changes.
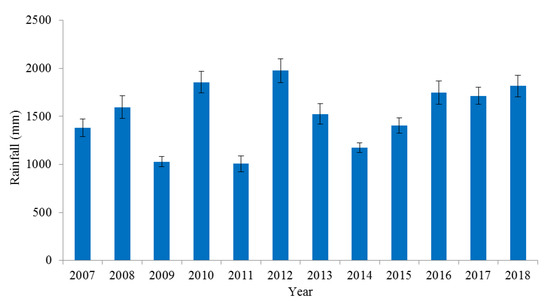
Figure 4.
Average annual rainfall in Nverzhai Basin from 2007–2018.
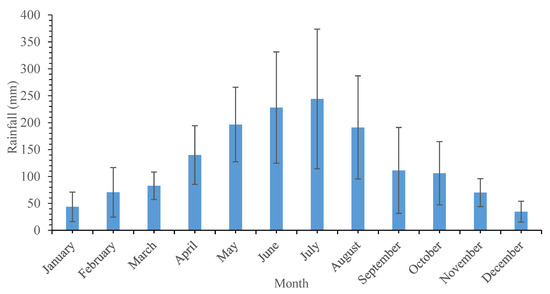
Figure 5.
Annual rainfall in Nverzhai Basin, China.
Focusing on the contribution within each month, as shown in Figure 3, the highest value of rainfall recorded was for July (243.93 ± 129.70 mm) while the lowest rainfall value was obtained in January and December (43.64 ± 27.42 mm and 34.63 ± 19.38 mm, respectively). The collected datasets show how rainfall gradually increased from January to the highest value in July, then decreased until December. The rainfall recorded in July was 5.59 and 7.04 times higher than the one recorded in January and December.
3.2. Contribution of Different Vegetation Covers to Runoff Generation
Figure 6 shows how vegetation cover changed over the investigated time period (2007–2018). Table 2 displays the contribution to runoff generation of each forest type. Figure 7 presents values of surface runoff generated by each vegetation type. Our results (Table 3) confirmed that the surface runoff contribution caused by slope farmland is the largest, whereas the surface runoff generated by the broad-leaved mixed forest is the smallest.
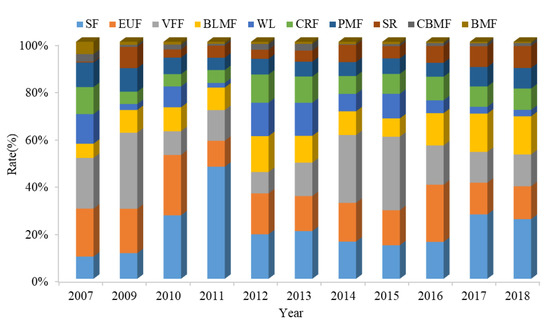
Figure 6.
Percentage (%) of vegetation types from 2007 to 2018.
Table 2.
Percentage (%) of vegetation types from 2007 to 2018.
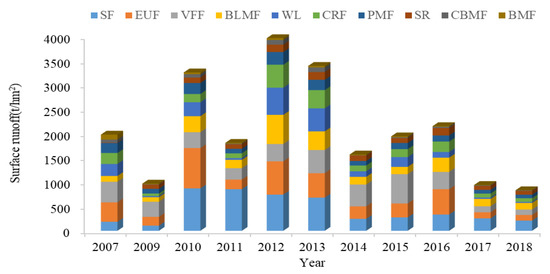
Figure 7.
Contribution to runoff generation due to different vegetation covers.
Table 3.
Contribution to runoff generation due to different vegetation covers (t/hm2).
However, averaged contribution was higher on the first half of the period recorded (2007–2013, 575.18 t/hm2), while in 2014–2018 the averaged value was 264.86 t/hm2 (2.17 times smaller). Between 2007–2013, the average surface runoff caused by the broad-leaved mixed forest was 36.94 t/hm2, while between 2014–2018 it was 11.53 t/hm2 (2.79 times smaller). All the contributions due to other vegetation covers confirmed this trend (Figure 6). Averaging the contributions from each vegetation type, the surface runoff recorded after 2013 decreased by 41.91%. The average value recorded in the first period (2007–2013) reinforced the fact that the applied afforestation within the area supported the recovery and continuous growth of the original forest vegetation, which enhanced water conservation and soil fixation, and weakened the erosion ability of rainfall.
The overall runoff contribution for each vegetation types is shown in Figure 8. It is possible to see that Sloping Farmland supplies the largest annual mean surface runoff (434.13 ± 108.50 t/hm2), and this configuration is followed by Eucommia ulmoides forest (373.46 ± 96.02 t/hm2) and Vernicia fordii forest (343.44 ± 41.25 t/hm2). On the other side, the smallest contribution is due to the broad-leaved mixed forest (26.86 ± 11.56 t/hm2), coniferous and broad-leaved mixed forest (37.54 ± 8.03 t/hm2), and shrub (103.78 ± 21.52 t/hm2).
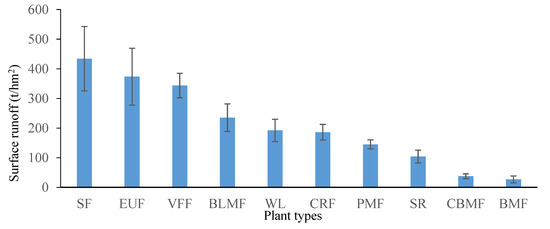
Figure 8.
Comparison of annual mean surface runoff of different vegetation types.
Comparing these values, it is possible to state that the average annual surface runoff generated by sloping farmland is 16.46 times higher than the contribution due to broad-leaved mixed forest. This confirms that the sloping farmland option is more likely to produce soil erosion, while mixed forest land and broad-leaved mixed forest have stronger soil and water conservation capacity.
There are a large number of layers and plants for shrub configurations, which increase the roughness of the ground. This justifies why runoff values recorded for this vegetation type are not significant. However, sloping farmland areas are characterized by relatively smooth surfaces and higher slopes than other vegetation types, which are both conditions that facilitate surface runoff generation. Hence, in areas affected by continuous soil erosion, it is suggested to plant a variety of vegetation types such as broad-leaved mixed forests.
3.3. Contribution of Different Vegetation Types to Annual Sediment Yield
The annual sediment yield and the contributions from each vegetation type between 2007–2018 are shown in Figure 9. Overall, from 2007 to 2013, the annual sediment yield of different vegetation types was relatively large and the highest annual sediment yield was 175.19 t/hm2, as recorded in 2012 (Table 4). After 2013, the annual sediment yield of different vegetation types slightly reduced and the annual sediment yield was below 120 t/hm2, which confirmed that the soil loss had slowed down in recent years. Moreover, the sediment yield of the basin has reached a stable point under control. By comparing contributions provided by different vegetation types (Table 5), the annual sediment yield of sloping farmland was the largest (35.38 t/hm2 and 32.04 t/hm2 in 2007–2013 and 2014–2018, respectively), while the contribution from broad-leaved mixed forest was the smallest (2.05 t/hm2 in 2007–2013 and 0.15 t/hm2 in 2014–2018). The annual sediment yield in 2018 was 70.39% less than the one recorded in 2012. This value is a clear sign that due to the recent recovery and growth induced by the afforestation, the surface erosion slowed, sediment content significantly reduced, and soil developed stronger capabilities to store and conserve water.
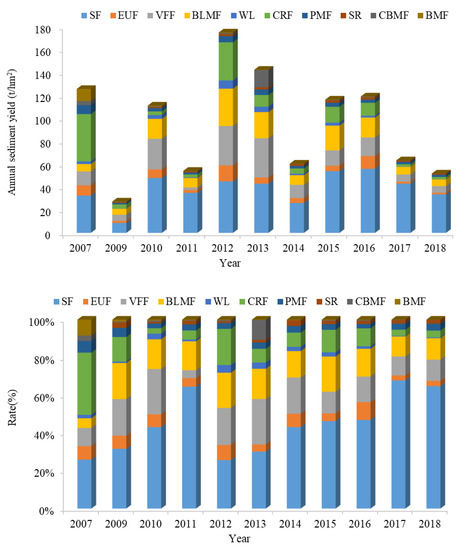
Figure 9.
Annual sediment yield for each vegetation type between 2007 and 2018.
Table 4.
Annual sediment yield from each vegetation type between 2007 and 2018 (t/hm2).
Table 5.
Contributions from each vegetation type between 2007 and 2018 (%).
The overall contribution to sediment yield due to different vegetation types is shown in Figure 10. It can be seen from Figure 10 that the sediment content in sloping farmland is the largest (38.64 ± 8.91 t/hm2), it is followed by the Vernicia fordii forest (15.30 ± 5.98 t/hm2) and the broad-leaved secondary forest (13.90 ± 3.65t/hm2). The smallest contribution is associated to the broad-leaved mixed forest (1.19 ± 0.98 t/hm2), the shrub configuration (1.35 ± 0.61 t/hm2), and the coniferous broad-leaved mixed forest (1.96 ± 0.25 t/hm2), which is not far from the contribution of the wasteland configuration (2.21 ± 0.10 t/hm2). The sediment content of sloping farmland is 32.57 times higher than the rate generated by the broad-leaved mixed forest. This certifies that sloping farmland is more likely to produce soil erosion, which produces a large number of surface runoff that results in an increase of soil loss. Mixed forest land (broad-leaved mixed forest is the strongest), however, has strong soil and water conservation capacity.
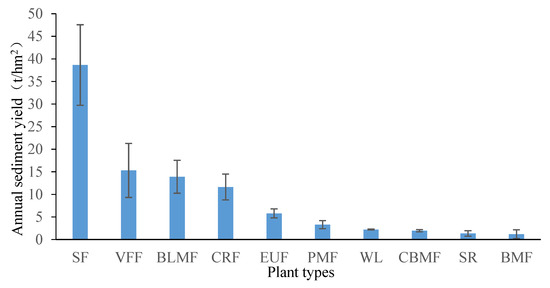
Figure 10.
Comparison of annual sediment yield of different vegetation types.
3.4. Surface Runoff and Sediment Yield vs Rainfall Relationships
It can be seen from Figure 11 that there could be an approach to a linear correlation between rainfall and surface runoff (R2 = 0.36). When the surface runoff is 97.19 t/hm2, the rainfall is 1028.72 mm. As the rainfall increases, the surface runoff also increases. When the rainfall is 1856.60 mm, the surface runoff is 326.37 t/hm2 and when the rainfall is 1975.47 mm, the surface runoff is 396.92 t/hm2. This proves that the formation of surface runoff could be directly related to the size of rainfall. In order to reduce the direct erosion induced by the rainfall on the surface, a large number of trees with strong impact resistance (such as broad-leaved trees, with more litter) should be planted, to increase the surface roughness and reduce water and soil loss. However, the interaction rainfall-runoff is dynamic and depends on the relationship between rain intensity, soil infiltration, and surface storage. Runoff occurs whenever rain intensity exceeds the infiltration capacity of the soil, providing there are no physical obstructions to surface flow. Considering the complexity of this dynamic interaction, peaks observed outside the trend identified could be influenced by one of these factors.
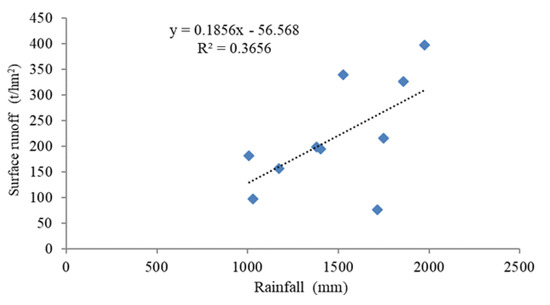
Figure 11.
Relationship between rainfall and surface runoff.
It can be seen from Figure 12 that there may be a linear correlation between rainfall and annual sediment yield (R2 = 0.35). When the annual sediment yield is 2.74 t/hm2, the rainfall is 1028.72 mm. With rainfall increases, the annual sediment yield increases gradually. When the rainfall is 1856.60 mm, the annual sediment yield is 11.13 t/hm2; when the rainfall is 1975.47 mm, the annual sediment yield is 17.52 t/hm2. This shows that the formation of sediment yield is directly related to the amount of rainfall.
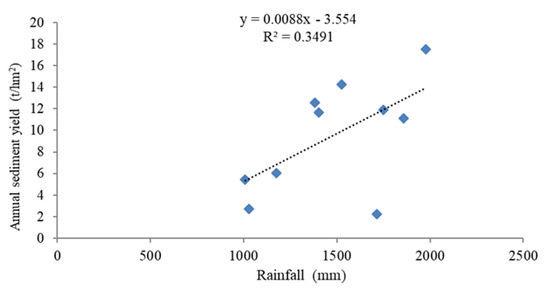
Figure 12.
Relationship between rainfall and annual sediment yield.
Datapoints observed outside the linear trend identified in Figure 12 could be justified by the properties of the rainfall which could not be measured or quantified at this stage. Weather conditions could influence both suspended sediments on the ground and the kinetic energy of raindrops. Both factors could interfere with the accurate quantification of sediment yield. Eroded sediment particles can collide and break into smaller fragments, and conditions of the soil surface may interfere with the movement of these particles. Overall, runoff and sediment yield were sensible to the variations of precipitation.
Finally, it is possible to observe from Figure 13 that there is a significant positive correlation between surface runoff and annual sediment yield (R2 = 0.75). When the annual sediment yield is 2.74 t/hm2, the surface runoff is 97.19 t/hm2. With the increase of surface runoff, the annual sediment yield increases gradually. When the surface runoff is 396.92 t/hm2, the annual sediment yield is 17.52 t/hm2. This confirms that the formation of sediment yield is not only directly related to rainfall but may be also associated with hydraulic processes of surface runoff.
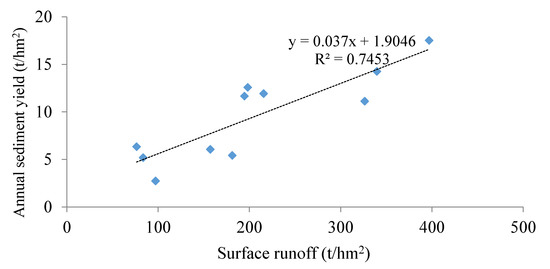
Figure 13.
Relationship between annual surface runoff and annual sediment yield.
Different vegetation types and different land uses are key factors that influence sediment yield and runoff. However, results highlighted in Figure 13 confirms that the sediment transport to watercourses is strongly related to the runoff generation. Therefore, the watershed sediment response may depend on the location and spatial distribution of water source areas.
4. Discussion
4.1. Impact of Vegetation Types on Surface Runoff Generation
Results obtained in this study confirm the benefits that afforestation can cause, such as reducing surface runoff and sediment yield. Sloping farmlands were found as the worst-case scenario because surface runoff and annual sediment yield are the largest measured between the investigated forest typologies. Broad-leaved mixed forests and shrubs, meanwhile, are the best-case scenario for the purposes studied. These results provide an additional understanding that enriches peculiar aspects already found in literature by Yu et al. [34], where the effect of contour grass hedges on soil and water loss control was studied in sloping farmland in Beijing. It was found that under natural precipitation, Pennisetum alopecuroides hedgerow reduces surface runoff by 72.7% and soil loss by 86.3%. Arundinella hirta hedgerow reduces surface runoff by 53.8 % and soil loss by 64.1%. Moreover, Atucha et al. [35] found that retaining weed strips between rows can effectively prevent and control soil and water loss in orchards of Chilean avocado, with an average reduction of the surface runoff of 61.1% and soil erosion of 99.5%. Lenka et al. [36] found that the use of weed strips can prevent and control soil erosion of peanut and corn fields caused by precipitation in Northeast India, with an average reduction of 78.3%. This confirms that the smaller the slope, the less surface will be exposed to erosion. Further, the smaller the slop, the smaller surface runoff and annual sediment yield will be [37]. These previous studies are consistent with the results of this work because broad-leaved mixed forests and shrubs have high surface coverage and small slopes. As a consequence, annual surface runoff and annual sediment yield are small.
Wang et al. [1] previously simulated the variation of surface runoff for Quercus acutissima forests and found that it was smaller than the surface runoff measure for grassland. This study also found that the surface runoff and sediment yield associated with vegetation covers characterized by large surface areas such as shrubs and broad-leaved mixed forests were smaller than those measured for forests with small surface coverage such as sloping farmland. This is because the surface of the first configuration is typically covered by a large number of vegetation and litter, which is why rainwater that reaches the ground is intercepted. The results of this study are also consistent with what was found by Lv et al. [38], who stated that under the natural rainfall condition the surface runoff of forest land (360.3 m3/hm2) is smaller than that typical of wasteland (900.9 m3/hm2).
Hosseini et al. [39] found that vegetation coverage plays an important role in reducing surface runoff. In our study, the vegetation coverage of broad-leaved mixed forest and shrub is larger than that of slope farmland, and the surface runoff of slope farmland is also larger than that of broad-leaved mixed forests and shrubs, which is consistent with the results of Hosseini et al. [39]. This study shows that the soil porosity of the broad-leaved mixed configuration and shrub lands is larger than the one of sloping farmlands, while the soil bulk density of the broad-leaved mixed forests and shrubs is smaller than those of sloping farmlands, as summarized in Table 1. Shen [40] simulated a rainfall test and found that under the same soil conditions, the larger the soil bulk density and smaller the porosity, the denser the soil will become. This is consistent with the fact identified by this study that if the soil bulk density is small then there is a high possibility of interflow generation. Finally, Du et al. [41] pointed out that under the same rainfall intensity, the order of interflow follows the order: grass irrigation > herb > shrub > bare land. Further, they confirmed that the higher the surface coverage, the greater the interflow and smaller the surface runoff. In this study, the surface coverage of broad-leaved mixed forests and shrubs was greater than a typical sloping farmland. Our results have highlighted how this configuration enhances elevated interflows via higher infiltration rates and smaller surface runoff.
4.2. Relationship Between Surface Runoff and Rainfall
Results obtained in this study confirmed findings already available in previous studies: a positive correlation between surface runoff, sediment yield, and rainfall was found because surface runoff and sediment yield increased with the increase of rainfall recorded. This could be justified by the fact that during early rainfall stages, the soil moisture content is still low, and the soil is not fully saturated, causing preliminary raindrops to fill empty soil pores without generating surface runoff. However, if the rainfall event continues and increases its intensity, the soil moisture content gradually reaches the saturated state and then starts to produce small streams of water. At this point, the rainfall infiltration speed is very close to the stable infiltration speed typical of the saturated soil and the surface runoff reaches the maximum value. This was also found by Chen et al. [42], who previously confirmed that the surface runoff is relatively small at the beginning of the rainfall event.
Previous research conducted within the Sichuan yellow soil area [43] and soil in the Northwest Guizhou area [44] identified that when there is heavy rainfall, the kinetic energy of raindrops is large. This causes strong scouring effects on soil surface, leading to the accumulation of a large amount of surface sediment in the catchment, as confirmed by this study. According to the trend observed in Figure 13, there is a linear relationship between sediment yield and surface runoff, which may be caused by short duration and high intensity rainfall events. During intense rainfall events, the surface runoff is typically large and the erosion of the soil is more severe, resulting in a large amount of sediment carried within the surface runoff, which was found by Ai et al. [45]. Previously, Cao et al. [9] conducted a redundancy analysis on the environmental factors that impacted the surface runoff and sediment yield, and found that there was a negative correlation between the crown buffer kinetic energy, leaf area index, and stem flow and the sediment yield, among which the leaf area index was an important parameter linked to forest canopy closure. The larger the leaf area index, the larger the canopy density. Lin et al. [46] pointed out that the runoff and sediment yield were not affected by rainfall intensity and rainfall duration, which was different from one of the conclusions of this study, because Lin’s study mainly focused on low crops such as buckwheat flour and peanuts, while the object of this study was targeting tall and dense tree layers, which have an impact on the amount of runoff generation.
5. Conclusions
Infiltration rates can vary with rainfall intensity, runoff, and vegetated conditions. This study investigated rainfall trends between 2007 and 2018 in the Nverzhai basin, Hunan Province in China, focusing on the runoff generation under multiple vegetation covers. The wettest year recorded within this period was 2012 and the data recorded have confirmed that July was the wettest month in this region while January and December were the driest months.
Significant results obtained can be summarized as follows:
- Surface runoff and sediment yield associated with different vegetation types gradually decreased after 2013, which is the direct result of the area’s afforestation process. Soil and water loss have recently decreased in the Nverzhai basin while water conservation has gradually increased.
- The surface runoff and sediment content recorded for the configuration of sloping farmland is the largest between all the investigated vegetation types, while the one measured for the broad-leaved mixed forest, the coniferous mixed forest, and shrubs is the smallest.
- There could be a correlation between surface runoff, sediment content, and rainfall (R2 = 0.35).
- There is a linear relationship between surface runoff and sediment yield (R2 = 0.75), and considering that one of the major causes of surface runoff is linked to heavy rainfall events, in order to reduce the direct erosion of raindrops and reduce the source of runoff and sediment, a large number of broad-leaved trees, coniferous, and shrubs are highly indicated to be planted to enhance the soil resistance and reduction of kinetic energy associated with raindrops.
Over the past few decades, global forests have had a dramatic change and the importance of including forest or vegetation change in the assessment of water resources under climate change has not yet been quantitatively examined across the globe despite being recognized by the Intergovernmental Panel on Climate Change (IPCC). The roles of vegetation cover and climate change (one of its consequences is associated with more frequent and intense rainfall events) must be considered in predicting and managing future global water resource changes.
Author Contributions
Conceptualization, J.L., X.Z. and J.Z.; methodology, J.L. and G.L.; validation, J.L., X.Z., G.L., Y.T. and M.R.; formal analysis, J.L., X.Z., G.L., Y.T., M.R. and J.Z.; investigation, J.L., Y.T. and X.Z; data curation, J.L., G.L., Y.T., M.R. and X.Z.; writing—original draft preparation, J.L. and G.L.; writing-review and editing, J.L., G.L. and M.R.; supervision, G.L., M.R.; funding acquisition, X.Z. and J.Z. All authors have read and agreed to the published version of the manuscript.
Funding
This work was funded by the Forestry Science and Technology Innovation Project in Hunan (XLK201970, HNGYL-2019-01), the Major Research and Development Program in Hunan (2017NK2223), the Forestry Science and Technology Plan Project in Hunan (XLKPT201710), the National Science and Technology Plan for Twelfth Five-Year in the Countryside (2015BAD07B04), and the National Key R & D Program of China (2017YFC0505506). This work was supported by the CFERN and BEIJING TECHNO SOLUTIONS Award Funds for excellent academic achievements.
Conflicts of Interest
The authors declare no conflict of interest.
References
- Wang, R.J.; Gao, P.; Li, C.; Liu, P.W.; Sun, J.N.; Liu, Q. Characteristics of surface flow and interflow and nitrogen loss in Quercus acutissima forest land under simulated rainfall. Acta Ecol. Sin. 2019, 39, 2732–2740. [Google Scholar]
- Meng, H.Q.; Zhao, T.Q. Nutrient loss from riparian cultivated land under different rainfall erosivity. Bull. Soil Water Conserv. 2009, 29, 28–31. [Google Scholar]
- Zhang, Y.; Niu, J.Z.; Xie, B.Y.; Yu, X.X.; Zhu, J.G.; Li, W. Dynamics mechanism of the effect of forest vegetation on hill-slop sater erosion. Acta Ecol. Sin. 2008, 28, 5084–5094. [Google Scholar]
- Zuazo, V.H.D.; Pleguezuelo, C.R.R. Soil-Erosion and Runoff Prevention by Plant Covers: A Review. In Sustainable Agriculture; Lichtfouse, E., Navarrete, M., Debaeke, P., Véronique, S., Alberola, C., Eds.; Springer: Dordrecht, The Netherlands, 2009. [Google Scholar]
- Favis-Mortlock, D.T.; Guerra, A.J.T. The implications of general circulation model estimates of rainfall for future erosion: A case study from Brazil. Catena 1999, 37, 329–354. [Google Scholar] [CrossRef]
- Nearing, M.A. Potential changes in rainfall erosivity in the U.S. with climate change during the 21st century. J. Soil Water Conserv. 2001, 56, 229–232. [Google Scholar]
- Nearing, M.A.; Jetten, V.; Baffaut, C.; Cerdan, O.; Couturier, A.; Hernandez, M.; Le Bissonais, Y.; Nichols, M.H.; Nunes, J.P.; Renschler, C.S.; et al. Modeling response of soil erosion and runoff to changes in precipitation and cover. Catena 2005, 61, 131–154. [Google Scholar] [CrossRef]
- Salles, C.; Poesen, J.; Sempere-Torres, D. Kinetic energy of rain and its functional relationship with intensity. J. Hydrol. 2002, 257, 256–270. [Google Scholar] [CrossRef]
- Cao, G.X.; Wang, K.Q.; Zhao, Y.Y.; Duan, X. The Mechanism of surface runoff and sediment yield of evergreen broad-leaved forest in the middle subtropical region. J. Soil Water Conserv. 2018, 32, 30–36. [Google Scholar]
- Song, J.H. Research on Hydrological and Ecological Function of Natural Secondary Forests in Jinyun Mountain. Ph.D. Thesis, Beijing Forestry University, Beijing, China, 2008. [Google Scholar]
- Marc, D.; Richard, H. Reduction in agricultural non-point source pollution in the first year following establishment of an integrated grass/tree filter strip system in southern Quebec (Canada). Agr. Ecosyst. Environ. 2009, 131, 85–97. [Google Scholar]
- Wang, Q.J.; Zhao, G.X.; Liu, Y.L.; Zhang, P.Y.; Cai, J. Effects of vegetation types on yield of surface runoff and sediment, loss of nitrogen and phosphorus along loess slope land. Trans. Chin. Soc. Agric. Eng. 2016, 14, 195–201. [Google Scholar]
- Carroll, C.; Merton, L.; Burger, P. Impact of vegetative cover and slope on runoff, erosion, and water quality for field plots on a range of soil and spoil materials on central Queensland coal mines. Aust. J. Soil Res. 2000, 38, 313–328. [Google Scholar] [CrossRef]
- Li, H.T.; Zhao, Y.J.; Li, G.R.; Hu, X.S.; Lu, H.J.; Zhu, H.L. Experimental research on slope protection with vegetation under situ rainfall simulation in cold and arid environment of loess area. Res. Soil & Water Conserv. 2014, 6, 304–311. [Google Scholar]
- Chen, S.X.; Shen, Y. Simulation analysis on soil Infiltration characteristics under main vegetation types in Huangpu river source region. Res. Soil Water Conversat. 2016, 23, 59–63. [Google Scholar]
- Garciaestringana, P.; Alonso-blaquez, N.; Marques, M.J. Direct and indirect effects of Mediterranean vegetation on runoff and soil loss. Eur. J. Soil Sci. 2010, 61, 174–185. [Google Scholar] [CrossRef]
- Mutuku, D.; Kaniri, H.; Ndufa, J.; Kiama, S.; Mware, M. Influence of Vegetation Cover and Topographic Position on Water Infiltration, Organic Matter Content and Aggregate Stability of Grassland Soils in Semi-Arid Kenya. Adv. Agric. Sci. 2019, 7, 1–17. [Google Scholar]
- Li, J.; Liu, S.; Fu, B.; Wang, J. Dissolved carbon fluzes in a vegetation restoration area of an eroding landscape. Water Res. 2019, 152, 106–116. [Google Scholar] [CrossRef]
- Miyata, S.; Gomi, T.; Sidle, R.C.; Hiraoka, M.; Onda, Y.; Yamamoto, K.; Nonoda, T. Assessing spatially distributed infiltration capacity to evaluate storm runoff in forested catchments: Implications for hydrological connectivity. Sci. Total Environ. 2019, 699, 148–159. [Google Scholar] [CrossRef]
- Sidle, R.C.; Gomi, T.; Loaiza Usuga, J.C.; Jarihani, B. Hydrogeomorphic processes and scaling issues in the continuum from soil pedons to catchments. Earth Sci. Rev. 2017, 175, 75–96. [Google Scholar] [CrossRef]
- NG Charles, W.W.; Lu, B.W.; Ni, J.J.; Chen, Y.M.; Chen, R.; Guo, H.W. Effects of vegetation type on water infiltration in a three-layer cover system using recycled concrete. J. Zhejiang Univ. Sci. A 2019, 20, 1–9. [Google Scholar] [CrossRef]
- Gu, C.; Mu, X.; Gao, P.; Zhao, G.; Sun, W.; Tan, X. Distinguishing the effects of vegetation restoration on runoff and sediment generation on simulated rainfall on the hillslopes of the loess plateau of China. Plant Soil 2019, 447, 393–412. [Google Scholar] [CrossRef]
- Salem, N.B.; Alvarez, S.; Lopez-Vicente, M. Soil and Water Conservation in Rainfed Vineyards with common sainfoin and spontaneous vegetation under different ground conditions. Water 2018, 10, 1058. [Google Scholar] [CrossRef]
- Guzha, A.C.; Rufino, M.C.; Okoth, S.; Jacobs, S.; Nobrega, R.L.B. Impacts of land use and land cover change on surface runoff, discharge and low flows: Evidence from East Africa. J. Hydrol. Reg. Stud. 2018, 15, 49–67. [Google Scholar] [CrossRef]
- Mattsson, T.; Lehtoranta, J.; Ekholm, P.; Palviainen, M.; Kortelainen, P. Runoff changes have a land cover specific effect on the seasonal fluxes of terminal electron acceptors in the boreal catchments. Sci. Total Environ. 2017, 601–602, 946–958. [Google Scholar] [CrossRef] [PubMed]
- Fernandez, C.; Fonturbel, T.; Vega, J.A. Wildfire burned soil organic horizon contribution to runoff and infiltration in a Pinus pinaster forest soil. J. For. Res.-Jpn. 2019, 24, 86–92. [Google Scholar] [CrossRef]
- Ohana-Levi, N.; Givati, A.; Paz-Kagan, T.; Karnieli, A. Forest composition effect on wildfire pattern and runoff regime in a Mediterranean watershed. Ecohydrology 2017, 11, e1936. [Google Scholar] [CrossRef]
- Etehadi Abari, M.; Majnounian, B.; Malekian, A.; Jourgholami, M. Effects of forest harvesting on runoff an sediment characteristics in the Hyrcanian forests, northern Iran. Eur. J. For. Res. 2017, 136, 375–386. [Google Scholar] [CrossRef]
- Christoph, M.; Gertraud, M.; Klaus, K. Comparison of the results of a small-plot and a large-plot rainfall simulator-Effects of land use and land cover on surface runoff in Alpine catchments. Catena 2017, 156, 184–196. [Google Scholar]
- Li, R.; Shangguan, Z.P.; Liu, B.Y.; Zheng, F.L.; Yang, Q.K. Advances of soil erosion research during the past 60 years in China. Sci. Soil Water Conserv. 2009, 7, 1–6. [Google Scholar]
- Gumiere, S.J.; Bissonnais, Y.L.; Raclot, D. Vegetated filter effects on sedimentological connectivity of agricultural catchments in erosion modelling: A review. Earth Surf. Proc. Land. 2011, 36, 3–19. [Google Scholar] [CrossRef]
- Liu, Z.Q. Study on the Hydrological and Ecological Functions of Forest in the Typical Small Watershed of Yunnan Plateau. Ph.D. Thesis, Kunming University of Science and Technology, Kunming, China, 2014. [Google Scholar]
- Zhang, X.M.; Yu, X.X.; Wu, S.H.; Wei, T.X.; Zhang, X.P. Effects of forest vegetation on runoff and sediment production on sloping lands of Loess area. Chin. J. Appl. Ecol. 2005, 16, 1613–1617. [Google Scholar] [CrossRef]
- Yu, D.F.; Dai, Q.H.; Wang, Q.H.; Xian, B. Effects of contour grass hedges on soil and water losses of sloping cropland in Beijing. Trans. Chin. Soc. Agric. Eng. 2010, 26, 89–96. [Google Scholar]
- Atucha, A.; Merwin, I.A.; Brown, M.G. Soil erosion, runoff and nutrient losses in an avocado (Persea americana Mill) hillside orchard under different groundcover management systems. Plant Soil 2013, 368, 393–406. [Google Scholar] [CrossRef]
- Lenka, N.K.; Satapathy, K.K.; Lal, R. Weed strip management for minimizing soil erosion and enhancing productivity in the sloping lands of north-eastern India. Soil Till. Res. 2017, 170, 104–113. [Google Scholar] [CrossRef]
- Wang, X.X.; Sun, Y.M.; Hu, Y.; Zhu, Q.J. Impact of weeds on surface runoff and soil loss in a navel orange orchard. J. Weed Sci. 2019, 37, 23–28. [Google Scholar]
- Lv, T.; Liao, M.; Ye, Z.J.; Fang, Z.P.; Huang, X.H.; Zhang, Y.; Shi, H.L.; Shen, J. Characteristics of nitrogen runoff loss under different land uses in a rain collection area of the Hexi Reservoir in Changxing County. J. Agro-Environ. Sci. 2017, 36, 1369–1377. [Google Scholar]
- Hosseini, M.; Geissen, V.; González-Pelayo, O. Effects of fire occurrence and recurrence on nitrogen and phosphorus losses by overland flow in maritime pine plantations in north-central Portugal. Geoderma 2017, 289, 97–106. [Google Scholar] [CrossRef]
- Shen, Z.Y. Effects of Several Key Factors on the Migration Mechanism of Bromine and Phosphorus in Red Soil with Runoff. Master’s Thesis, Hunan Agricultural University, Changsha, China, 2014. [Google Scholar]
- Du, X.Y.; Liang, Y.Z.; Xia, Z.R.; Xia, D.; Xu, W.N.; Wang, Y.K. Soil nutrient loss characteristic of gravel soil slope on different vegetation patterns. J. Soil Water Conserv. 2017, 31, 61–67. [Google Scholar]
- Chen, X.B.; Wang, K.Q. Characteristics study of nitrogen and phosphorus runoff loss in different bamboo forests. For. Resour. Manag. 2012, 6, 105–111. [Google Scholar]
- Yang, S.; Yin, Z.; Zheng, Z.C.; Li, T.X. Characteristics of natural rainfall and sediment yield of sloping cropland of the yellow soil area in Sichuan during corn growth season. J. Soil Water Conserv. 2016, 30, 7–12. [Google Scholar]
- Zhang, X.Q.; Gu, L.B.; Zhang, K.L.; Yang, G.X.; Gu, Z.K. Impacts of slope gradient on runoff and sediment in northwest Guizhou. J. Soil Water Conserv. 2015, 29, 15–22. [Google Scholar]
- Ai, N.; Wei, T.X.; Zhu, Q.K.; Gegeng, B.T.; Qin, W.; Zhao, X.K.; Zhao, W.J.; Ma, H.; Yang, Y.J. Factors affecting slope runoff and sediment yield in northern Shaanxi Province based on path analysis. J. Beijing For. Univ. 2015, 37, 77–84. [Google Scholar]
- Lin, J.K.; Li, Z.J.; Xu, H.C.; Jiang, A.X. Effects of rainfall factors on runoff and sediment yield of runoff plots with different land use patterns in Yimeng Mountainous area. Bull. Soil Water Conserv. 2016, 30, 7–12. [Google Scholar]


© 2020 by the authors. Licensee MDPI, Basel, Switzerland. This article is an open access article distributed under the terms and conditions of the Creative Commons Attribution (CC BY) license (http://creativecommons.org/licenses/by/4.0/).