Using Resilient Modulus to Determine the Subgrade Suitability for Forest Road Construction


Abstract
:1. Introduction
2. Materials and Methods
2.1. Study Area, Samples, and Geotechnical Analysis
- eluvial rocks:
- ○
- metamorphic rocks—gneiss from the Bohemian-Moravian Highlands—siSa, grsiSa, siGr;
- ○
- igneous rocks—granites from the Bohemian-Moravian Highlands—csaCl, sagrSi, siSa, clGr;
- ○
- diagenetic lithificated sediments of sandstone, greywacke from the Nízký Jeseník Mts.—Cl, siCl, csaCl, sagrSi, grsaCl;
- ○
- Devonian limestone from the Moravian Karst—csaCl,sagrSi, clSa, siSa, siGr;
- ○
- Paleogenic diagenetic lithificated sediments of the flysch belt from the Beskydy Mts.—Cl, grsaCl;
- sediments:
- ○
- cretaceous clays and sands from the Drahanská Highland—Cl, siCl, saclSi;
- ○
- Neogenic and Quarternary clays of the Lower Morava Valley—saciSi, csaCl, grsaCl.
2.2. Laboratory Analysis—Cyclic CBR Tests
2.3. Statistical Analysis
3. Results
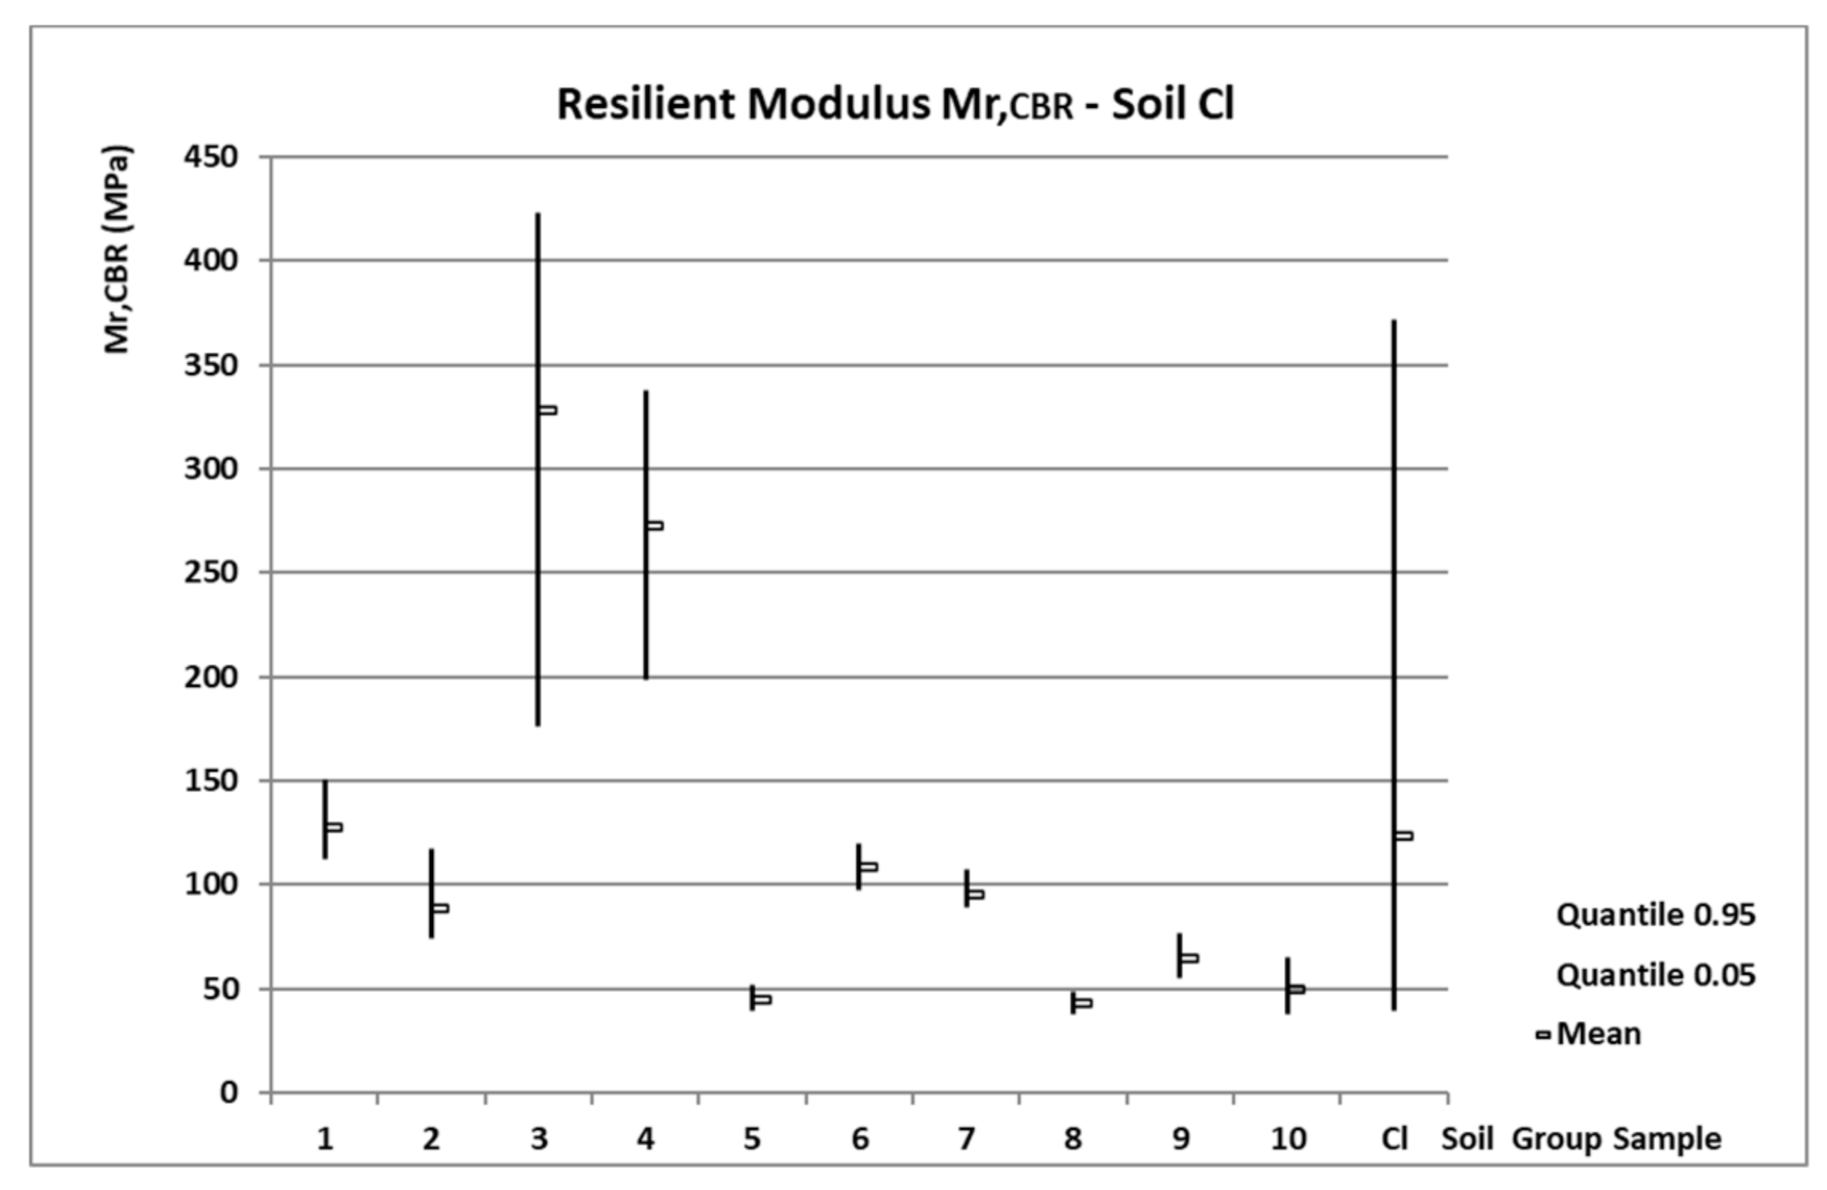
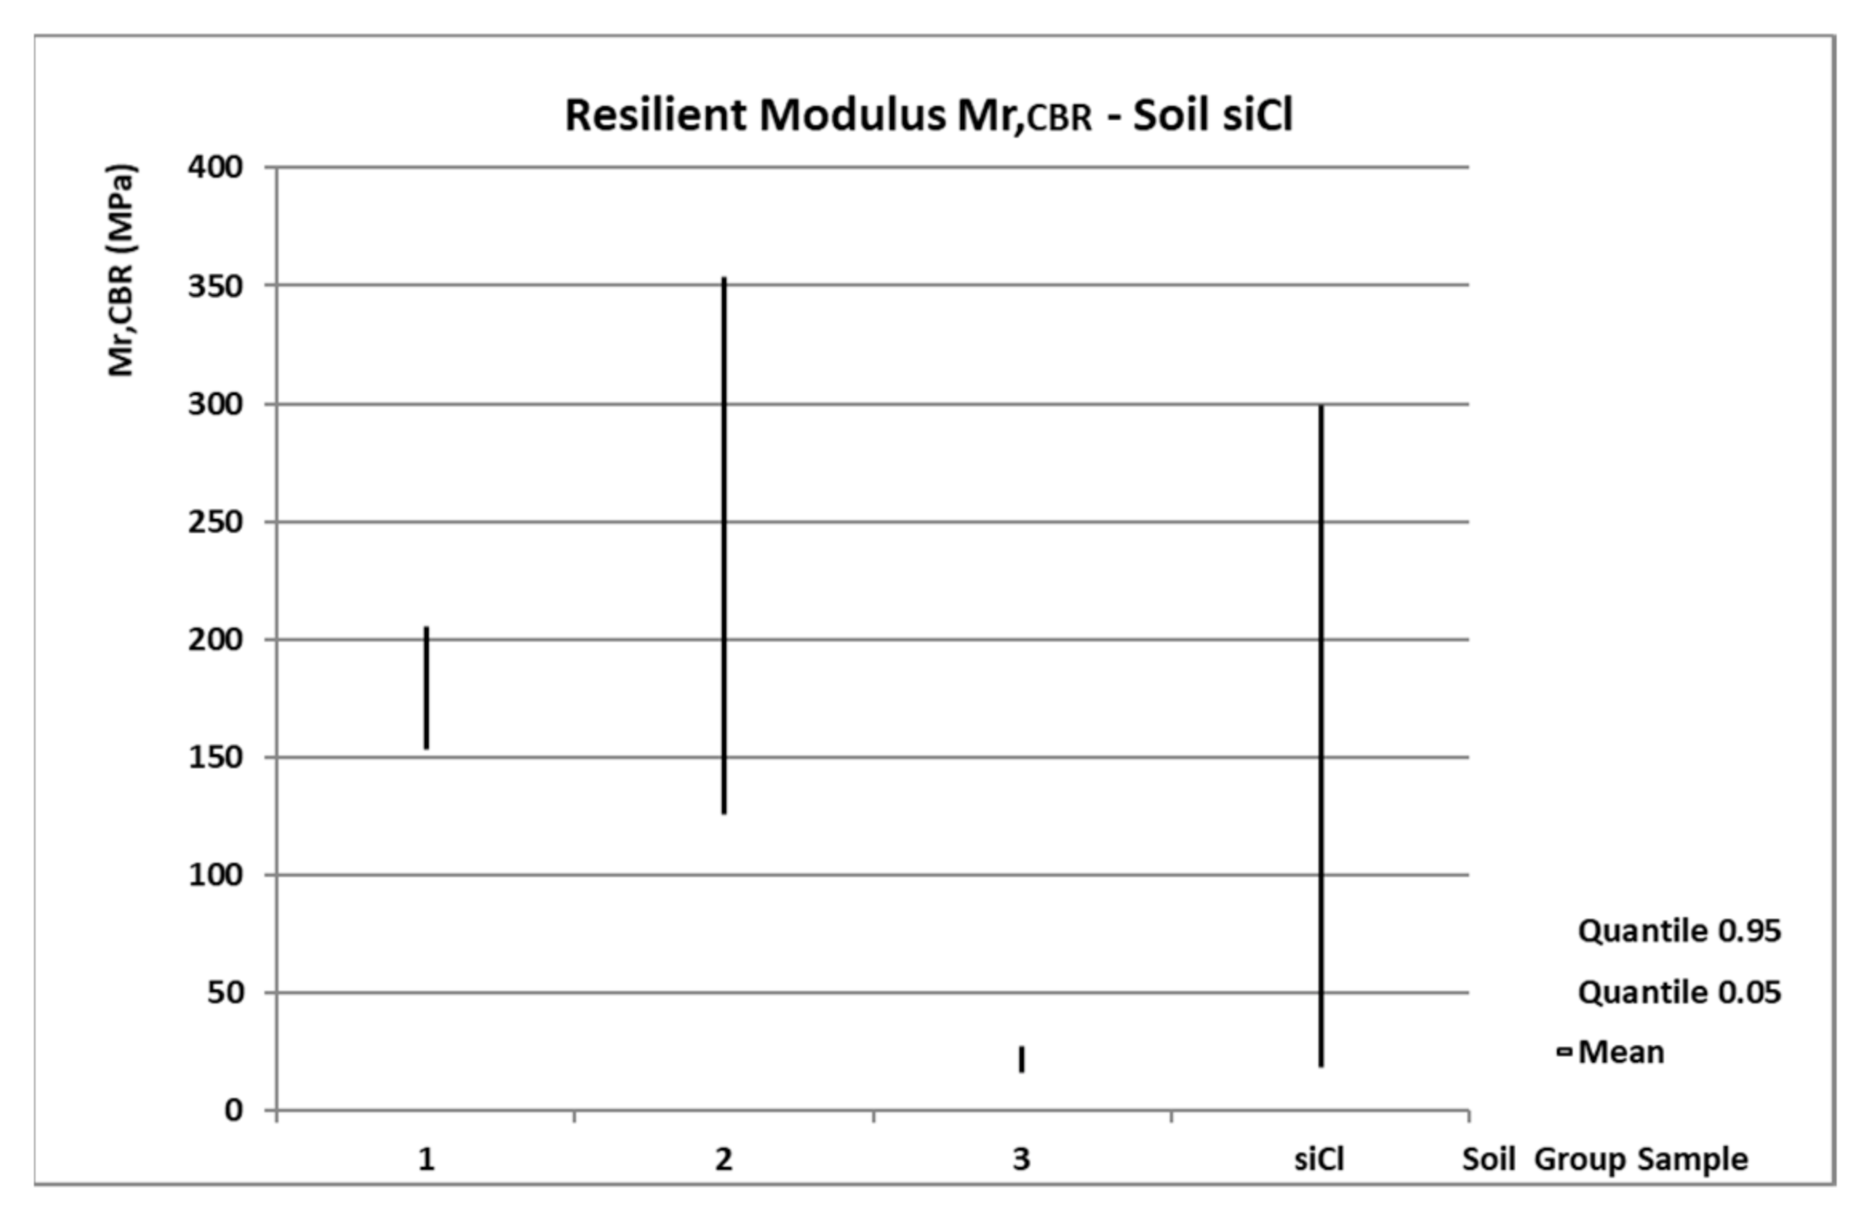
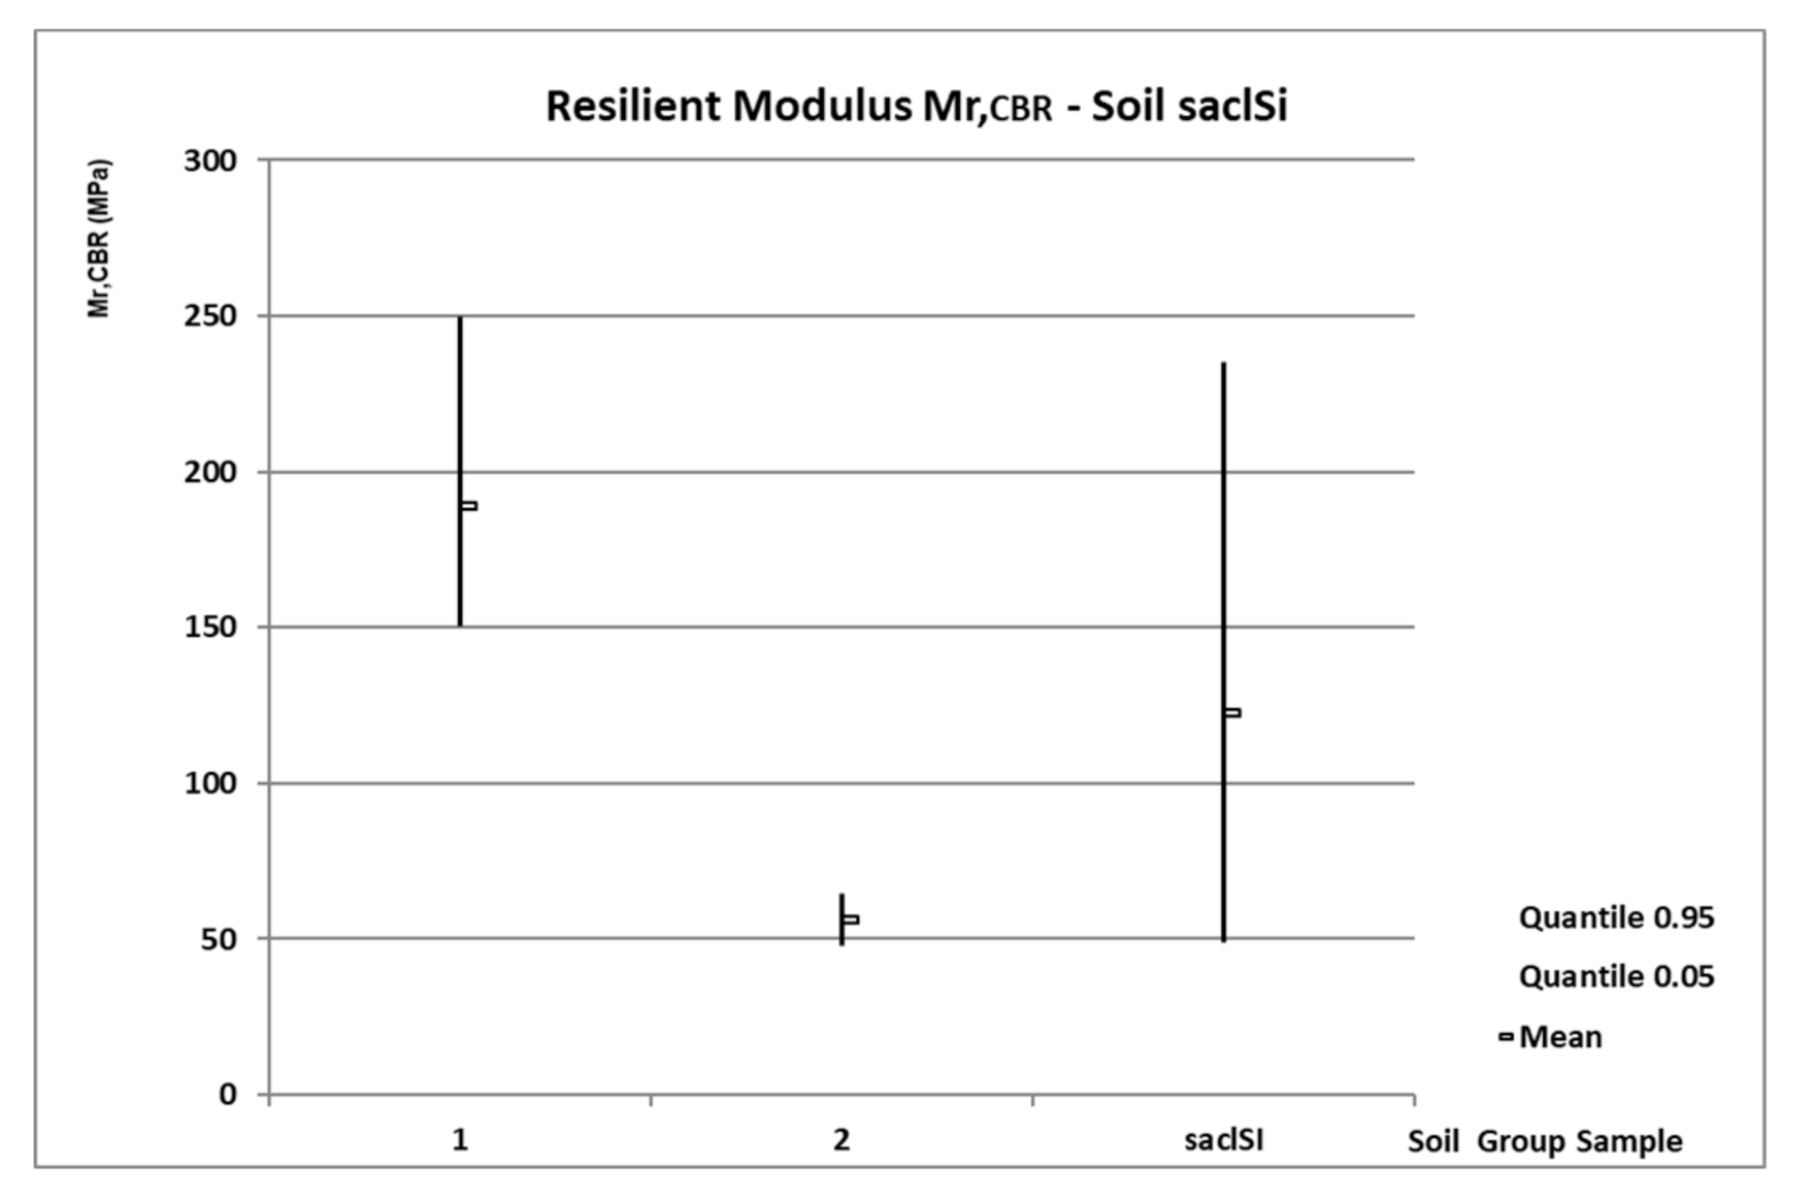
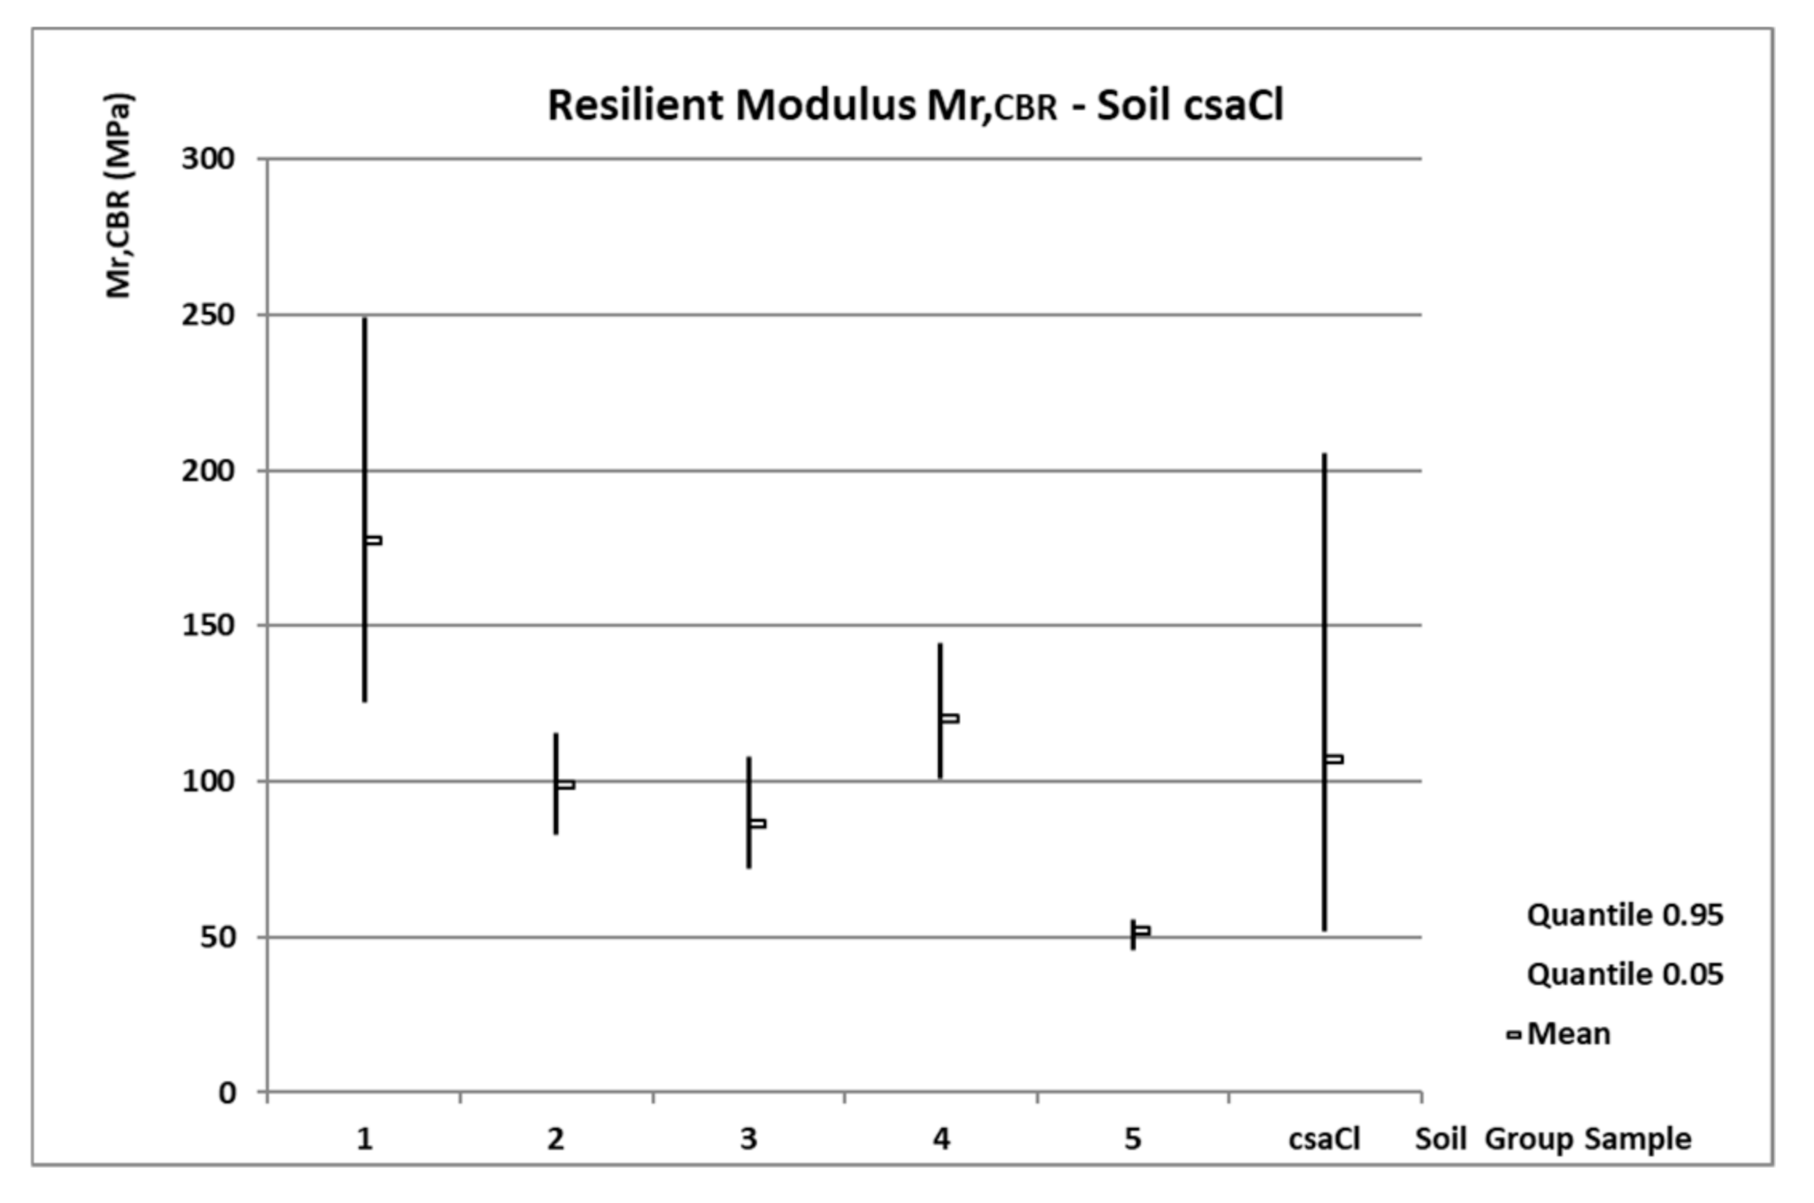
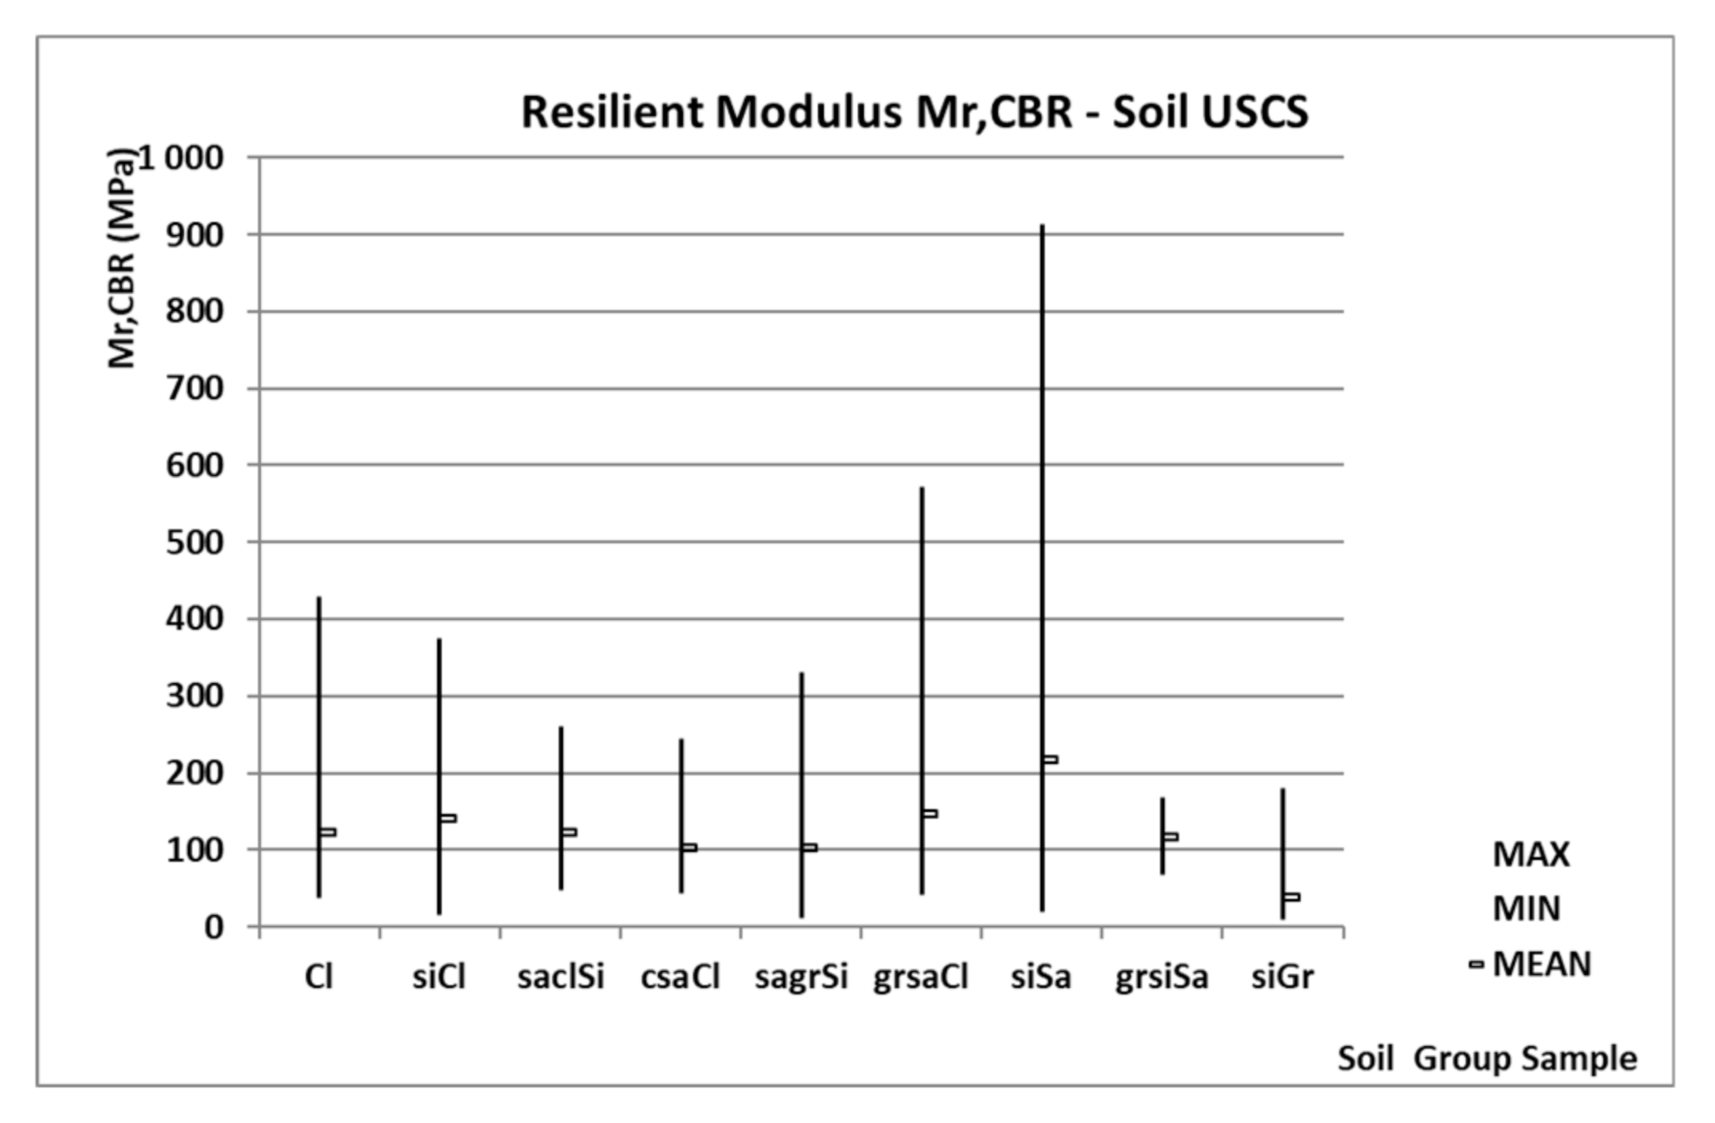
3.1. Statistical Results Mr,CBR from the Cycle Test
- Soil N°1—Cl
- Soil N°2—siCl
- Soil N°3—saclSi
- Soil N°4—csaCl
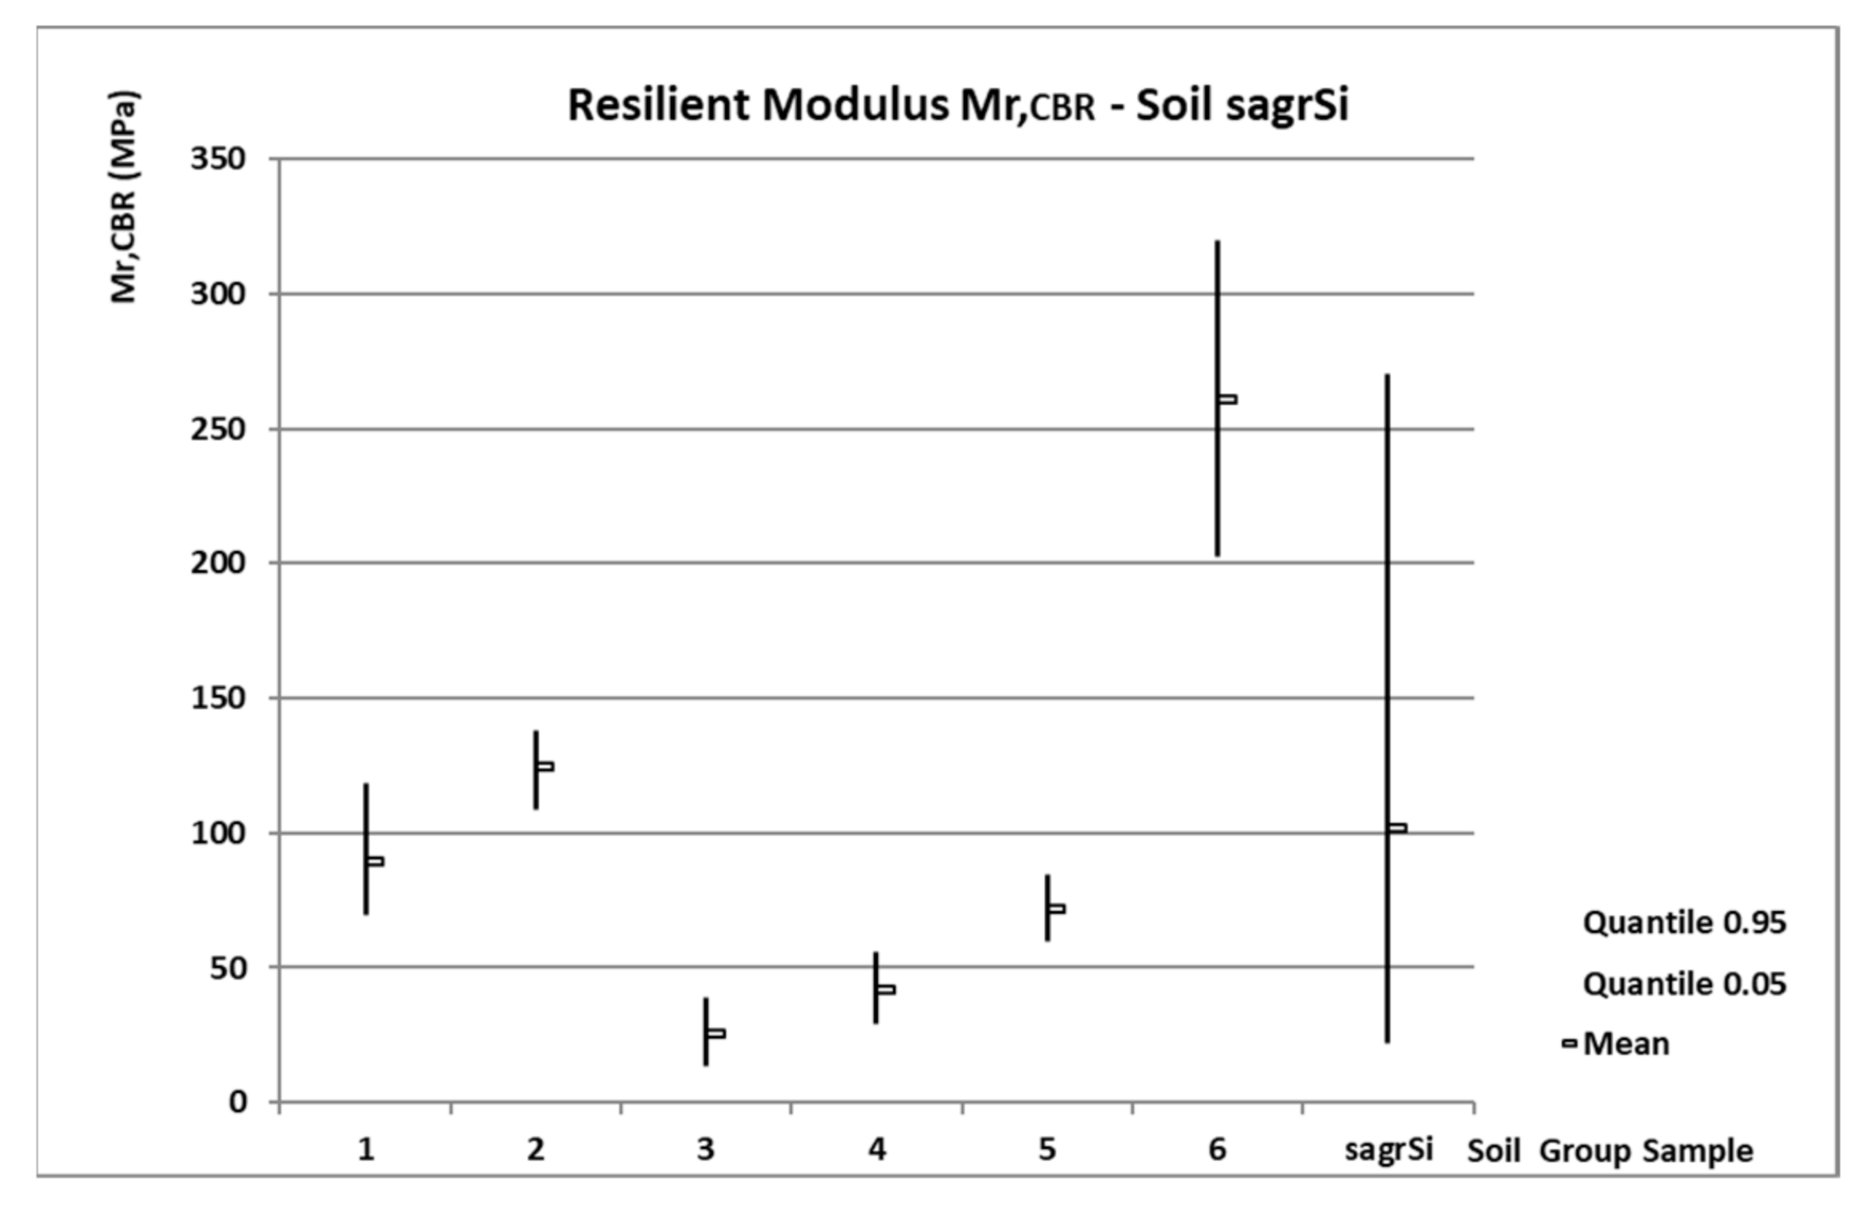
- Soil N°5—sagrSi
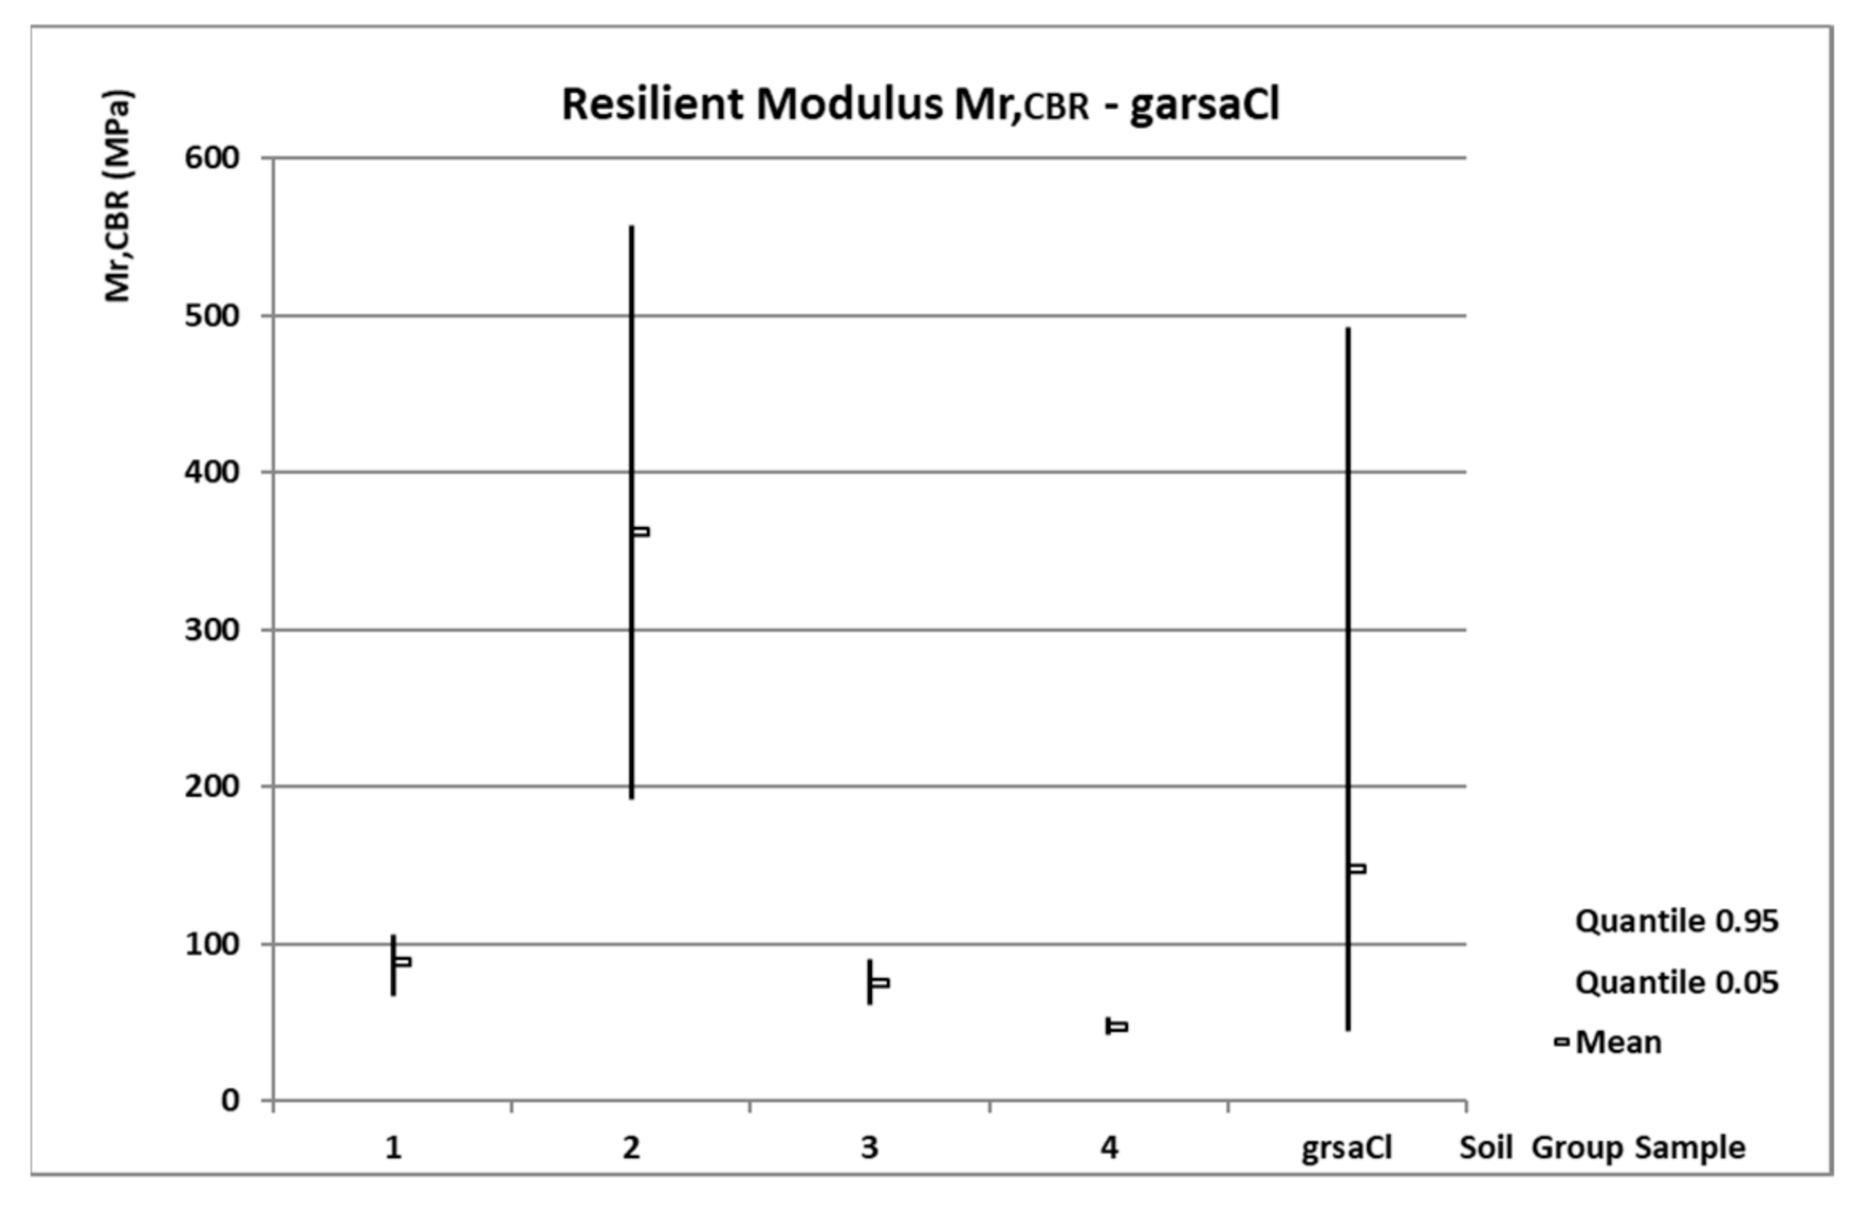
- Soil N°6—grsaCl
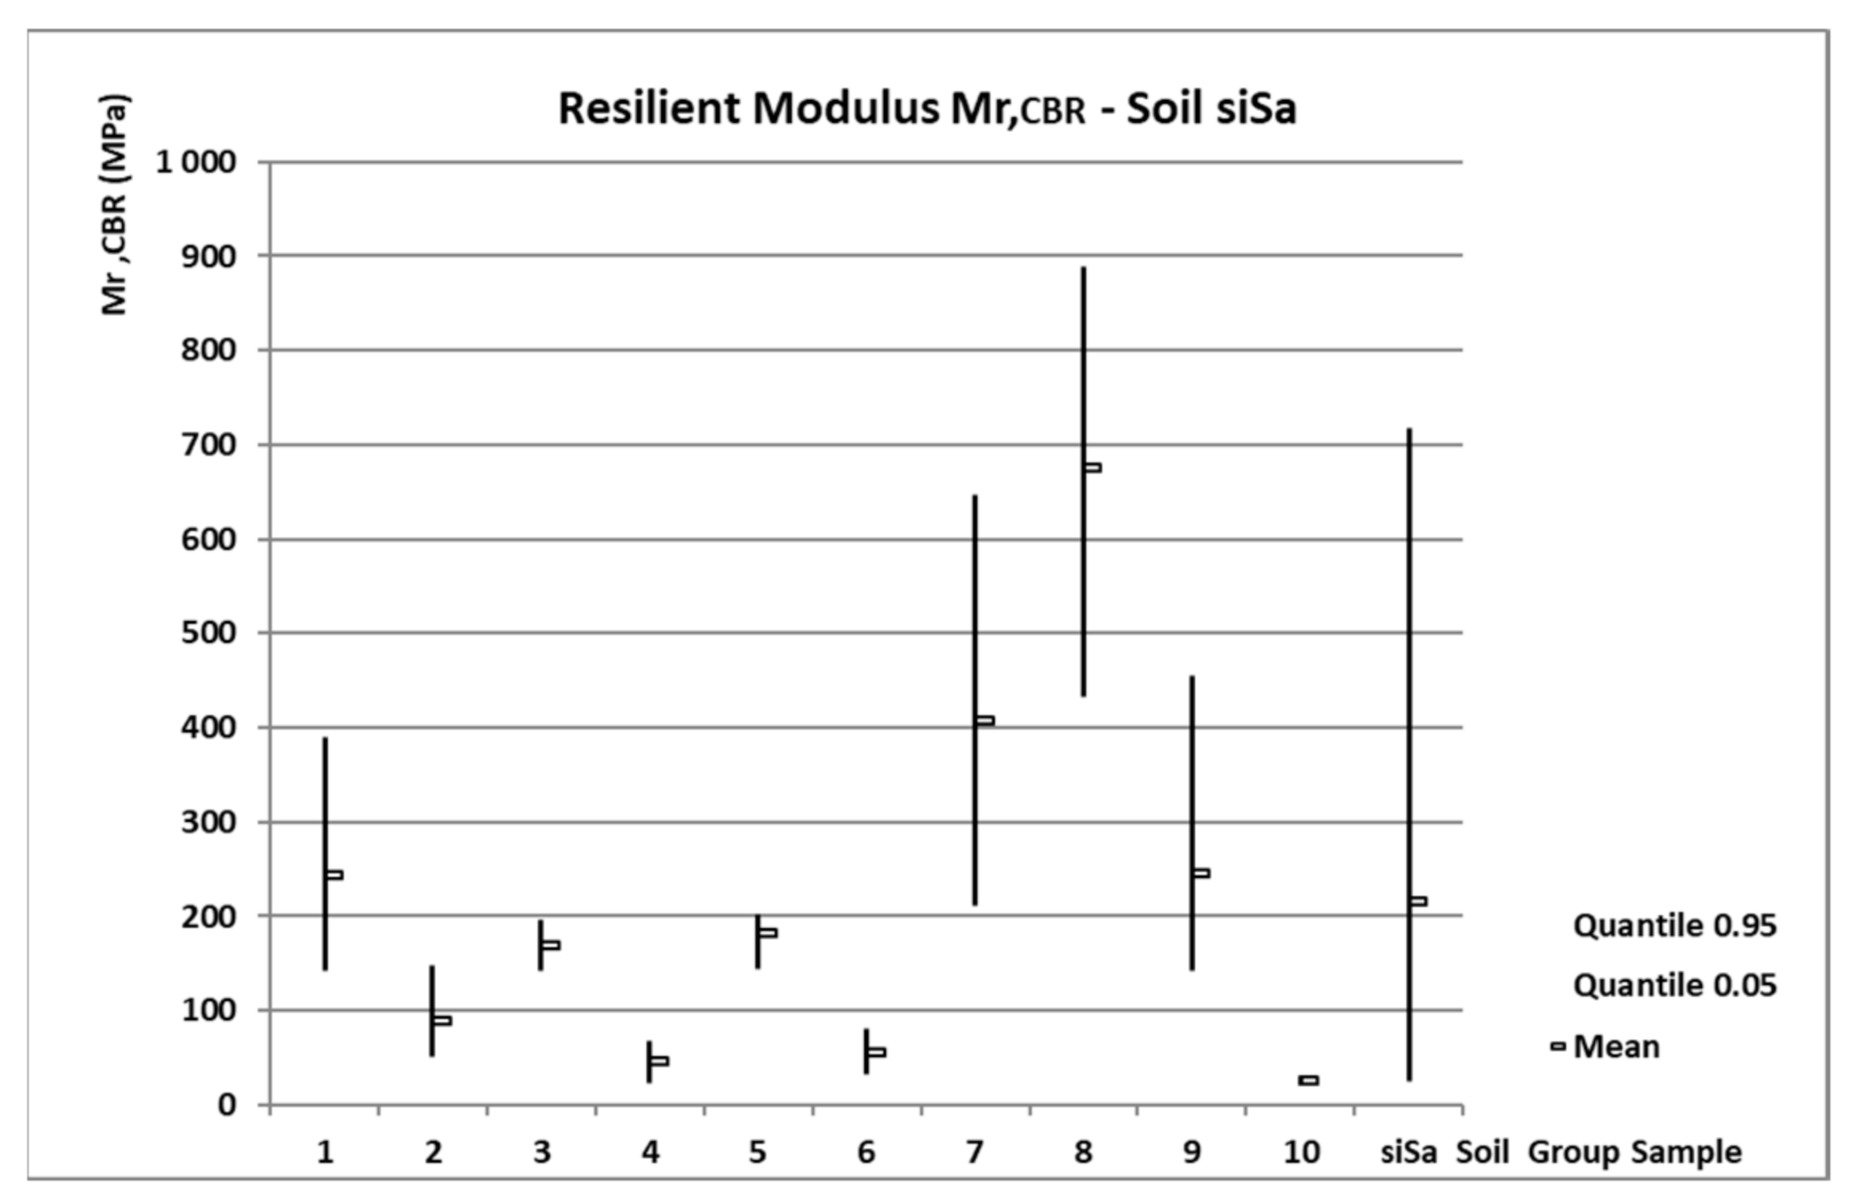
- Soil N°7—siSa
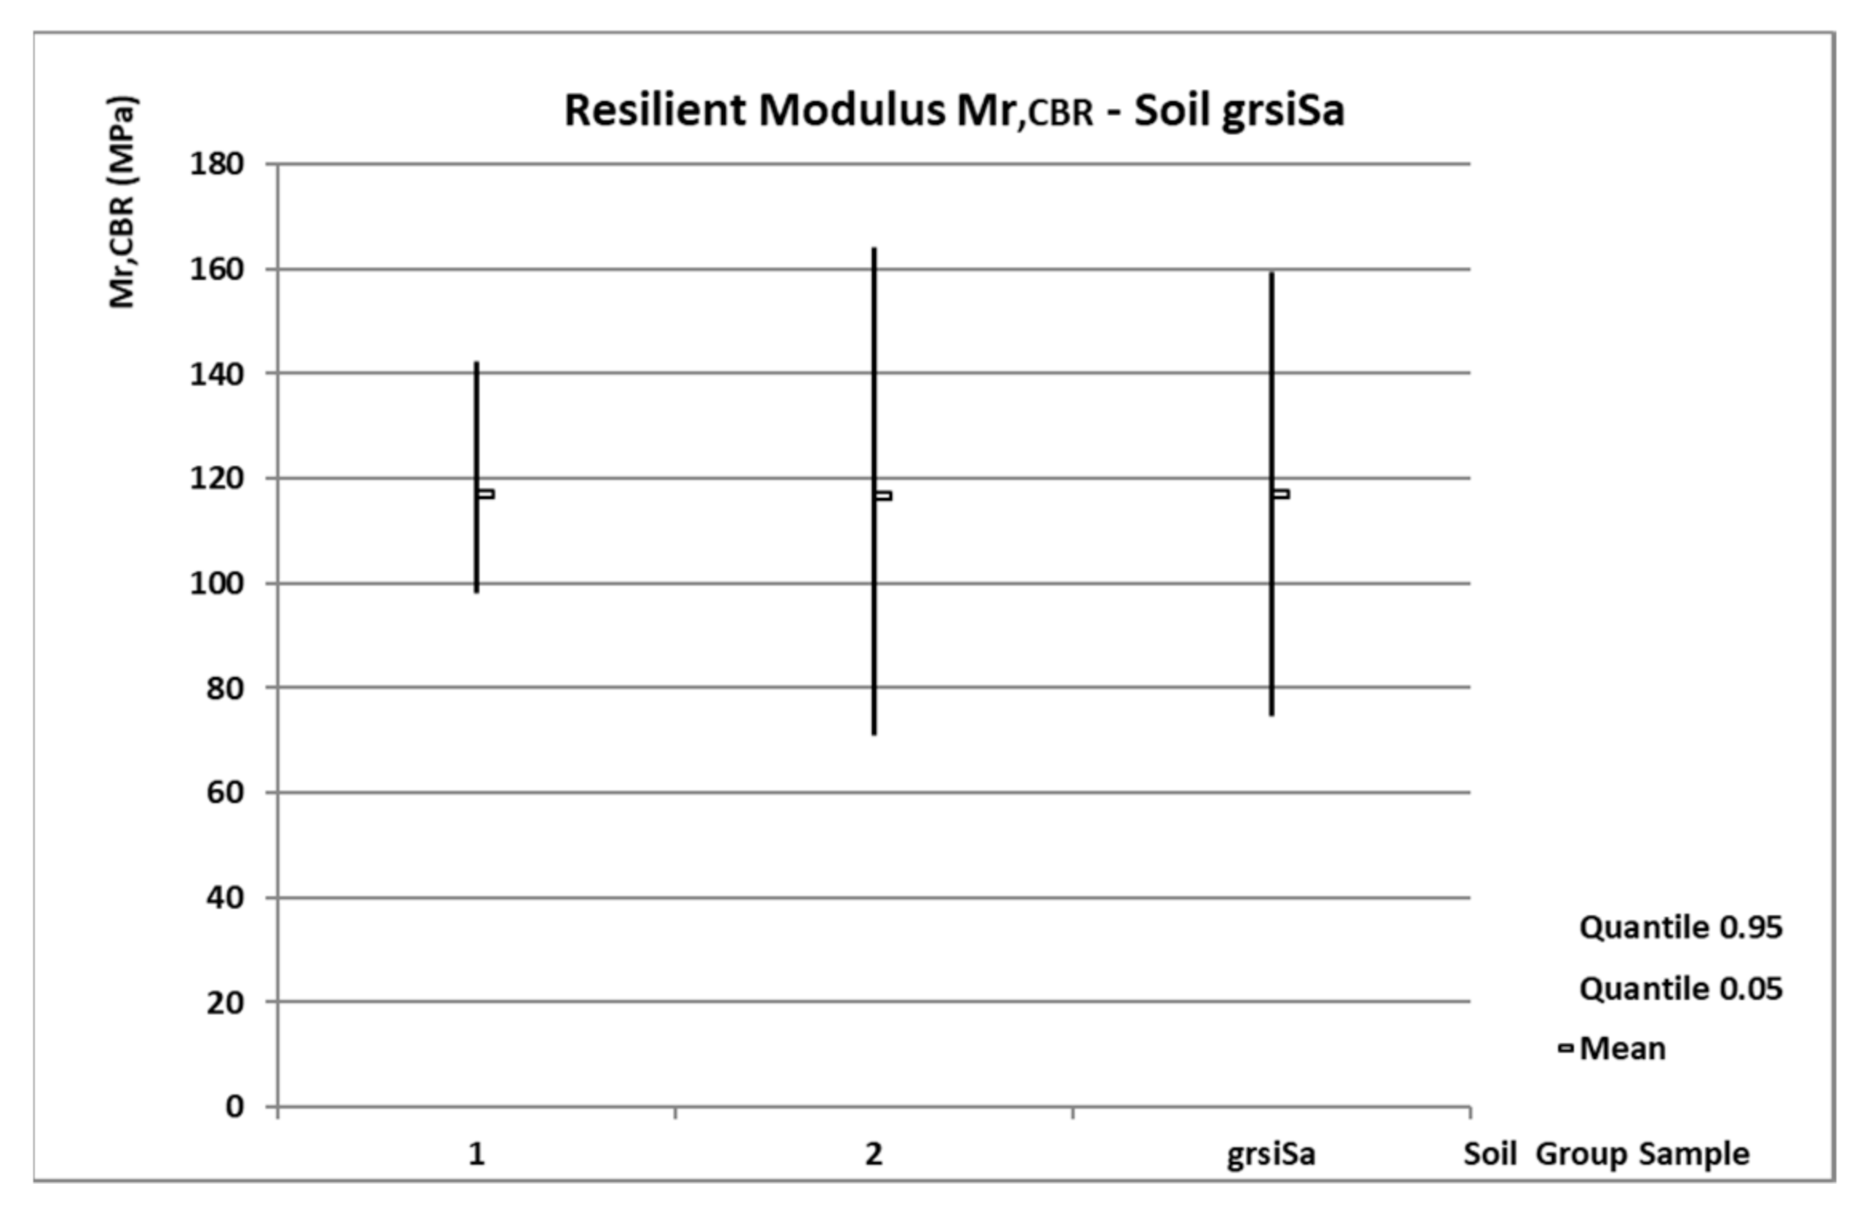
- Soil N°8—grsiSa
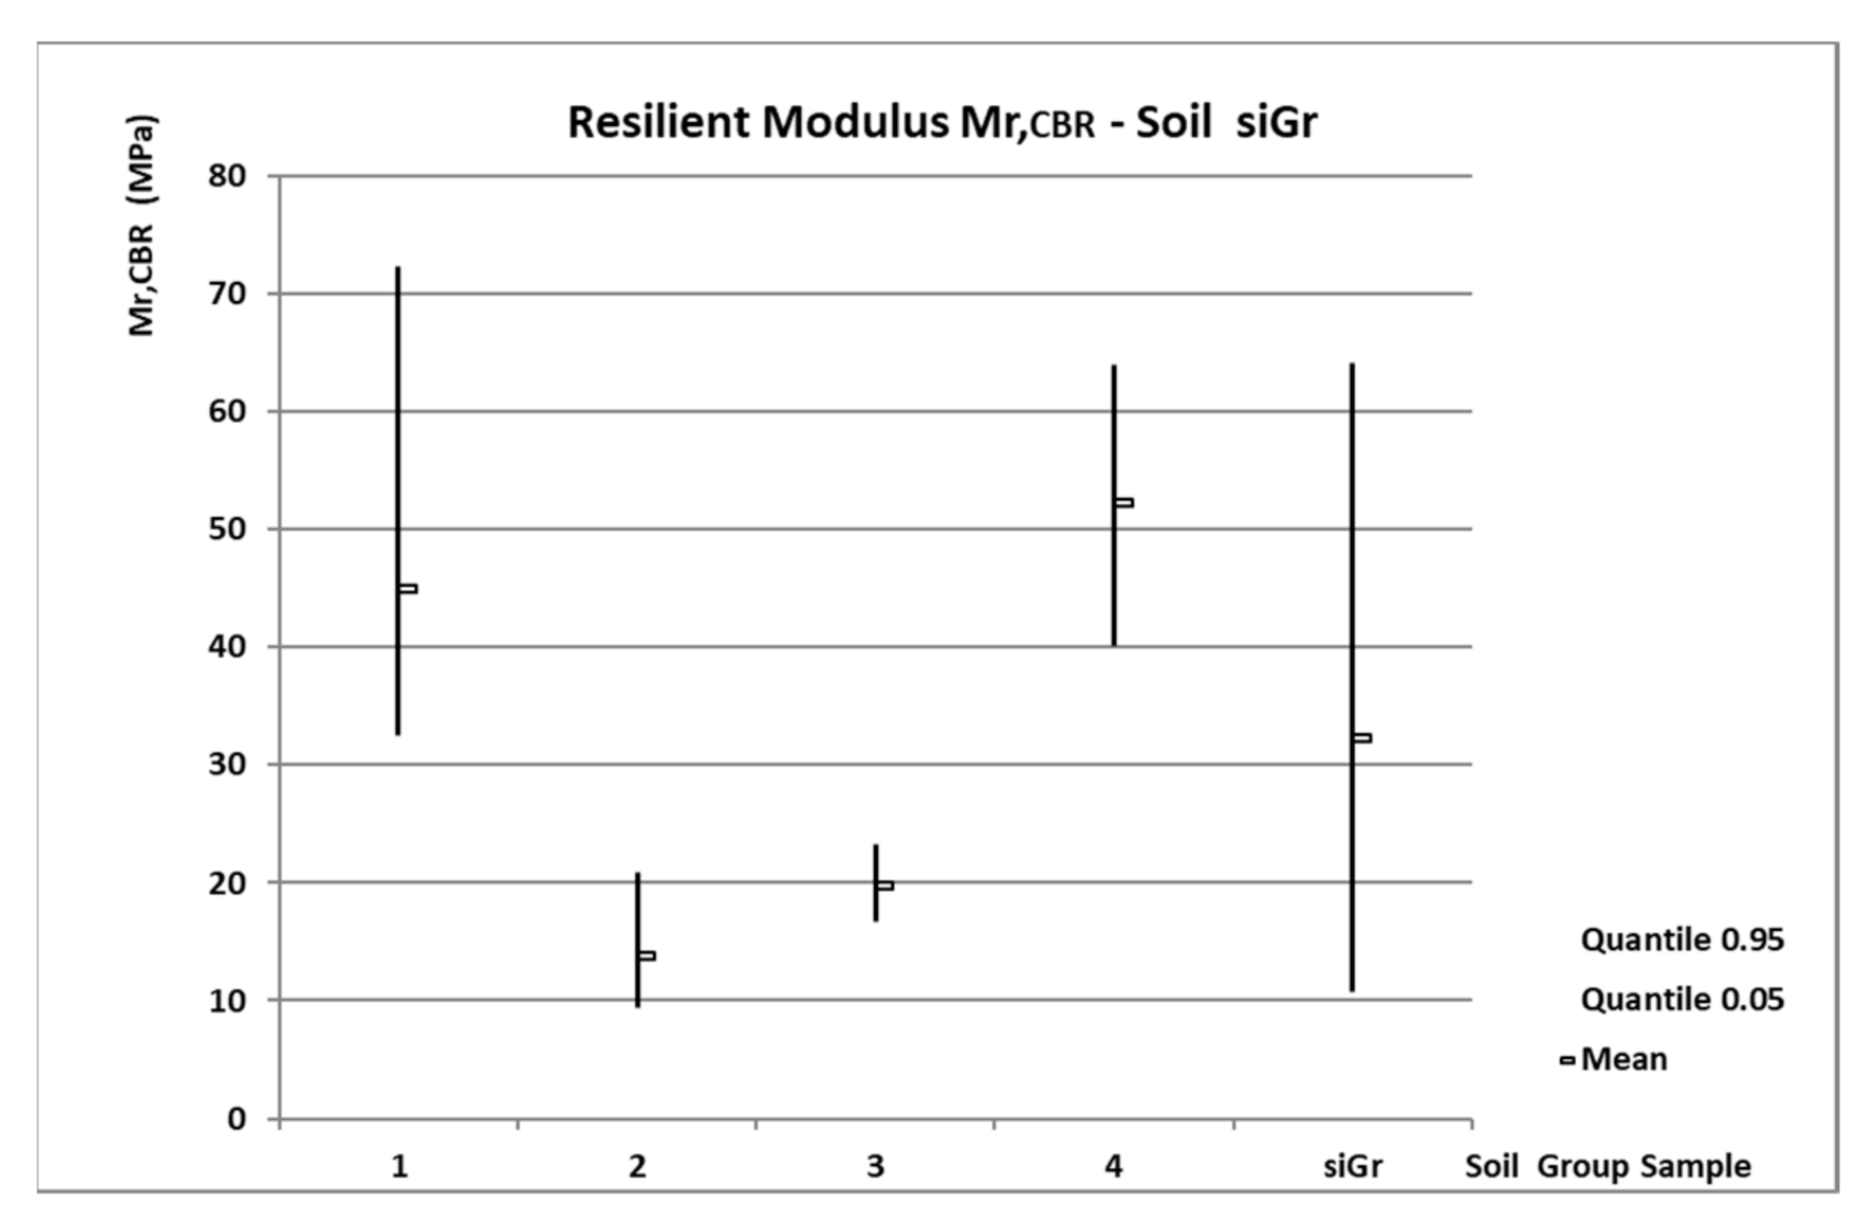
- Soil N°9—siGr
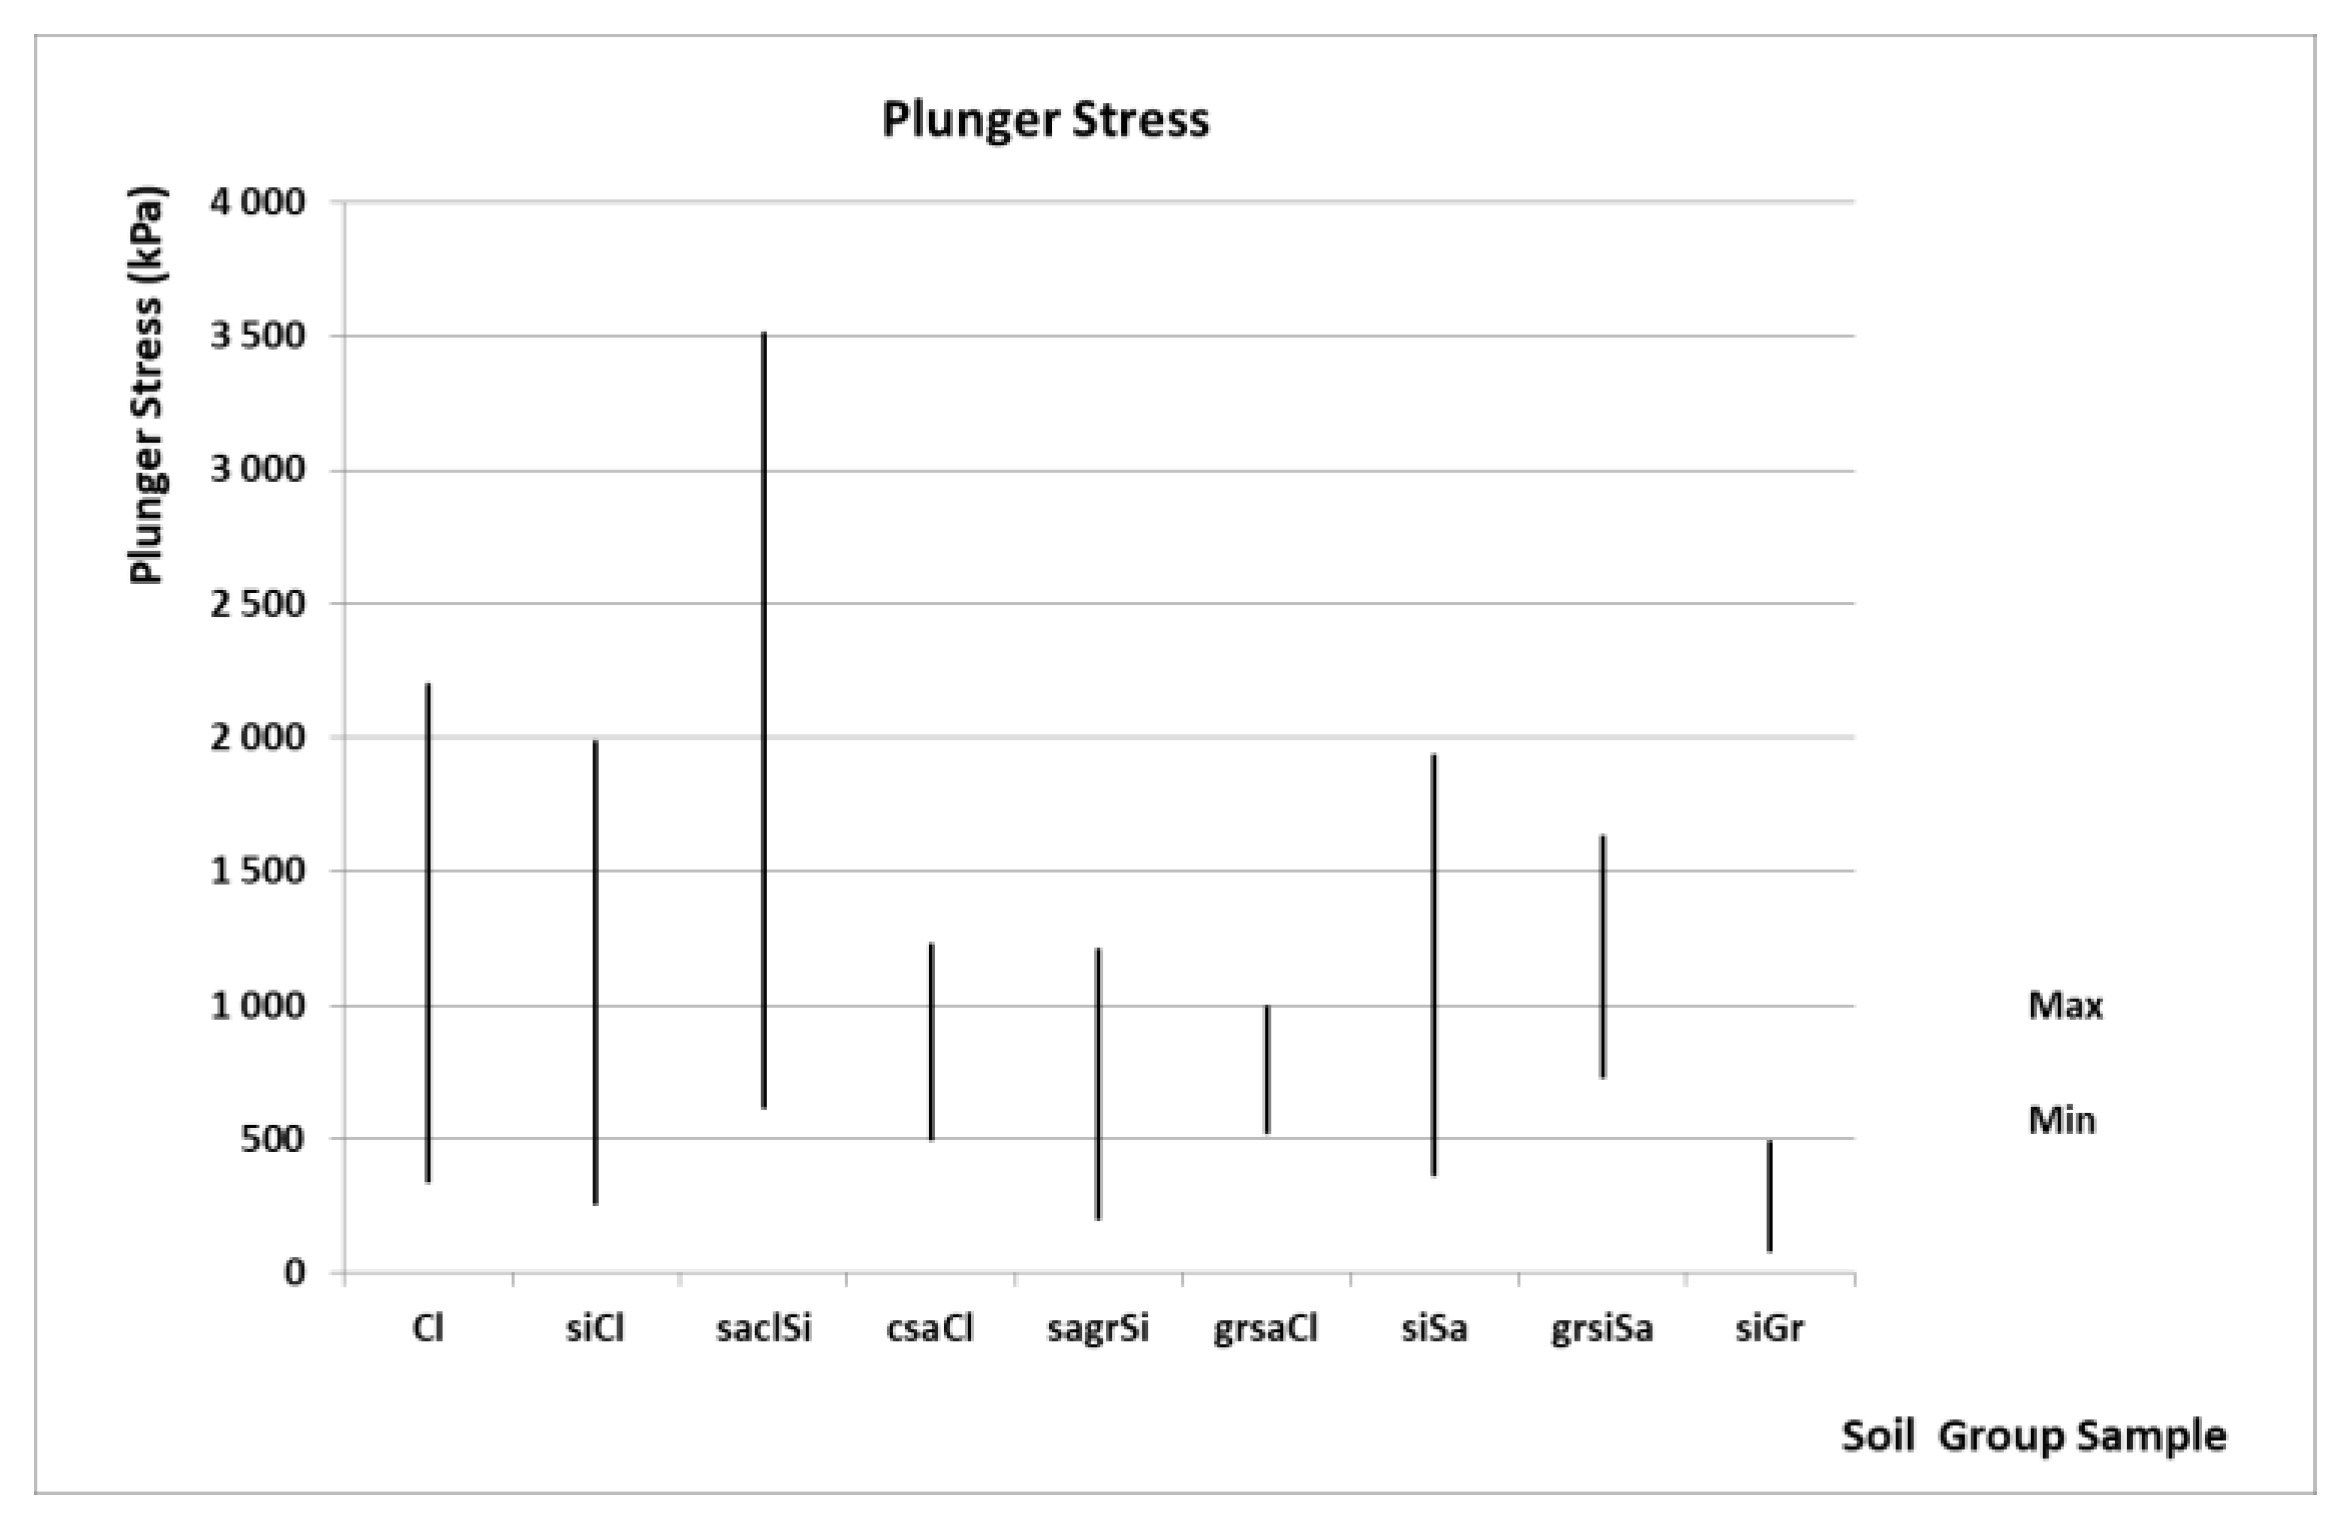
3.2. Results of Plunger Stress in CBR Cyclic Test Analysis
- Soil N°1—Cl
- Soil 2—siCl
- Soil 3—saclSi
- Soil 4—csaCl
- Soil 5—sagrSi
- Soil 6—grsaCl
- Soil 7—siSa
- Soil 8—grsiSa
- Soil 9—siGr
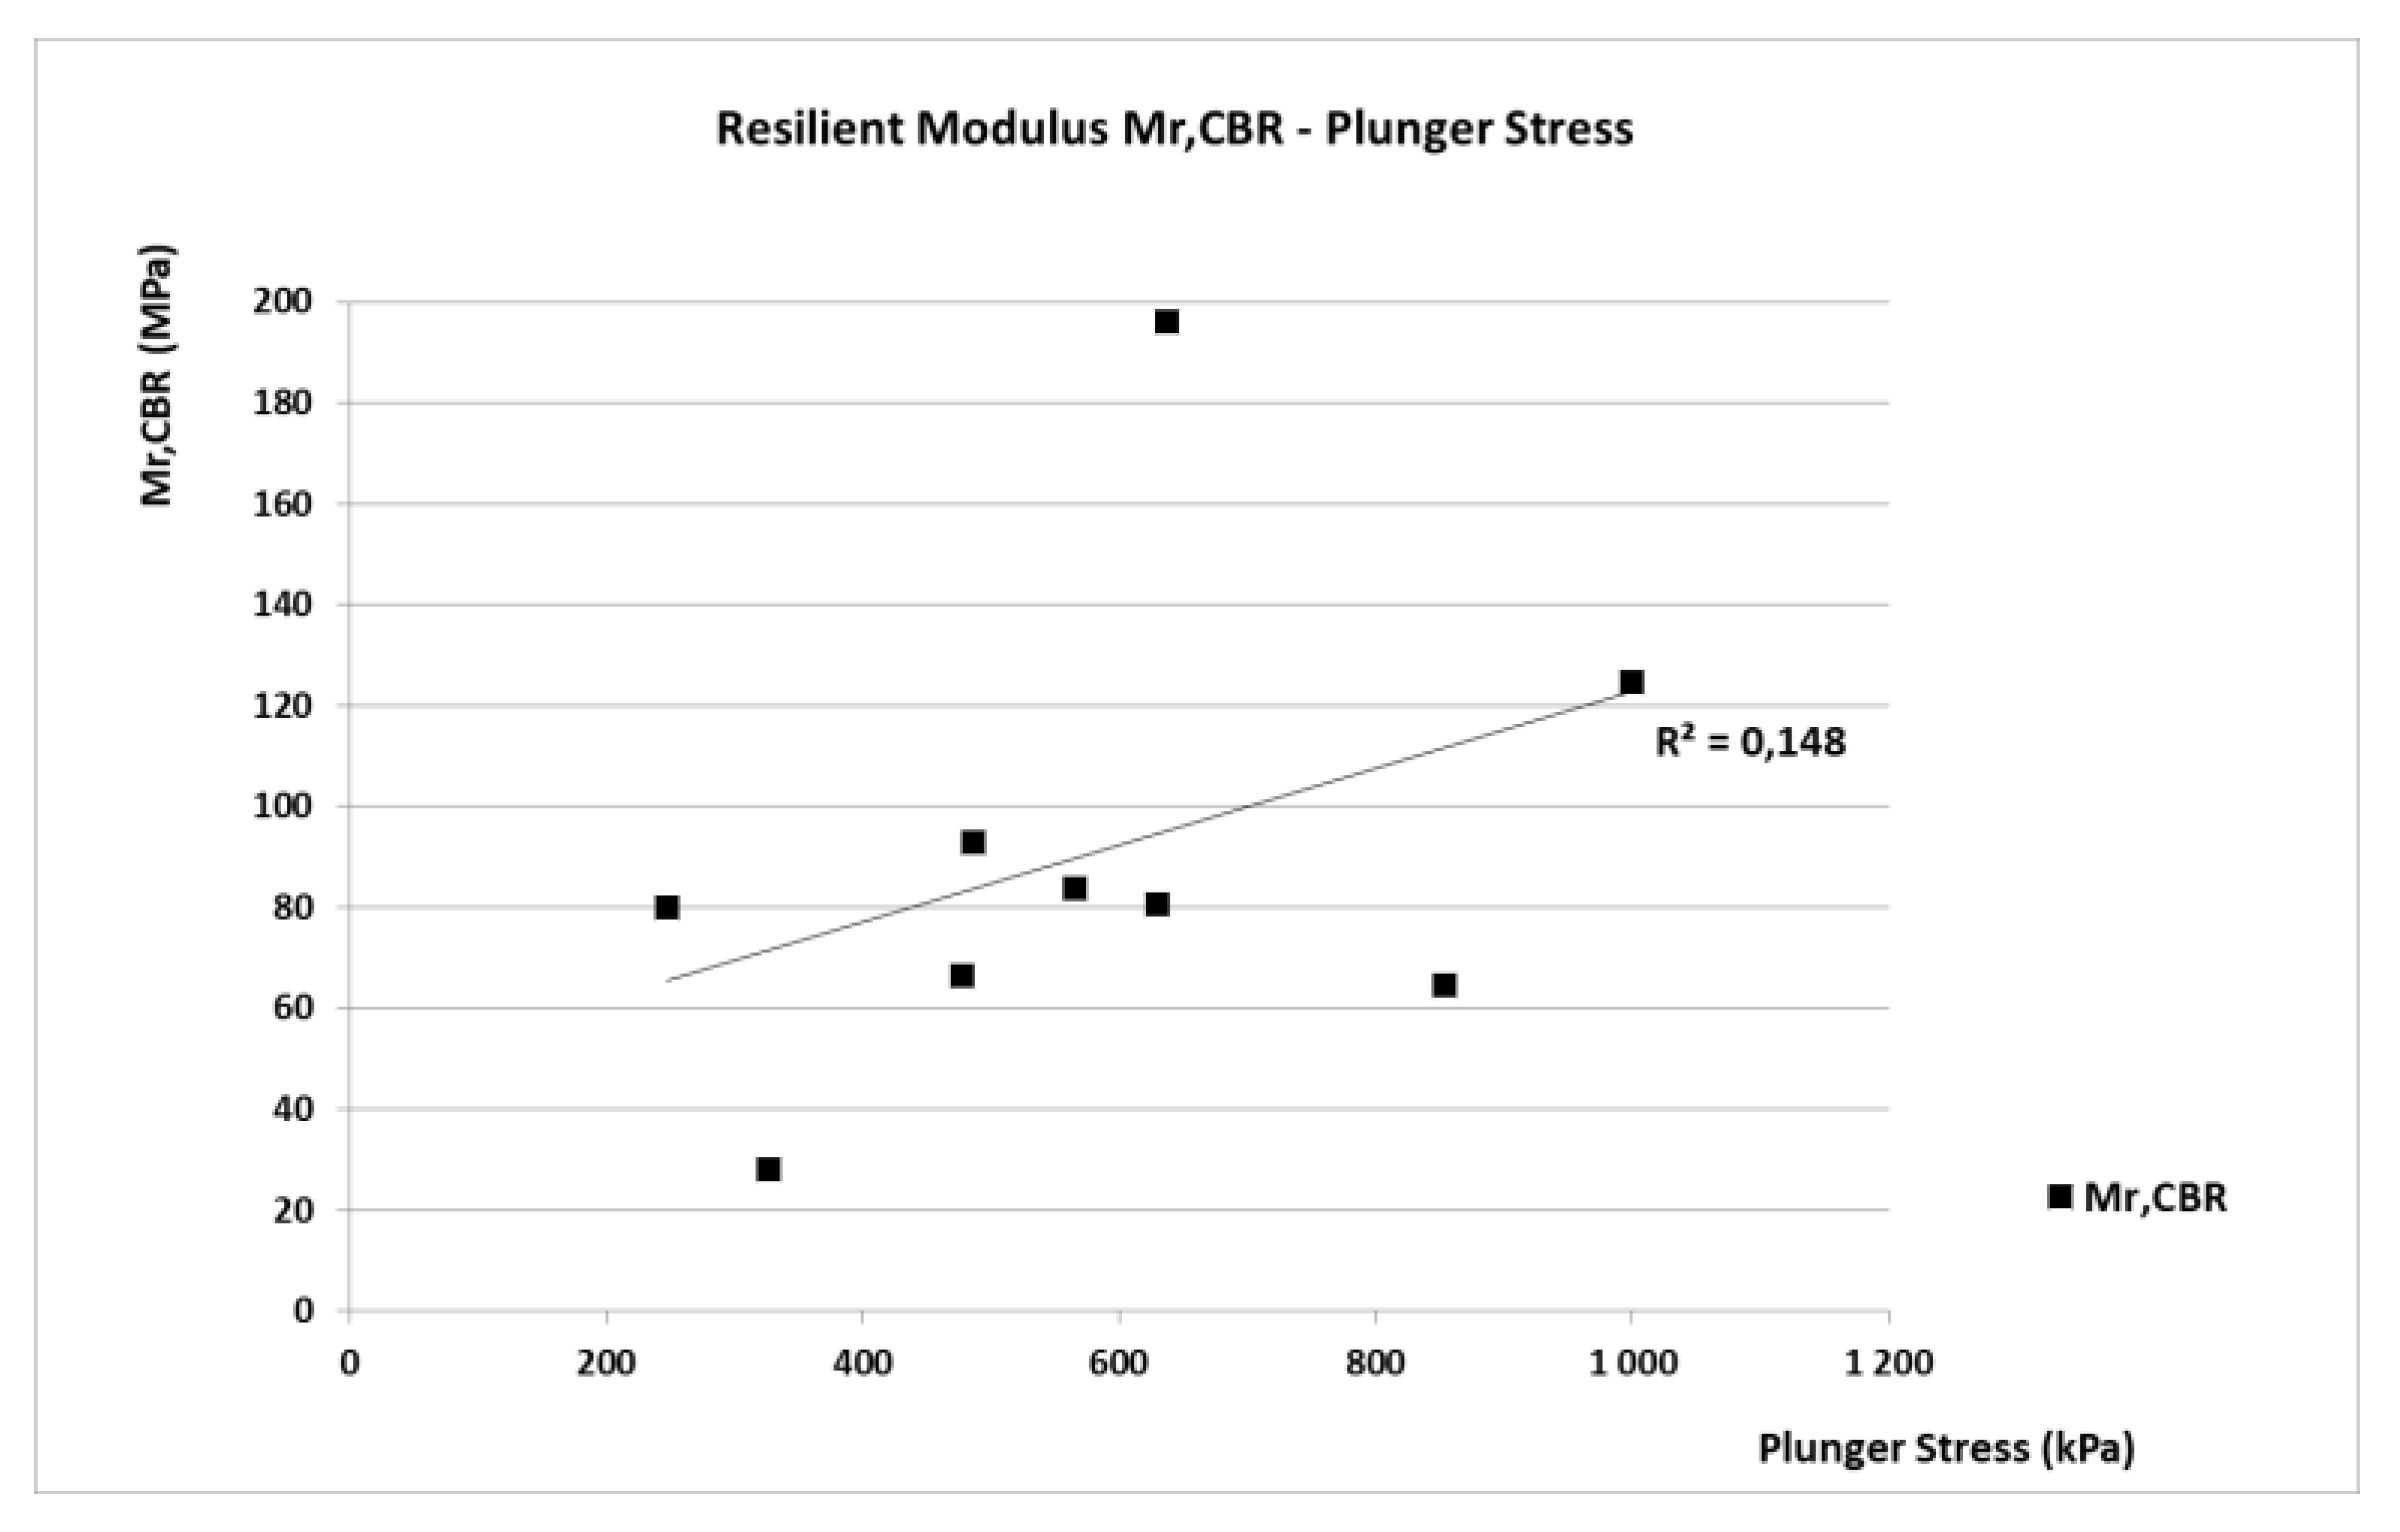
4. Discussion
5. Conclusions
Author Contributions
Funding
Acknowledgments
Conflicts of Interest
References
- AASHTO. Guidelines for Geometric Design of Very Low-Volume Local Roads; American Association of State Highway and Transportation Officials: Washington, DC, USA, 2001. [Google Scholar]
- Ševelová, L.; Arias, P.F.; Šlezinger, M. Influence of Improving Materials of Forest Roads on Surrounding Environment. Pol. J. Environ. Stud. 2020, 29, 3821–3830. [Google Scholar] [CrossRef]
- Ševelová, L.; Hauser, J.; Zedník, P.; Lažek, D.; Matula, R.; Kozumplíková, A.; Florian, A. The Methodical Guide to the Design and Implementation of Pavement of Low Volume Roads; Certified Methodology 23327/2015-MZE-16222/M108; Mendel University in Brno: Brno, Czech Republic, 2015; pp. 1–62. [Google Scholar]
- Kuloglu, T.F.; Lieffers, V.J.; Anderson, A.E. Impact of Shortened Winter Road Access on Costs of Forest Operations. Forests 2019, 10, 447. [Google Scholar] [CrossRef] [Green Version]
- TP 170. Design of Pavement Structures; Ministry of Transportation: Prague, Czech Republic, 2011.
- ČSN 73 6108. Forest Road Network; Institute for Technology Standardization, Metrology and State Testing: Prague, Czech Republic, 2016. [Google Scholar]
- AASHTO. Guide for Design of Pavement Structures; American Association of State Highway and Transportation Officials: Washington, DC, USA, 1993. [Google Scholar]
- ČSN EN ISO 13286-47. Unbound and Hydraulically Bound Mixtures—Part 47: Test Method for the Determination of California Bearing Ratio, Immediate Bearing Index and Linear Swelling; Institute for Technology Standardization, Metrology and State Testing: Prague, Czech Republic, 2015. [Google Scholar]
- AASHTO. Mechanistic-Empirical Pavement Design Guide (MEPDG); American Association of State Highway and Transportation Officials: Washington, DC, USA, 2008. [Google Scholar]
- ČSN EN 13286-7. Unbound and Hydraulically Bound Mixtures—Part 7: Cyclic Load Triaxial Test for Unbound Mixtures; Institute for Technology Standardization, Metrology and State Testing: Prague, Czech Republic, 2004. [Google Scholar]
- Rahim, A.M. Subgrade soil index properties to estimate resilient modulus for pavement design. Int. J. Pavement Eng. 2005, 6, 163–169. [Google Scholar]
- Nguyen, B.T.; Mohajerani, A. Resilient modulus of fine-grained soil and a simple testing and calculation method for determining an average resilient modulus value for pavement design. J. Transp. Geotech. 2016, 7, 59–70. [Google Scholar] [CrossRef]
- Díaz, M.M.; Peréz, I. Mechanistic-empirical pavement design guide: Features and distinctive elements. Revista Construcción 2015, 14, 32–40. [Google Scholar] [CrossRef] [Green Version]
- Ortiz De Zarate, G.; Ševelová, L. The statistical analysis of the resilient modulus. In Public Recreation and Landscape Protection—With Man Hand in Hand; Mendel University in Brno: Prague, Czech Republic, 2015; pp. 258–264. [Google Scholar]
- Molenaar, A.A.A. Repeated Load CBR Testing, a Simple but Effective Tool for the Characterization of Fine Soils and Unbound Materials; Delft University of Technology: Delft, The Netherlands, 2008. [Google Scholar]
- Ševelová, L.; Hauser, J. P304642-2014-An Automatic Control Equipment Geotechnical Equipment for Measuring Soil Bearing Capacity and Methods of Work with This Device. Industrial Property Office, Prague, Czech Republic. Available online: http://spisy.upv.cz/UtilityModels/FullDocuments/FDUM0026/uv026383.pdf (accessed on 15 November 2020).
- Florian, A.; Ševelová, L.; Žák, J. Reliability analysis of temperature influence on stresses in rigid pavement made from recycled materials. Acta Univ. Agric. Silvic. Mendel. Brun. 2016, 64, 423–432. [Google Scholar] [CrossRef] [Green Version]
- Ševelová, L.; Kozumplíková, A. The numerical model for parametric studies of forest haul roads pave-ments. Acta Univ. Agric. Silvic. Mendel. Brun. 2010, 58, 361–367. [Google Scholar]
- Jayakumar, M.; Sing, L.H. Experimental Studies on Treated Sub-base Soil with Fly Ash and Cement for Sustainable Design Recommendations. World Acad. Sci. Eng. Technol. Int. J. Civ. Environ. Eng. 2012, 6, 611–614. [Google Scholar]
- ČSN EN ISO 14688-2. Geotechnical Investigation and Testing-Identification and Classification of Soil—Part 2: Principles for a Classification; Institute for Technology Standardization, Metrology and State Testing: Prague, Czech Republic, 2005. [Google Scholar]
- ČSN EN ISO 14689-1. Geotechnical Investigation and Testing-Dentification and Classification of Rock—Part 1: Identification and Description; Institute for Technology Standardization, Metrology and State Testing: Prague, Czech Republic, 2004. [Google Scholar]
- ČSN EN ISO 13286-2. Unbound and Hydraulically Bound Mixtures—Part 2: Test Methods for the Determination of the Laboratory Reference Density and Water Content-Proctor Compaction; Institute for Technology Standardization, Metrology and State Testing: Prague, Czech Republic, 2015. [Google Scholar]
- ČSN EN ISO 17892-1. Geotechnical Investigation and Testing-Laboratory Testing of Soil—Part 1: Determination of Water Content; Institute for Technology Standardization, Metrology and State Testing: Prague, Czech Republic, 2015. [Google Scholar]
- ČSN EN ISO 17892-4. Geotechnical Investigation and Testing-Laboratory Testing of Soil—Part 4: Determination of Particle Size Distribution; Institute for Technology Standardization, Metrology and State Testing: Prague, Czech Republic, 2017. [Google Scholar]
- ČSN EN ISO 17892-12. Geotechnical Investigation and Testing-Laboratory Testing of Soil—Part 12: Determination of the Liquid and Plastic Limits; Institute for Technology Standardization, Metrology and State Testing: Prague, Czech Republic, 2018. [Google Scholar]
- Florian, A.; Ševelová, L.; Žák, J. Influence of environmental humidity on mechanical properties of natural and recycled unbound materials. Acta Univ. Agric. Silvic. Mendel. Brun. 2015, 63, 405–409. [Google Scholar]
- Hauser, J.; Ševelová, L.; Matula, R.; Zedník, P. Optimization of low volume road pavement design and construction. J. For. Sci. 2018, 64, 74–85. [Google Scholar]
- Yang, S.H.; Lin, H.D.; Kung, J.H.S.; Huang, W.H. Suction-Controlled Laboratory Test on Resilient Modulus of Unsaturated Compacted Subgrade Soils. J. Geotechn. Geoenvirom. Eng. 2008, 134, 1375–1384. [Google Scholar] [CrossRef]
- Brinch Hansen, J. A General Formula for Bearing Capacity; Bulletin No. 11; Geoteknisk Institut, Institute Akademict for de Tekniske Videuskaber: Copenhagen, Denmark, 1961. [Google Scholar]
- Hauser, J.; Kozumplíková, A.; Ševelová, L. CBR and IBI tests for practices the design of the earth body and based layers of the road construction. In Geotechnical Problems of Line Structures; Slovak University of Technology in Bratislava: Bratislava, Slovakia, 2011; pp. 101–108. [Google Scholar]
- Hauser, J.; Kozumplíková, A.; Ševelová, L. The Influence of the Soil Treatment on the CBR Test Values. In Proceedings of the International Conference on Ground Improvement and Ground Control: Transport Infrastructure Development and Natural Hazards Mitigation-ICGI 2012; Research Publishing: Singapore, 2012; pp. 1623–1628. [Google Scholar]
- Araya, A.A. Characterization of Unbound Granularmaterials for Pavements. Ph.D. Thesis, Delft University of Technology, Delft, The Netherlands, 2011. [Google Scholar]
- Anguas, P.G.; López, J.A.G.; Martínez, J.A.S. Mecánica de Materiales para Pavimentos; Publicación Técnica No. 197; Instituto Mexicano del Transporte: Sanfandila, Mexico, 2002. [Google Scholar]
- Leunga, G.L.M.; Wong, A.W.G.; Wanga, Y.H. Prediction of resilient modulus of compacted saprolitic soils by CBR approach for road pavement subgrade: A re-examination. Int. J. Pavement Eng. 2013, 14, 403–417. [Google Scholar] [CrossRef]
- Guzzarlapudi, S.D.; Adigopula, V.K.; Kumar, R. Comparative studies of lightweight deflectometer and Benkelman beam deflectometer in low volume roads. J. Traffic Transp. Eng. 2016, 3, 438–447. [Google Scholar] [CrossRef] [Green Version]
- Emre, V.; Saltan, M.; Gokalp, I. Feasibility of Using 4th Power Law in Design of Plastic Deformation Resistant Low Volume Roads. In Proceedings of the 3rd International Conference on Transportation Geotechnics (ICTG 2016), Guimarães, Portugal, 4–7 September 2016; pp. 961–970. [Google Scholar]
- Sas, W.; Głuchowski, A.; Miturski, M. Studies on resilient modulus value from cyclic loading tests for cohesive soil. J. Ann. Wars. Univ. Life Sci.-SGGW. Land Reclam. 2017, 49, 117–127. [Google Scholar] [CrossRef] [Green Version]
- Sas, W.; Głuchowski, A.; Gabryś, K.; Soból, E.; Szymański, A. Resilient modulus testing with application of cyclic CBR test for road subgrade materials. In Proceedings of the XVI Danube—European Conference on Geotechnical Engineering, Skopje, North Macedonia, 7–9 June 2018. [Google Scholar]


| Locality Number N° | Soil Type USCS | Sampling Number | Sample Number | Mean Density kg·m−3 | Mean Humidity % |
|---|---|---|---|---|---|
| 1 | Cl | 10 | 60 | 1598.8 | 23.8 |
| 2 | siCl | 3 | 18 | 1655.9 | 20.7 |
| 3 | saclSi | 2 | 12 | 1748.3 | 18.6 |
| 4 | csaCl | 5 | 30 | 1813.7 | 15.7 |
| 5 | sagrSi | 6 | 36 | 1858.5 | 13.4 |
| 6 | grsaCl | 4 | 24 | 1635.5 | 21.5 |
| 7 | siSa | 10 | 60 | 1796.0 | 14.7 |
| 8 | grsiSa | 2 | 12 | 1827.3 | 13.6 |
| 9 | siGr | 4 | 24 | 1929.6 | 12.7 |
Publisher’s Note: MDPI stays neutral with regard to jurisdictional claims in published maps and institutional affiliations. |
© 2020 by the authors. Licensee MDPI, Basel, Switzerland. This article is an open access article distributed under the terms and conditions of the Creative Commons Attribution (CC BY) license (http://creativecommons.org/licenses/by/4.0/).
Share and Cite
Ševelová, L.; Florian, A.; Hrůza, P. Using Resilient Modulus to Determine the Subgrade Suitability for Forest Road Construction. Forests 2020, 11, 1208. https://doi.org/10.3390/f11111208
Ševelová L, Florian A, Hrůza P. Using Resilient Modulus to Determine the Subgrade Suitability for Forest Road Construction. Forests. 2020; 11(11):1208. https://doi.org/10.3390/f11111208
Chicago/Turabian StyleŠevelová, Lenka, Aleš Florian, and Petr Hrůza. 2020. "Using Resilient Modulus to Determine the Subgrade Suitability for Forest Road Construction" Forests 11, no. 11: 1208. https://doi.org/10.3390/f11111208