Article

Functional Divergence between Várzea and Igapó Forests: A Study of Functional Trait Diversity in the Colombian Orinoco Basin

1
Programa de Biología, Facultad de Ciencias Naturales, Universidad del Rosario, Carrera 24 No. 63C-69, Bogotá 111221, Colombia
2
Dirección de Investigación e Innovación, Universidad del Rosario, Bogotá 111711, Colombia
3
Laboratorio de Ecología de Bosques Tropicales y Primatología, Departamento de Ciencias Biológicas, Universidad de Los Andes, Carrera 1 No. 18A-12, Bogotá 111711, Colombia
*
Author to whom correspondence should be addressed.
Forests 2020, 11(11), 1172; https://doi.org/10.3390/f11111172
Submission received: 7 September 2020 / Revised: 10 October 2020 / Accepted: 12 October 2020 / Published: 3 November 2020
(This article belongs to the Special Issue Structure, Function, and Dynamics of Tropical Floodplain Forests)

Abstract

:
Research Highlights: Functional diversity studies help to better understand how organisms respond to different environmental conditions. Conditions in tropical flooded forests are highly variable, including levels of nutrient availability, pH, and flood depth, but few studies have explored the impact of variation in these factors on plant functional diversity. Background and Objectives: In the Orinoco basin, as in the Amazon, floodplain forests have been classified into várzea (white-water rivers, with nutrient-rich soils) and igapó (black-water rivers, associated with nutrient-poor soils). We evaluated the functional diversity of plant species in várzea and igapó, as well as the influence of external and internal filters on the plant community assembly of each forest type, and compared our results with studies in the Amazon basin. Materials and Methods: Six functional traits were recorded in the várzea and igapó forests of the Colombian Orinoco basin (one-hectare plot for each forest type, with no replicates). We evaluated plant species diversity (richness, Fisher’s α, Shannon and Simpson indices), as well as functional diversity (functional richness, functional evenness, functional divergence, and functional dispersion) and the influence of external and internal filters, based on a comparison of variance at different organizational levels. Results: A high functional differentiation between várzea and igapó was found, as well as a high functional divergence within each forest type. We also observed a greater influence of internal filters on the community assembly of both forest types, compared to external filters. Functional traits such as wood density and leaf dry matter content, showed the same patterns as the várzea and igapó forests in the Amazon. Conclusions: Despite the low taxonomic and functional richness, there is high functional divergence within flooded forests. We also show that in forests under stress (e.g., from flooding), internal filters can be key in assembling communities and promote high functional divergence. Given that the functional diversity of the várzea and igapó in the Orinoco is largely unexplored, we highlight the need for more research for the effective conservation of these flooded forests.

1. Introduction

Floodplain forests grow in areas periodically flooded by river overflow, by direct precipitation, or after extreme climatic events. These forests are characterized by low taxonomic diversity compared to terra firme forests [1,2], but are considered important environments for particular animals and plants [3]. Floodplain vegetation is subjected to variation in flood duration, sedimentation and erosion, soil type, and water chemistry, and plants are therefore adapted to a wide range of potentially stressful conditions [4]. Factors such as flood duration or small differences in soil nutrient content can generate thresholds for the establishment of different species [5]. In the Amazon basin, some fundamental factors for maintaining diversity are hydrological and sedimentation cycles. Hydro-chemical properties determine the physical (moisture retention, hydraulic conductivity), chemical (nutrient availability, sediments, organic matter), and biological soil properties [6]. Based on water chemistry, Amazonian floodplain forests have been classified into várzea and igapó [7,8,9,10]. Várzea are seasonally flooded by white-water rivers rich in sediments and nutrients derived from erosive processes of the Andean mountains, with geological origins from the Quaternary and Tertiary periods [11]. Igapó are flooded by black-water rivers originating in lands from the Precambrian and Tertiary periods, and are poor in suspended nutrients [12]. Annual deposition of these differing sediments means that várzea has nutrient-rich soils, while igapó are nutrient-poor [1,7,13].
Although there have been several studies on flooded forest plant composition in South America [14,15], few have focused on studying their functional diversity [16]. Addressing this research gap on functional diversity helps to better understand the responses of organisms to the constraints and opportunities they face in different habitats [17]. Differences in soil properties may drive species ecological sorting processes which could result in different diversity patterns such as the ones described for the várzea and igapó forests of the Colombian Orinoco basin [18,19]. One way to corroborate this hypothesis is by studying functional traits and their diversity. Functional traits are well-defined and measurable, hereditary, morphological, physiological, or phenological characteristics that strongly influence the performance of individuals in a community [20]. Additionally, it has been suggested that their variation represents, to a great extent, the adaptations to the wide range of existing environmental conditions and reflect plant adaptations to conditions such as topography, soil nutrients, and water availability [20,21]. Therefore, we would expect to find functional divergence between plants that inhabit contrasting environments. Combinations of functional trait values are constrained by biophysical and natural selection forces that involve trade-offs between plant structure and function [20]. These combinations are frequently repeated among distant taxa in a wide geographic range and depend on the correlations that exist between traits. For example, it has been shown that specific leaf area (SLA) is a function of the leaf dry matter content (LDMC) and/or leaf thickness (Lth) [20]. Additionally, these trait combinations often form plant life strategies: species with high growth rates are characterized by having lower wood density (WD) and a higher SLA, which in turn is often related to lower LDMC and/or Lth [20,22] values that are advantageous in resource-rich environments. In contrast, species with lower growth rates tend to have higher WD, lower SLA, and higher Lth and LDMC. This reflects investment in strong and persistent tissues, increased nutrient conservation and water use efficiency, typical of plant survival in low-resource environments and/or in the presence of stress [20,22].
Functional trait values of individuals in a given community and their distribution, depend on the filters that control the assembly processes of the community. Traditional community assembly theory predicts that filters (abiotic and biotic) operate on the mean trait values of species [23]. However, Violle et al. [24] proposed an assembly theory that involves two filters (external and internal) operating at the individual instead of the species level. The objective was to build a more general theory based on functional traits and overcome the complexity of traditional ecological filters. External filters refer to all assembly processes that operate on a larger scale than the community (e.g., climate, environmental filtering, dispersal factors), while internal filters include all assembly processes that occur within the community (e.g., competition, facilitation, microhabitat heterogeneity). Under this framework, the influence of external filters is expected to be greater in environments with significant limitations (e.g., low nutrient soil content, drought, limited seed dispersal) and lead to convergent distributions of trait values. In contrast, internal filters are expected to be predominant in environments with fewer abiotic restrictions and with increasing competition.
Seasonal precipitation leads to a predictable flood regime in the Amazon and Orinoco floodplain forests, so plants must deal with limitations associated with seasonally hypoxic/anoxic conditions, as well as different flood duration and depth. As a whole, the Amazon and Orinoco basins share a relatively high number of species, which indicates an effective intermixing of the taxa [25]. However, it has been shown that there is divergence between várzea and igapó in terms of both species composition [14] and functional traits [12]. In general, there is a research gap in the functional ecology of floodplain forests, which is worrisome considering that they are threatened by increasing agricultural, livestock and tourism pressures, as well as changes in hydrology and climate [4]. In Colombia, and in the Orinoco in particular, there are virtually no studies on functional diversity, community assembly or ecosystem services [25].
The aim of this study is to evaluate (i) the functional diversity of plants from the várzea and igapó in the Colombian Orinoco basin, (ii) the possible effect of external and internal filters on plant community assembly of each of these forests, and (iii) differences in trait values from the Amazonian basin and other ecosystems. If differences in abiotic factors, such as soil composition and pH, have led to the ecological sorting of species, it is expected that there will be functional divergence between várzea and igapó forests. Our first hypothesis is that várzea is characterized with functional trait values associated with a competitive life strategy, reflected in higher growth rates, and that igapó presents trait values consistent with a conservative life strategy, such as lower growth rates and survival under stress conditions. Our hypothesis is that external filters are of greater influence in igapó and lead to convergent trait distribution, while internal filters are more important in várzea. Lastly, we hypothesize that the functional trait values of the Orinoco’s várzea and igapó are similar to those found in these forest types in the Amazon, because of the nutrient-poor and nutrient-rich sediment soil effect on forest productivity. An important caveat of our study is that we only sampled a one-hectare plot in várzea and one in igapó. Although there are no replicates for each forest type, our study is important for understanding the Orinoco floodplain forests.

2. Materials and Methods

2.1. Study Area

This study was carried out in Finca La Visión, located in Paz de Ariporo, Casanare, Colombia, in two vegetation plots of one hectare each (100 × 100 m). These plots were established in 2011, one in a várzea and the other one in an igapó forest [18]. This region is characterized by a rainy season between April and August, with a flood phase lasting around seven months (April–October). Based on four weather stations close to the study area (ca. 100 km around the area; three in Vichada and one in Casanare [26]), the mean temperature is 27 °C, and maximum and minimum temperatures are 32 and 22 °C, respectively. Mean annual precipitation is 2642 + 285 mm; in the rainy season, there is an average 300 mm of precipitation per month, while in the dry season, 62 mm. In the rainy season, the várzea forest (5°40.255′ N, 70°06.609′ W) is flooded by the Meta River, which is one of the main Orinoco River tributaries and transports nutrient-rich sediments received from the Andes mountain range (white-water). The igapó forest (5°40.040′ N, 70°08.946′ W) is flooded by the Caño Pica-Pico, an intermittent river that dries up during the dry season, located in Casanare and transports small amounts of sediment (black-water). Although these plots are only 4.5 km apart (Figure 1), it has been shown that there are differences in their soil characteristics. Gómez [19] found that the várzea plot has a significantly higher pH (4.25 compared to 3.96 in igapó) and higher content of Ca, Mg, and P. The igapó plot has a higher mean elevation, slope, and concentration of inorganic C, N, and Al. There are no significant differences between the várzea and igapó plots in light intensity or the concentration of K and Na [15].

2.2. Sampling and Measurement of Functional Traits

Functional traits were recorded in the dry season of December 2019. We selected the species to be sampled according to their relative abundance in a previous inventory from 2012 [18]. We only sampled species with more than five individuals, which included eight (out of 29) and seven (out of 24) species in igapó and várzea, respectively. These species collectively represent 88% and 94% of the relative abundance in igapó and várzea, respectively (Table S1). We sampled five individuals per species in each of the forest plots. We measured six functional traits associated with plant growth and survival: leaf area (LA (cm2)), specific leaf area (SLA (mm2 mg−1)), leaf thickness (Lth (mm)), leaf dry matter content (LDMC (mg g−1)), wood density (WD (g cm3)), and plant height (H (m)) (Table S2).
We measured functional traits following standardized trait protocols [17]. Leaf traits were measured on five leaves exposed to the sun per individual without including the petiole or rachis. We sampled five individuals per species, except for three compound-leafed species where we sampled only four individuals per species, due to sampling difficulties. We scanned the leaves and used the ImageJ digital image processing program [27] to calculate the leaf area (LA). Specific leaf area (SLA) was determined based on LA. Leaf dry weight was obtained after drying the leaves in an oven at 80 °C for 48 h. Leaf dry matter content (LDMC) was calculated from the leaf dry weight and the leaf wet weight measured in the field. Leaf thickness (Lth) was obtained by averaging the values of three measurements per leaf (always consistent in the different individuals and species) with a digital Vernier caliper at the sampling site. Height (H) was measured in five adult individuals per species at the field site using a laser clinometer. Finally, to determine wood density (WD), we took samples at 1.3 m height using a 5.15 mm diameter core borer. The volume was calculated by measuring the length and diameter of each sample, while the wood dry weight was obtained after drying the samples in an oven at 100 °C for 48 h [28]. Wood density was calculated in five individuals per species, except for two species in the várzea forest (four individuals per species). This was due to the damage of the two borers used in the field while extracting samples of Tachigali vaupesiana van der Werff and Mouriri guianensis Aubl., which are species with high wood density.

2.3. Statistical Analysis

We calculated species richness, Fisher’s α, and the Shannon and Simpson diversity indices to assess taxonomic diversity. We then ran a principal component analysis (PCA) to describe the values of the six traits sampled in two dimensions. We used an independent T-test or Wilcoxon test to compare the average values of each functional trait between várzea and igapó. To assess the functional diversity components of each forest, we calculated the following functional diversity indices: FRic (Richness), FEve (Evenness), FDiv (Divergence), FDis (Dispersion), and community weighted mean (CWM). All indices are independent estimators and are described in detail in Table 1.
To assess the influence of the external and internal filters on the community assembly of floodplain forests, we used the “Trait statistics” (T statistics) of Violle et al. [24], which are based on the comparison of intraspecific and interspecific variation of functional traits at different organizational levels. We calculated three T statistics [33] per functional trait for the flooded forest in general (várzea and igapó together) and for each forest separately. We consider as a population, all the sampled individuals of the same species; as a community, all the individuals or species sampled belonging to a forest type, either várzea or igapó; as the regional pool, all the individuals or species sampled in the two forest types. The regional pool is defined, according to Violle et al. [24], as the set of species belonging to a regional area or the set of species that are able to disperse up to the local community. The three statistics are (i) T_IP.IC: the observed ratio between the variance of the populations and the total variance of the communities at the individual level (individuals-populations/communities); (ii) T_IC.IR: the observed ratio between the communities variance and the total variance of the regional pool at the individual level (individuals—communities/regional pool); (iii) T_PC.PR: the observed ratio between the communities variance and the total variance of the regional pool at the population level (populations—communities/regional pool). T_IP.IC reflects the strength of internal filters on the community assembly and is expected to be predominant in settings with few abiotic constraints and lead to greater variability of the trait values.
To assess the importance of the above-mentioned three T statistics, the observed values were compared with the values obtained from simulated communities (n = 1000 randomizations) by calculating the standardized effect size (SES), Equation (1):
SES   =   I obs I sim σ sim
where Isim and σsim are, respectively, the average value and the standard deviation of the randomized values. SES measures how deviated the observed index is from the average index of the simulated communities. Therefore, negative or positive SES values reflect lower or higher T-statistic values, respectively, than random expectations. This analysis was carried out using the R package, cati [33], in which the randomizations (null models) are adapted to each T statistic maintaining the number of individuals per species, and the number of individuals and species per communities. The significance of the SES was evaluated for each T statistic in the six functional traits by means of two unilateral tests (lower and upper limit) with a significance level of 5%. All analyses were performed using the Rstudio 3.6.3 packages vegan 2.5-6, ade4 1.7-15, FD 1.0-12, and cati 0.99.3 [33,34,35,36,37].

3. Results

3.1. Taxonomic Diversity of Várzea and Igapó Forests

Igapó has higher Shannon and Fisher’s α indices than várzea, while the Simpson index is high in both forest types (Table 2). Additionally, we observe that although both plots share seven families in total (Euphorbiaceae, Fabaceae, Myrtaceae, Polygonaceae, Rubiaceae, Salicaceae, and Sapindaceae), only Fabaceae is represented within the 10 most abundant species in both plots. Only the genera Cupania, Eugenia, Mabea, and Alchornea are present in both plots, but there are no shared species (Table S1).

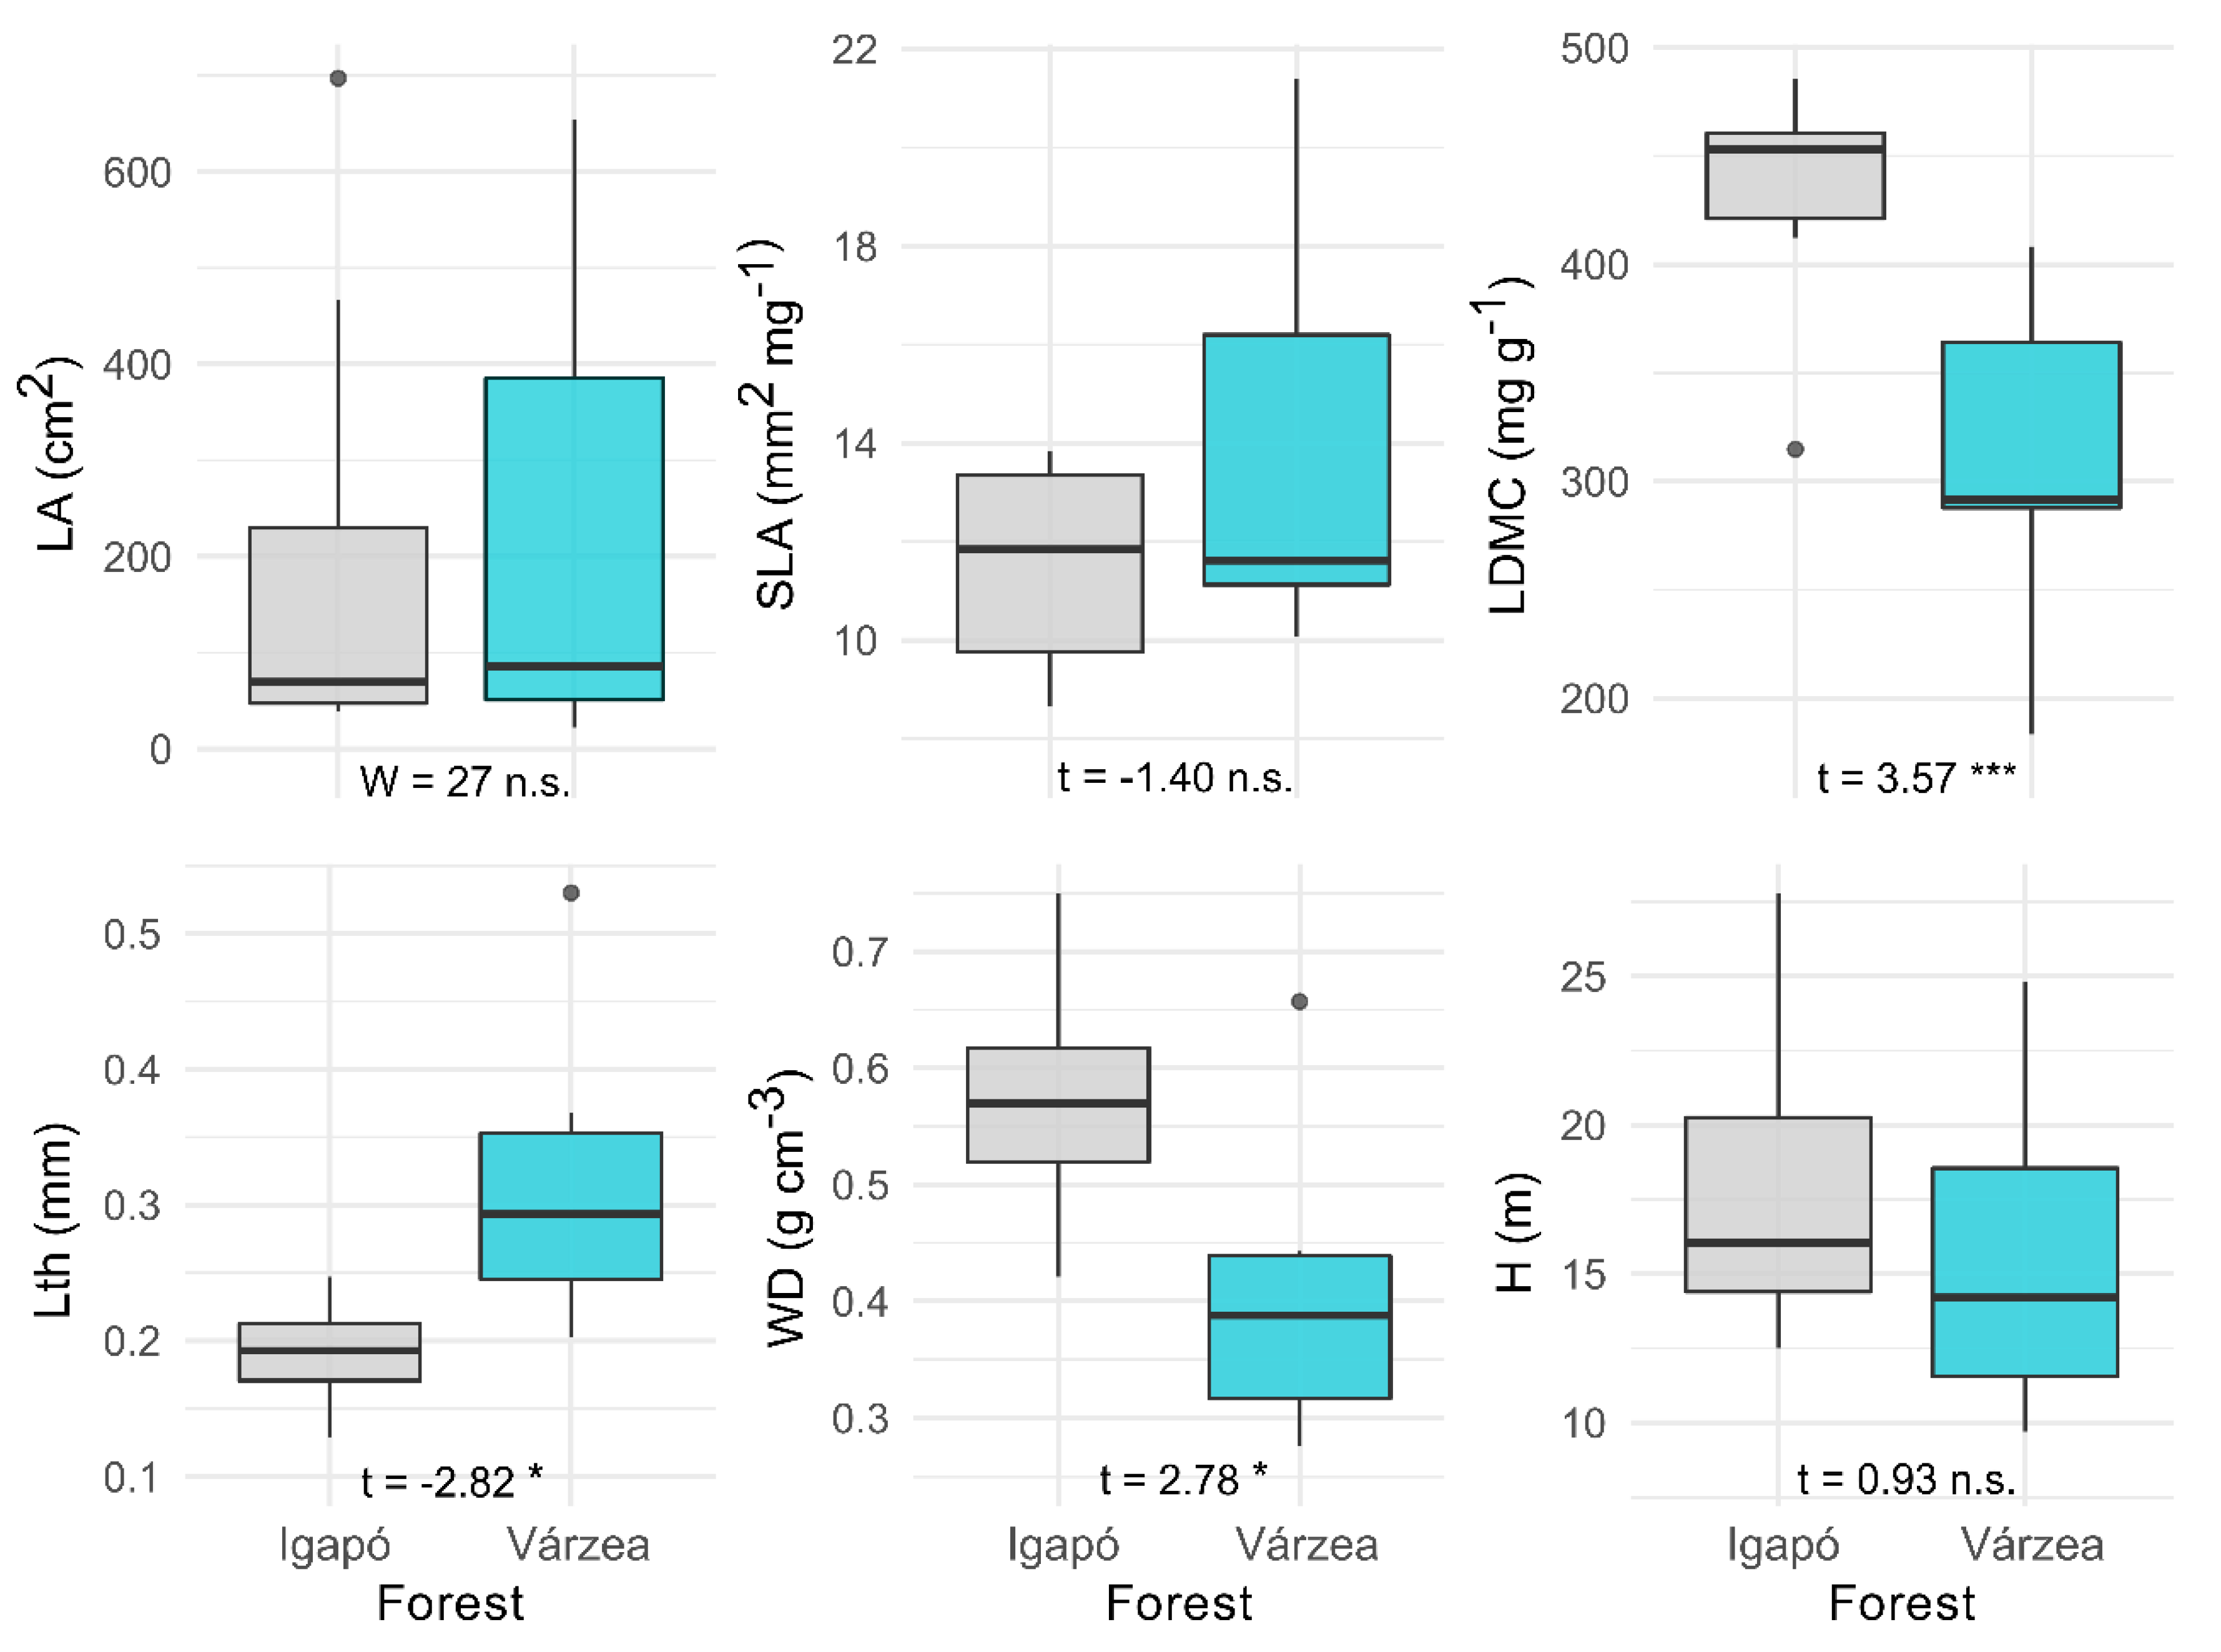
3.2. Functional Traits of Várzea and Igapó Forests

The PCA (Figure 2) shows a partial separation between the várzea and igapó trait values through the two main components. There is a greater differentiation through PC1, which is mainly associated with LDMC and WD, while PC2 is mainly related to Lth and SLA (H and LA do not seem to be explanatory traits). This analysis shows that the igapó species have higher LDMC and WD values, whereas the várzea species have higher Lth and lower WD and LDMC values. However, there is an intersection between the two forest types that corresponds to four particular species (two from várzea and two from igapó) (Figure S1), which exhibit some trait values different from the general pattern of each forest (Figure S2). For instance, Mouriri guianensis, which belongs to várzea, has a high wood density (0.7) while Hydrochorea marginata (Spruce ex Benth.) Barneby & J.W. Grimes, from igapó, has a low wood density (0.4). Additionally, igapó presents a more restricted distribution of trait values in ordination space compared to the trait distribution in várzea. The main components PC1 (37.37%) and PC2 (19.64%) explain approximately 57% of the variation in the functional trait values.
There are significant differences between the várzea and igapó forests in terms of Lth (p < 0.05), WD (p < 0.05) and LDMC (p < 0.01) (Figure 3), while LA, SLA, and H did not show significant differences (p > 0.05). Várzea forest presents SLA and Lth values 1.60 and 1.74 times higher (respectively) than igapó, while igapó presents LA, LDMC, WD, and H values 4.97, 1.85, 1.62, and 1.15 times higher (respectively) than várzea (Table 3).

3.3. Components of the Functional Diversity of Várzea and Igapó Forests

Both várzea and igapó present low FRic values, indicating that the dominant species occupy a reduced functional space. However, the igapó index is nine times lower than that of várzea (0.008 and 0.072, respectively). There were similar values of FEve for both forest types (0.75 for várzea and 0.68 for igapó), showing that the distribution of trait values is not uniform within the space niche. We found high indices of FDiv for both várzea and igapó (0.95 and 0.92, respectively), which show wide trait variation and that the species abundance and/or traits are clustered at the edges of the occupied niche space. Finally, the FDis indicate that the average distances of the individual species to the centroid of each community are high for both forest types. However, the várzea index is 1.42 times higher than the igapó (2.11 and 1.49, respectively).

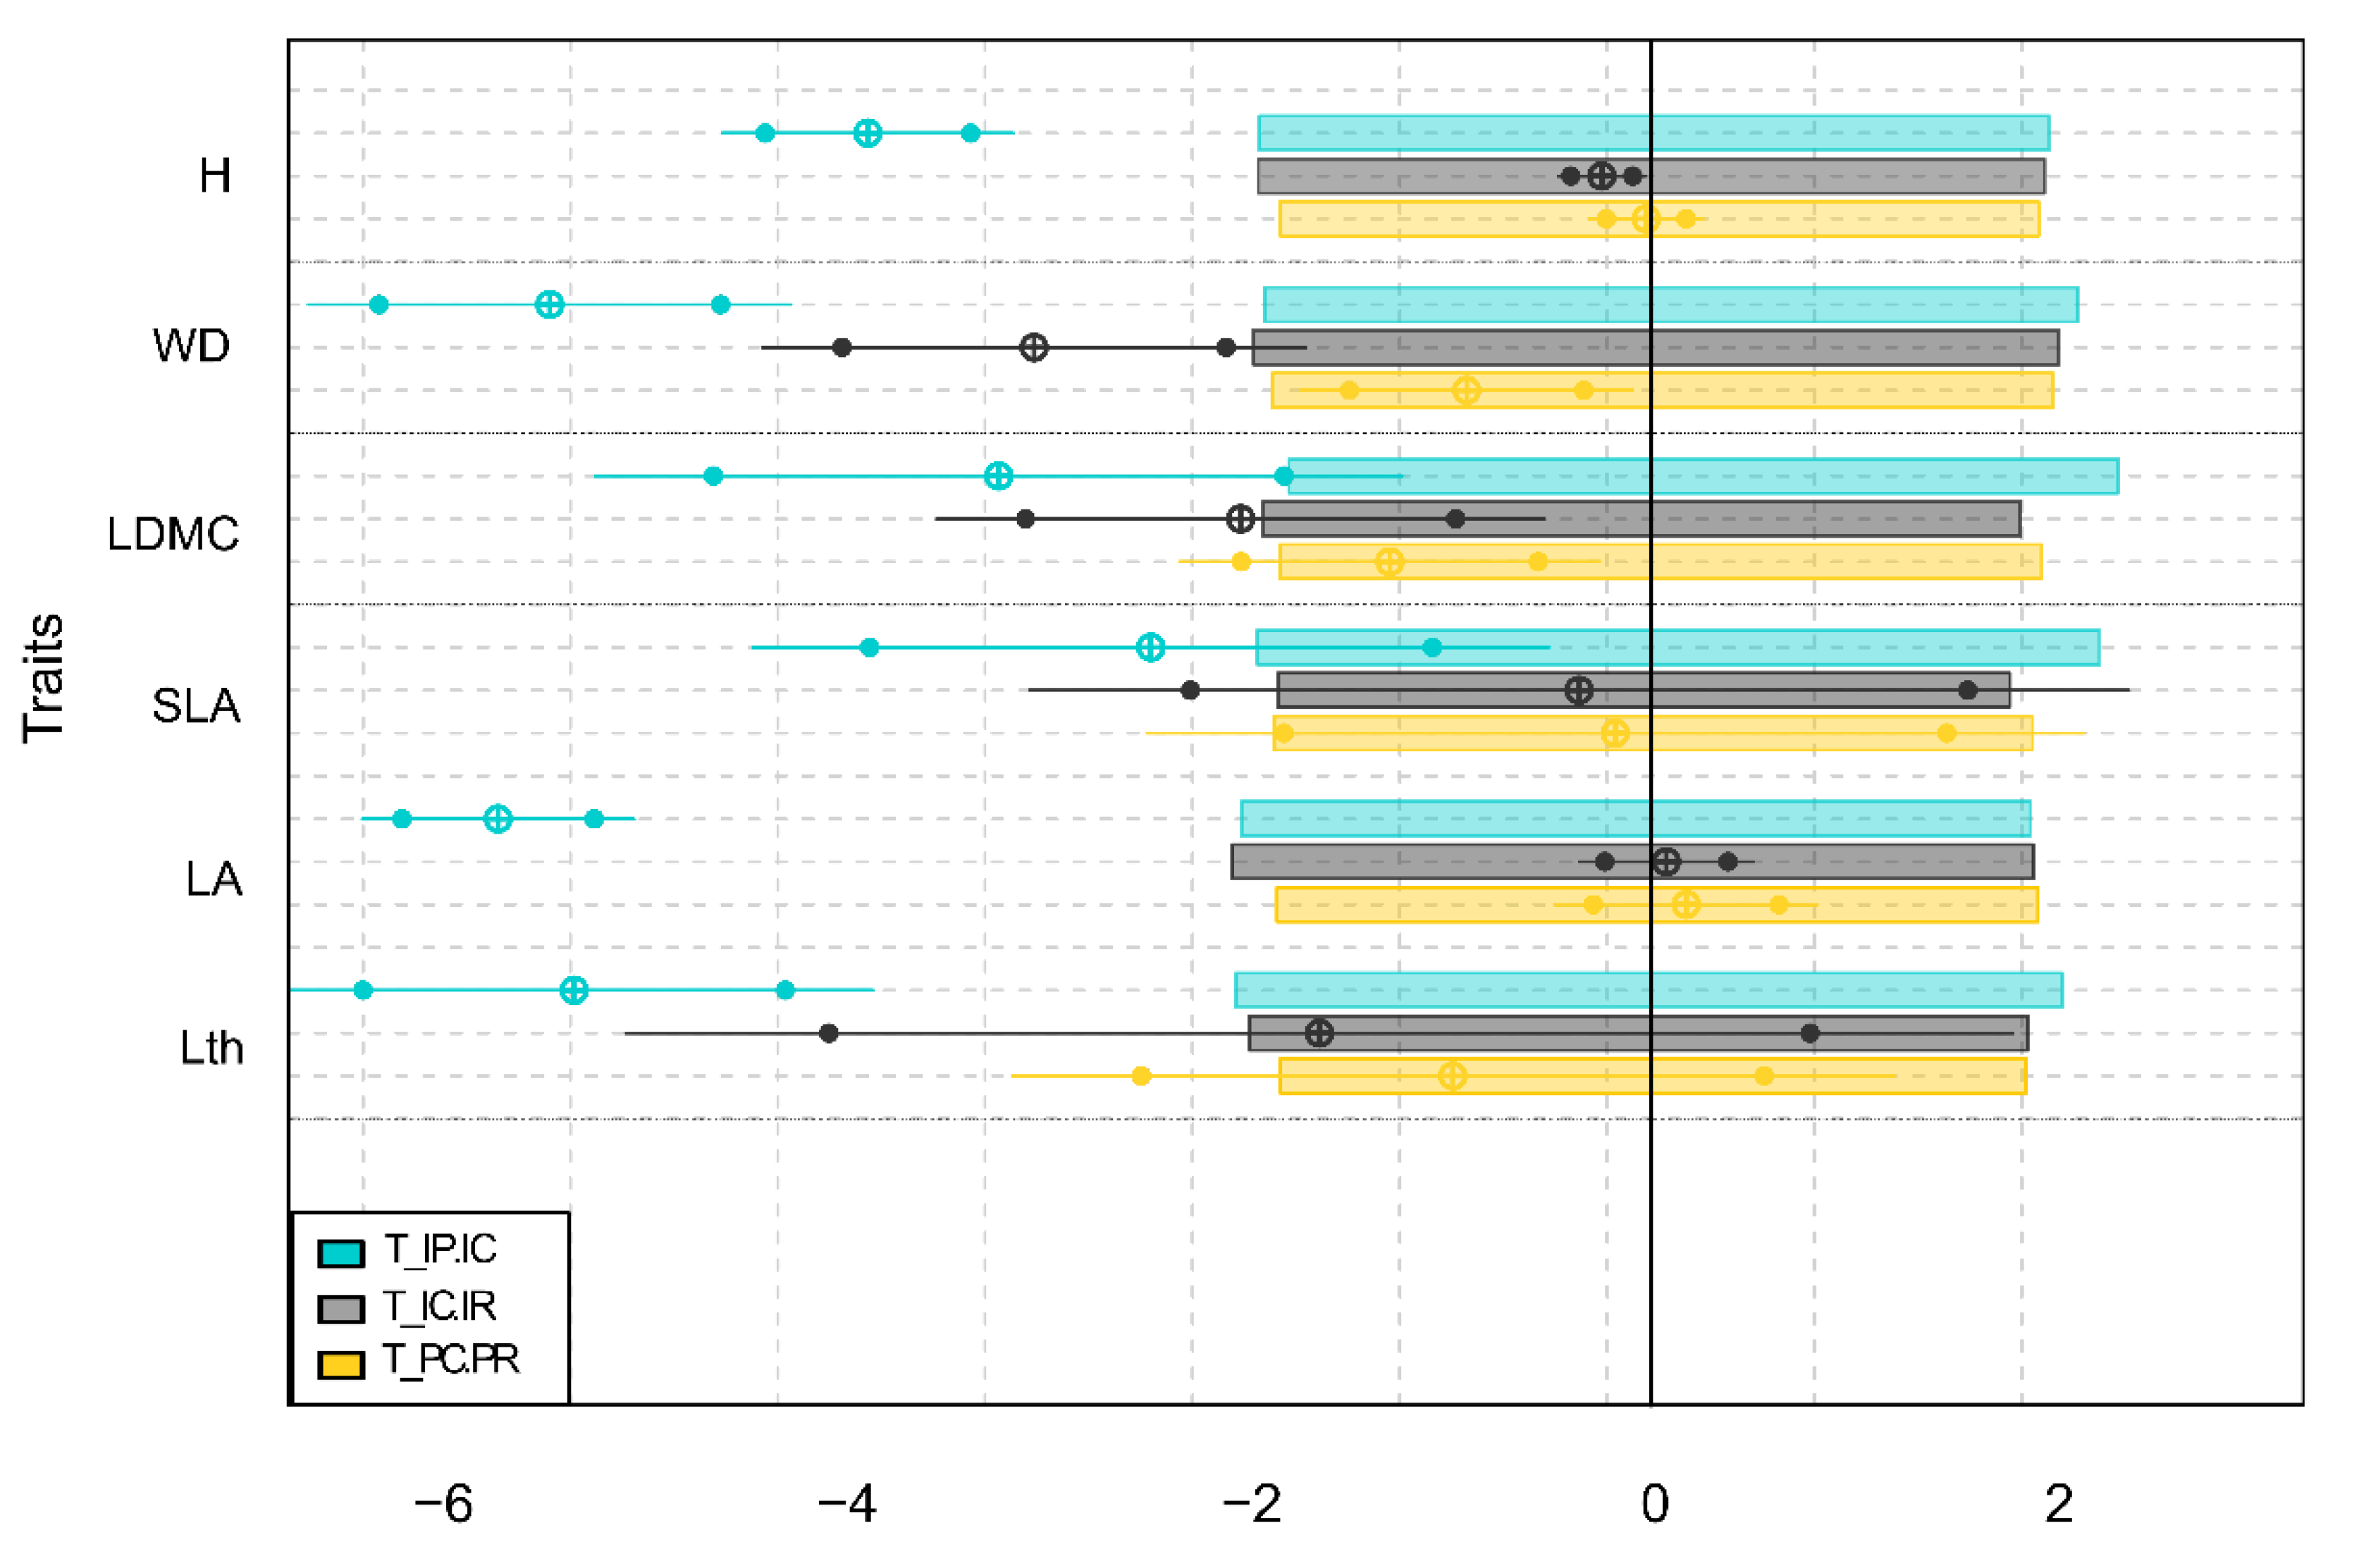
3.4. Internal and External Filters Influence on the Community Assembly of Flooded Forest

The SES for the functional traits of the floodplain forest, in relation to the null models, is shown in Figure 4. All the traits show significantly different mean values (negative SES) for the T_IP.IC (individuals-populations/communities), which refers to the influence of the internal filters. In contrast, the external filters show differences in few traits. T_IC.IR (individuals-communities/regional pool) presents significant differences (negative SES) for LDMC and WD, while T_PC.PR (populations-communities/regional pool) does not show significant differences for any trait.
At the forest level (Figure 5), in várzea we observe that all traits have significantly lower negative SES values than the null models for T_IP.IC; T_IC.IR only shows a significant difference (negative SES) for WD; T_PC.PR shows no significant differences. As for the igapó forest, T_IP.IC presents negative significant differences for all the traits, except for SLA. However, in this case, T_IC.IR and T_PC.PR show significant differences in more than one trait. T_IC.IR shows significantly lower negative SES values in four of the six traits analyzed (WD, Lth, LDMC, and SLA). T_PC.PR shows significant differences (negative SES) in three traits (Lth, LDMC, and SLA). p-values of all the tests performed are found in Table S4.

4. Discussion

Even though there is not functional divergence in all traits, we found that the várzea is mainly characterized by traits related to high growth rates, while the igapó has traits associated with low growth rates, as hypothesized. Regarding the influence of external and internal filters we observed that, as expected, internal filters are more influential than external filters in várzea. However, in igapó both filters are important, even though we had hypothesized that external would be more influential. In our third hypothesis we proposed that the Amazon and Orinoco floodplain forests would show similar functional trait tendencies. This was the case for LDMC and WD, which were higher in the igapó of both basins (Figure 3; [16,38]). Even with the limited sampling in our study (two, one-hectare plots), the results are in agreement with other species richness studies in the Orinoco basin [2,39] and trait studies in igapó and várzea of the Amazon basin [14,16,38].

4.1. Species Diversity in Várzea and Igapó Forests

The várzea and igapó plots studied in the Orinoco present low taxonomic diversity and low evenness communities (Table 2 and Table S1). This is in agreement with other studies, both in Orinoco and the Amazon [1,2,39,40]. The low evenness in igapó is due to the over dominance of Tachigali vaupesiana (Fabaceae), while in várzea the most dominant species is Phyllanthus elsiae Urb. (Phyllanthaceae). This differs from the more diverse inundated forests in the Amazon basin [41]. The Fisher’s α for our igapó plot (8.82; Table 2) is within the values reported for two 1 ha igapó plots in the Tomo River, another large tributary of the Orinoco basin (α Fisherplot1 = 7.59, α Fisherplot2 = 11.09) [39]. Low species diversity in floodplain forests is attributed to the long flooding periods, with only species adapted to these periods of hypoxia/anoxia surviving [4,42].
The várzea plot has a lower species diversity compared to the igapó (Table 2). Some studies have reported higher diversity in várzea [43,44], but others have found higher diversity in igapó forests [45,46]. Our result may change as regional sampling increases, but a higher species diversity in igapó could be the result of different historical processes. Várzea forests, flooded by rivers like the Meta River, receive sediments from the central or northern Andes, which are geologically younger than the igapó systems. Therefore, some várzea taxa could have less evolutionary time for speciation [25,45].

4.2. Functional Divergence between Várzea and Igapó Forests

According to our findings, várzea and igapó forests in the Colombian Orinoco basin differ in key plant functional traits (Figure 3, Table 2), which provide information on growth strategies and energy investment in tissue construction. The most important factors for plant growth and tissue quality are hydrological regime, soil properties, light, and temperature. Light incidence and temperature do not vary significantly between these forest types [19,47] but várzea forests are flooded by white-water rivers, while igapó, by black-water rivers. These hydrological differences, associated with water chemistry, influence the forest soil composition, such that várzea has nutrient-rich soils while igapó has nutrient-poor soils [7,13]. Therefore, functional divergence could be associated with these differences.
Igapó showed high WD and LDMC values, which indicate a high investment in strong and long-lasting foliar and wood tissues, at the expense of a slow growth rate. This in turn is related to greater nutrient accumulation and survival under stress conditions [20,22]. Compared to várzea, igapó, had lower pH values and lower P, Mg, and Ca concentrations [19], which are key for plant growth and productivity. Therefore, these trait values could be responding to the limitations faced by plants in igapó. In contrast, várzea presented low WD and LDMC values, indicating that in this forest type, species invest less energy in tissue construction but have higher growth rates [20,22]. The white waters of the Meta River provide greater nutrient availability, meaning that várzea plant communities are not required to have a high nutrient retention capacity. In this way, high nutrient availability favors the expression of traits associated with a fast growth strategy.
Although we did not observe significant differences between várzea and igapó for SLA (Figure 3), the species in igapó present lower values and could therefore indicate low photosynthetic and carbon gain rates [22], while in várzea there is no clear trend (Table 3 and Table S3). Differences between várzea and igapó forests have already been suggested for Amazonian forests. For instance, Parolin and Worbes [48] and Parolin and Ferreira [38] showed that WD in igapó (mean = 0.67 g cm3) was higher than in várzea (mean = 0.48 g cm3), as shown in this study.

4.3. Effect of Internal and External Filters on Community Assembly and Functional Diversity of Flooded Forests

Several studies have suggested that regularly disturbed communities are sorted according to their ability to tolerate disturbance [49] and therefore external filters are expected to be more relevant in assembling these communities. Nevertheless, our results suggest that internal filters are more important than external constraints on the community assembly of flooded forests (Figure 4). Microhabitat heterogeneity could be one of the most relevant internal factors [42]. Floodplain forests are subject to many variable conditions on a local scale with studies indicating that there are nutrient availability gradients along the floodplain, as well as, erosion and sediment deposition [19,50]. Pinay et al. [50] showed that erosion and sedimentation processes affected the distribution of the total content of C, N, and P on a small scale in riparian forest soils. Similarly, in the Amazon, species zoning has been observed in várzea forests subjected to different flood depths [4].
In forest areas under higher stress (e.g., lower elevation, lower nutrient availability, or lower pH), plants are expected to have higher WD and LDMC. Therefore, despite the low taxonomic and functional richness imposed by external filters (floods or the low nutrient availability), internal filters would give rise to a high degree of niche differentiation. This is corroborated by the high FDiv and FDis values we found in both várzea and igapó. In our study, várzea presented higher FRic and FDis values than igapó, suggesting a greater functional divergence.
We also found that external filters are only relevant for specific traits (Figure 4). In the case of igapó, these filters were influential for traits such as WD, LDMC, and SLA (Figure 5). In addition to the low nutrient availability in black-water forests, the lower pH (3.96), a higher exchangeable acidity (5.4 meq/100 g), and a higher presence of Al [19] also pose severe restrictions for plants. Aluminum has significant effects on plant growth by inhibiting root growth and inducing a Ca and Mg deficiency in the soil [51]. The low nutrient availability, pH, and root growth could explain a lower FRic in igapó. However, this value could also imply a low buffering capacity against environmental fluctuations, because less trait variability implies a lower probability of resistance to disturbances [52,53].
In the várzea forest, external filters seem to be important for only one of the six traits evaluated (Figure 5), suggesting that, thanks to the nutrient availability provided by the Meta River and a higher pH, external filters would not be as influential and would allow the establishment of species with a rapid growth strategy (Figure 3) as well as a higher FRic. However, external filters such as flood stress are still relevant and appear to be limiting the variability of WD (Figure 5). A higher FRic is associated with a more complete use of the available resources and higher productivity, as well as the ability to deal with environmental fluctuations [52,53]. However, the intermediate FEve values indicate that some parts of the niche space, despite being occupied, are underused, which would decrease productivity and increase the probability of invasion [52]. Discrepancies between the significance of the T_IC.IR and T_PC.PR statistics (Figure 4 and Figure 5), reflect the importance of considering intraspecific variation in this type of analyses even in forests with low taxonomic diversity.

4.4. Orinoco and Amazon Basin Floodplain Forests

Mori et al. [16] reported differences in 10 of the 11 functional traits recorded for the várzea and igapó forests in central Amazonia (Brazil). In their study they showed that white-water forests have traits associated with rapid growth, while black-water forests have traits related to low growth rates, as corroborated in this present study. In Mori et al. [16], WD and LDMC were higher in igapó (as is the case for the Orinoco plot), while LA and SLA were higher in várzea (Figure 3).
However, abiotic constraints such as nutrient availability and/or pH effects appear to be less important in the Orinoco floodplain forests, since the igapó trait values in this study (Orinoco basin) are more similar to those reported for várzea in the Amazon [16]. For instance, in our study the igapó forest has an average LDMC of 433 mg g−1, while in the Amazon, the LDMC average for várzea and igapó was 671 and 1829 mg g−1, respectively. In the same way, while we found an average WD of 0.57 g cm3 in igapó, Mori et al. [16] reported an average of 0.59 and 0.75 g cm3 for várzea and igapó, respectively. Functional differences between the floodplain forests of these two basins could be due to the fact that there is higher conductivity (concentration of dissolved ions) in the main rivers of the Orinoco basin. In a review of the Orinoco and Amazon basin characteristics, Godoy et al. [25] reported that two tributaries of the Orinoco River, the Meta (white-water) and the Atabapo (black-water), have a higher conductivity (72.9 and 14.6 µS cm−1, respectively) compared to the Solimoes (white-water) and Negro (black-water) rivers, which are large tributaries of the Amazon River (58.0 and 9.0 µS cm−1, respectively). However, it is necessary to consider that both basins have a wide diversity and complexity of channels along their river networks. To corroborate this higher conductivity hypothesis in the Orinoco, it would be necessary to carry out a greater sampling along these basins, given that, to our knowledge, our study is the only one conducted in the Orinoco so far. Therefore, it is important to note that as more sampling of the Orinoco floodplain forests is included, we may be able to understand if the differences with the Amazon basin are due simply to sampling or to the effect of abiotic constraints such as nutrient availability, pH, and/or conductivity.

4.5. Orinoco Flooded Forests Compared to Other Ecosystems

Expression of differentiated growth strategies along gradients has been widely documented. For example, Maracahipes et al. [54] showed that in the Brazilian Cerrado conservative traits, related to a slow growth rate, were associated with species recorded in savannas, while acquisitive traits, related to a fast growth rate, were associated with species found in forests. Similarly, these strategies have been observed in dry and wet tropical forests across different successional states [55]. When we compare the functional traits of the floodplain forest with values of the tropical dry forests of Colombia [56], retrieved from the global database of functional characteristics of plants, TRY [57], we found that they have similar average trait values for SLA (floodable: 12.68 mm2 mg-1 and dry: 12.45 mm2 mg−1), LDMC (floodable: 376 mg g−1 and dry: 397 mg g−1), and WD (floodable: 0.49 g cm3 and dry: 0.58 g cm3). This suggests that the same trait values respond to different types of stress: improving nutrient retention in flooded forests while allowing hydraulic operation and decreasing water potential during drought in tropical dry forests [58]. However, based on the trait values obtained through TRY, it is evident that the dry forest presents a greater variability. For example, while this dry forest has WD values ranging from 0.1 to 3 g cm3, in the flooded forest, it varies from 0.28 to 0.75 g cm3. Although this comparison could be biased by the small number of individuals sampled in the floodplain forest compared to those in the dry forest, this pattern is worth exploring in more detail, since both forests are under high abiotic stress, which can lead to convergent functional responses in plants. Our trait values (Table S3) are also within the ranges reported for tropical forests: LA (2.03–640,497 cm2); SLA (6.25–37 mm2 mg−1); LDMC (210–640 mg g−1); Lth (0.01–0.04 mm); WD (0.23–0.98 g cm3); H (6.1–40.4 m) [59,60,61].
Paradoxically, Prado-Junior et al. [58] found that in tropical dry forests, areas with less nutrient availability had higher biomass productivity, probably due to the functional trait values that they possess. We hypothesized that in floodplain forests, and in particular in black-water forests (igapó), the functional traits filtered by low nutrient availability could be an important driver of biomass productivity; the high LDMC and WD values that we obtained could be associated with a greater longevity and resistance to physical damage, which in turn would confer a lower mortality rate and a greater accumulation of biomass over time. This was corroborated by González-Abella [39], who observed a lower mortality rate and greater accumulation of annual biomass per hectare in the igapó forests of Vichada (Colombia), compared to terra firme forests. In northern temperate zones, Salicaceae floodplain forests show a high regeneration capacity that is positively correlated with high relative growth rates (RGR) [62]. Therefore, in várzea, traits associated with a high growth rate such as low WD and LDMC, could also give plants a greater capacity for regeneration. This in turn would give the white-water forests a greater resistance to strong disturbances and fluctuations in environmental conditions.

5. Conclusions

Our results indicate that these forests should not be treated as a single category “flooded forest” (or as “wetlands” [9]), considering the functional differences between várzea and igapó, as well as differences in the effect of external filters. These filters may have had a key effect on the divergence of species and functional traits values between these forests. Despite the low taxonomic and functional richness, there is high functional divergence within each of these forests. This has important implications related to the conservation of floodplain forests, because not all species within a forest type (várzea or igapó) have traits associated with a single growth strategy. Data on tree adaptations in floodplain forests worldwide are scarce, and with climate change scenarios of increased drought, decreased groundwater availability, and changes in flooding periodicity, there is an urgency to address this knowledge gap in order to successfully conserve them [4]. Floodplain forests are strategic environments for different animals and plants, because they offer temporal-spatial heterogeneity [3,63]. For instance, the flooding period coincides with fruit production of most trees, resulting in increased food availability for fish [64]. Additionally, Colombian flooded forests were incorporated in 21 of the 139 key areas for the conservation of threatened freshwater biodiversity [3]. However, we currently do not know how the differences between floodplain forest types influence threatened biodiversity, as there remains an important research gap on these forests of Colombia. We emphasize the need to continue investigating the functional diversity of floodplain forests on a larger scale, considering that there are other types of flooded forests that could also exhibit differences depending on the hydrographic basin and biogeographic region.

Supplementary Materials

The following are available online at https://www.mdpi.com/1999-4907/11/11/1172/s1: Figure S1: Cluster dendrogram of species based on functional traits, Figure S2: PCA: relationship between functional trait values and species, Table S1: Species sampled and their relative abundance, Table S2: Description of the plant functional traits sampled, Table S3: Summary of the functional trait values for várzea and igapó, Table S4: p-values of the two unilateral statistical tests performed (lower and upper limit) to compare the T statistics with the random expectations, according to each functional trait and forest type.

Author Contributions

Conceptualization, D.B., A.M.A., S.C. and A.S.; methodology, D.B., A.M.A. and A.S.; formal analysis, D.B.; investigation, D.B.; data curation, D.B. and S.C.; writing—original draft preparation, D.B., A.M.A. and A.S.; writing—review and editing, A.M.A., S.C. and A.S.; visualization, D.B. and A.S.; supervision, A.M.A. and A.S.; project administration, D.B. and A.S.; funding acquisition, A.M.A. and A.S. All authors have read and agreed to the published version of the manuscript.

Funding

This research was funded with funds from the Universidad del Rosario awarded to Adriana Sánchez and the L’Oréal Colombia Prize for Women in Science awarded to Ana M. Aldana (2014).

Acknowledgments

The authors thank Carlos H. Montenegro for logistical support and for allowing fieldwork in his Casanare field sites. The authors also thank the Laboratory of Functional and Ecosystemic Ecology of the Universidad del Rosario, the Laboratory of Tropical Forest Ecology and Primatology of the Universidad de los Andes, Andrés González for providing the necessary equipment for taking samples in the field and Pablo R. Stevenson for identifying all the plant material. David Torres and William Sosa are thanked for their support in the field and Yuliana Bonilla for her help with the sample processing. The authors also wish to thank three anonymous reviewers and the Academic Editor who helped improve the quality of the manuscript and James Richardson for his help with English editing.

Conflicts of Interest

The authors declare no conflict of interest.

References

  1. Haugaasen, T.; Peres, C.A. Floristic, edaphic and structural characteristics of flooded and unflooded forests in the lower Rio Purús region of central Amazonia, Brazil. Acta Amaz. 2006, 36, 25–35. [Google Scholar] [CrossRef] [Green Version]
  2. Stevenson, P.R.; Aldana, A.M.; Cárdenas, S.; Negret, P.J. Flooding and soil composition determine beta diversity of lowland forests in Northern South America. Biotropica 2018, 50, 568–577. [Google Scholar] [CrossRef]
  3. Lasso, C.A.; Córdoba, D.; Morales-Betancourt, M.A. Áreas Clave para la Conservación de la Biodiversidad Dulceacuícola Amenazada en Colombia: Moluscos, Cangrejos, Peces, Tortugas, Crocodílidos, Aves y Mamiferos; Serie Editorial Recursos Hidrobiológicos y Pesqueros Continentales de Colombia; Instituto de Investigación de Recursos Biológicos Alexander von Humboldt: Bogotá, Colombia, 2017; p. 353. [Google Scholar]
  4. Parolin, P.; Wittmann, F. Struggle in the flood: Tree responses to flooding stress in four tropical floodplain systems. AoB Plants 2010, 2010, plq003. [Google Scholar] [CrossRef] [PubMed] [Green Version]
  5. Petit, R.J.; Hampe, A. Some evolutionary consequences of being a tree. Annu. Rev. Ecol. Evol. Syst. 2006, 37, 187–214. [Google Scholar]
  6. Parolin, P.D.; De Simone, O.; Haase, K.; Waldhoff, D.; Rottenberger, S.; Kuhn, U.; Junk, W.J. Central Amazonian floodplain forests: Tree adaptations in a pulsing system. Bot. Rev. 2004, 70, 357–380. [Google Scholar] [CrossRef]
  7. Junk, W.J.; Piedade, M.T.F. An Introduction to South American wetland forests: Distribution, definitions and general characterization. In Amazonian Floodplain Forests. Ecological Studies (Analysis and Synthesis); Junk, W., Piedade, M., Wittmann, F., Schöngart, J., Parolin, P., Eds.; Springer: Dordrecht, The Netherlands, 2010; Volume 210. [Google Scholar] [CrossRef]
  8. Junk, W.J.; Piedade, M.T.F.; Parolin, P.; Wittmann, F.; Schöngart, J. Ecophysiology, biodiversity and sustainable management of central Amazonian floodplain forests: A synthesis. In Amazonian Floodplain Forests. Ecological Studies (Analysis and Synthesis); Junk, W., Piedade, M., Wittmann, F., Schöngart, J., Parolin, P., Eds.; Springer: Dordrecht, The Netherlands, 2010; Volume 210. [Google Scholar] [CrossRef]
  9. Ricaurte, L.F.; Patiño, J.E.; Zambrano, D.F.R.; Arias-G, J.C.; Acevedo, O.; Aponte, C.; Estupinan-Suarez, L.M. A classification system for colombian wetlands: An essential step forward in open environmental policy-making. Wetlands 2019, 39, 971–990. [Google Scholar] [CrossRef]
  10. Prance, G.T. Notes on the vegetation of Amazonia III. The terminology of Amazonian forest types subject to inundation. Brittonia 1979, 31, 26–38. [Google Scholar] [CrossRef]
  11. Melack, J.M.; Hess, L.L. Remote sensing of the distribution and extent of wetlands in the Amazon basin. In Amazonian Floodplain Forests. Ecological Studies (Analysis and Synthesis); Junk, W., Piedade, M., Wittmann, F., Schöngart, J., Parolin, P., Eds.; Springer: Dordrecht, The Netherlands, 2010; Volume 210, pp. 43–59. [Google Scholar] [CrossRef]
  12. Junk, W.J. Wetlands of tropical South America. In Wetlands of the World: Inventory, Ecology and Management Volume I; Handbook of Vegetation Science; Whigham, D.F., Dykyjová, D., Hejný, S., Eds.; Springer: Dordrecht, The Netherlands, 1993; Volume 15, pp. 679–739. [Google Scholar] [CrossRef]
  13. Irion, G.; de Mello, J.A.; Morais, J.; Piedade, M.T.; Junk, W.J.; Garming, L. Development of the Amazon valley during the Middle to Late Quaternary: Sedimentological and climatological observations. In Amazonian Floodplain Forests. Ecological Studies (Analysis and Synthesis); Junk, W., Piedade, M., Wittmann, F., Schöngart, J., Parolin, P., Eds.; Springer: Dordrecht, The Netherlands, 2010; Volume 210, pp. 27–42. [Google Scholar] [CrossRef]
  14. Wittmann, F.; Schöngart, J.; Montero, J.C.; Motzer, T.; Junk, W.J.; Piedade, M.T.; Worbes, M. Tree species composition and diversity gradients in white-water forests across the Amazon Basin. J. Biogeogr. 2006, 33, 1334–1347. [Google Scholar] [CrossRef]
  15. Ferreira, L.V.; Prance, G.T. Structure and species richness of low-diversity floodplain forest on the Rio Tapajós, Eastern Amazonia, Brazil. Biodivers. Conserv. 1998, 7, 585–596. [Google Scholar] [CrossRef]
  16. Mori, G.B.; Schietti, J.; Poorter, L.; Piedade, M.T.F. Trait divergence and habitat specialization in tropical floodplain forests trees. PLoS ONE 2019, 14, e0212232. [Google Scholar] [CrossRef]
  17. Pérez-Harguindeguy, N.; Diaz, S.; Gamier, E.; Lavorel, S.; Poorter, H.; Jaureguiberry, P.; Urcelay, C. Corrigendum to: New handbook for standardised measurement of plant functional traits worldwide. Aust. J. Bot. 2016, 64, 715–716. [Google Scholar] [CrossRef] [Green Version]
  18. Cárdenas, S. Patrones Florísticos de los Planos de Inundación y Bosques de Tierra Firme: Efectos de Filtros Ambientales y Azar. Bachelor´s Thesis, Universidad de los Andes, Bogotá, Colombia, 2012. [Google Scholar]
  19. Gómez, Y.A. Influencia de los Nutrientes del Suelo y Otros Factores Abióticos en la Distribución de Especies en Bosques de Igapó y Várzea, Casanare. Bachelor’s Thesis, Universidad de los Andes, Bogotá, Colombia, 2017. [Google Scholar]
  20. Garnier, E.; Navas, M.L.; Grigulis, K. Plant Functional Diversity: Organism Traits, Community Structure, and Ecosystem Properties; Oxford University Press: Oxford, UK, 2016. [Google Scholar] [CrossRef]
  21. Oliveira, R.S.; Costa, F.R.; van Baalen, E.; de Jonge, A.; Bittencourt, P.R.; Almanza, Y.; Guimaraes, Z.T. Embolism resistance drives the distribution of Amazonian rainforest tree species along hydro-topographic gradients. New Phytol. 2019, 221, 1457–1465. [Google Scholar] [CrossRef] [Green Version]
  22. Reich, P.B. The world-wide ‘fast–slow’plant economics spectrum: A traits manifesto. J. Ecol. 2014, 102, 275–301. [Google Scholar] [CrossRef]
  23. Lortie, C.J.; Brooker, R.W.; Choler, P.; Kikvidze, Z.; Michalet, R.; Pugnaire, F.I.; Callaway, R.M. Rethinking plant community theory. Oikos 2004, 107, 433–438. [Google Scholar] [CrossRef]
  24. Violle, C.; Enquist, B.J.; McGill, B.J.; Jiang, L.; Albert, C.H.; Hulshof, C.; Messier, J. The return of the variance: Intraspecific variability in community ecology. Trends Ecol. Evol. 2012, 27, 244–252. [Google Scholar] [CrossRef]
  25. Godoy, J.R.; Petts, G.; Salo, J. Riparian flooded forests of the Orinoco and Amazon basins: A comparative review. Biodivers. Conserv. 1999, 8, 551–586. [Google Scholar] [CrossRef]
  26. SIAC Sistema de Información Ambiental de Colombia. Available online: http://www.siac.gov.co/catalogo-de-mapas (accessed on 20 September 2020).
  27. Schneider, C.A.; Rasband, W.S.; Eliceiri, K.W. NIH Image to ImageJ: 25 years of image analysis. Nat. Methods 2012, 9, 671–675. [Google Scholar] [CrossRef] [PubMed]
  28. Williamson, G.B.; Wiemann, M.C. Measuring wood specific gravity… correctly. Am. J. Bot. 2010, 97, 519–524. [Google Scholar] [CrossRef] [Green Version]
  29. Schleuter, D.; Daufresne, M.; Massol, F.; Argillier, C. A user’s guide to functional diversity indices. Ecol. Monogr. 2010, 80, 469–484. [Google Scholar] [CrossRef] [Green Version]
  30. Cornwell, W.K.; Schwilk, D.W.; Ackerly, D.D. A trait-based test for habitat filtering: Convex hull volume. Ecology 2006, 87, 1465–1471. [Google Scholar] [CrossRef]
  31. Villéger, S.; Mason, N.W.; Mouillot, D. New multidimensional functional diversity indices for a multifaceted framework in functional ecology. Ecology 2008, 89, 2290–2301. [Google Scholar] [CrossRef] [PubMed] [Green Version]
  32. Laliberté, E.; Legendre, P. A distance based framework for measuring functional diversity from multiple traits. Ecology 2010, 91, 299–305. [Google Scholar] [CrossRef]
  33. Taudière, A.; Violle, C. cati: A R package using functional traits to detect and quantify multi-level community assembly processes. Ecography 2016, 39, 699–708. [Google Scholar] [CrossRef]
  34. Oksanen, J.; Blanchet, F.G.; Friendly, M.; Kindt, R.; Legendre, P.; McGlinn, D.; Solymos, P. Vegan: Community Ecology Package. R Package Version 2.5–6. Available online: https://cran.r-project.org/web/packages/vegan/ (accessed on 15 April 2020).
  35. Dray, S.; Dufour, A.B. The ade4 Package: Implementing the Duality Diagram for Ecologists. R Package Version 1.7–15. Available online: https://cran.r-project.org/web/packages/ade4/ (accessed on 15 April 2020).
  36. Laliberté, A.E.; Legendre, P.; Shipley, B.; Laliberté, M.E. FD: Measuring Functional Diversity from Multiple Traits, and Other Tools for Functional Ecology. R Package: 0–12. Available online: https://cran.r-project.org/web/packages/FD/ (accessed on 25 April 2020).
  37. R Core Team. R: A Language and Environment for Statistical Computing; Version 3.6.3; R Foundation for Statistical Computing: Vienna, Austria; Available online: https://cran.r-project.org/bin/windows/base/old/3.6.3/ (accessed on 30 March 2020).
  38. Parolin, P.; Ferreira, L.V. Are there differences in specific wood gravities between trees in várzea and igapó (Central Amazonia). Ecotropica 1998, 4, 25–32. [Google Scholar]
  39. González-Abella, J.S. Dinámica, Estructura y Diversidad de Bosques de Galería de la Reserva de Tomo Grande, Vichada. Bachelor’s Thesis, Universidad de los Andes, Bogotá, Colombia, 2015. [Google Scholar]
  40. Lopez, O.R.; Kursar, T.A. Flood tolerance of four tropical tree species. Tree Physiol. 1999, 19, 925–932. [Google Scholar] [CrossRef] [PubMed] [Green Version]
  41. Junk, W.J. Flood tolerance and tree distribution in central Amazonian floodplain. In Tropical Forests; Botanical Dynamics, Speciation and Diversity; Holm-Nielsen, L.B., Nielsen, I.C., Baslev, H., Eds.; Academic Press: San Diego, CA, USA, 1989; p. 645. [Google Scholar] [CrossRef]
  42. Umaña, M.N.; Norden, N.; Cano, Á.; Stevenson, P.R. Determinants of plant community assembly in a mosaic of landscape units in Central Amazonia: Ecological and phylogenetic perspectives. PLoS ONE 2012, 7, e45199. [Google Scholar] [CrossRef]
  43. Correa, H.D.; Ruíz, S.L.; Arevalo, L.M. Plan de Acción en Biodiversidad de la Cuenca del Orinoco 2005–2015: Propuesta Técnica; Instituto de Investigación de Recursos Biológicos Alexander von Humboldt: Bogotá, Colombia, 2006. [Google Scholar]
  44. Cano, A.; Stevenson, P.R. Diversidad y composición florística de tres tipos de bosque en la Estación Biológica Caparú, Vaupés. Colomb. For. 2009, 12, 63–80. [Google Scholar] [CrossRef]
  45. Kubitzki, K. The ecogeographical differentiation of Amazonian inundation forests. Plant Syst. Evol. 1989, 162, 285–304. [Google Scholar] [CrossRef]
  46. Worbes, M. The forest ecosystem of the floodplains. In The Central Amazon Floodplain. Ecological Studies (Analysis and Synthesis); Junk, W.J., Ed.; Springer: Berlin/Heidelberg, Germany, 1997; Volume 126, pp. 223–265. [Google Scholar] [CrossRef]
  47. Schmidt, G.W. Primary production of phytoplankton in the three types of Amazonian waters. IV. On the primary productivity of phytoplankton in a bay of the lower Rio Negro (Amazonas, Brazil). Amaz. Limnol. Oecol. Reg. Syst. Flum. Amaz. 1976, 5, 517–528. [Google Scholar]
  48. Parolin, P.D.; Worbes, M. Wood density of trees in black water floodplains of Rio Jaú National Park, Amazonia, Brazil. Acta Amaz. 2000, 30, 441–448. [Google Scholar] [CrossRef] [Green Version]
  49. De Bello, F.; LepŠ, J.A.N.; Sebastià, M.T. Predictive value of plant traits to grazing along a climatic gradient in the Mediterranean. J. Appl. Ecol. 2005, 42, 824–833. [Google Scholar] [CrossRef]
  50. Pinay, G.; Fabre, A.; Vervier, P.; Gazelle, F. Control of C, N, P distribution in soils of riparian forests. Landsc. Ecol. 1992, 6, 121–132. [Google Scholar] [CrossRef]
  51. Thomas, G.W. Soil pH and soil acidity. Methods Soil Anal. Part 3 Chem. Methods 1996, 5, 475–490. [Google Scholar] [CrossRef] [Green Version]
  52. Mason, N.W.; Mouillot, D.; Lee, W.G.; Wilson, J.B. Functional richness, functional evenness and functional divergence: The primary components of functional diversity. Oikos 2005, 111, 112–118. [Google Scholar] [CrossRef]
  53. Tilman, D. Biodiversity: Population versus ecosystem stability. Ecology 1996, 77, 350–363. [Google Scholar] [CrossRef]
  54. Maracahipes, L.; Carlucci, M.B.; Lenza, E.; Marimon, B.S.; Marimon, B.H., Jr.; Guimarães, F.A.; Cianciaruso, M.V. How to live in contrasting habitats? Acquisitive and conservative strategies emerge at inter-and intraspecific levels in savanna and forest woody plants. Perspect. Plant Ecol. Evol. Syst. 2018, 34, 17–25. [Google Scholar] [CrossRef]
  55. Poorter, L.; Rozendaal, D.M.; Bongers, F.; de Almeida-Cortez, J.S.; Zambrano, A.M.A.; Álvarez, F.S.; Bentos, T.V. Wet and dry tropical forests show opposite successional pathways in wood density but converge over time. Nat. Ecol. Evol. 2019, 3, 928–934. [Google Scholar] [CrossRef]
  56. Thomas, E.; Alcazar, C.; Moscoso-Higuita, L.G.; Osorio, L.F.; Salgado-Negret, B.; Gonzalez, M.; Ramirez, W. The Importance of Species Selection and Seed Sourcing in Forest Restoration for Enhancing Adaptive Potential to Climate Change: Colombian Tropical Dry Forest as a Model; Secretariat of the Convention on Biological Diversity: Rio de Janeiro, Brazil, 2017. [Google Scholar]
  57. Kattge, J.; Diaz, S.; Lavorel, S.; Prentice, I.C.; Leadley, P.; Bönisch, G.; Cornelissen, J.H.C. TRY—A Global Database of Plant Traits. Available online: https://www.try-db.org/TryWeb/Home.php (accessed on 10 May 2020).
  58. Lebrija-Trejos, E.; Pérez-García, E.A.; Meave, J.A.; Bongers, F.; Poorter, L. Functional traits and environmental filtering drive community assembly in a species-rich tropical system. Ecology 2010, 91, 386–398. [Google Scholar] [CrossRef] [Green Version]
  59. Paine, C.T.; Baraloto, C.; Chave, J.; Hérault, B. Functional traits of individual trees reveal ecological constraints on community assembly in tropical rain forests. Oikos 2011, 120, 720–727. [Google Scholar] [CrossRef]
  60. Wright, S.J.; Kitajima, K.; Kraft, N.J.; Reich, P.B.; Wright, I.J.; Bunker, D.E.; Engelbrecht, B.M. Functional traits and the growth–mortality trade-off in tropical trees. Ecology 2010, 91, 3664–3674. [Google Scholar] [CrossRef]
  61. Prado-Junior, J.A.; Schiavini, I.; Vale, V.S.; Arantes, C.S.; van der Sande, M.T.; Lohbeck, M.; Poorter, L. Conservative species drive biomass productivity in tropical dry forests. J. Ecol. 2016, 104, 817–827. [Google Scholar] [CrossRef] [Green Version]
  62. Karrenberg, S.; Edwards, P.J.; Kollmann, J. The life history of Salicaceae living in the active zone of floodplains. Freshw. Biol. 2002, 47, 733–748. [Google Scholar] [CrossRef]
  63. Junk, W.J. Structure and Function of the large central Amazonian river floodplains: Synthesis and discussion. In The Central Amazon Floodplain. Ecological Studies (Analysis and Synthesis); Junk, W.J., Ed.; Springer: Berlin/Heidelberg, Germany, 1997; Volume 126. [Google Scholar] [CrossRef]
  64. Goulding, M. The Fishes and the Forest, Explorations in Amazonian Natural History; University of California Press: Berkeley, CA, USA, 1980. [Google Scholar]
Figure 1. Location of sampled floodplain forest plots (1 ha) in Casanare, Colombia. Yellow triangles represent the location of each plot in igapó and várzea forests. The location of Casanare within Colombia is indicated in gray inset and the yellow circle denotes the study area.
Forests 11 01172 g001
Figure 2. Principal component analysis (PCA) showing the relationship between the evaluated functional traits and the two types of floodplain forests. Each point represents the individuals sampled and the colors indicate the forest to which they belong to: várzea (blue) or igapó (gray). LA = leaf area; SLA = specific leaf area; LDMC = leaf dry matter content; Lth = leaf thickness; WD = wood density; H = plant height.
Forests 11 01172 g002
Figure 3. Variation of functional traits within and between the two types of floodplain forest: várzea (blue) and igapó (gray), including the t or W-value according to the test performed (T-test or Wilcoxon test) to compare forest types. Significant differences are considered to exist when p < 0.05; n.s. denotes no significant differences. * represents p < 0.05 and *** represents p < 0.005. LA = leaf area; SLA = specific leaf area; LDMC = leaf dry matter content; Lth = leaf thickness; WD = wood density; H = plant height. The bottom and top of the boxplot indicates the 25th and 75th percentiles (respectively); the horizontal line within the box indicates the median value and the dots indicate outliers.
Forests 11 01172 g003
Figure 4. Standardized effect size (SES) for three T statistics evaluated on six functional traits in the floodplain forest (igapó and várzea): (1) plant height (H); (2) wood density (WD); (3) leaf dry matter content (LDMC); (4) specific leaf area (SLA); (5) leaf area (LA); (6) leaf thickness (Lth). The T statistics evaluated are (1) T_IP.IC (blue): ratio observed between the variance of the populations and the total variance of the communities at the individual level, (2) T_IC.IR (gray): ratio observed between the variance of each community and the total variance of the regional pool at the individual level, and (3) T_PC.PR (yellow): observed ratio between the variance of each community and the total variance of the regional pool at the population level. The filled circles represent the SES values for each of the two plots sampled according to each statistic and each trait. The crossed circles and the associated line segments represent the mean and standard deviation of the SES values, respectively, for each T statistic. The boxes delimit the confidence interval of each null model by trait: the mean SES (crossed circle) is significantly different from the random distribution if it is not within the box (p < 0.05).
Forests 11 01172 g004
Figure 5. Standardized effect size (SES) of the six functional traits evaluated for three T statistics according to each forest type. The T statistics evaluated are (1) T_IP.IC: observed ratio between the variance of the populations and the total variance of the communities at the individual level; (2) T_IC.IR: observed ratio between the variance of each community and the total variance of the regional pool at the individual level; (3) T_PC.PR: observed ratio between the variance of each community and the total variance of the regional pool at the population level. The segments observed in each figure represent the expected random ranges corresponding to each T statistic. Blue asterisks indicate significantly lower differences compared to the null models (p < 0.05). Red dots show the average SES of all traits for each T statistic.
Forests 11 01172 g005
Table 1. Descriptions and formulas used to calculate the functional diversity indices are modified from Schleuter et al. [29].
Index DescriptionFormula
Functional richness [30,31]FRicConvex volumeQuickhull Algorithm
Functional evenness [31]FEveSum of the length of the MST branches weighted by the relative abundance of the species. FEve = i = 1 S 1 min   ( PEW i , 1 S 1 ) 1 S 1 1 1 S 1
Functional divergence [31]FDivWeighted mean distance of traits of individual species to the weighted centroid of all species. FDiv = d + dG ¯ | d | + dG ¯
Functional dispersion [32]FDisDeviation of the average distance from the center of gravity weighted by relative abundance. FDis =     a i z i   a i
Community-weighted meanCWMAverage expected value of a trait in a community. CWM = i = 1 S W i X i
S: total species richness. PEW: weighted partial evenness. ∆d: sum of the variance of the weighted abundance. ∆|d|: variance of absolute weighted abundance from the center of gravity. dG ¯ : average distance from the center of gravity. ai: abundance of the species i. zi: distance of the species i to the weighted centroid. W i : relative abundance of the i-th species. Xi: value of the trait in the i-th species. FRic is expressed as the proportion of the space occupied (e.g., local community) compared to the maximum volume (e.g., regional pool).
Table 2. Species richness, Fisher’s α, Shannon and Simpson indices for the floodplain forests, várzea and igapó. # Individuals denotes the number of stems sampled in each plot.
# IndividualsRichnessFisher’s αShannonSimpson
Várzea552246.321.630.66
Igapó491298.821.850.66
Table 3. Community weighted mean (CWM) trait values (± standard deviation) according to forest type (várzea and igapó) for leaf area (LA), specific leaf area (SLA), leaf dry matter content (LDMC), leaf thickness (Lth), wood density (WD), and plant height (H).
LA
(cm2)
SLA
(mm2 mg−1)
LDMC
(mg g−1)
Lth
(mm)
WD
(g cm−3)
H
(m)
Várzea97.44 (275.01)17.55 (4.13)251.16 (74.58)0.33 (0.11)0.42 (0.13)13.68 (5.38)
Igapó484.40 (247.73)10.98 (2.03)465.30 (53.24)0.19 (0.04)0.68 (0.10)15.80 (5.91)
Publisher’s Note: MDPI stays neutral with regard to jurisdictional claims in published maps and institutional affiliations.

