Article

Variability of Leaf Wetting and Water Storage Capacity of Branches of 12 Deciduous Tree Species

1
Faculty of Forestry, Department of Forest Utilization, Engineering and Forest Technology, University of Agriculture in Krakow, Al. 29 Listopada 46, 31-425 Krakow, Poland
2
Institute of Applied Mechanics, Cracow University of Technology, Warszawska 24, 31-155 Cracow, Poland
3
Department of Forest Pathology, Mycology and Tree Physiology, University of Agriculture in Krakow, Faculty of Forestry, Al. 29 Listopada, 31-425 Krakow, Poland
*
Author to whom correspondence should be addressed.
Forests 2020, 11(11), 1158; https://doi.org/10.3390/f11111158
Submission received: 9 August 2020 / Revised: 24 October 2020 / Accepted: 28 October 2020 / Published: 30 October 2020
(This article belongs to the Section Forest Ecology and Management)

Abstract

:
Leaf surface wettability and factors which determine it are key in determining the water storage capacity of tree crowns and thus the interception of entire stands. Leaf wettability, expressed as the droplet inclination angle, and the surface free energy largely depend not only on the chemical composition of the leaves but also on their texture. The study concerns 12 species of trees common in Central Europe. The content of epicuticular waxes was determined in the leaves, and values ranging from 9.145 [µg/cm2] for horse chestnut (Aesculus hippocastanum L.) to 71.759 [µg/cm2] for birch (Betula pendula Roth.) were obtained. Each additional µg/cm2 increases the canopy water storage capacity by 0.067 g g−1. For all species, the inclination angles of water, diiodomethane and glycerin droplets to the leaf surface were measured and the surface free energy was calculated. It is shown that it is the wax content and the species that constitute independent predictors of water storage capacity. These factors explain the 95.56% effect on the value of canopy water storage capacity. The remaining 4.44% indicate non-species-related individual features or the ability to mitigate pollutants as well as possible environmental factors. Wax analyzed separately from other factors causes a slight increase (by 0.067 g/g) of S. Nevertheless, the influence of the surface condition as a result of species-related variability is decisive for the value of the canopy water storage capacity.

Graphical Abstract

1. Introduction

Determination of hydrological properties, i.e., water storage capacity and degree of leaf wettability, helps to determine the retention properties of trees and entire stands. The amount of water left in tree crowns is evapotranspired or reaches the soil with a delay, which is a significant problem [1]. Trees have their role in stormwater runoff mitigation via transpiration and stemflow [2]. The development and evolution of methods to determine water storage capacity and interception can be found in many practical studies [3,4,5]. Moreover, even the role of stable isotopes, related to interception, is pointed to in understanding rainfall interception processes [6].
Water storage capacity depends on numerous factors, which can be divided into “stand-related” and “meteorological”. Water storage capacity is not a constant value for a given species because it is enough to change one element of the environment (add wind or reduce air humidity) and the water storage capacity, as a cause and effect mechanism, will change [7].
Water storage capacity largely depends on the surface condition of the plant material [8]. Researchers observed seasonal and species-related variability [9,10]. Changes in the chemical composition of the leaves themselves are an adaptation to life in the changing seasons of the year [11]. The structure of the wax layer responsible for the way droplets adhere to it is related to chemical changes taking place especially in ageing leaves [12]. The amount of wax in the cuticle can thus regulate surface free energy and, hence, wettability. Surface Free Energy (SFP) is a numerically equal value of work that will result in the formation of a new unit of area during the separation of two equilibrium phases, assuming a reversible isothermal process. The value of surface free energy is determined based on the measurement of the angle of contact of various liquids (water, glycerin, diiodomethane) with a surface [13,14,15]. A body is wetted by a liquid when the liquid spreads over its surface or penetrates into its pores. The phenomenon of wettability depends on many factors, including surface tension of the liquid (surface tension additionally depends on the temperature) or interaction of solid particles of the liquid [8,16]. A lower contact angle indicates that the liquid will spread over a larger surface area, i.e., the surface is hydrophilic [17]. A larger contact angle indicates that the liquid minimizes contact with the surface and forms a more spherical droplet of water [18].
There is a plant division system according to their classification by Aryal and Neuner [19] ranging from the most hydrophilic to the superhydrophobic plants. This classification is based on the size of the angle at which a drop of water touches a leaf. The contact angle as a physical feature of the plant material may influence hydrological properties, such as the water storage capacity of the canopy [20].
The leaf surface texture is also affected by the changing environment, mainly the amount of pollutants [21], and this has consequences in changes in the hydrophilicity of the assimilation apparatus of both deciduous and coniferous trees [22].
Additionally, superhydrophobicity offers protection against plant pathogens, such as fungi and bacteria, as infection is limited by lack of water and moisture [23]. Some oak diseases, such as powdery mildew (Microsphaera alphitoides Griff. Et Maubl), need moisture and warm temperatures to develop conidia. The white coating of conidia clusters, which can be very numerous, is hydrophilic [24].
All these physical and hydrological properties are also very important for forest hydrology because they are related to interception, throughfall, and the amount of water reaching the forest floor, which is important for stand regeneration [25,26]. Even small changes in tree crown hydrophilicity can have large ecological consequences in natural and urbanized catchments [27,28]. Mutual relationships between the factors that may affect changes in water storage capacity of tree crowns cannot be ignored in ecohydrological research.
Since physical features enhance or weaken the mutual influence on hydrological properties, the aim of this paper is to investigate the interrelationships between species-related features, wax content, surface free energy and inclination angles. Our study takes into account differences in the structure of the upper and lower leaf sides. The influence of these characteristics of the leaves on water storage capacity has also been determined.

2. Materials and Methods

2.1. Sampling Collection and Methodological Assumptions

The location of the city park where the samples were collected was 050°04′15.2″ N 019°59′32.8″ E (Krakow, Southern Poland). Branches of 12 deciduous tree species were collected for research on sunny days, between 19th and 28th of June 2019, in the morning (7:00–8:00 am.). The following species common in Central Europe were analysed: birch (Betula pendula Roth), willow (Salix caprea L.), privet (Ligustrum vulgare L.), ash (Fraxinus excelsior L.), oak (Quercus robur L.), sumac (Rhustyphina L.), robinia (Robinia pseudoacacia L.), small-leaved lime (Tilia cordata Mill.), lilac (Syringa vulgaris L.), olive (Elaeagnus angustifolia L.), maple (Acer platanoides L.), horse chestnut (Aesculus hippocastanum L.). Five trees were selected from each species, and two branches were sampled from each tree. In total, each analysis for one species was performed in ten replications.
The branches with a length of about 0.5 m were collected in the middle of crown height, on the north side. The samples selected had no visible signs of disease or dirt. From the entire branch sampled, a fragment of about 40 cm was used to simulate rainfall and determine water storage capacity (S). The leaves from the remainder of the branches were used to determine the water droplet inclination angles on the upper (Ang_ad) and lower (Ang_ab) sides of a leaf, the surface free energy, also on the upper side (SFP_ad) and lower sides (SFP_ab), and the wax content (Wax).
The above-mentioned components, measured in the study, were used in statistics but, additionally, measurements were performed for the inclination angles of diiodomethane and glycerin droplets ( θ G , θ D ) , and calculations crucial to obtain the surface free energy were carried out. They are described in the methodology and the results are included in additional materials. The leaves had not been washed before the tests. Microscopic observations as well as analyses of wetting, SFP and S were carried out within 2 h of sampling. Until the tests, the samples had been stored in sealed polypropylene containers at 18 °C. The microscopic observations of the surface condition were performed with the use of the Zeiss Stereo Discovery.V8 microscope (Carl Zeiss Microscopy GmbH, Jena, Germany), equipped with an AxioCam ERc5S camera (Carl Zeiss Microscopy GmbH, Jena, Germany), and AxioVision v.4.8.2 software (Carl Zeiss Microscopy GmbH, Jena, Germany). Photos were taken of the top and bottom surfaces of the leaves using a 15× and 120× magnification. Figure 1 presents a sample image while all photos are in additional materials (Figure S1).

2.2. Canopy Water Storage Capacity Measurement

The water storage capacity of tree crowns (S) was measured by simulating rainfall on a 30–45 cm fragment of each sampled branch. The branches were weighed fresh to determine the biomass (BM). Precipitation was simulated by sprinkling the branch suspended on a scale using a fishing line. The weighing was repeated after sprinkling. The amount of water retained was calculated from the difference between the wetted and the dry branch (A). The arrangement of branches during sprinkling was similar to their natural arrangement on the tree [29]. A fixed dose of water (P) was established, amounting to 150 g. The amount of water was matched to the size of the branch and it had been checked beforehand what dose of water was necessary to saturate the branches with water, i.e., to obtain the maximum water storage capacity [20,24].
The water storage capacity of the branches was calculated according to the formula used by Garcia [30]: S = A/BM [g g−1]. Water storage capacity can also be related to branch surface area, but in this case, it was decided to relate it to the biomass because it is a good predictor for calculating the water storage capacity of tree crowns [30].
Distilled water (Poch S. A., Gliwice, Poland) was used for the simulated wetting. The branches were sprinkled at a constant distance with water at a temperature of 21 °C, which was 1 degree lower than the temperature in the laboratory.

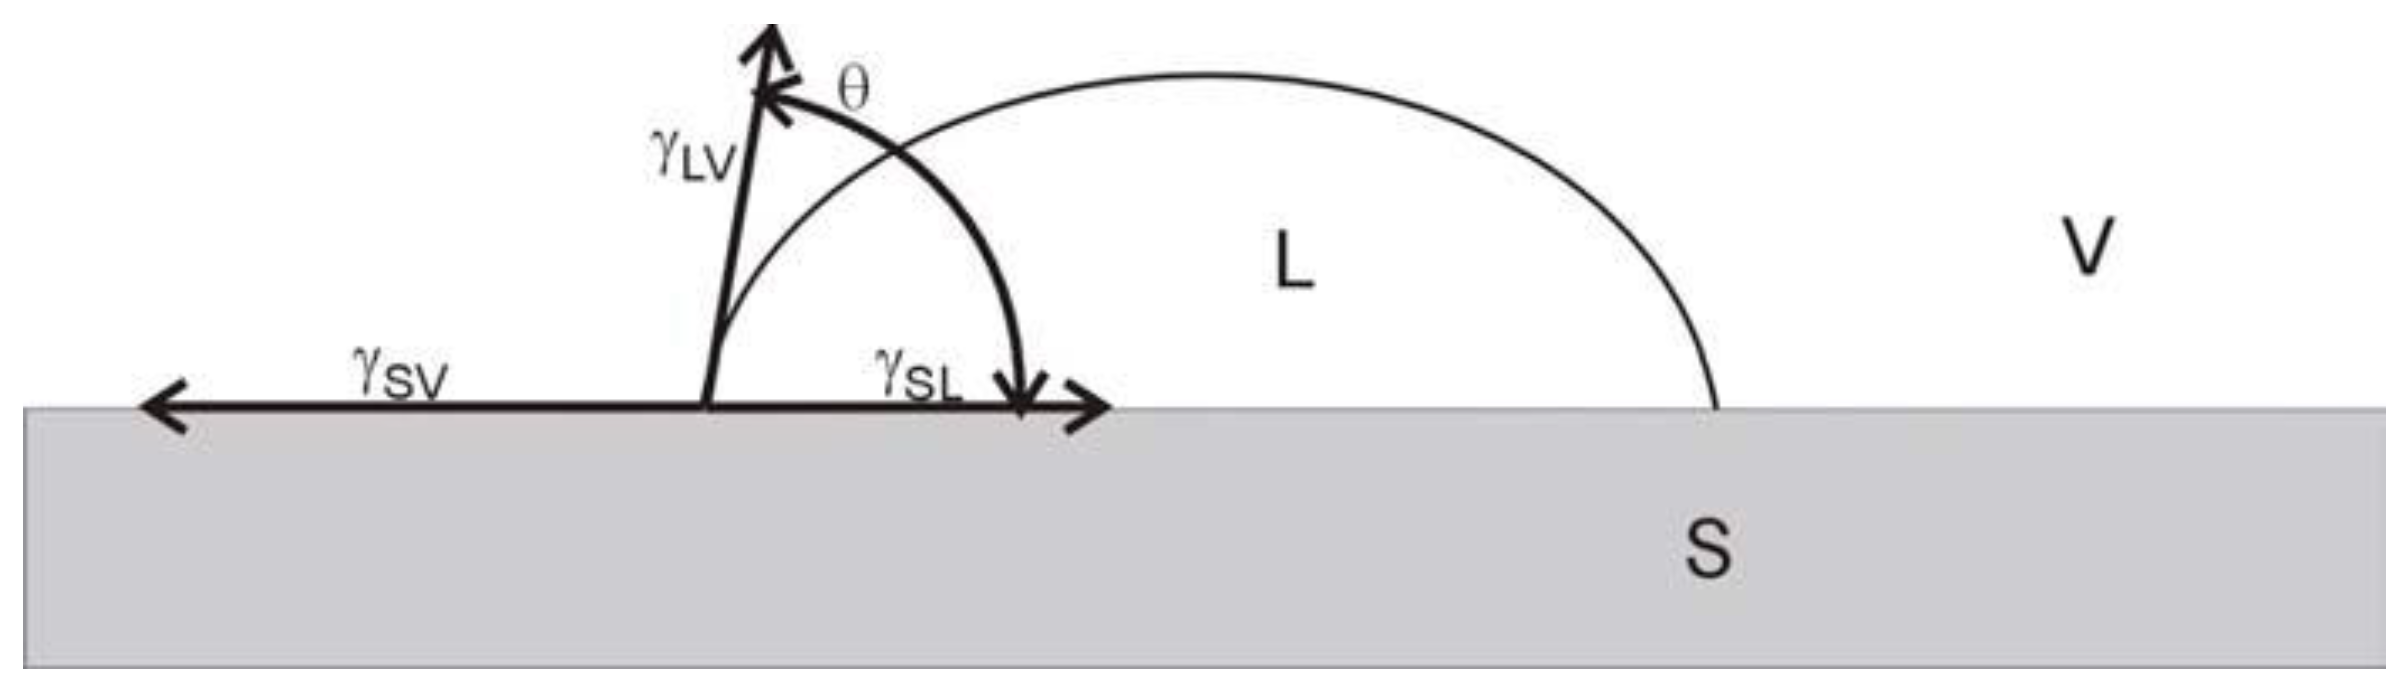
2.3. Methods to Measure Inclination Angles and Determine Surface Free Energy

The measuring liquids used in the analysis of the contact angle are: distilled water (Poch S. A., Gliwice, Poland), glycerin (Chempur, Piekary Śląskie, Poland) and diiodomethane (MERCK KGAA (Darmstadt, Germany). Using a manual Vitrum micropipette with the 0.5 mm inner needle diameter and the volume range of 0.5–10.0 µL, ten drops of each liquid with the 0.5 µL volume each were deposited on each type of surface. This allowed for taking into account the surface layer heterogeneity and topography as well as for averaging errors. The temperature of the surroundings during the measurements was 22 ± 1 °C. After depositing on the surface, the drops were recorded at an equal time interval of 1 s. Using the SeeSystem 6.3 (Advex Instruments s.r.o., Brno, Czech Republic) software, the contact angles of water ( θ W ) , glycerin ( θ G ) and diiodomethane ( θ D ) were determined based on the Young–Laplace equation (Table 1).
The station used to assess the value of the contact angle and determine the amount of surface free energy of the materials consists of a goniometer-type device from the Czech company Advex Instruments. It is a table with a possibility to control the level and movement in a plane parallel to the tested surface. The device is equipped with a digital camera that can move in the direction perpendicular to the tested surface. The position of the table and the camera is recorded and transferred to the programme integrated with the device. In this way, control over the test area is achieved. The recorded photo of the surface of the test material on which a droplet of the measuring liquid is deposited is transferred for further analysis. Using the software, it is possible to measure the value of the contact angle of various measuring liquids, and then apply the algorithms available in the programme to determine the SFP. This method had been tested for dead wood [31]. Measurements of the angle of the liquid droplets 3 to the leaf surface and the measurements needed to obtain free surface energy are presented in the additional material (Tables S1 and S2).
The contact angle is defined by the Young law, based on the shape of a liquid droplet on the surface of a solid in the presence of the liquid vapours. Using the Young equation, i.e., the assumption of the equilibrium of forces on the body-S/liquid-L/gas-V interface, as shown in Figure 2, it follows that:
γ S V = γ S L + γ L V · c o s θ
The symbols γ S V , γ S L , γ L V denote surface free energy [mJ/m2], respectively of solid S in contact with vapours V, solid S in contact with liquid L, and liquid L in contact with vapours V.
The work of adhesion W a d between the solid phase S and the liquid phase L is equal to the sum of the surface free energies of both components, minus the interphase free energy at the S/L interface:
W a d = γ S + γ L γ S L
By introducing equation (2) in the form γ S V = γ S L + γ L V · c o s θ and assuming that γ L = γ L V , we obtain:
W a d = γ S + γ L γ S L = γ S + γ L γ S L + γ L V · c o s θ = γ L · ( 1 + c o s θ )
Equation (3) became the basis for determination of the surface free energy of the solids, and for determination of the composition of the surface layers containing both hydrophilic and hydrophobic groups.
It is not possible to determine the total surface free energy of material γ s directly, therefore methods based on the measurement of the contact angle of two or three measuring liquids with known surface tension values are applied, respectively obtaining a system of two or three equations (Table 1). The Owens–Wendt, VanOss plus Good and Zisman methods were applied to determine γ s [32,33,34].

2.3.1. The Owens–Wendt Model

The Owens–Wendt model requires the use of two liquids (one polar and the other dispersive). Using this model, an approximation is obtained taking into consideration the geometric mean of polar components γ S p and γ L d ; The Owens–Wendt model is described by the following formulas:
1 2 ( 1 + c o s θ ) γ L = ( γ S d γ L d ) + ( γ S p γ L p )
γ S = γ S d + γ S p
γ s d —dispersion component (Lifshitz–Van der Walls).
γ s p —polar component (Lewis acid-base).

2.3.2. The Van Oss–Chaudhury–Good Model

This model also assumes the division of energy into components. The γ s division includes long-range interactions called Lifshitz–Van der Waals interactions ( γ S L W ) , as well as short-range interactions known as acid–base. The other component is considered as Equation (2), where γ S + and γ S are the acidic and the basic components, respectively related to the acid–base interaction.
1 2 ( 1 + c o s θ ) γ L = γ S d γ L d + γ S + γ L + γ S γ L +
γ S = γ S d + γ S p
γ s p = 2 γ S + γ S
γ s —surface free energy of the tested material.
γ S d = γ S L W —dispersion component of the surface free energy of the tested material, of Lifshitz–Van der Waals {LW}.
γ S p = γ S A B —polar component of the surface free energy of the tested material, Lewis acid–base {AB}.
γ L —surface free energy of the measuring liquid
γ L d —dispersion component of the surface free energy of the measuring liquid
γ L p —polar component of the surface free energy of the measuring liquid
γ S + ,   γ S —acid and basic ingredients.

2.3.3. The Zisman Method

By measuring the angles θ i for the homologous series of compounds with a decreasing value of surface tension γ L , Zisman observed linear dependence of γ L on c o s θ i value:
c o s θ i = 1 β · ( γ L γ C )
where β —constant, γ C —critical surface tension, at which, when γ L = γ C , then c o s θ i = 1 , i.e., the test surface is completely wetted by hypothetical solvent with surface tension value ( γ C ). The γ C value is determined from γ L extrapolation, for which c o s θ i = 1 .

2.4. Measurement of the Wax Content in the Leaves

The epicuticular wax content was determined by a modified colorimetric method [35], adapted to the needs of the microplate reader. The reagent was prepared by adding 20 g of potassium dichromate K2Cr2O7 to 40 mL of distilled water, to which 1 L of concentrated sulfuric acid H2SO4 was then slowly added and, while stirring, it was heated until the sediment was completely dissolved.
The extraction of epicuticular waxes was performed in triplicate for each sample. A single sample consisted of the cut leaf discs with a total surface area of 30 cm2. The sample was flooded with 1.5 mL of chloroform and shaken for 15 s, then poured into a new tube and centrifuged for 5 min at 8 °C (13,000 rpm). The supernatant was then transferred to a new tube and evaporated in a boiling water bath until the smell of chloroform disappeared. In the next step, 0.5 mL of reagent was added and the samples were heated in a boiling water bath for 30 min. After cooling for 5 min, each sample was diluted by adding 1.2 mL of deionized water and then, after waiting a further 5 min for colour development, it was transferred to a 96-well plate. Absorbance readings were taken at a wavelength of 590 nm with a microplate reader (Synergy 2, Bio-Tek, Winooski, VT, USA). The content of epicuticular waxes was read from a calibration curve prepared for carnauba wax and expressed in µg/cm2 of leaf area.

2.5. Statistical Analyses

The multivariate analysis of the independent influence of many variables on S was performed using the linear regression method. The influence of inclination angles was analysed only for water because it reflects the response of trees to rainfall. The results of inclination angles for glycerin and diiodomethane were used to calculate the surface free energy and are included in additional materials. The results are presented in the form of regression model parameters with a 95% confidence interval. As the analysed quantitative variables did not have a normal distribution, the comparison of the species was performed using the Kruskal-Wallis test and, if statistically significant differences were found, post-hoc analysis with Dunn’s test was performed to identify statistically significantly different groups. The correlations between them were analysed using Spearman’s rank correlation coefficient. The strength of the dependencies was interpreted according to the following scheme: |r| ≥ 0.9—very strong dependence, 0.7 ≤ |r| < 0.9—strong dependence, 0.5 ≤ |r| < 0.7—moderately strong dependence, 0.3 ≤ |r| < 0.5—weak correlation, |r| < 0.3—very weak (negligible) relationship [36]. The normality of distribution of the variables was tested using the Shapiro-Wilk test. The significance level of 0.05 was adopted in the analysis. Thus, all p values below 0.05 were interpreted as showing significant relationships. The analysis was performed in the R programme, version 3.4.4 [37].

3. Results

The present study focused on the mutual relationships between the physical properties of leaves and water storage capacity as well as the mutual relationships between the analysed factors. The results of the analyses described in the methodology, and necessary to examine the dependencies in question, as well as examples of liquid droplet images, are included in the additional materials (Supplementary Materials).

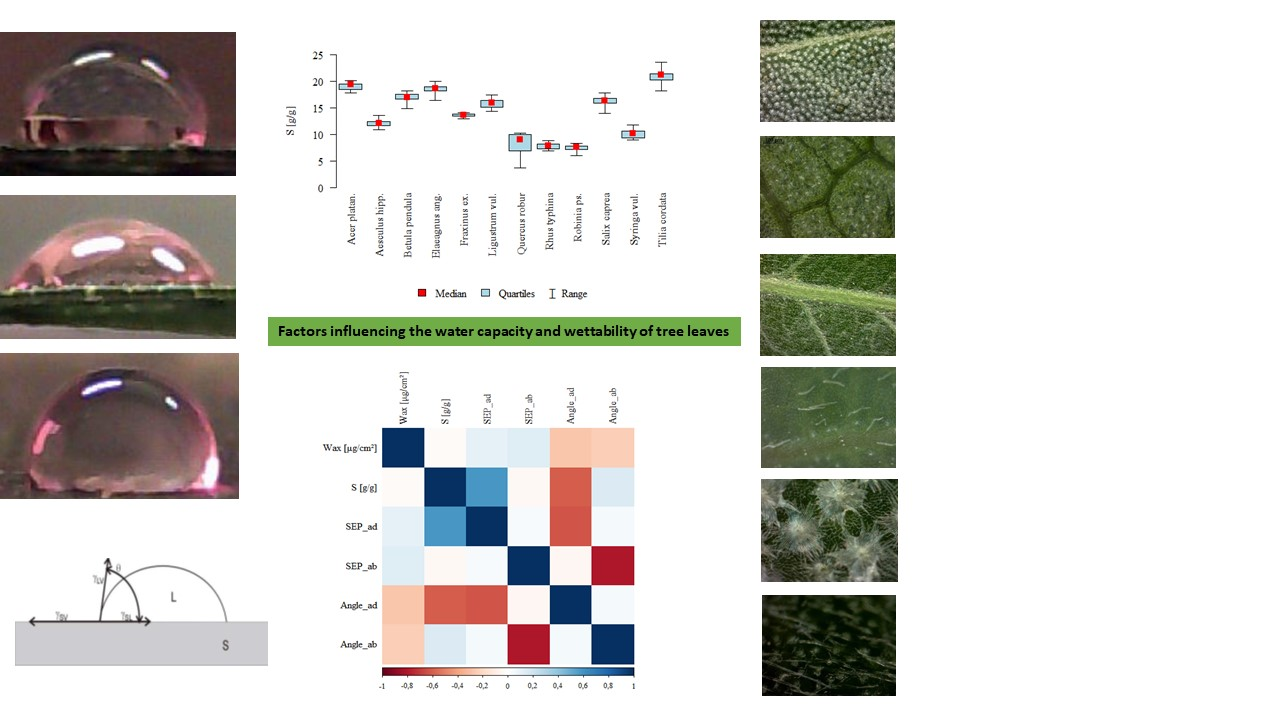
3.1. The Influence of Factors: Species, Wax, SFP_ad, SFP_ab, Ang_ad, Ang_ab on Water Storage Capacity S

The linear regression model showed that the independent predictors of S [g/g] (p < 0.05) were wax content and species. Each additional µg/cm2 of wax content increases S by an average of 0.067 g/g, as evidenced by the regression parameter (B) (Table 2).
In the analysis of the influence of species, Acer platanoides was adopted as a reference species. Aesculus hippocastani lowers S by an average of 4.391 g/g; Betula pendula lowers S by an average of 4.905 g/g; Fraxinus excelsior lowers S by an average of 3.848 g/g; Quercus robur reduces S by an average of 11.104 g/g; Rhus typhina lowers S by an average of 12.04 g/g; Robinia ps. reduces S by an average of 13.941 g/g; Syringa vul. reduces S by an average of 7.336 g/g; Tilia cordata lowers S by an average of 2.164 g/g (Table 2).
Standardized (beta) parameters show the strength of the influence of particular variables on S [g/g]. Therefore, it becomes evident that among the species in question the strongest impact on S is exerted by Quercus robur, Rhus typhina and Robinia ps. The influence of the wax in the leaves is not dominant.
The R2 coefficient for this model was 95.56%, which means that 95.56% of the variability of S [g/g] was explained by the variables chosen for the model. The remaining 4.44% depends on the variables not included in the model and on random factors.
In order to be able to fully answer the question of which of the analysed factors influence the hydrological properties, the interrelationships between species, Wax, S [g/g], SFP_ad, SFP_ab, Ang_ad, Ang_ab were also examined.

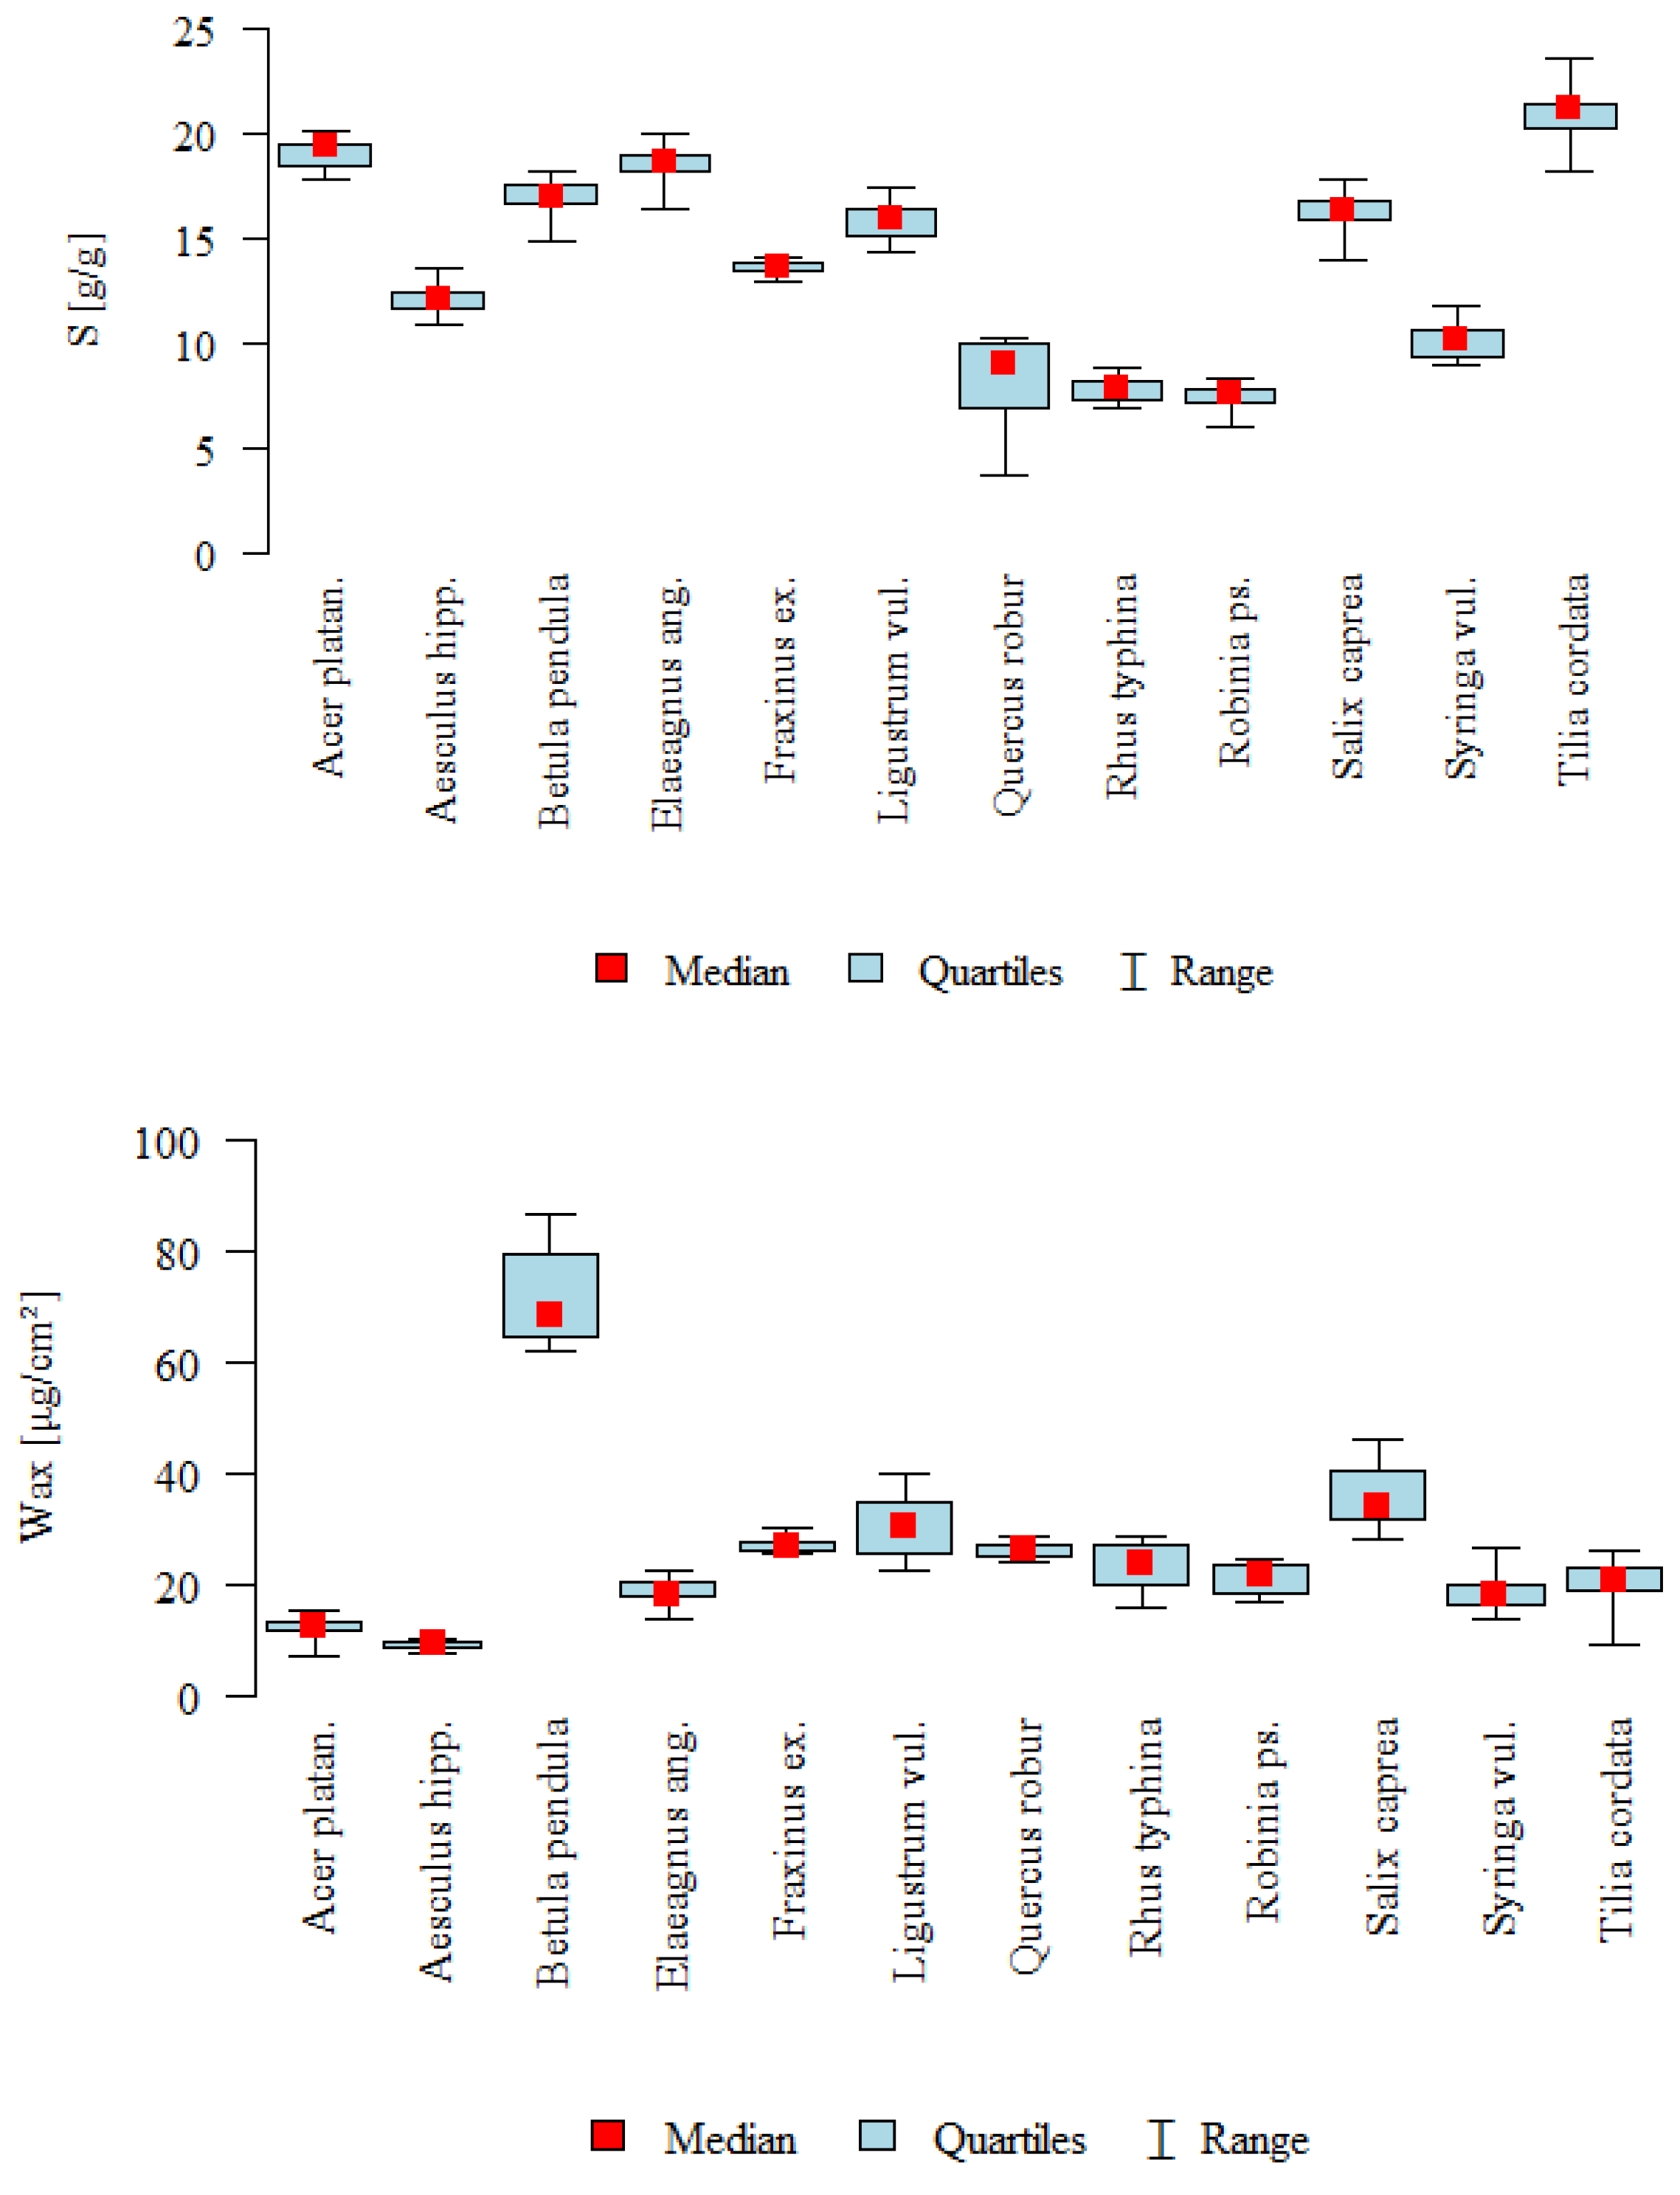
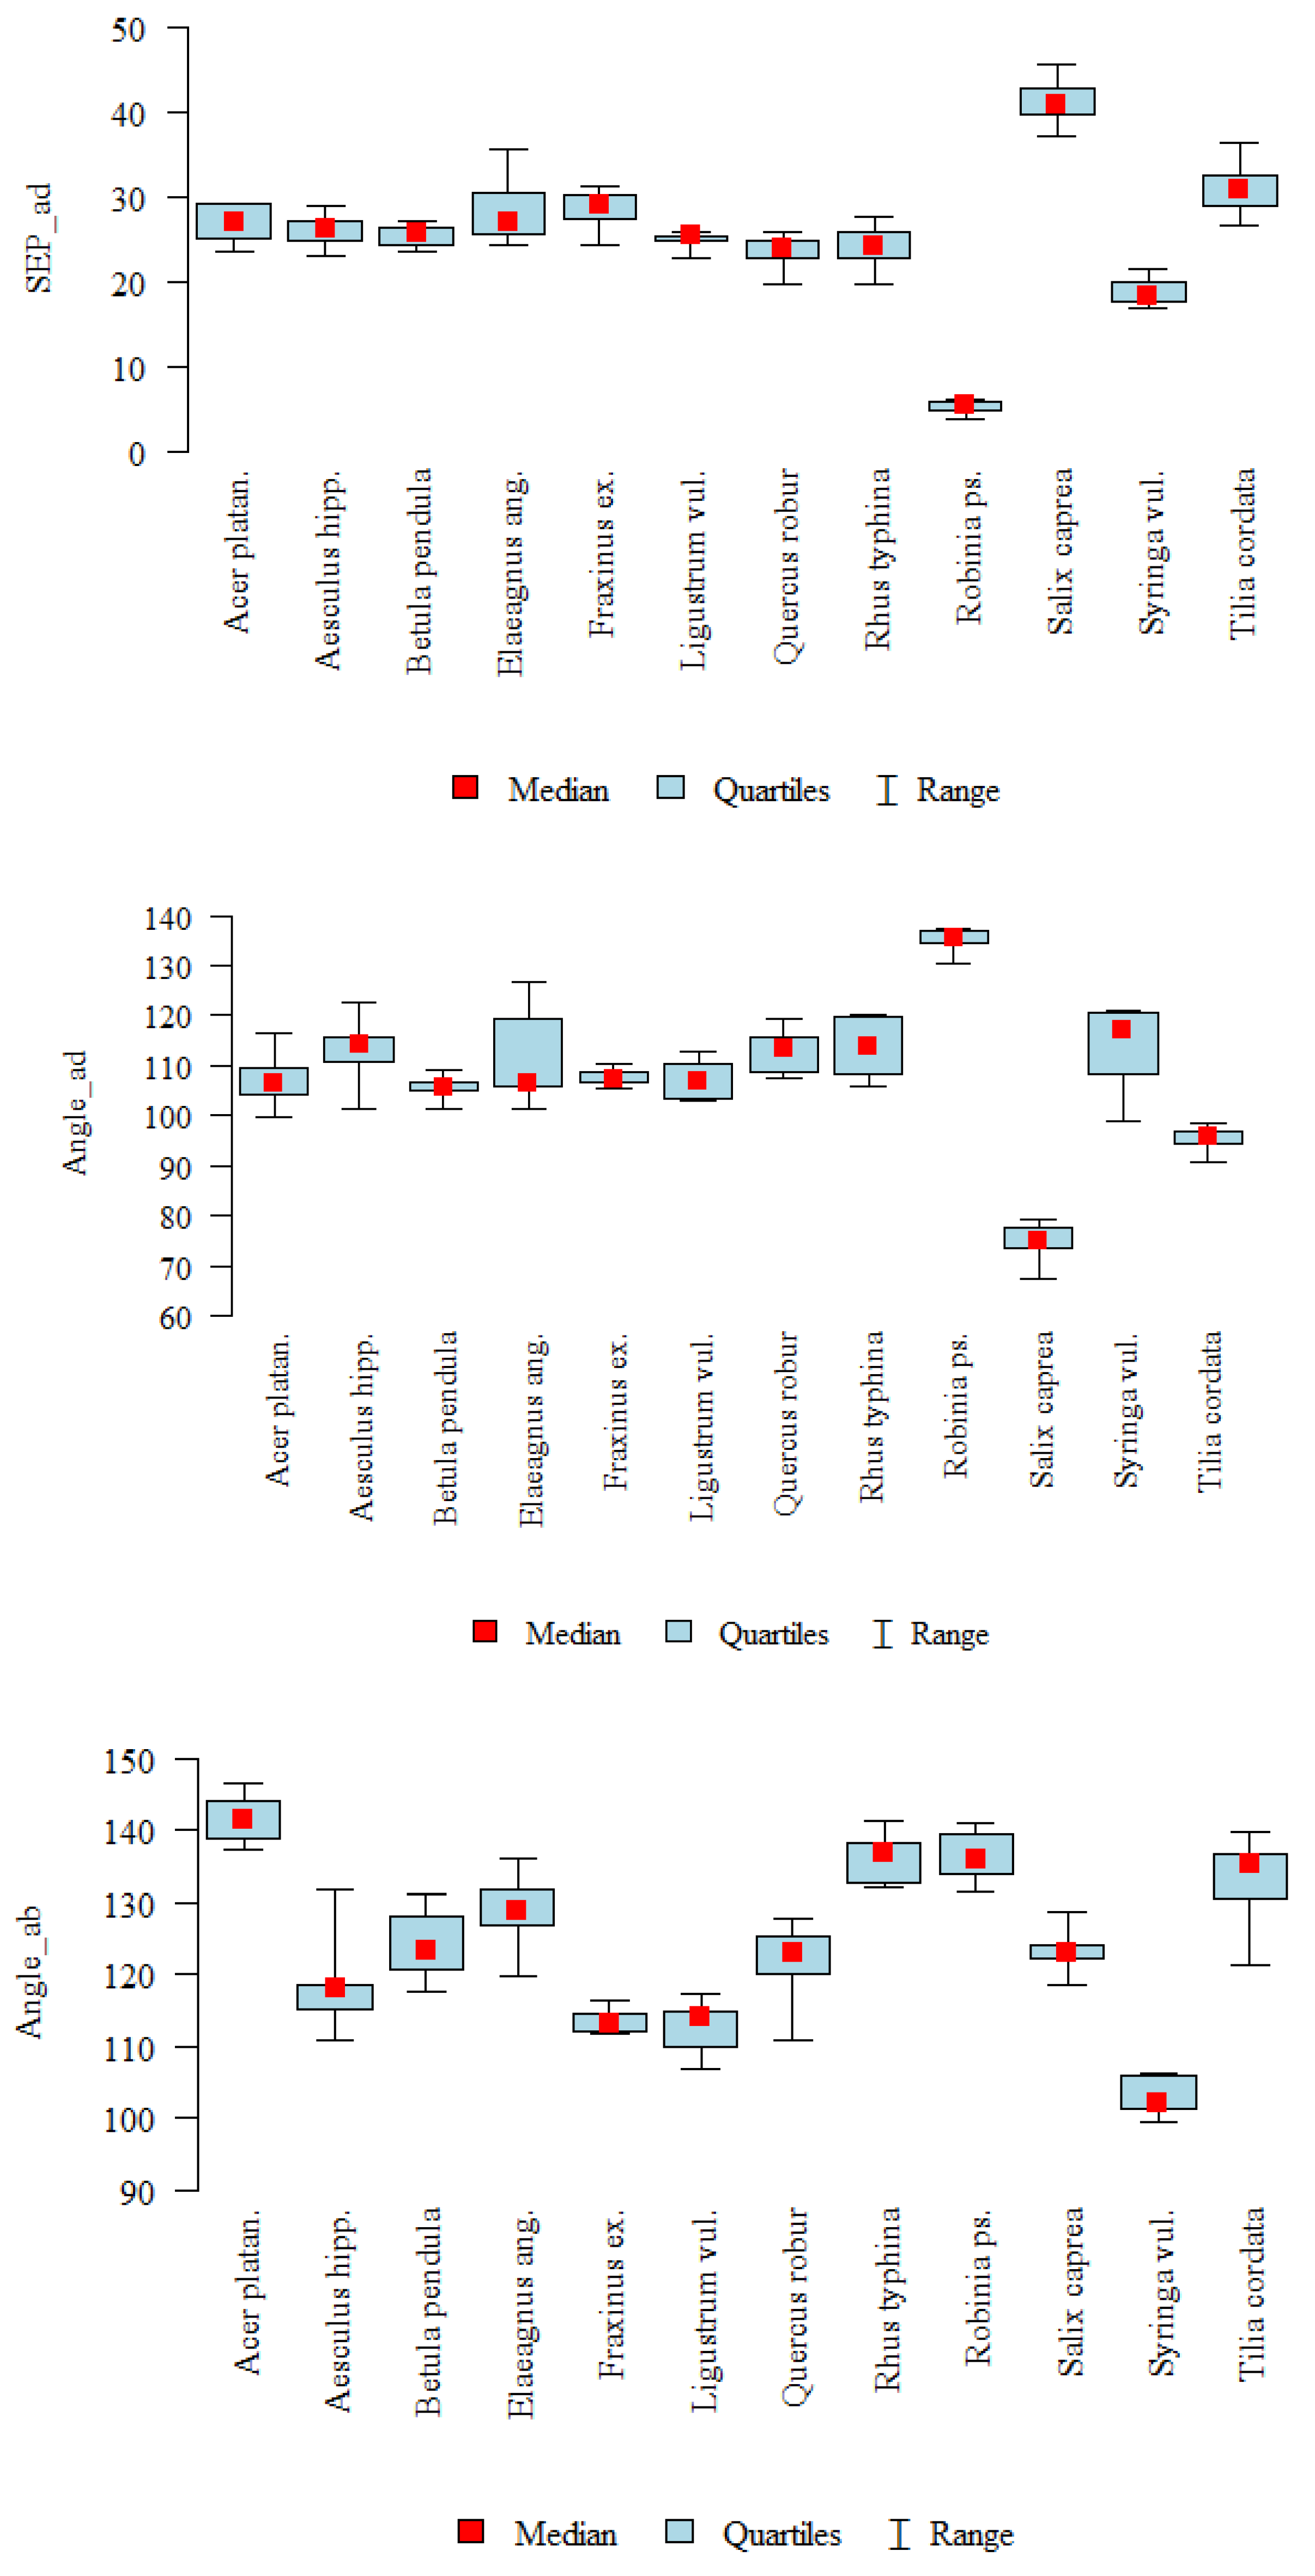
3.2. The Influence of Species on the Other Parameters

The species is a qualitative variable while the remaining parameters are quantitative. The measurements did not have a normal distribution (p from the Shapiro-Wilk test below 0.05) in the analysed groups, therefore the analysis was carried out using the Kruskal-Wallis test (Table 3), and the diagram shows the medians, quartiles and ranges of values for individual variables (Figure 3).
p values are lower than 0.05 for all parameters, so the analysed species differed significantly in all parameters. To answer the question of what exactly this relationship looks like, the post-hoc analysis was performed. The table has letter symbols for the following species: A—Acer platan.; B—Aesculus hipp.; C—Betula pendula; D—Elaeagnus ang.; E—Fraxinus ex.; F—Ligustrum vul.; G—Quercus robur; H—Rhus typhina; I—Robinia ps.; J—Salix caprea; K—Syringa vul.; L—Tilia cordata.
The results of this analysis are presented in the last column of Table 3; e.g., for the leaf wax content (Wax), we can see that: for species C, this parameter was higher than for species A, B, D, H, I, K, L; for species J this parameter was higher than for species A, B, D, I, K, L; for species E, F, G this parameter was higher than for species A, B; for species H this parameter was higher than for species B.
The diagrams present the medians, quartiles and ranges of values for individual variables (Figure 3). The diagrams (Figure 3) show that the angle of contact with the upper leaf surface is similar for most species. Robinia pseudoacacia can be distinguished for the highest contact angle, i.e., the lowest wettability, and Salix caprea for the smallest contact angles, i.e., high wettability. Low contact angles mean that a droplet adheres well to the surface.
The water storage capacity and the contact angle of the lower leaf surface display inversely proportional values. Where the angle decreases, the water storage capacity increases. This is due to the fact that the smaller the angle, the better the droplet adheres to the leaf surface, which translates into a higher water storage capacity of the plant material.
Pedunculate oak (Quercus robur), staghorn sumac (Rhus typhina) and black locust (Robinia pseudoacacia) have the lowest water storage capacity. Small-leaved lime (Tilia cordata) has one of the higher capacities.

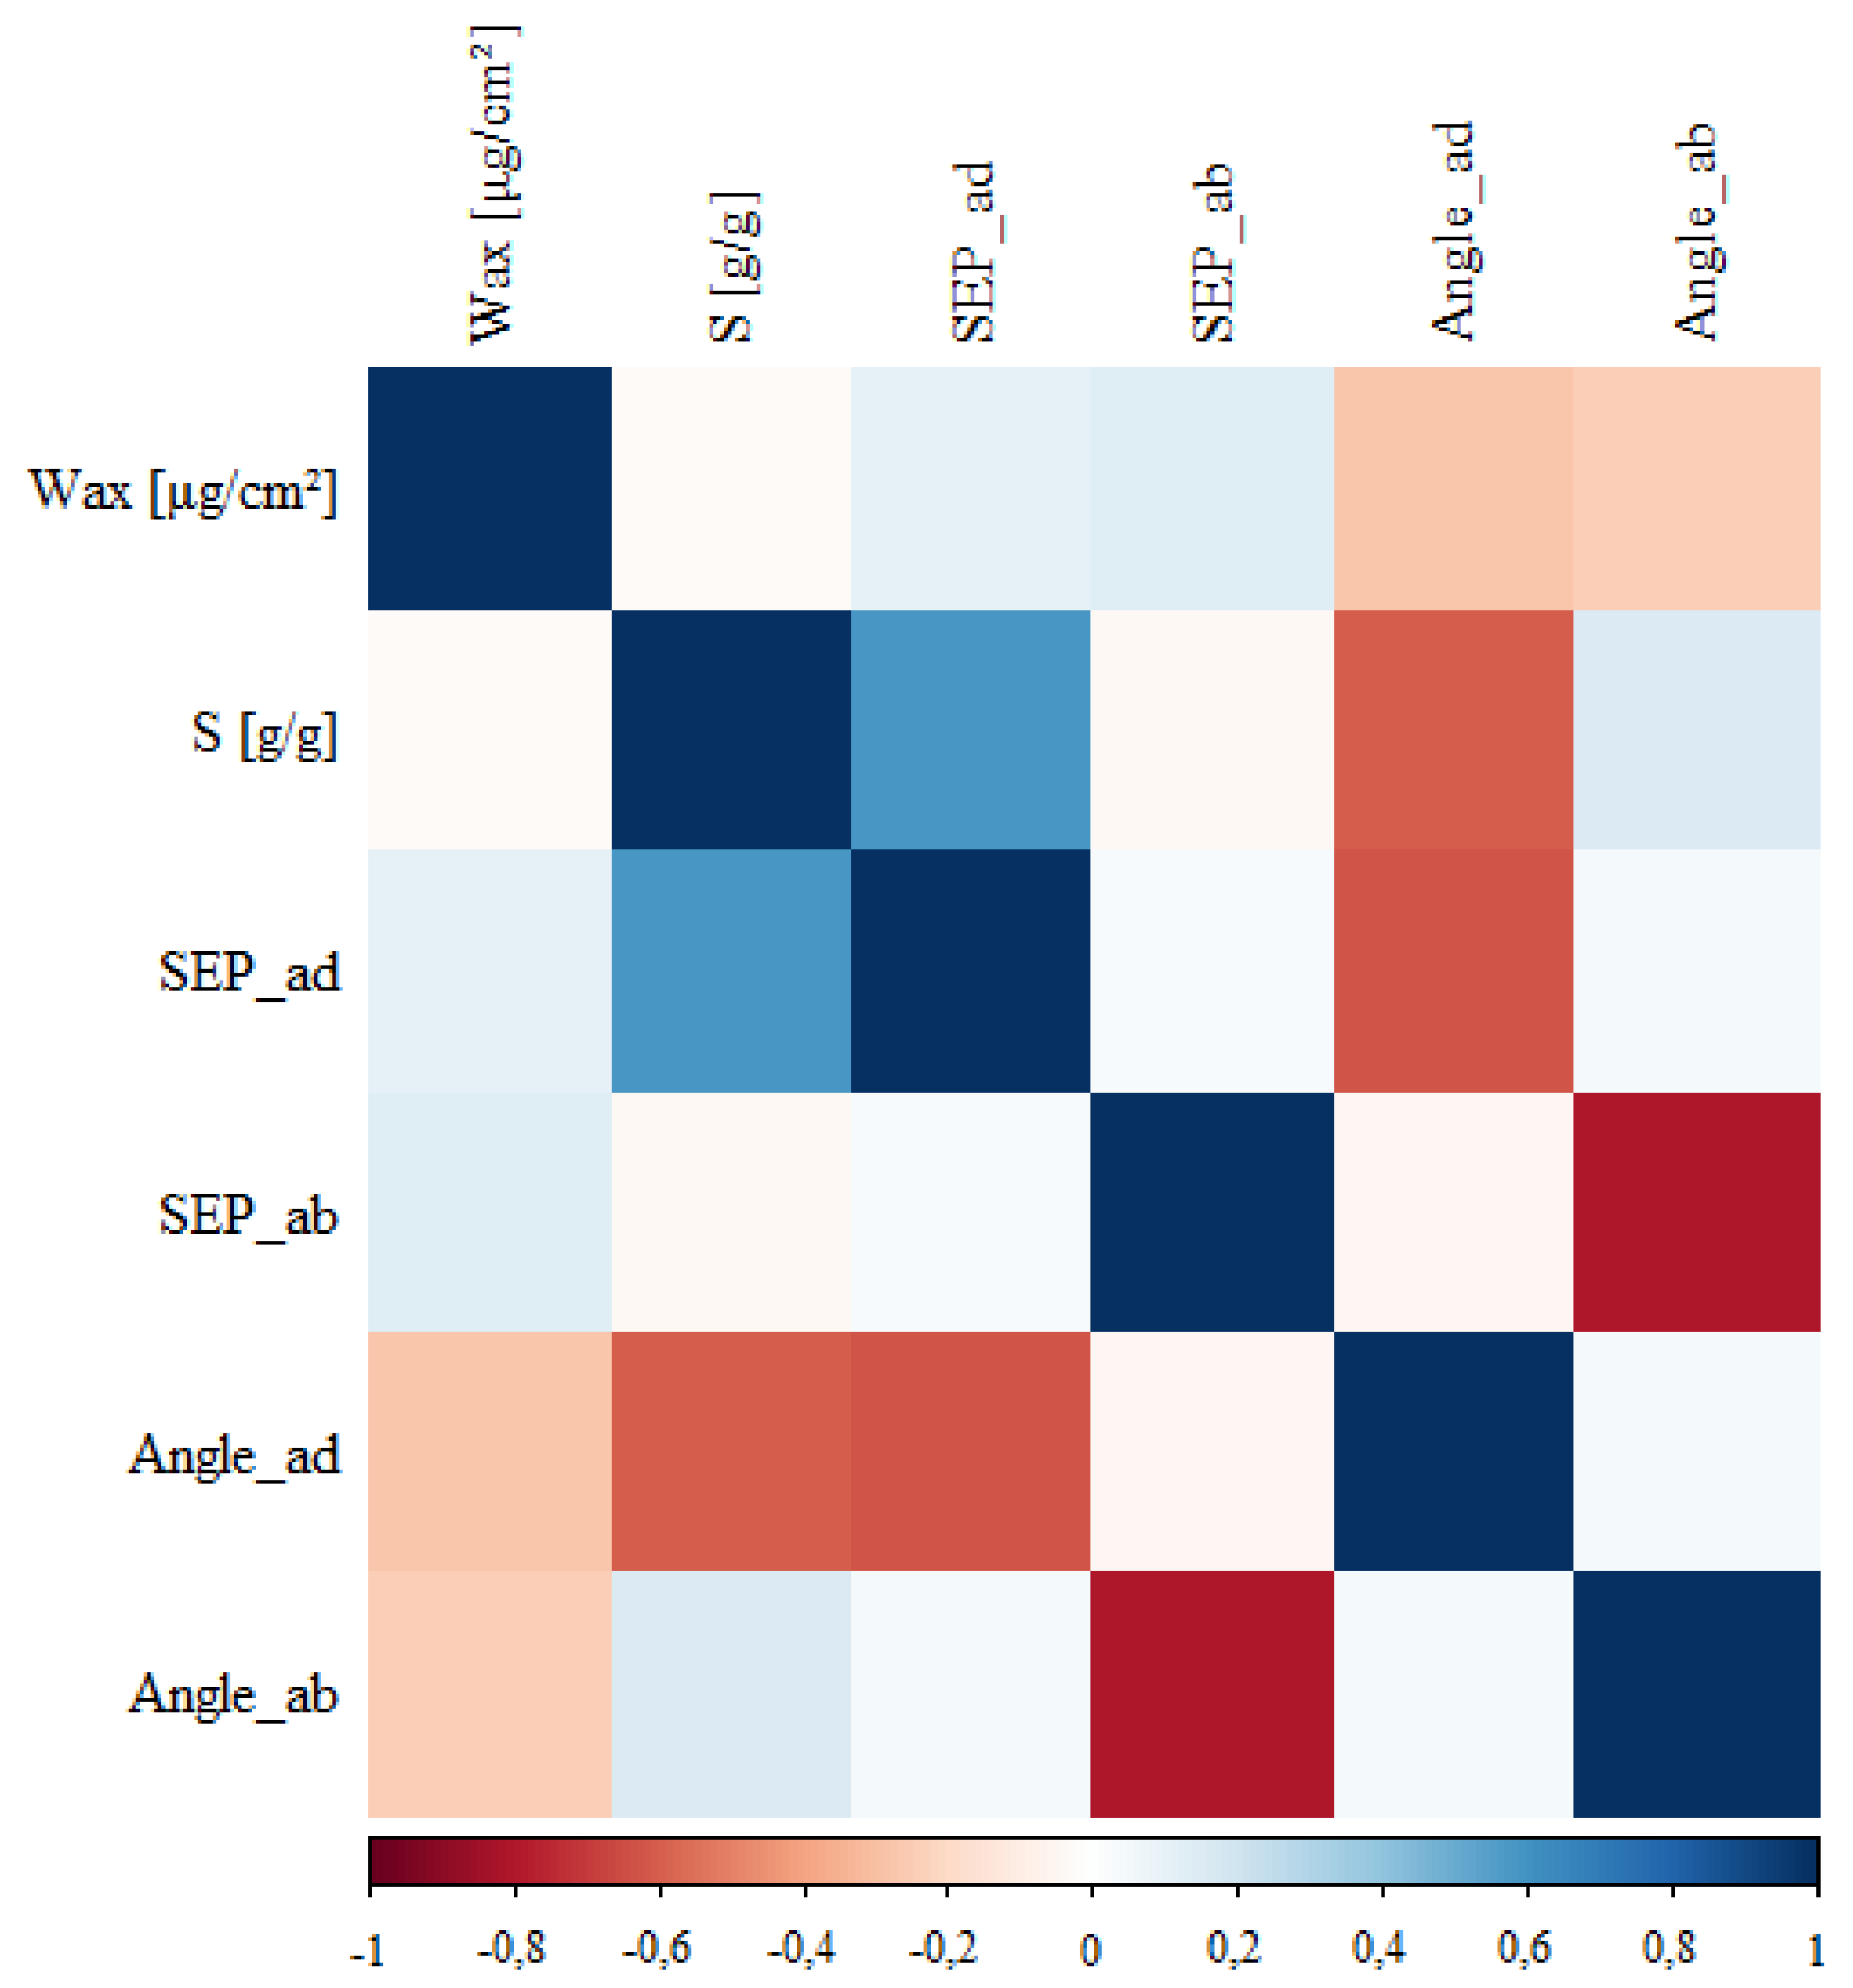
3.3. The Remaining Relationships

The analysed features did not have the normal distribution (p from the Shapiro-Wilk test below 0.05), therefore the analysis was based on the Spearman correlation coefficient.
The correlation coefficients between the analysed variables are shown in the so-called heat map below (Figure 4). The blue areas represent strong positive correlations whereas the red areas represent strong negative correlations. The white areas denote a lack of correlation. Altogether, six relationships are statistically significant (p < 0.05). Positive relationships are those where both variables “head in the same direction” (i.e., the greater the value of one of them, the greater the value of the other). We can observe that the greater the SFP_ad, the greater the S (and vice versa). Negative relationships are those where the variables are inversely proportional. There we can observe the following relationship: the lower the wax content in the leaves (Wax), the greater the angle of droplet adherence to the upper (Angle_ad) and lower (Angle_ab) leaf surfaces. Larger contact angles indicate that the leaves are hydrophobic, meaning that the droplet adheres less to the surface.
It can be observed that as droplet contact angles increase, the canopy water storage capacity decreases and the surface free energy (SFP) decreases. The details of the relationships are presented in the table in the additional materials (Table S3),

4. Discussion

The obtained results show that the factors significant for S are the wax content and the species-related features, i.e., morphology differentiating individual leaves. An increase in the wax content did not decrease the water storage capacity and wettability of the plant material.
Rather, the main role of leaf waxes is to retain water inside an organism. In the case of young leaves, the wax content is high and the adhesion of water to the leaf surface is greatly influenced by structures such as thorns and hairs, which are often characteristic only of young leaves (Appendix A).
Species-related differences have been described in many studies on ecohydrology [15,18,29]. The species itself is not an easy parameter because it has many immeasurable features. It is the texture that can significantly increase water storage capacity and wettability [24].
Among the analysed species, Acer platanoides retains the most water, while Robinia pseudoacacia, Rhus typhina and Quercus robur retain the least (Figure 3). Similar studies on species variability were conducted by Koch and Barthlott [38], Rosado and Holder [8] and Fernández et al. [13].
Moreover, what is significant for the whole process of water retention are the interrelations of the measured parameters, such as contact angles of the lower and upper leaf surface and the surface energy as related to species [39,40].
Betula pendula clearly has the highest percentage of waxes among the studied species and, at the same time, has a fairly high water storage capacity (Table 3, Figure 3).
The surface free energy of the upper and lower leaf sides differs significantly within a single species. For most species, the SFP_ad is similar; values lower than average were found for Robinia ps. and Syringa vul., and even lower for Salix caprea and Tilia cordata.
The SFE of the lower leaf side is less responsible for water retention, and it is here that the species-related features associated with the presence of stomata become apparent.
The contact angle of water droplets with the upper leaf surface is inversely proportional to the surface energy. The same is true of the lower side of the leaf. Thus, one can speak of a clear relationship between leaf wettability and surface free energy.
A comparison of the obtained results to the classification of hydrophobicity by Aryal and Neuner [19], taking into account the hydrophobicity of the upper leaf surface, leads to including Salix caprea among plants with high wettability. The species with good wettability include: Fraxinus ex., Tilia cordata, Acer platan. and Betula pendula. The remaining species, namely: Syringa vul., Rhus typhina, Robinia ps., Elaeagnus ang., Aesculus hipp., Quercus robur are plants with low wettability.
An analysis of the lower leaf surface reveals that none of the studied species can be classified as highly wettable plants. On the other hand, only Syringa vul. can be classified as a plant with good wettability. However, Fraxinus ex., Ligustrum vul., Salix caprea, Elaeagnus ang, Aesculus hipp, Quercus robur, Betula pendula are species that are difficult to wet. The remaining species, namely: Rhus typhina, Robinia ps., Acer platan., are very difficult to wet.
These considerations can be summed up in terms of a heat map (Figure 4), where we can see that water storage capacity is strongly positively correlated with SFP_ad and negatively correlated with the angle of inclination to the upper side of the leaf. That is, by changing the surface free energy, we can control the wettability of leaves, which is used in substances applied in horticulture in the form of spraying [41]. The heterogeneity of the influence of the amount of surface free energy on the adhesion of water was stated by Wang et al. [16]. A change of surface free energy through chemical treatments in fertilization and application of fertilizers makes us realize how important this process is [13].
The chemical composition and surface structure of the leaves are internal causes, but the environment can also influence wettability and water storage capacity [42].
It is known from the literature that contact angles increase with growing wax content. However, research has shown that contact angles are more dependent on wax structure complexity and surface microrelief itself than solely on the absolute amount of wax. The wax content, even within a single species, may vary depending on seasonal changes. For example, for Quercus robur it varies from 17 to 50 µg/cm2 during the growing season [12]. The amount of wax may have a more complex effect on water storage capacity. The presented research is in the category of basic research. Only after these physical and hydrological relationships are identified, a wide window opens for population studies and taking into account genetic variation within a species [43,44].
Species with a high wax content accumulate more pollutants inside [45], which results in the acceleration of ageing and changes of texture [46]. Rougher leaves have higher water storage capacity [47]. What is important for water adhesion is also the form of wax as a film or crystals [42].
However, each species has specific characteristics that may individually affect the degree of droplet adhesion and the amount of water retained in the crowns. Species-related differences in terms of the amount of water storage capacity were also visible for small-leaved lime and poplar, regardless of whether the samples were collected in a forest area or in the city centre [48]. In the present study, it is the species-related features that turn out to have a significant impact on water storage capacity. These species-related features include, for example, the presence of large or tiny hairs, or the leathery character of the leaf surface. A study of leaf texture and roughness, based on an analysis of SEM photos, demonstrated the influence of changes in the surface condition of oak leaves infected with oak powdery mildew [24].
The adhesion of water droplets to the leaves also differed among species, between the upper and lower leaf sides [16]. As shown in Wang’s study [16], generally more water adheres to the adhesive surface than to the abaxial surface. In the present study, the mean for all angles of inclination to the adaxial surface for all species considered jointly is 107.97° while for the abaxial surface it is 125.05°. Similar relationships between the upper and the lower side of the leaves were found for SFE, with values of 25.42 and 14.89 [mJ/m2], respectively.
The obtained results can be combined with the retention capacities of forests and mixed tree-covered areas. The amounts of water that are retained in tree crowns, and depending, among other things, on the amount of wax and surface roughness, do not reach the forest floor and reduce the amount of water available to the roots. In the face of increasingly lower rainfall and higher temperatures [49], these issues are worth further research. Assessment of water adhesion constitutes an easy and valuable tool that can be used to determine the retention properties of a given plant. The amount of retained water may have a positive effect on the microclimate of urban forests [28] as well as it may reduce the amount of water reaching the roots [47,50].

5. Conclusions

The conducted research is within the scope of basic research, which adds a lot to the knowledge about water retention processes in tree crowns. These issues are extremely important in the context of climate change and the diminishing soil water resources for forests. In Europe, even pine forests become sheltered and susceptible to pests and parasites during long periods without precipitation. The presence of trees protects the soil and increases soil retention, but with low rainfall, tree crowns may block water from reaching the forest floor.
The linear regression model showed that the significant predictors of S are waxes and factors related to the species-typical characteristics of the leaf structure. Each additional μg/cm2 of wax in the leaf increases the water storage capacity. An important observation is the proportional relationship between the water capacity of the leaves and the wettability.
With the increase in wettability, which was described by the drop angle to the leaf, the water capacity also increased.
Research shows that the hydrological properties of leaves of various species resulting from the physical features of those leaves.

Supplementary Materials

The following are available online at https://www.mdpi.com/1999-4907/11/11/1158/s1, Figure S1: Droplets of the liquids measured, Table S1: Measurements of the angle of the droplet to the leaf surface, Table S2: Components necessary to calculate the surface free energy, Table S3: Mutual relations between the studied features.

Author Contributions

Conceptualization, K.-I.A.; methodology, K.-I.A., Ł.S., Z.M., S.-O.E.; validation, K.-I.A., Ł.S., B.W.; formal analysis, K.-I.A.; writing—original draft preparation, K.-I.A., Ł.S., Z.M., S.-O.E., B.W.; writing—review and editing, K.-I.A., S.Ł.; visualization, K.-I.A., Ł.S.; All authors have read and agreed to the published version of the manuscript.

Funding

This research was financed by the Ministry of Science and Higher Education of the Republic of Poland.

Acknowledgments

The authors would like to thank anonymous reviewers for the thorough assessment of this paper and for many valuable and helpful suggestions. We also thank Piotr Sarna for introducing final stylistic and linguistic corrections.

Conflicts of Interest

The authors declare no conflict of interest.

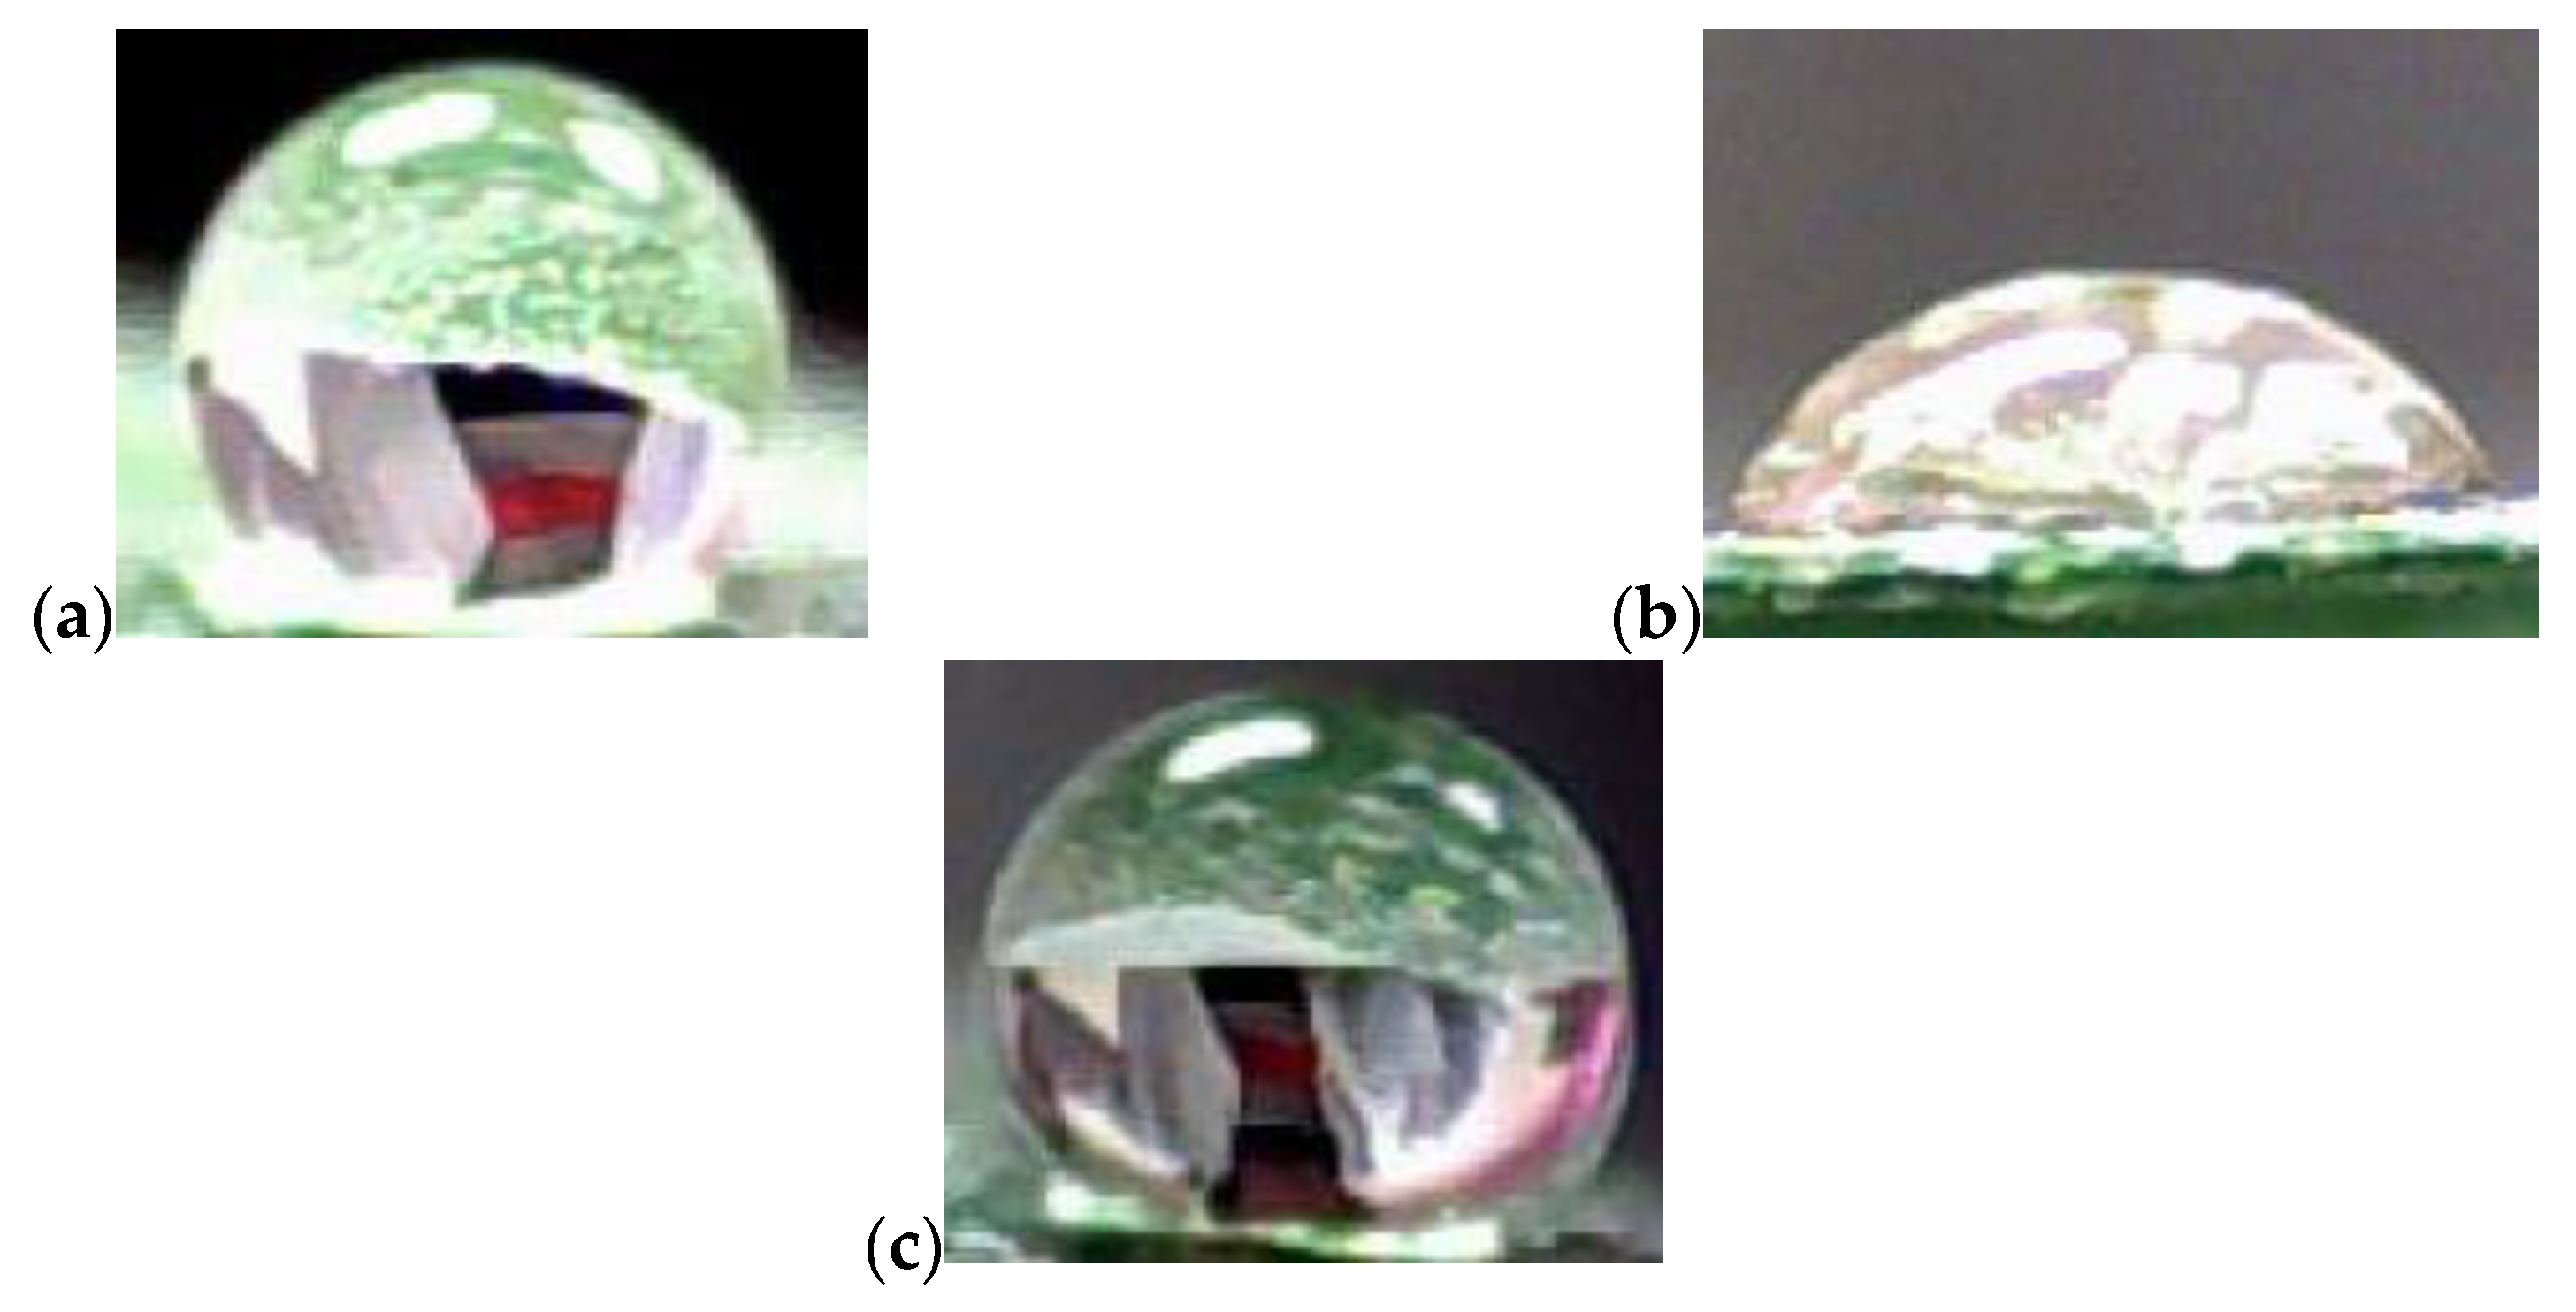
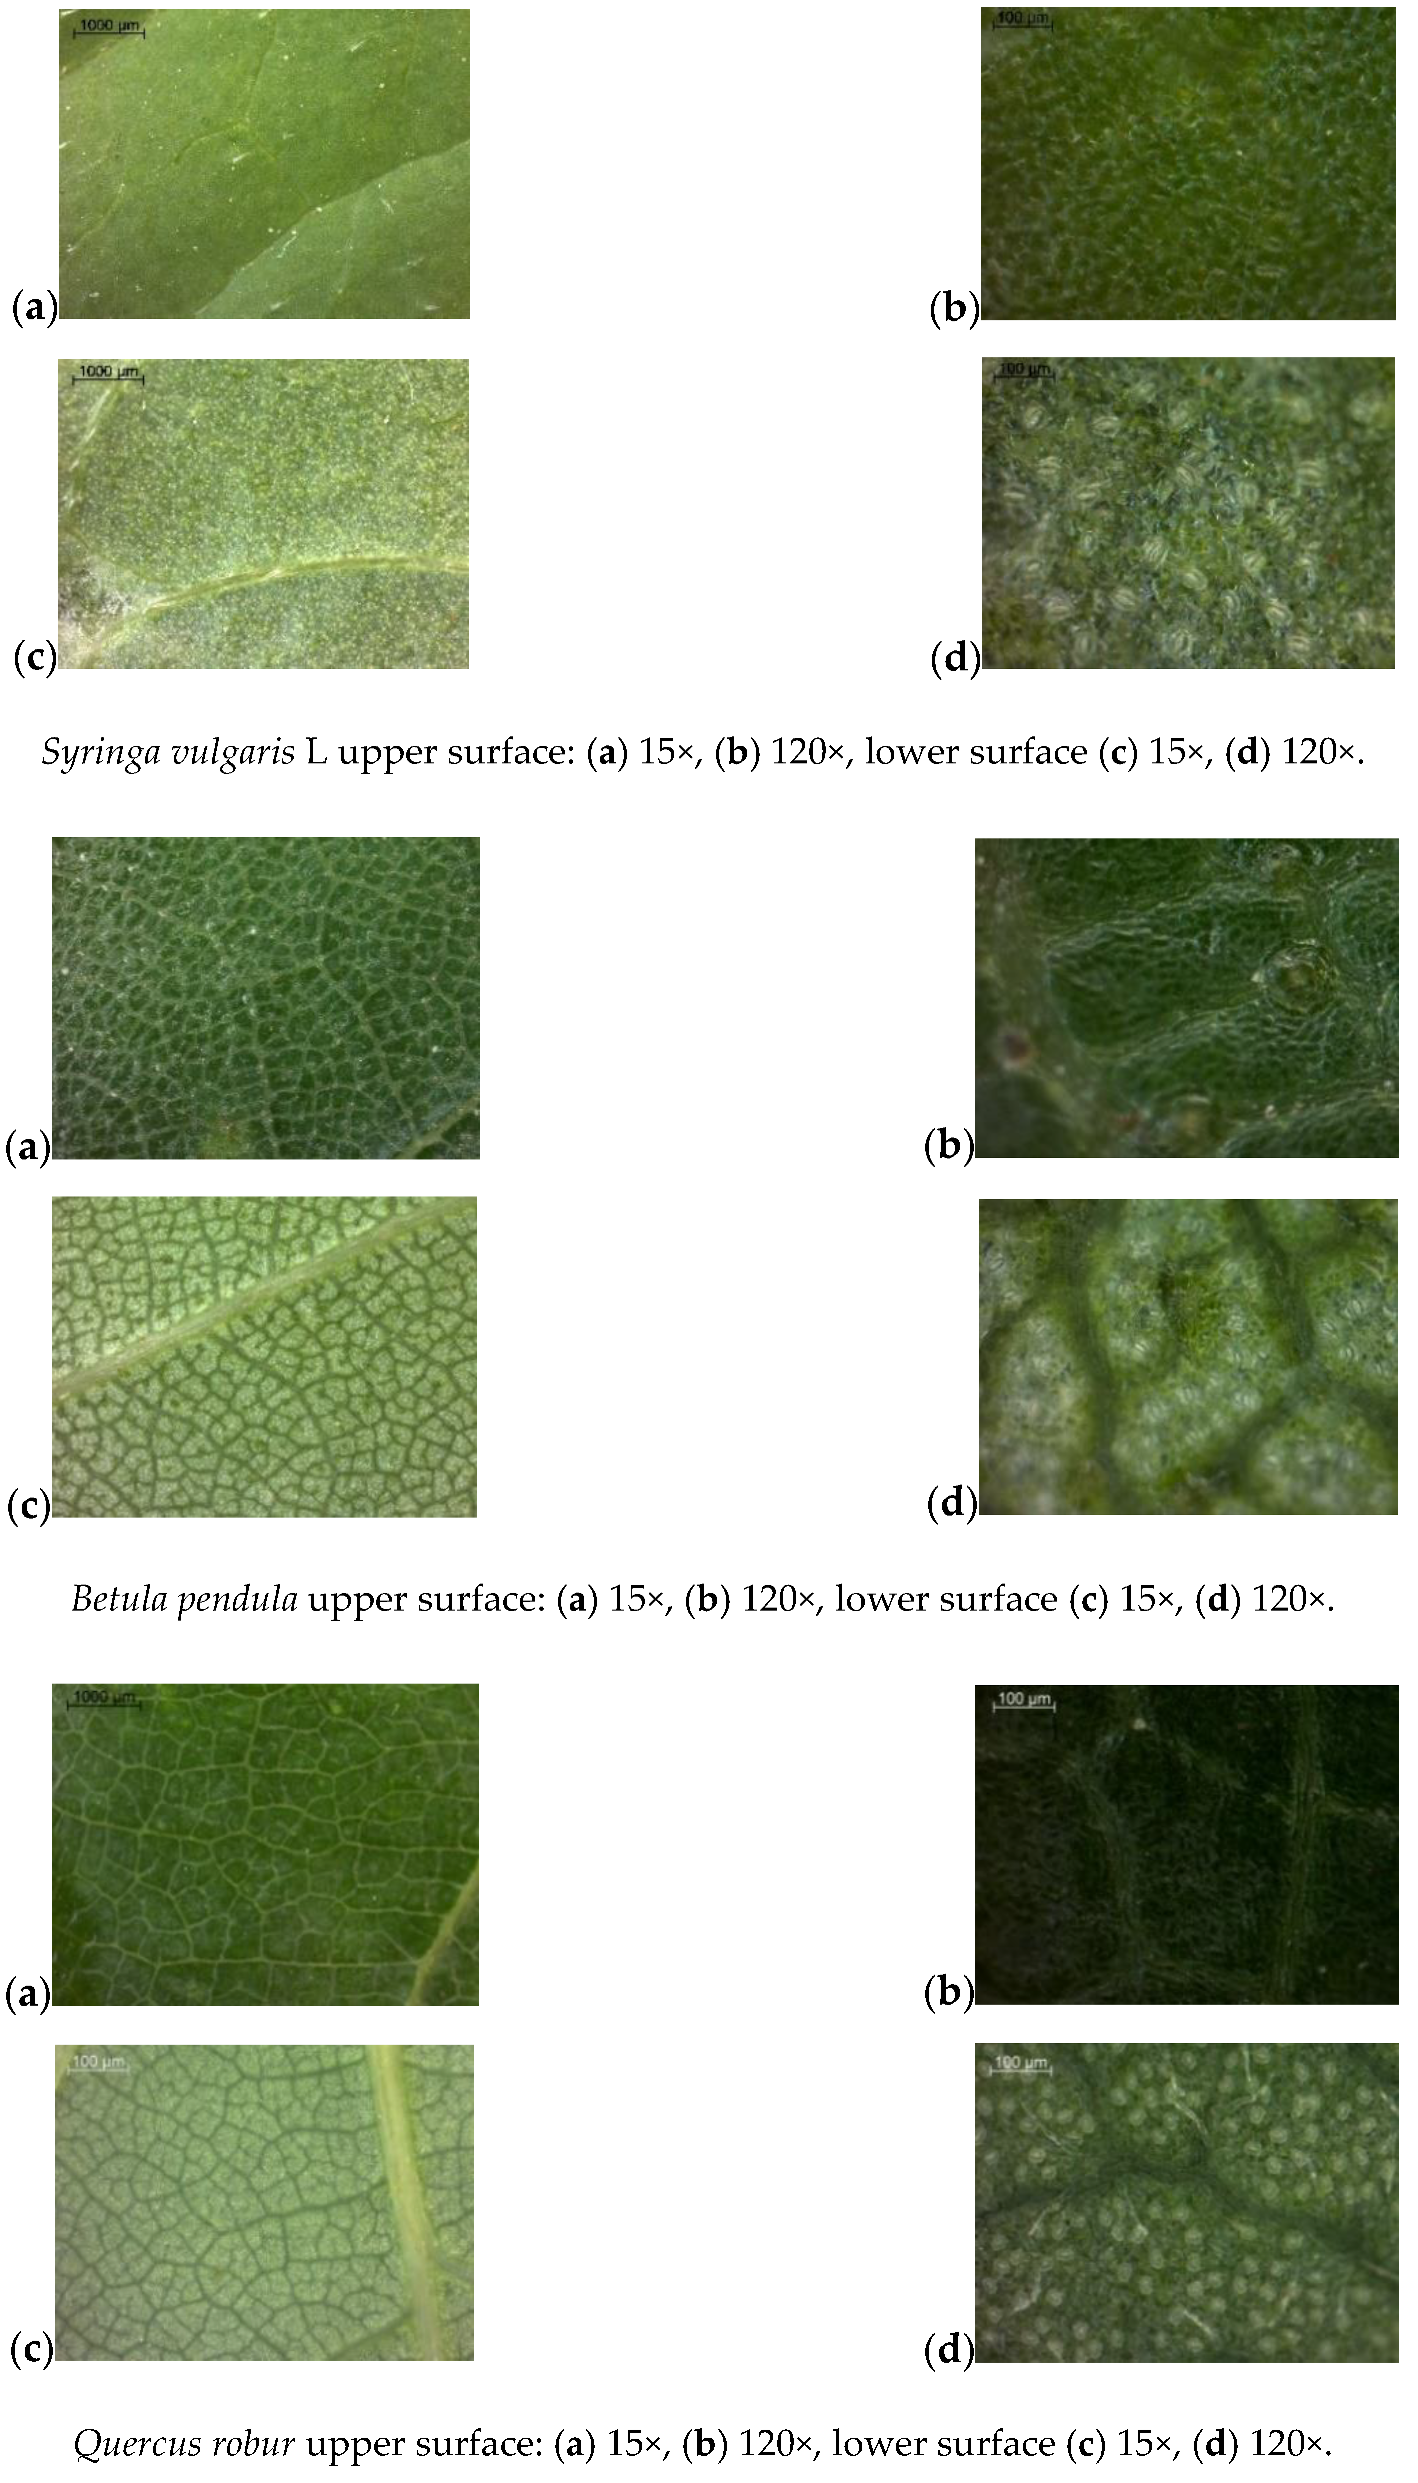
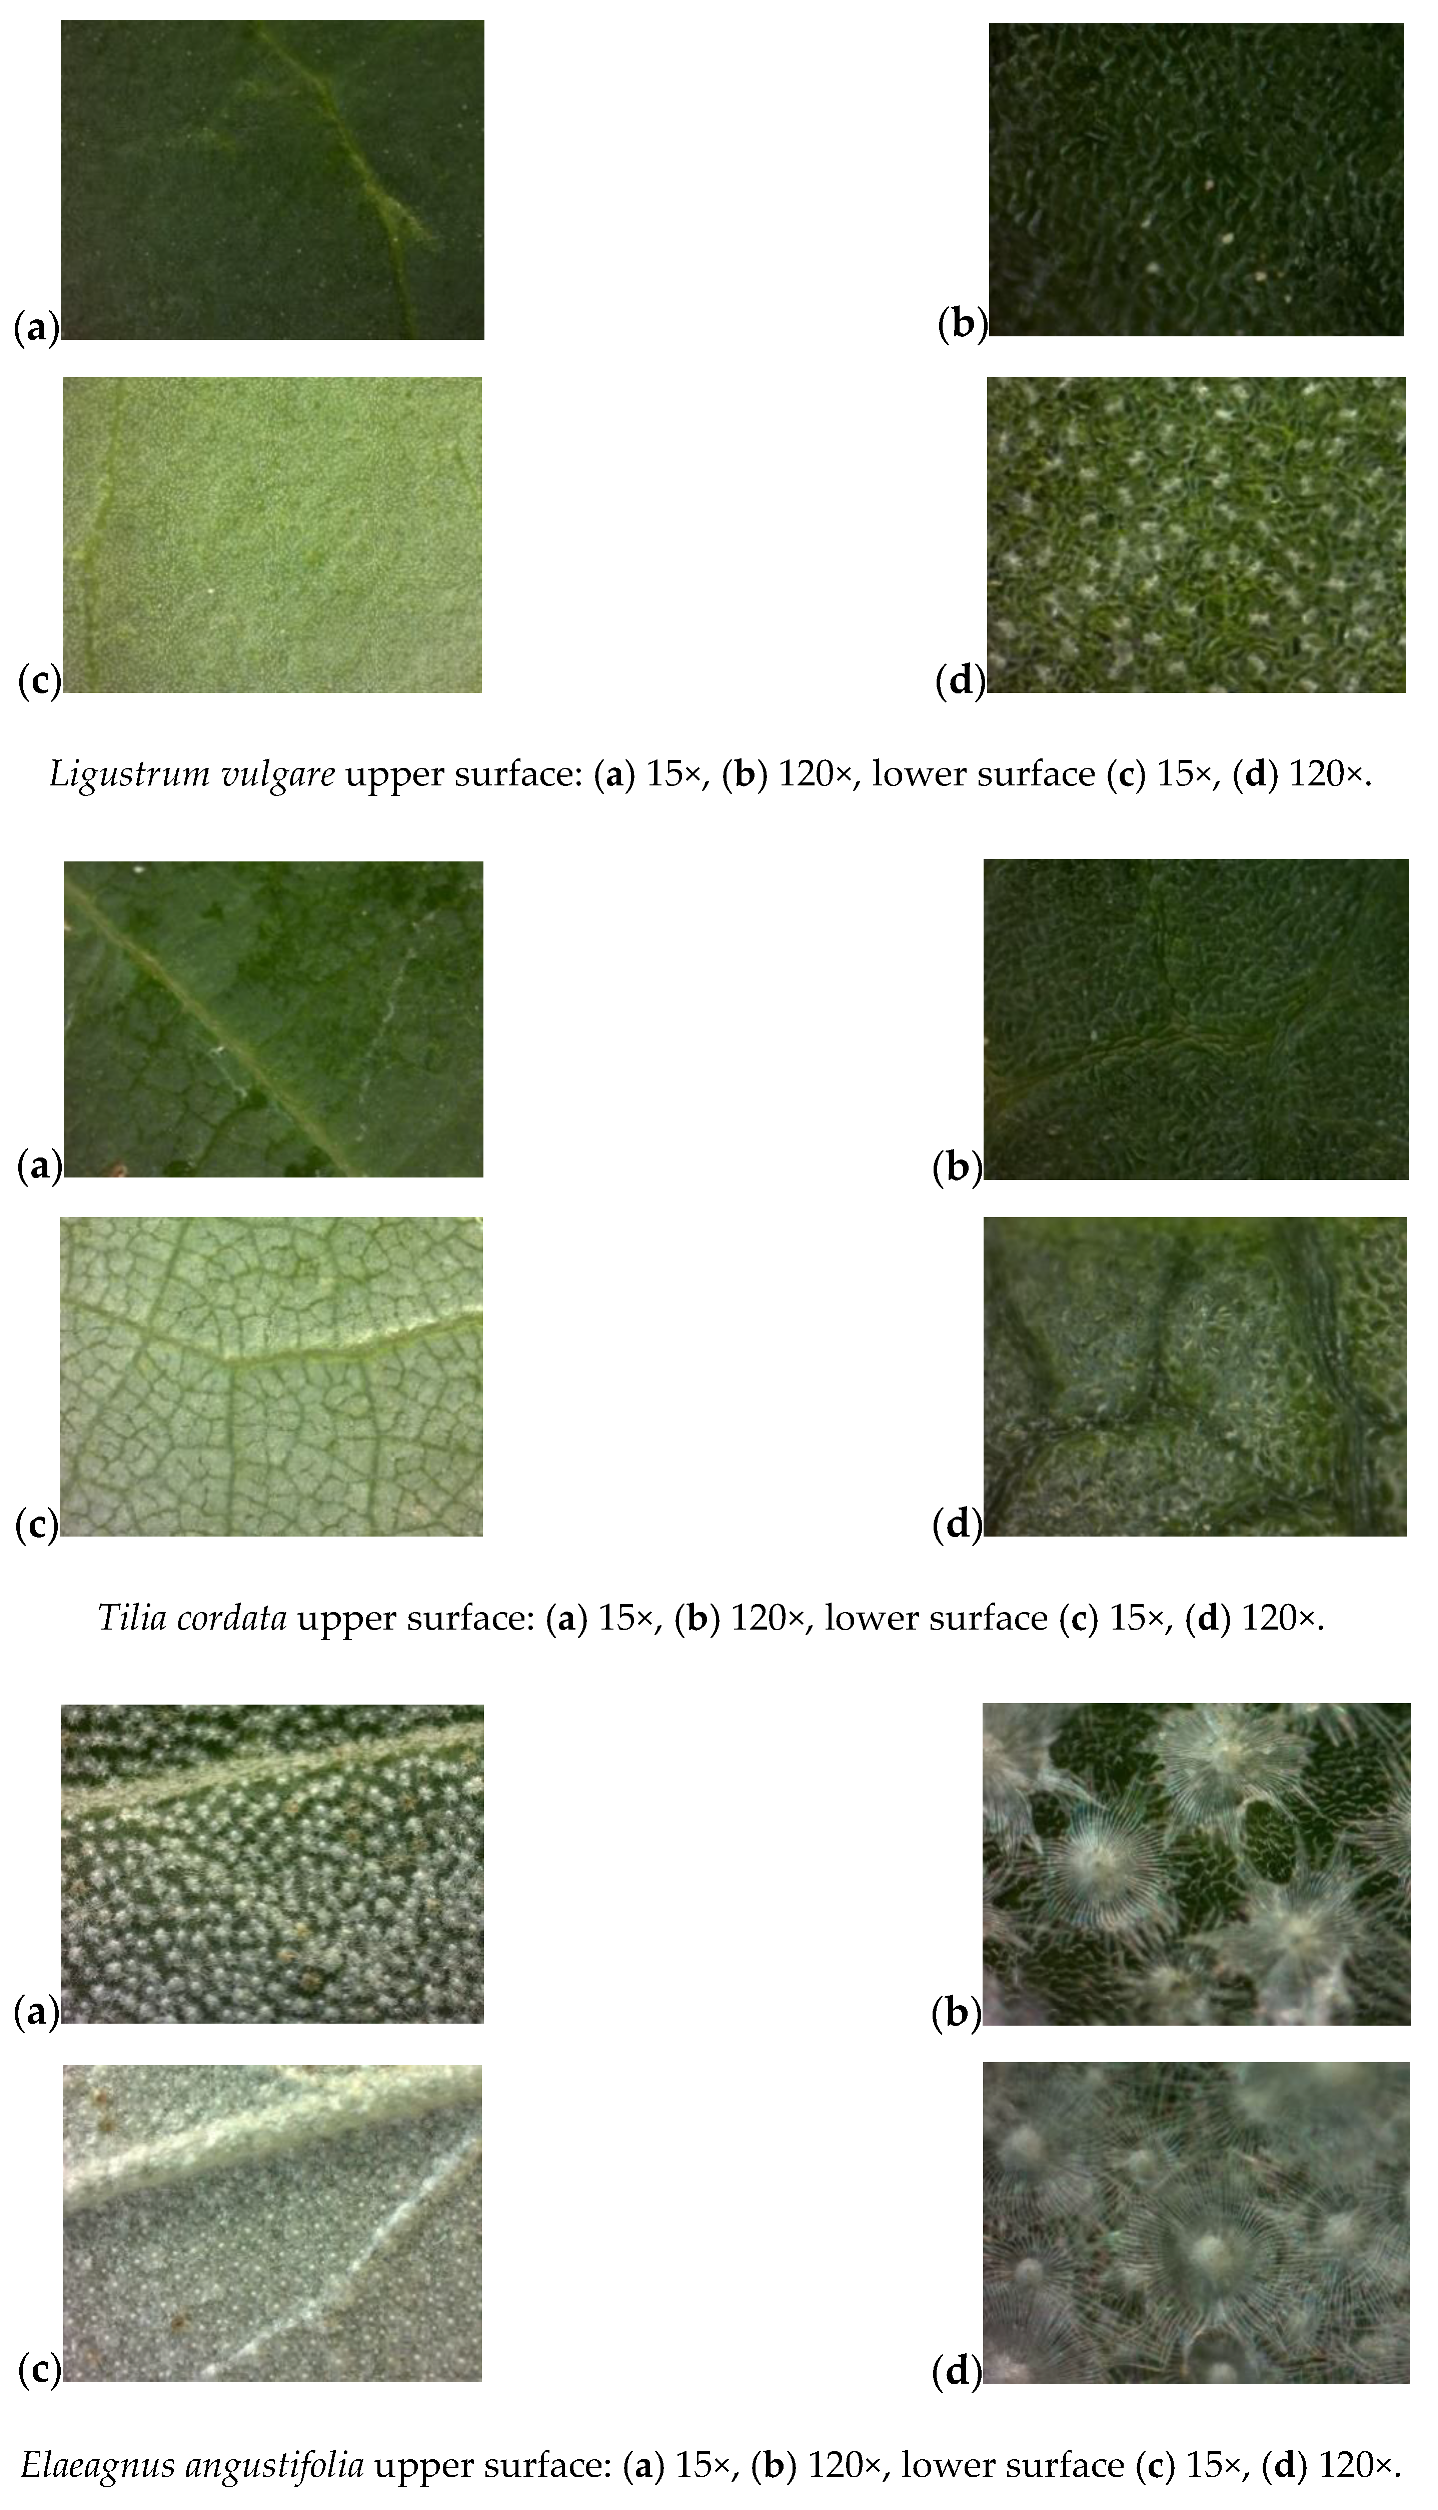
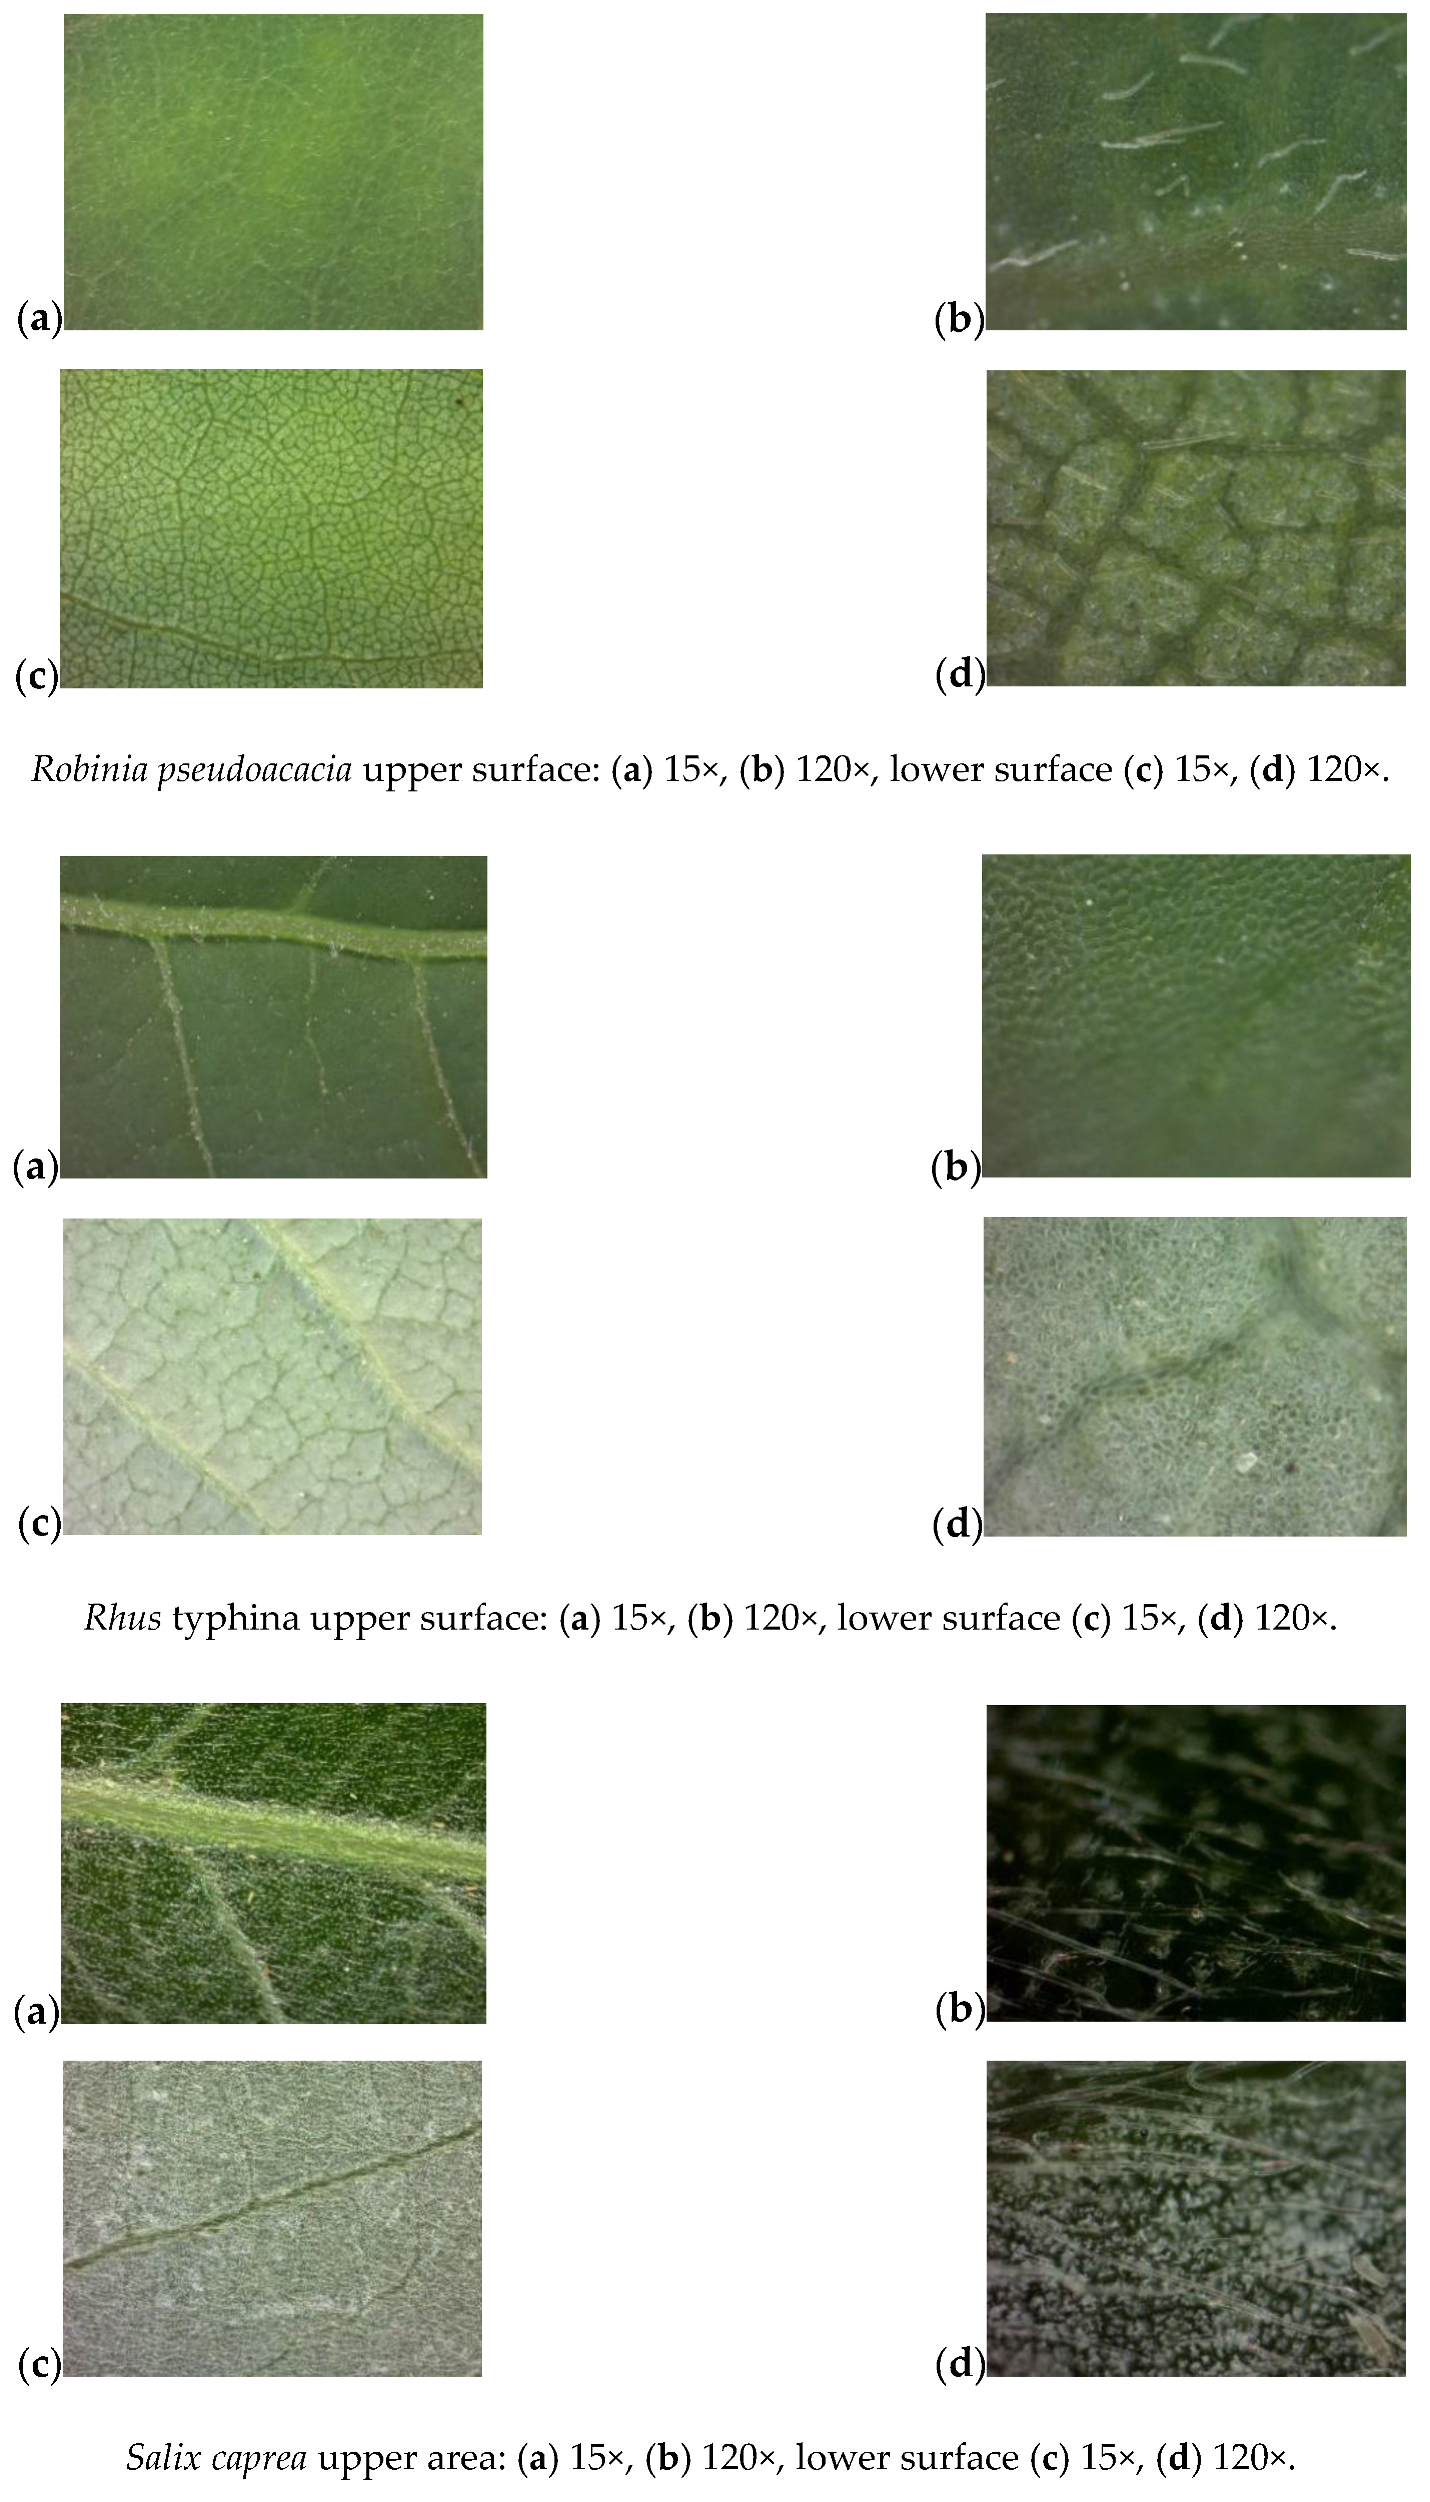
Appendix A: Analysis of Leaf Surface Photographs

In order to fully analyse the relationship between the wax content and the angles of contact of a liquid to the leaf surface, as well as the hydrological properties of the plant material, it is also necessary to compile photos showing the surface type. The texture of the leaves clearly differs between the species analysed (Figure A1).
Figure A1. Photos of the top and bottom surfaces of the leaves.
Forests 11 01158 g0a1aForests 11 01158 g0a1bForests 11 01158 g0a1cForests 11 01158 g0a1d
As presented in Table 1, the influence of the leaf wax content is much weaker than such species characteristics as roughness or the presence of hairs. All of the analyses were performed within one microclimate and at the same time during the growing season, so we can take into consideration the individual characteristics.

References

  1. Dunkerley, D.L. Evaporation of impact water droplets in interception processes: Historical precedence of the hypothesis and a brief literature overview. J. Hydrol. 2009, 376, 599–604. [Google Scholar] [CrossRef]
  2. Friesen, J.; Van Stan, J.T., II. Early European Observations of Precipitation Partitioning by Vegetation: A Synthesis and Evaluation of 19th Century Findings. Geosciences 2019, 9, 423. [Google Scholar] [CrossRef] [Green Version]
  3. Friesen, J.; Lundquist, J.; Van Stan, J.T. Evolution of forest precipitation water storage measurement methods. Hydrol. Process. 2014, 29, 2504–2520. [Google Scholar] [CrossRef]
  4. Papierowska, E.; Mazur, R.; Stańczyk, T.; Beczek, M.; Szewińska, J.; Sochan, A.; Ryżak, M.; Szatyłowicz, J.; Bieganowski, A. Influence of leaf surface wettability on the drop splash phenomenon. Biol. Agric. For. Meteorol. 2019, 279, 107762. [Google Scholar] [CrossRef]
  5. Holder, C.; Lauderbaugh, L.; Ginebra-Solanellas, R.; Webb, R. Changes in leaf inclination angle as an indicator of progression toward leaf surface storage during the rainfall interception process. J. Hydrol. 2020, 125070. [Google Scholar] [CrossRef]
  6. Allen, S.T.; Keim, R.F.; Barnard, H.R.; McDonnell, J.J.; Renée Brooks, J. The role of stable isotopes in understanding rainfall interception processes: A review. Wiley Interdisciplinary Reviews. Water 2017, 4. [Google Scholar] [CrossRef]
  7. Allen, S.T.; Aubrey, D.P.; Bader, M.Y.; Coenders-Gerrits, M.; Friesen, J.; Gutmann, E.D.; Guillemette, F.; Jiménez-Rodríguez, C.; Keim, R.F.; Klamerus-Iwan, A.; et al. Key questions on the evaporation and transport of intercepted precipitation. In Precipitation Partitioning by Vegetation. A Global Synthesis; Van Stan, J.T., II, Gutmann, E., Friesen, J., Eds.; Springer: New York, NY, USA, 2020; pp. 269–280. ISBN 978-3-030-29701-5. [Google Scholar]
  8. Rosado, B.H.P.; Holder, C.D. The significance of leaf water repellency in ecohydrological research: A review. Ecohydrology 2013, 6, 150–161. [Google Scholar] [CrossRef]
  9. Nanko, K.; Hotta, N.; Suzuki, M. Evaluating the influence of canopy species and meteorological factors on throughfall drop size distribution. J. Hydrol. 2006, 329, 422–431. [Google Scholar] [CrossRef]
  10. Holder, C.D. Effects of leaf hydrophobicity and water droplet retention on canopy storage capacity. Ecohydrology 2013, 6, 483–490. [Google Scholar] [CrossRef]
  11. Tomaszewski, D.; Zieliński, J. Epicuticular wax structures on stems and comparison between stems and leaves—A survey. Flora 2014, 209, 215–232. [Google Scholar] [CrossRef]
  12. Gülz, P.; Müller, E. Seasonal variation in the composition of epicuticular waxes of quevcus robur leaves. Z. Nat. C 1992, 47, 800–806. [Google Scholar] [CrossRef]
  13. Fernández, V.; Sancho-Knapik, D.; Guzmán, P.; Peguero-Pina, J.J.; Gil, L.; Karabourniotis, G.; Khayet, M.; Fasseas, C.; Heredia-Guerrero, J.A.; Heredia, A.; et al. Wettability, polarity and water absorption of Quercus ilex leaves: Effect of leaf side and age. Plant Physiol. 2014, 166, 168–180. [Google Scholar] [CrossRef] [PubMed] [Green Version]
  14. Gart, S.; Mates, J.E.; Megaridis, C.M.; Jung, S. Droplet impacting a cantilever: A leaf-raindrop system. Phys. Rev. Appl. 2015, 3, 1–8. [Google Scholar] [CrossRef] [Green Version]
  15. Sikorska, D.; Papierowska, E.; Szatyłowicz, J.; Sikorski, P.; Suprun, K.; Hopkins, R.J. Variation in leaf surface hydrophobicity of wetland plants: The role of plant traits in water retention. Wetlands 2017, 37, 997–1002. [Google Scholar] [CrossRef] [Green Version]
  16. Wang, H.; Shi, H.; Li, Y.; Wang, Y. The effects of leaf roughness, surface free energy and work of adhesion on leafwater drop adhesion. PLoS ONE 2014, 9, e107062. [Google Scholar] [CrossRef]
  17. Weisensee, P.B.; Tian, J.; Miljkovic, N.; King, W.P. Water droplet impact on elastic superhydrophobic surfaces. Sci. Rep. 2016, 6, 30328. [Google Scholar] [CrossRef]
  18. Papierowska, E.; Szporak-Wasilewska, S.; Szewińska, J.; Szatyłowicz, J.; Debaene, G.; Utratna, M. Contact angle measurements and water drop behavior on leaf surface for several deciduous shrub and tree species from a temperate zone. Trees 2018, 32, 1253–1266. [Google Scholar] [CrossRef] [Green Version]
  19. Aryal, B.; Neuner, G. Leaf wettability decreases along an extreme altitudinal gradient. Oecologia 2010, 162, 1–9. [Google Scholar] [CrossRef]
  20. Klamerus-Iwan, A.; Błońska, E. Canopy storage capacity and wettability of leaves and needles: The effect of water temperature changes. J. Hydrol. 2018. [Google Scholar] [CrossRef]
  21. Popek, R.; Gawrońska, H.; Wrochna, M.; Gawroński, S.; Sæbø, A. Particulate matter on foliage of 13 woody species: Deposition on surfaces and phytosta-bilisation in waxes, a 3 year study. Int. J. Phytorem. 2012, 15, 245–256. [Google Scholar] [CrossRef]
  22. Pogorzelski, S.; Rochowski, P.; Szurkowski, J. Pinus sylvestris L. needle surface wettability parameters as indicators of atmospheric environment pollution impacts: Novel contact angle hysteresis methodology. Appl. Surf. Sci. 2014, 292, 857–866. [Google Scholar] [CrossRef]
  23. Stosch, A.K.; Solga, A.; Steiner, U.; Oerke, C.; Barthlott, W.; Cermann, Z. Efficiency of self-cleaning properties in wheat (TriticumaestivumL.). Appl. Bot. Food Qual. 2007, 81, 49–55. Available online: http://pub.jki.bund.de/index.php/JABFQ/article/view/2111 (accessed on 1 August 2020).
  24. Klamerus-Iwan, A.; Witek, W. Variability in the Wettability and Water Storage Capacity of Common Oak Leaves (Quercus robur L.). Water 2018, 10, 695. [Google Scholar] [CrossRef] [Green Version]
  25. Carlyle-Moses, D.E.; Gash, J.H. Rainfall interception loss by forest canopies. In Forest hydrology and biogeochemistry; Ecological Studies; Levia, D.F., Carlyle-Moses, D., Tanaka, T., Eds.; Springer: Dordrecht, The Netherlands, 2011; Volume 216, pp. 407–423. [Google Scholar] [CrossRef]
  26. Porada, P.; Van Stan, J.T., II; Kleidon, A. Significant contribution of non-vascular vegetation to global rainfall interception. Nat. Geosci. 2018, 11, 563–567. [Google Scholar] [CrossRef]
  27. Doerr, G.J.; Kempthorne, D.M.; Mayo, L.C.; Forster, W.A.; Zabkiewicz, J.A.; McCue, S.W.; Belward, J.A.; Turner, I.W.; Hanan, J. Towards a model of spray-canopy interactions: Interception, shatter, bounce and retention of droplets on horizontal leaves. Ecol. Model. 2014, 290, 94–101. [Google Scholar] [CrossRef] [Green Version]
  28. Nowak, D.J.; Coville, R.; Endreny, T.; Abdi, R.; Van Stan, J.T., II. Valuing urban tree impacts on precipitation partitioning. In Precipitation Partitioning by Vegetation: A Global Synthesis; Van Stan, J.T., Gutmann, E., Friesen, J., Eds.; Springer Nature: Berlin, Germany, 2020; pp. 253–268. [Google Scholar]
  29. Xiao, Q.; McPherson, E. Surface water storage capacity of twenty tree species in Davis, California. J. Environ. Qual. 2016, 45, 188–198. [Google Scholar] [CrossRef]
  30. Garcia-Estringana, P.; Alonso-Blázquez, N.; Alegre, J. Water storage capacity, stemflow and water funneling in Mediterranean shrubs. J. Hydrol. 2010, 389, 363–372. [Google Scholar] [CrossRef]
  31. Błońska, E.; Klamerus-Iwan, A.; Łagan, S.; Lasota, J. Changes to the water repellency and storage of different species of deadwood based on decomposition rate in a temperate climate. Ecohydrology 2018, 11, 1–8. [Google Scholar] [CrossRef]
  32. Good, R.J. Surface free energy of solids and liquids: Thermodynamics, molecular forces, and structure. J. Colloid Interface Sci. 1977, 59, 398–419. [Google Scholar] [CrossRef]
  33. Van Oss, C.J.; Good, R.J.; Chaudhury, M.K. The role of van der Waals forces and hydrogen bonds in “hydrophobic interactions” between biopolymers and low energy surfaces. J. Colloid Interface Sci. 1986, 111, 378–390. [Google Scholar] [CrossRef]
  34. Owens, D.K.; Wendt, R.C. Estimation of the surface free energy of polymers. J. Appl. Polym. Sci. 1969, 13, 1741–1747. [Google Scholar] [CrossRef]
  35. Ebercon, A.; Blum, A.; Jordan, W.R. A rapid colorimetric method for epicuticular wax content of sorghum leaves. Crop Sci. 1977, 17, 179–180. [Google Scholar] [CrossRef] [Green Version]
  36. Hinkle, D.E.; Wiersma, W.; Jurs, S.G. Applied Statistics for the Behavioral Sciences, 5th ed.; Houghton Mifflin: Boston, MA, USA, 2003. [Google Scholar]
  37. R Core Team. R: A Language and Environment for Statisticalcomputing; R Foundation for Statistical Computing: Vienna, Austria, 2017; Available online: https://www.R-project.org/ (accessed on 20 July 2020).
  38. Koch, K.; Barthlott, W. Superhydrophobic and superhydrophilic plant surfaces: An inspiration for biomimetic materials. Philos. Trans. R. Soc. A 2009, 367, 1487–1509. [Google Scholar] [CrossRef]
  39. Chang, M. Forest Hydrology: An Introduction to Water and Forests, 2nd ed.; CRC Press: Boca Raton, FL, USA, 2006. [Google Scholar]
  40. Holder, C.D.; Gibbes, C. Influence of leaf and canopy characteristics on rainfall interception and urban hydrology. HSJ 2016, 62, 182–190. [Google Scholar] [CrossRef]
  41. Li, J.; Cui, H.; Ma, Y.; Xun, L.; Li, Z.; Yang, Z.; Lu, H. Orchard spray study: A prediction model of droplet deposition states on leaf surfaces. Agronomy 2020, 10, 747. [Google Scholar] [CrossRef]
  42. Klamerus-Iwan, A.; Gloor, E.; Sadowska-Rociek, A.; Błońska, E.; Lasota, J.; Łagan, S. Linking the contents of hydrophobic PAHs with the canopy water storage capacity of coniferous trees. Environ. Pollut. 2018, 242, 1176–1184. [Google Scholar]
  43. Taylor, P. The wetting of leaf surfaces. Curr Opin Colloid. 2011, 16, 326–334. [Google Scholar] [CrossRef]
  44. Xue, D.; Zhang, X.; Lu, X. Molecular and evolutionary mechanisms of cuticular wax for plant drought tolerance. Front Plant Sci. 2017, 8, 621. [Google Scholar] [CrossRef]
  45. Sæbø, A.; Popek, R.; Nawrot, B.; Hanslin, H.M.; Gawronska, H.; Gawronski, S.W. Plant species differences in particulate matter accumulation on leaf surfaces. Sci. Total Environ. 2012, 427–428, 347–354. [Google Scholar] [CrossRef]
  46. Dzierżanowski, K.; Popek, R.; Gawrońska, H.; Sæbø, A.; Gawroński, S.W. Deposition of particulate matter of different size fractions on leaf surfaces and in waxes of urban forest species. Int. J. Phytoremediation 2011, 13, 1037–1046. [Google Scholar] [CrossRef]
  47. Dunkerley, D.L. A review of the effects of throughfall and stemflow on soil properties and soil erosion. In Precipitation Partitioning by Vegetation: A Global Synthesis; Van Stan, J.T., Gutmann, E., Friesen, J., Eds.; Springer Nature: Berlin, Germany, 2020; pp. 183–213. [Google Scholar]
  48. Klamerus-Iwan, A.; Błońska, E.; Lasota, J.; Waligórski, P.; Kalandyk, A. Seasonal variability of leaf water capacity and wettability under the influence of pollution in different city zones. Atmos. Pollut. Res. 2018. [Google Scholar] [CrossRef]
  49. Matuszko, D.; Węglarczyk, S. Effect of cloudiness on long-term variability in air temperature in Krakow. Int. J. Climatol. 2014, 34, 145–154. [Google Scholar] [CrossRef]
  50. Llorens, P.; Gallart, F. A simplified method for forest water storage capacity measurement. J. Hydrol. 2000, 240, 131–144. [Google Scholar] [CrossRef]
Figure 1. Examples of droplets of the liquids measured, obtained for Elaeagnus angustifolia, for the upper leaf surface; (a) water, (b) diiodomethane, (c) glycerine.
Forests 11 01158 g001
Figure 2. A diagram of the measured values within the droplet.
Forests 11 01158 g002
Figure 3. Medians, quartiles and value ranges of individual variables.Wax—the leaf wax content; S—canopy water storage capacity; SFP_ad—surface free energy of the upper leaf surface; SFP_ab—surface free energy of the lower leaf surface; Angle_ad—angle of contact with the upper leaf surface (adaxial side); Angle_ab—droplet angle of contact with the lower leaf surface (abaxial side);.
Forests 11 01158 g003aForests 11 01158 g003b
Figure 4. Correlation coefficients between the analysed variables, the so-called heat map.Wax—the leaf wax content; S—canopy water storage capacity; SFP_ad—surface free energy of the upper leaf surface; SFP_ab—surface free energy of the lower leaf surface; Angle_ad—angle of contact with the upper leaf surface (adaxial side); Angle_ab—droplet angle of contact with the lower leaf surface (abaxial side).
Forests 11 01158 g004
Table 1. Components of the surface free energy of the measuring liquids used in the study.
Measuring Liquid γ L γ L d γ L p γ L + γ L
[mJ/m2]
Water72.821.851.025.525.5
Glycerin64.034.030.03.957.4
Diiodomethane50.850.8000
γ L —surface free energy of the measuring liquid, γ L d —dispersion component of the surface free energy of the measuring liquid, γ L p —polar component of the surface free energy of the measuring liquid, γ S + ,   γ S —acid and basic ingredients.
Table 2. The influence of the analysed factors on canopy water storage capacity.
VariableStandardized Parameter (Beta)Regression Parameter (B)95% CIp
(absolute term) 9.304−0.49419.1010.062
Wax [μg/cm2]0.2360.0670.020.1140.006
SFP_ad−0.131−0.074−0.1720.0250.141
SFP_ab−0.175−0.101−0.230.0280.125
Angle_ad0.0010−0.0420.0420.987
Angle_ab0.0460.019−0.030.0680.45
speciesAcer platan.reference
Aesculus hipp.−0.266−4.391−7.34−1.4420.004
Betula pendula−0.297−4.905−8.188−1.6220.004
Elaeagnus ang.−0.017−0.287−1.5640.990.656
Fraxinus ex.−0.211−3.848−7.044−0.6510.019
Ligustrum vul.−0.13−2.246−5.3060.8140.148
Quercus robur−0.608−11.104−12.866−9.342<0.001
Rhus typhina−0.73−12.04−13.184−10.895<0.001
Robinia ps.−0.845−13.941−16.656−11.227<0.001
Salix caprea−0.168−2.769−5.6980.160.064
Syringa vul.−0.402−7.336−10.719−3.953<0.001
Tilia cordata0.1312.1640.8033.5250.002
Wax—leaf wax content; S—canopy water storage capacity; SFP_ad—surface free energy of the upper leaf surface; SFP_ab—surface free energy of the lower leaf surface; Angle_ad—angle of contact with the upper leaf surface (adaxial side); Angle_ab—angle of droplet contact with the lower leaf surface (abaxial side); A—Acer platan.; B—Aesculus hipp.; C—Betula pendula.; D—Elaeagnus ang.; E—Fraxinus ex.; F—Ligustrum vul.; G—Quercus robur; H—Rhus typhina; I—Robinia ps.; J—Salix caprea; K—Syringa vul.; L—Tilia cordata; 95% CI—95% Confidence Interval.
Table 3. The Kruskal-Wallis test and post-hoc analysis (Dunn’s test) to determine the interrelationships between the analysed factors.
ParameterTypeNMeanSDMedianminmaxQ1Q3p *
Wax [µg/cm2]A1012.332.2312.377.0915.3911.7513.46<0.001
B109.140.739.437.8710.148.89.53C > A, B, D, H, I, K, L
C1071.769.0668.3361.9386.6764.4879.21J > A, B, D, I, K, L
D1018.62.6618.4313.8122.5817.720.38E, F, G > A, B
E827.321.7626.725.8430.126.2927.67H > B
F930.465.6230.3822.3839.6825.8434.98
G826.251.3926.3524.3128.5425.1627.02
H1023.484.3623.8516.0328.820.1627.3
I1021.132.8821.9216.924.7318.523.39
J1035.815.8134.1227.9845.8531.6440.65
K818.863.9717.9413.8826.6916.5420.2
L1019.475.7620.689.0126.118.7723.11
S [g/g]A10190.7119.3417.8420.0218.4719.4<0.001
B1012.140.8112.0710.8913.6211.612.39L > B, E, G, H, I, K
C1016.920.9516.9414.818.1216.6817.57A, D > B, G, H, I, K
D1018.481.0118.6216.3419.9218.1118.91C > G, H, I
E813.590.3913.6612.914.0313.4713.88F, J > H, I
F915.790.9215.8714.3817.3415.0916.32
G88.072.519.073.6710.296.929.94
H107.810.627.936.978.857.278.24
I107.430.687.586.088.347.217.87
J1016.11.1816.3713.8917.7715.9216.78
K810.10.9410.238.9711.789.310.58
L1021.021.4721.1918.2323.4820.1921.38
SEP_adA1026.952.2827.0423.6229.2725.1329.23<0.001
B1026.051.8826.2223.1228.8124.7727J > B, C, F, G, H, I, K
C1025.371.2325.6823.4327.0324.3826.32L > G, H, I, K
D1028.13.6626.9124.2435.5625.530.33A, C, D > I, K
E828.562.2128.9824.2831.2327.4130.1B > I
F925.030.8725.3522.8825.8624.9225.44
G823.611.9423.8319.7425.8322.7524.95
H1024.092.4724.1319.7327.5622.8225.84
I105.310.735.393.96.254.855.81
J1041.082.5840.8136.9945.5939.7142.78
K818.791.5518.216.8321.3717.7819.97
L1030.952.7630.8426.6736.2628.8932.54
SEP_abA107.41.427.645.59.496.218.43<0.001
B1026.142.6826.0122.4529.8723.928.29B, E, K > A, H, I, J, L
C1016.841.4617.314.2718.7415.7117.76F > A, H, I, L
D1010.741.1410.969.0912.739.7611.18C > A, H, I
E826.461.5426.2124.2228.7325.7427.02G > I
F925.081.9425.0722.5727.8724.1126.17
G813.632.6112.6210.817.4511.6816.19
H107.531.667.265.3810.636.548.53
I104.721.064.623.457.13.984.92
J1010.450.6410.439.1111.4910.2410.68
K826.060.7526.0525.127.4825.7426.33
L108.931.728.597.0212.787.899.12
Angle_adA10107.214.7106.5599.52116.4104.41109.63<0.001
B10113.115.96114.22101.16122.8110.9115.67I > A, C, D, E, F, J, L
C10105.562.26105.66101.35109.16105.01106.73B, G, H, K > J, L
D10111.79.45106.65101.16126.66105.8119.31D > J
E8107.621.62107.38105.61110.2106.51108.88
F9107.033.72106.79103.15112.72103.4110.31
G8112.924.41113.47107.51119.48108.67115.65
H10113.656.15113.87105.9120.03108.21119.57
I10135.142.25135.5130.28137.44134.62136.88
J1074.473.9574.8667.4479.1873.3677.66
K8114.058.05117.0998.82121108.41120.71
L1095.222.4295.7690.5998.4694.3296.9
Angle_abA10141.533.25141.5137.14146.57138.71143.9<0.001
B10118.356.01118.04110.89131.86115.32118.53A > B, C, E, F, G, J, K
C10124.074.72123.25117.73131.01120.64127.96H, I > B, E, F, K
D10129.064.81128.73119.85135.94126.69131.63L > E, F, K
E8113.611.67113.26111.88116.53112.2114.71D > F, K
F9112.623.51114.04106.94117.38110.12114.76
G8121.426.22122.89110.8127.66120125.42
H10136.223.51136.76132.1141.29132.65138.27
I10136.373.8135.97131.57141.07133.81139.55
J10123.052.86123.05118.61128.62122.28124.18
K8103.12.61102.2299.59106.23101.48105.99
L10132.566.33135.19121.25139.76130.37136.7
Wax—leaf wax content; S—canopy water storage capacity; SFP_ad—surface free energy of the upper leaf surface; SFP_ab—surface free energy of the lower leaf surface; Angle_ad—angle of contact with the upper leaf surface (adaxial side); Angle_ab—angle of droplet contact with the lower leaf surface (abaxial side); A—Acer platan; B—Aesculus hipp; C—Betula pendula; D—Elaeagnus ang; E—Fraxinus ex; F—Ligustrum vul; G—Quercus robur; H—Rhus typhina; I—Robinia ps; J—Salix caprea; K—Syringa vul; L—Tilia cordata; SD—Standard deviation; Q1, Q3—quartiles Q1, Q3; *—p < 0.05.
Publisher’s Note: MDPI stays neutral with regard to jurisdictional claims in published maps and institutional affiliations.

