Article

Temperature Reduction in Urban Surface Materials through Tree Shading Depends on Surface Type Not Tree Species

1
Urban Studies, School of Social Sciences, Western Sydney University, Locked Bag 1797, Penrith, NSW 2751, Australia
2
Hawkesbury Institute for the Environment, Western Sydney University, Locked Bag 1797, Penrith, NSW 2751, Australia
*
Author to whom correspondence should be addressed.
Forests 2020, 11(11), 1141; https://doi.org/10.3390/f11111141
Submission received: 30 September 2020 / Revised: 25 October 2020 / Accepted: 25 October 2020 / Published: 28 October 2020

Abstract

:
Trees play a vital role in urban cooling. The present study tested if key canopy characteristics related to tree shade could be used to predict the cooling potential across a range of urban surface materials. During the austral summer of 2018–2019, tree and canopy characteristics of 471 free-standing trees from 13 species were recorded across Greater Sydney, Australia. Stem girth and tree height, as well as leaf area index and ground-projected crown area was measured for every tree. Surface temperatures were recorded between noon (daylight saving time) and 3:00 p.m. under the canopy of each tree in the shade and in full sun to calculate the temperature differential between adjacent sunlit and shaded surfaces (∆Ts). The limited control over environmental parameters was addressed by using a large number of randomly selected trees and measurement points of surface temperatures. Analyses revealed that no systematic relationship existed among canopy characteristics and ∆Ts for any surface material. However, highly significant differences (p < 0.001) in ∆Ts existed among surface materials. The largest cooling potential of tree shade was found by shading bark mulch (∆Ts = −24.8 °C ± 7.1), followed by bare soil (∆Ts = −22.1 °C ± 5.5), bitumen (∆Ts = −20.9 °C ± 5.8), grass (∆Ts = −18.5 °C ± 4.8) and concrete pavers (∆Ts = −17.5 °C ± 6.0). The results indicate that surface material, but not the tree species, matters for shade cooling of common urban surfaces. Shading bark mulch, bare soil or bitumen will provide the largest reductions in surface temperature, which in turn results in effective mitigation of radiant heat. This refined understanding of the capacity of trees to reduce thermal loads in urban space can increase the effectiveness of urban cooling strategies.

1. Introduction

The Urban Heat Island Effect (UHIE) is one of the most prominent impacts of urbanisation and is accelerated by climate change [1,2]. The UHIE can be defined as the discernible temperature difference between urban and adjacent rural areas caused by emission of excess heat and the solar energy trapped by infrastructure [3]. Mitigation of urban heat has become a pressing issue as more than half of the world’s population is currently living in cities [4], where they are exposed to increased levels of heat that, during heat wave conditions, adversely impact public health and accelerate rates of mortality [4]. People that live in urban areas highly depend on air-conditioned buildings, artificial lighting and (air conditioned) transport. The additional waste heat generated by this lifestyle further contributes to the UHIE [3,5,6]. Increased night-time temperatures in urban settings are mainly caused by buildings and paved areas with low albedo and high heat storage capacity [7]. Buildings and paved areas are made from concrete, asphalt, bricks and tiles, which absorb short-wave solar radiation during daytime and re-radiate long-wave radiation in the night, thereby increasing air temperatures at night.
Retaining existing trees and planting additional trees is one of the most effective strategies to mitigate UHIE. Urban trees provide surface cooling through shading and additional cooling benefits can be generated by latent heat removal through evapotranspiration [8]. Shade from tree canopies reduces the amount of sunlight absorbed by infrastructure, such as buildings and pavement, and thus decreases the amount of energy that is re-radiated into the surrounding environment. The cooling effect of tree canopies on single domestic dwellings has been known for decades [9]. A recent study revealed that the cooling effect provided by shading from trees is more significant than that by evapotranspiration [10]. It was estimated that urban trees in the United States reduce the national residential energy consumption by 7.2% per year and provide a reduction of 38.8 million MWh of electricity (worth USD 4.7 billion) [11]. The presence of trees is also linked with higher property values [12,13,14]. As a direct effect on the human body, tree shade alters the perceived temperature which depends more on radiation and less on convection of heat from the local environment [15]. Hence, reducing radiant heat loads through shade from tree canopies improves human thermal comfort and can have a positive effect on public health [16,17].
Shade provided by a tree has a quantitative and a qualitative dimension. The quantity of shade is dependent on the size of the tree crown and can be approximated by projecting the crown perimeter onto the ground surface. The quality of tree shade depends on the density of the canopy. The Leaf Area Index (LAI) can be used to determine the canopy density [18]. LAI is defined as the total projected area of leaves of a single tree or group of trees over a unit of land (m2 m−2) and is known to have a direct influence on microclimate below the canopy [19,20]. A low LAI indicates a more open canopy arrangement that provides a lower quality of shade, whereas a high LAI indicates a dense canopy which provides very high quality of shade. The canopy characteristics vary among tree species, age and location, and thus could influence air and surface temperature below the canopy [21]. However, the shading efficiency of tree canopies is likely the result of a combination of the density and size of tree crowns. Surface temperature under a tree with a wide but open crown may be higher compared to that under a tree with a narrower but dense crown.
Although there are numerous studies on the effect of tree canopy cover on air temperature in urban settings [22,23], far fewer studies have assessed the influence of tree canopies or species differences in shading efficiency on surface temperatures at a microscale. Moreover, studies that do assess the relationship between surface temperature and urban tree canopy cover regularly use remotely sensed infrared data [24,25,26], which cannot be used to assess the impact of shading on temperature of surface materials under tree canopies. However, it is this type of information that urban planners, landscape architects and land managers often seek when selecting tree species to improve microclimates and reduce radiant heat loads.
Further, the albedo of a surface material plays a significant role in UHIE. The albedo can be defined as the fraction of shortwave radiative energy reflected from a surface [27]. Light-coloured surfaces with high albedo generally absorb less solar radiation than dark-coloured ones with low albedo [28]. Consequently, decreases in albedo increase the radiative energy absorption by the urban land surface, lead to increased air and surface temperatures and contribute to the UHIE [28,29]. Typical albedo values range from 0.10 to 0.50, with higher values usually associated with metallic surfaces [28].
Here, we present surface temperature measurements of common urban surface types under tree shade and adjacent sunlit areas and investigate species-specific relationships between tree size, using the stem diameter at breast height (DBH), LAI and the vertical projection of the crown area (AC). A range of common urban tree species planted throughout Greater Sydney were tested for this purpose, and we hypothesised (1) that species with higher LAI and larger AC are most effective in reducing surface temperature, (2) that the surface temperature underneath tree canopies also depends on the surface material and (3) that darker surface materials with low albedo would exhibit higher surface temperatures compared to surface materials with high albedo. We were interested in identifying species-specific and also surface-specific trends and thus did not control tree age, canopy size or any environmental parameter, except time of day and that no meaningful rainfall had occurred in the days preceding our data collections. We countered the limited control by assessing a large number of trees and randomizing data collection points for surface temperatures.

2. Materials and Methods

2.1. Study Area

Greater Sydney in the state of New South Wales (NSW), Australia, was selected as the study area for this project. The area has a temperate climate with dry and hot summers. A natural rainfall gradient exists along an east (coastal)/west (inland) gradient where mean annual precipitation declines from 1300 to 880 mm [30]. Mean annual air temperature of the area is around 18 °C. Greater Sydney, especially the western part, experiences extreme heatwave conditions annually with a peak temperature of 48.9 °C in January 2020 [31]. Moreover, Parramatta, a city in the geographic centre of Greater Sydney, has been identified to have the highest UHIE in NSW [32]. On average, Parramatta experiences 13 days each year with air temperatures of 35 °C and above [33]. The frequency of hot and extreme heat days is increasing in Parramatta and Western Sydney more broadly [34]. Additionally, urban development has transformed rural land in the west of Greater Sydney to residential suburbs [35]. The estimated population of this part of Greater Sydney in 2018 is 2.2 million which is 10% higher compared to 2011 [36]. It is expected that the population of Western Sydney will reach 2.9 million by 2036, representing more than 50% of the total population of Grater Sydney. Due to continued urbanisation in the region, canopy cover in the western part of Greater Sydney decreased by 0.83% from 2009 to 2016, a rate more than twice as high as what was observed across the State of NSW [33].

2.2. Tree Morphological Measurements

For the present work, 471 healthy and well-established individual trees belonging to 13 different species were sampled from November 2018 to March 2019 across Greater Sydney. Sampled trees included (•)native, (◦)exotic, (▪)evergreen and (▫)deciduous species that are widely planted in parks and streets across Greater Sydney, namely: •,▪Australian pine (Casuarina equisetifolia L.), ◦,▫camphor tree (Cinnamomum camphora L.), ◦,▪Chinese banyan (Ficus macrocarpa L.f.), ◦,▫crepe myrtle (Lagerstroemia L.), ◦,▫flowering pear (Pyrus calleryana Decne.), ◦,▫jacaranda (Jacaranda mimosifolia D.Don.), •,▪lemon-scented gum (Corymbia citriodora Hook.), •,▪lilly pilly (Waterhousea floribunda (F.Muell.) B.Hyland), •,▪paperbark (Melaleuca quinquenervia (Cav.) S.T.Blake), ◦,▫planetree (Platanus acerifolia (Aiton.) Willd.), •,▪Queensland box (Lophostemon confertus (R.Br.) Peter G.Wilson & J.T.Waterh.), ◦,▫sweetgum (Liquidambar styraciflua L.) and •,▪Sydney blue gum (Eucalyptus saligna Sm.). Physical characteristics of the studied trees are shown in Table 1. Figure 1 shows examples of common tree species and surface types that were examined in the study.
Stem diameter at breast height (DBH) was measured for each individual tree using a diameter tape. Here we used DBH as rough indicator of tree age. A clinometer (Suunto Tandem 360PC/360RDG, Suunto, Vantaa, Finland) was used to measure tree and crown height. Crown radii (r) in six sub cardinal directions were measured using an optical laser (DISTO D810, Leica Geosystems, St Gallen, Switzerland). For this purpose, a perpendicular was dropped at the edge of the canopy from where the laser was pointed to the centre of the stem at parallel height to the ground surface. Half of the DBH (i.e., the stem radius) was added to each measurement to represent the distance from the crown edge to the centre of the stem. To estimate AC, we used the following modified equation [37]:
A C = i = 1 6 r i × r i + 1 × sin ( 60 ° ) 2
where ri and ri+1 are adjacent radii. LAI was measured using a digital canopy analyser (CI-110 Plant Canopy Imager, CID Bio Science Inc., Camas, WA, USA). Two independent measurements were taken at randomly selected positions under each tree canopy. All images were collected under appropriate light conditions. During post-processing of the images, the Otsu method was applied for image thresholding and gap fraction analysis. This method was selected, because of its robustness in image segmentation, using a least-square method based on a grey-scale histogram [38]. Zenith and azimuth divisions of canopy images were selected manually for each image to ensure an accurate calculation of LAI.

2.3. Surface and Globe Temperature Measurements

Surface and black globe temperatures were recorded between 12:00 and 15:00 h (local daylight-saving time) under each tree canopy and in full sun adjacent to each tree. Black globe temperature is an indirect measurement of human thermal comfort obtained with a thermometer installed inside a hollow copper sphere painted in matte black [39]. It is a composite measurement that incorporates air temperature, relative humidity, direct sunlight, wind speed and radiant heat.
A tripod-mounted weather station (Kestrel 5400, Kestrel Meters, Boothwyn, PA, USA) was used to record black globe temperature at 30-s intervals. The weather station was positioned 1 m above the ground. The air temperature sensor of the weather station was shielded from direct solar radiation and was well aspirated. The weather station was first positioned under the tree for 15 min before moving it into the sun adjacent to the tree for another 15 min. Data for the last 3 min of each measurement interval were averaged, to ensure only data after the weather station had adjusted to ambient conditions were used. The resulting six measurements were averages. These measurements were not independent, thus one average temperature per time interval was used to calculate means among surface types. We note that black globe temperatures were only recorded for each location and light condition, not for specific surface types at individual locations. The reason for this approach was the limited ability to exclude microclimatic ‘noise’ from adjacent surface types, especially in the sun.
An infrared (IR) camera (FLIR C3, FLIR Systems Inc., Wilsonville, OR, USA) was used to record surface temperature at five random locations under the canopy and in full sun adjacent to each tree. The camera has a fixed focus, field of view is 41 × 31°, image size is 640 × 480 pixel and thermal sensitivity is 0.1 °C. The IR camera was held 1 m above the surface when taking the image perpendicular to the ground. The area covered by the image was approximately 56 × 77 cm (4312 cm2). The temperatures of different surface types (grass, bark mulch, bare soil, concrete pavers and bitumen) were assessed in both light conditions. Care was taken that no shade was introduced to the area imaged in sunlight or under tree canopies on readily shaded surfaces. We noticed that two or more different types of surface could be found underneath tree canopies, and consequently, the number of surface temperature assessments exceeded the number of trees in our study. We measured surface temperatures on 414 locations covered by grass, 135 covered by bitumen, 69 covered by bark mulch, 62 covered by pavers and 28 had bare soil.
FLIR Tools+ software was used to extract five random point measurements from each image for a single, uniform surface type to calculate a representative surface temperature for each image. Similar to Black Globe Measurements, these measurements were also not independent, and consequently, one average temperature per image was used to calculate means among surface types. Measurements of air temperature were used to normalize surface and black globe temperatures. Surface and black globe temperatures differentials (ΔTS and ΔTG) were calculated by subtracting temperatures measured in the shade from those measured in the sun. To represent the effect of shading as ‘cooling effect’, all delta values are presented with a negative prefix.
To document the warm summer conditions during which the black globe and surface temperatures were collected, we provide information about mean, minimum and maximum ambient air temperatures measured in the sunlight (TASL) and in the shade of trees (TAS) and their differential (ΔTA) as Supplementary Materials. Table S1 provides these temperatures according to tree species while Table S2 provides this information according to the five surface types we investigated (i.e., bare soil, bark mulch, bitumen, grass, and concrete pavers).

2.4. Data Analysis

All statistical tests were done using JMP software (JMP 14 SW, SAS Institute Inc, Cary, NC, USA). All data were first tested for normal distribution. Mean values were calculated for AC and LAI for each tree species. Surface and globe temperature data were normalized to account for day-to-day variation in air temperatures. Surface temperature normalization was done for each surface type separately by using the following equation:
T = T o T m i n T m a x T m i n
where T’ is the normalized temperature, To is the observed temperature, Tmin is the minimum recorded temperature and Tmax is the maximum recorded temperature. Linear regression analysis was performed between tree physical traits and all the temperature measurements. Generalized Linear Models (GLM) were used to determine relationships among AC, LAI, surface, globe temperature and surface types.

3. Results

3.1. Relationships of Physical Traits

Of the 471 urban trees that we sampled, Casuarina equisetifolia accounted for of the most trees of a single species (n = 58) followed by Lagerstroemia (n = 55) and Lophostemon confertus (n = 49), while Liquidambar styraciflua had the lowest representation (n = 13) (Table 1). DBH of the sampled tree population ranged from 0.03 m (Lagerstroemia) to 1.6 m (Melaleuca quinquenervia) and tree height varied from 3.8 m (Casuarina equisetifolia) to 35.3 m (Eucalyptus saligna) (Table 1).
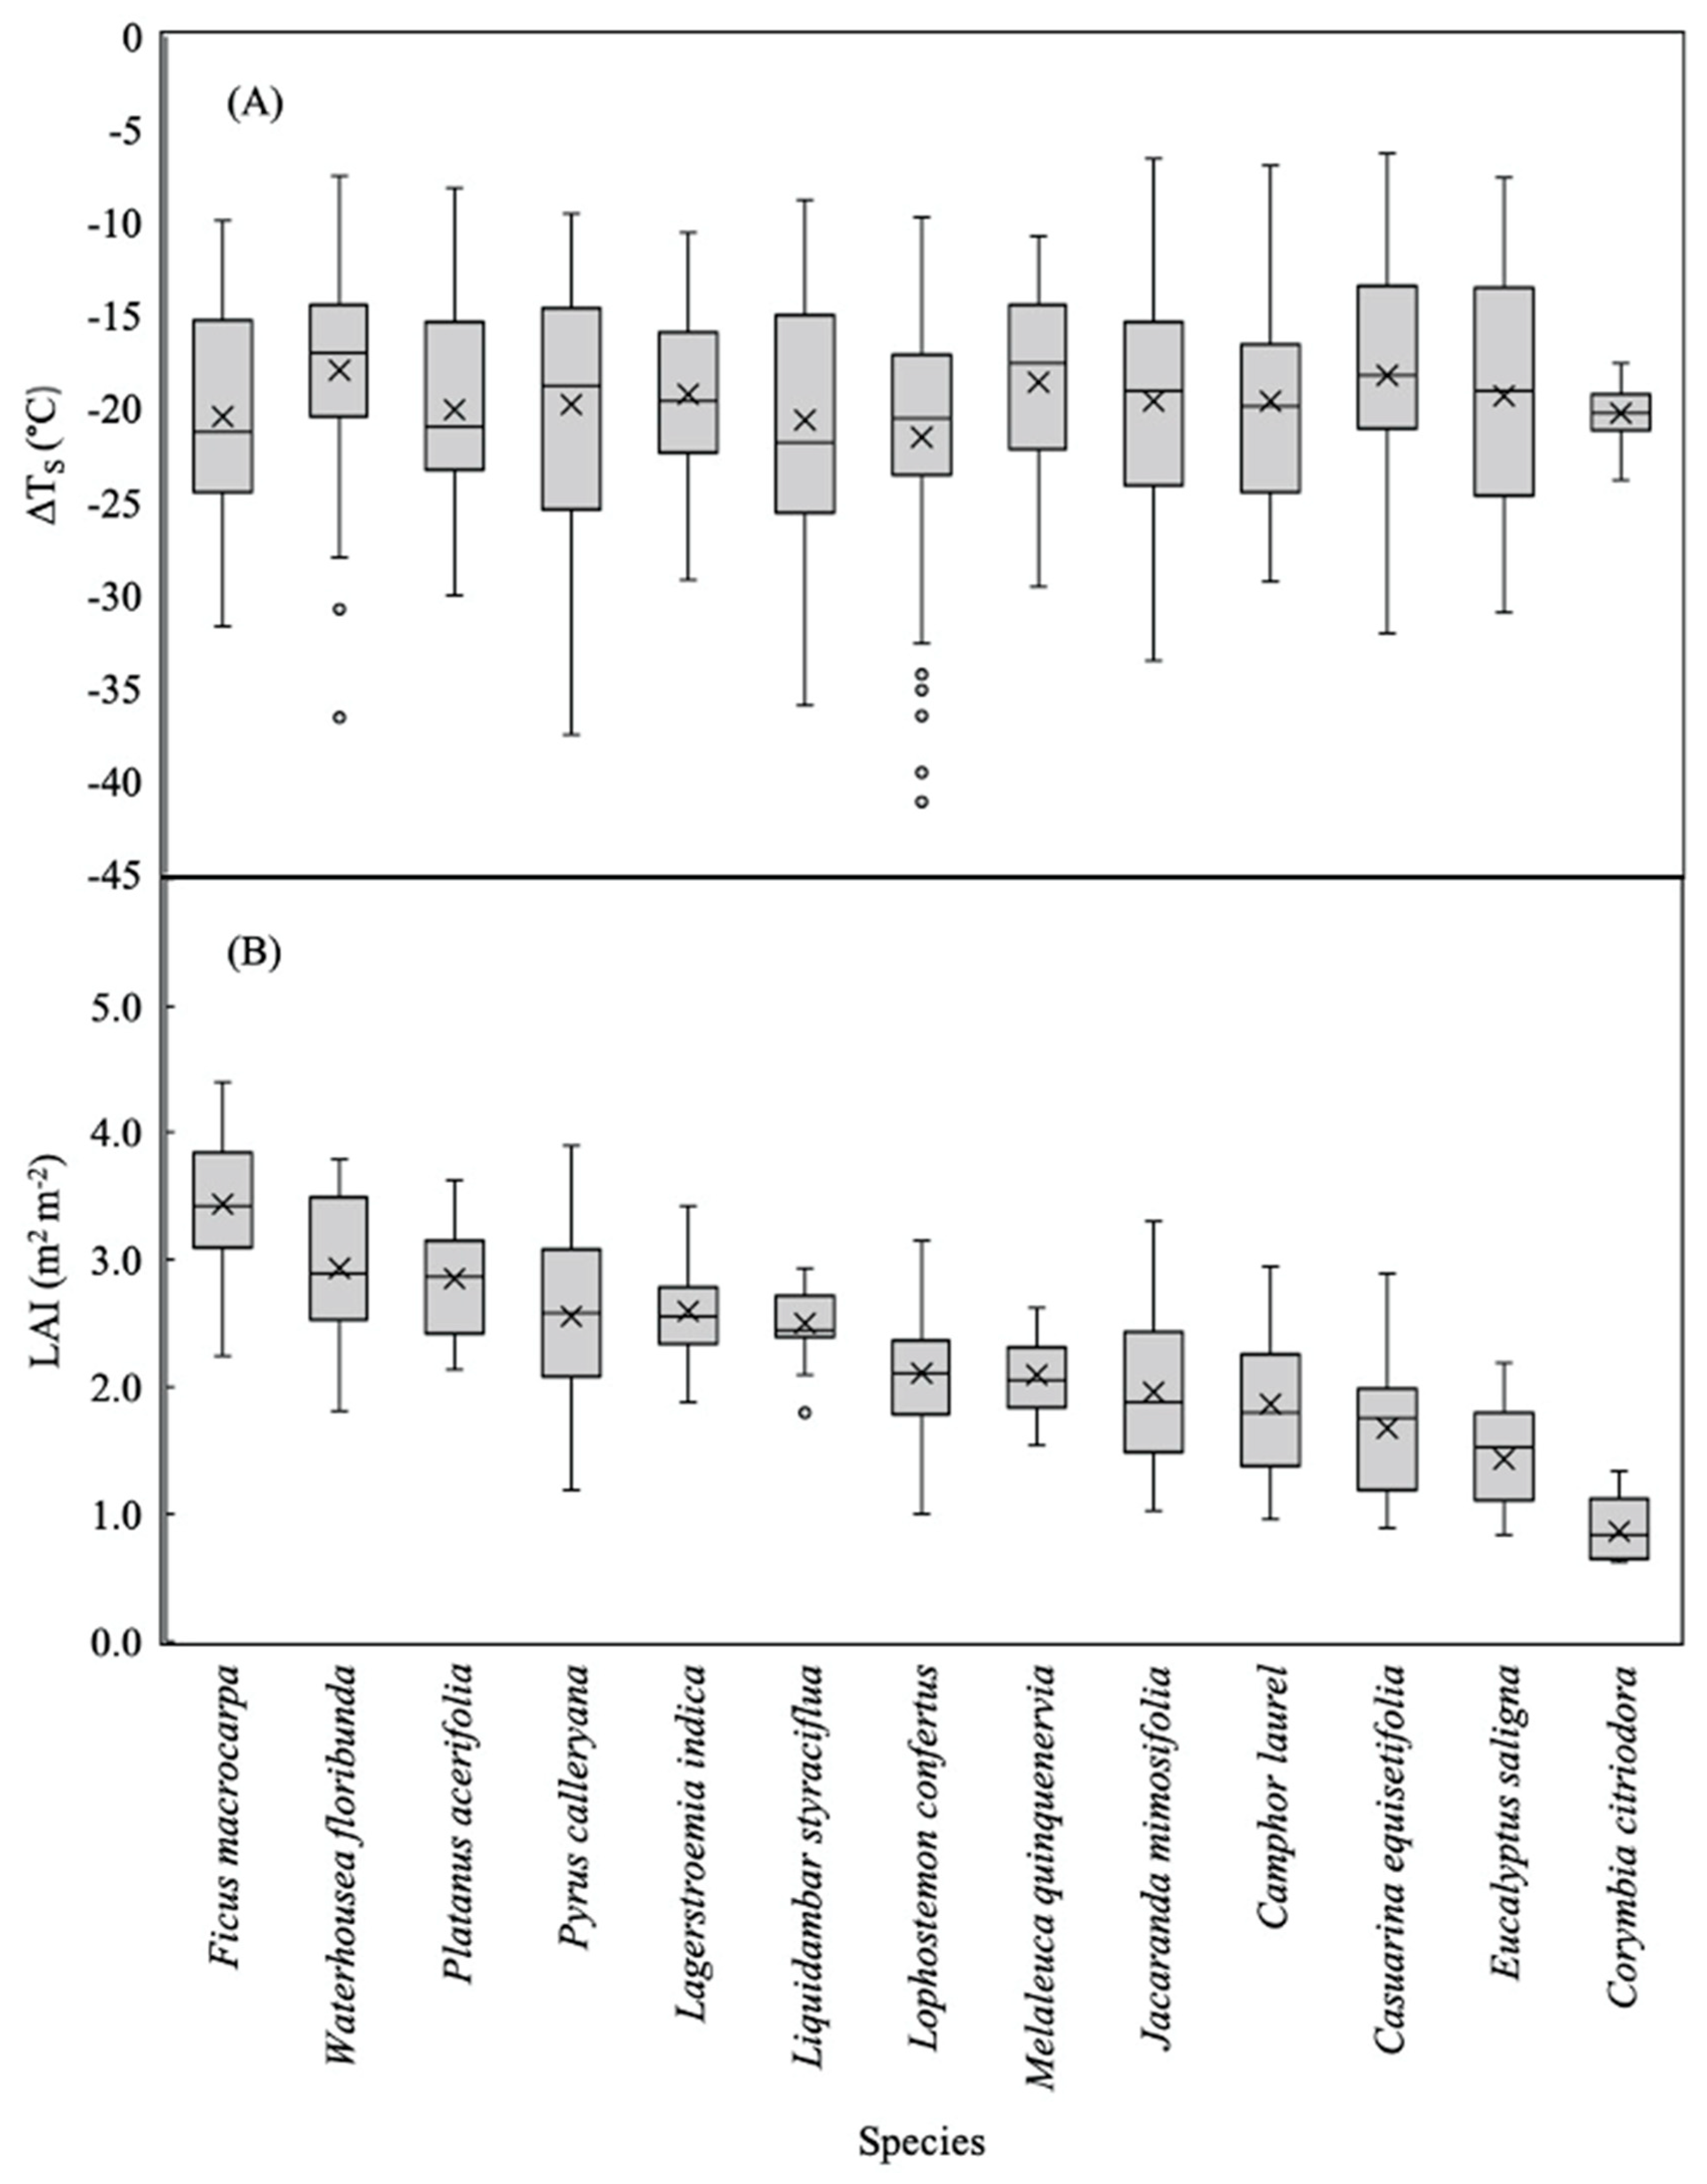
Jacaranda mimosifolia trees generally had the largest AC (99.47 ± 85.74 m2) followed by Platanus acerifolia (96.50 ± 44.52 m2) and Liquidambar styraciflua (95.50 ± 73.43 m2) while Waterhousea floribunda had the smallest AC (9.42 ± 6.85 m2) among all sampled species (Table 1). Furthermore, Ficus macrocarpa was the species with the highest LAI (3.4 ± 0.5 m2 m−2) and Waterhousea floribunda had the second largest LAI (2.9 ± 0.5 m2 m−2). In contrast, Corymbia citriodora had the lowest LAI (0.9 ± 0.2 m2 m−2) among the sampled tree species (Table 1).
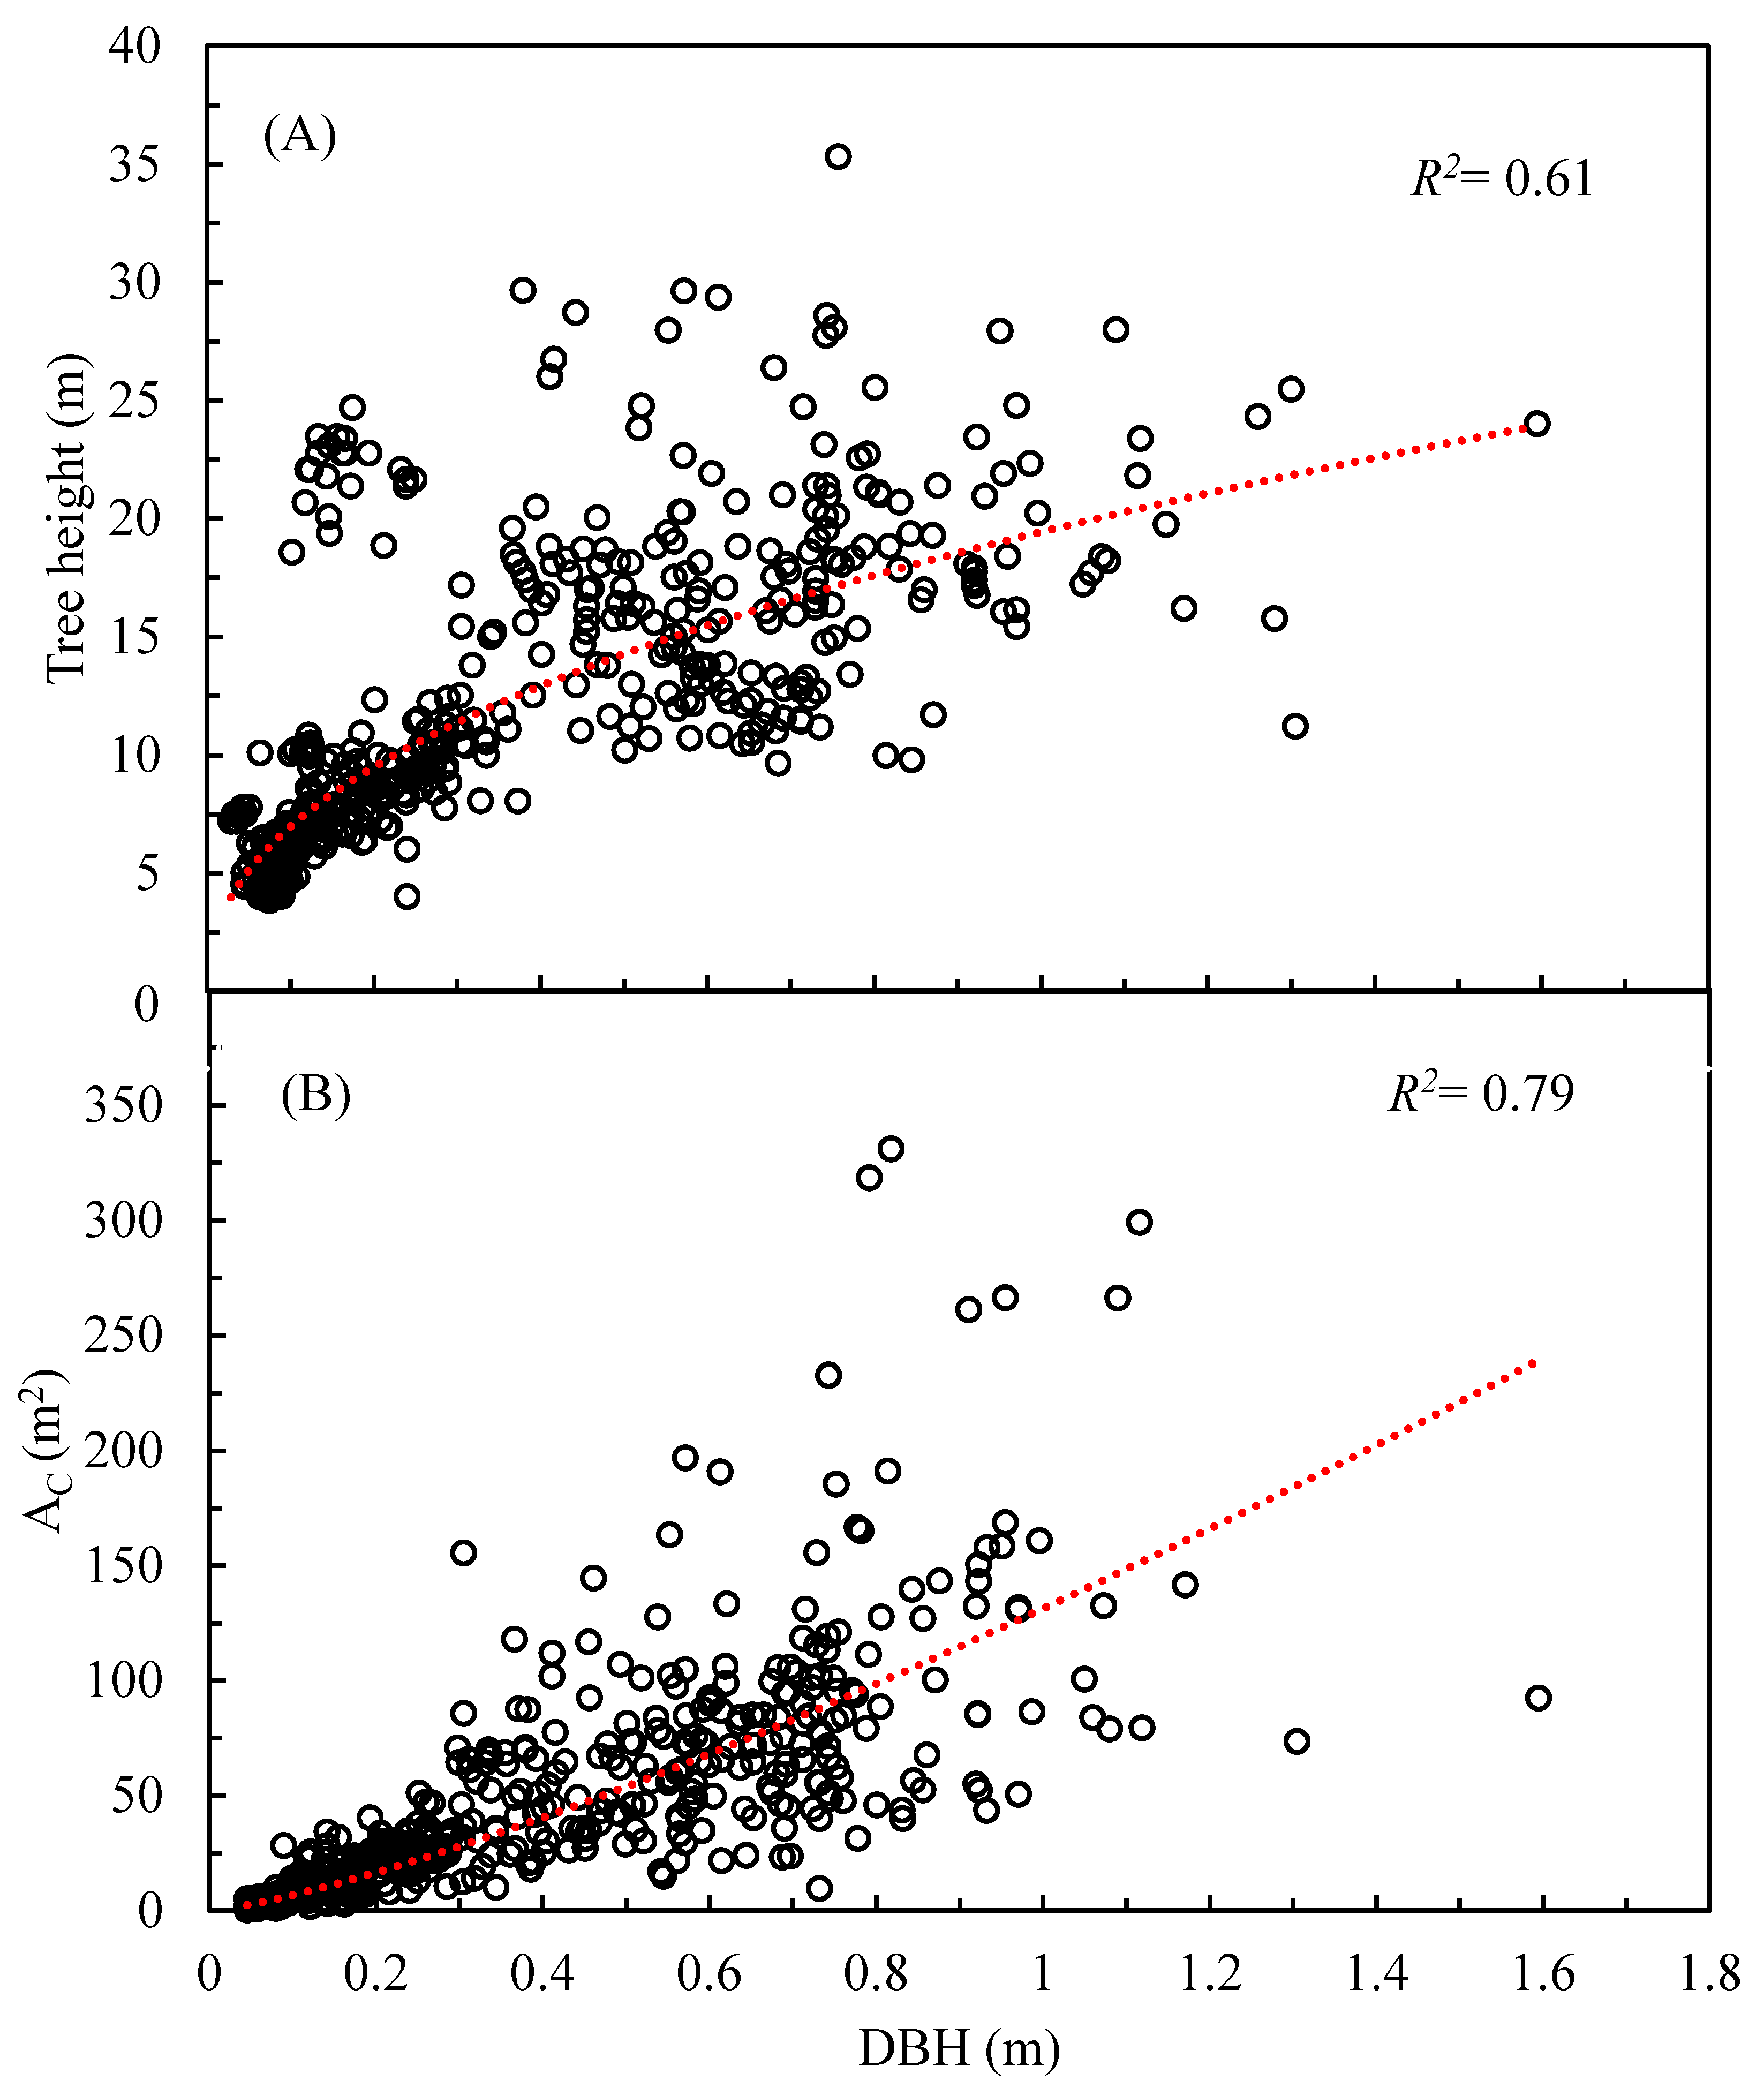
Across all species, tree height and DBH followed a clear positive trajectory (R2 = 0.68, p < 0.001), as did AC (R2 = 0.75, p < 0.001) (Figure 2). At the individual tree level, there were no significant relationships between LAI and DBH or AC. Tree species with dense canopies and medium height (e.g., Ficus macrocarpa, Lagerstroemia) had a smaller AC and higher LAI compared to tall, species with more open canopies (e.g., Casuarina equisetifolia, Corymbia citriodora) (Table 1).

3.2. Influence of Urban Trees on Different Types of Temperature

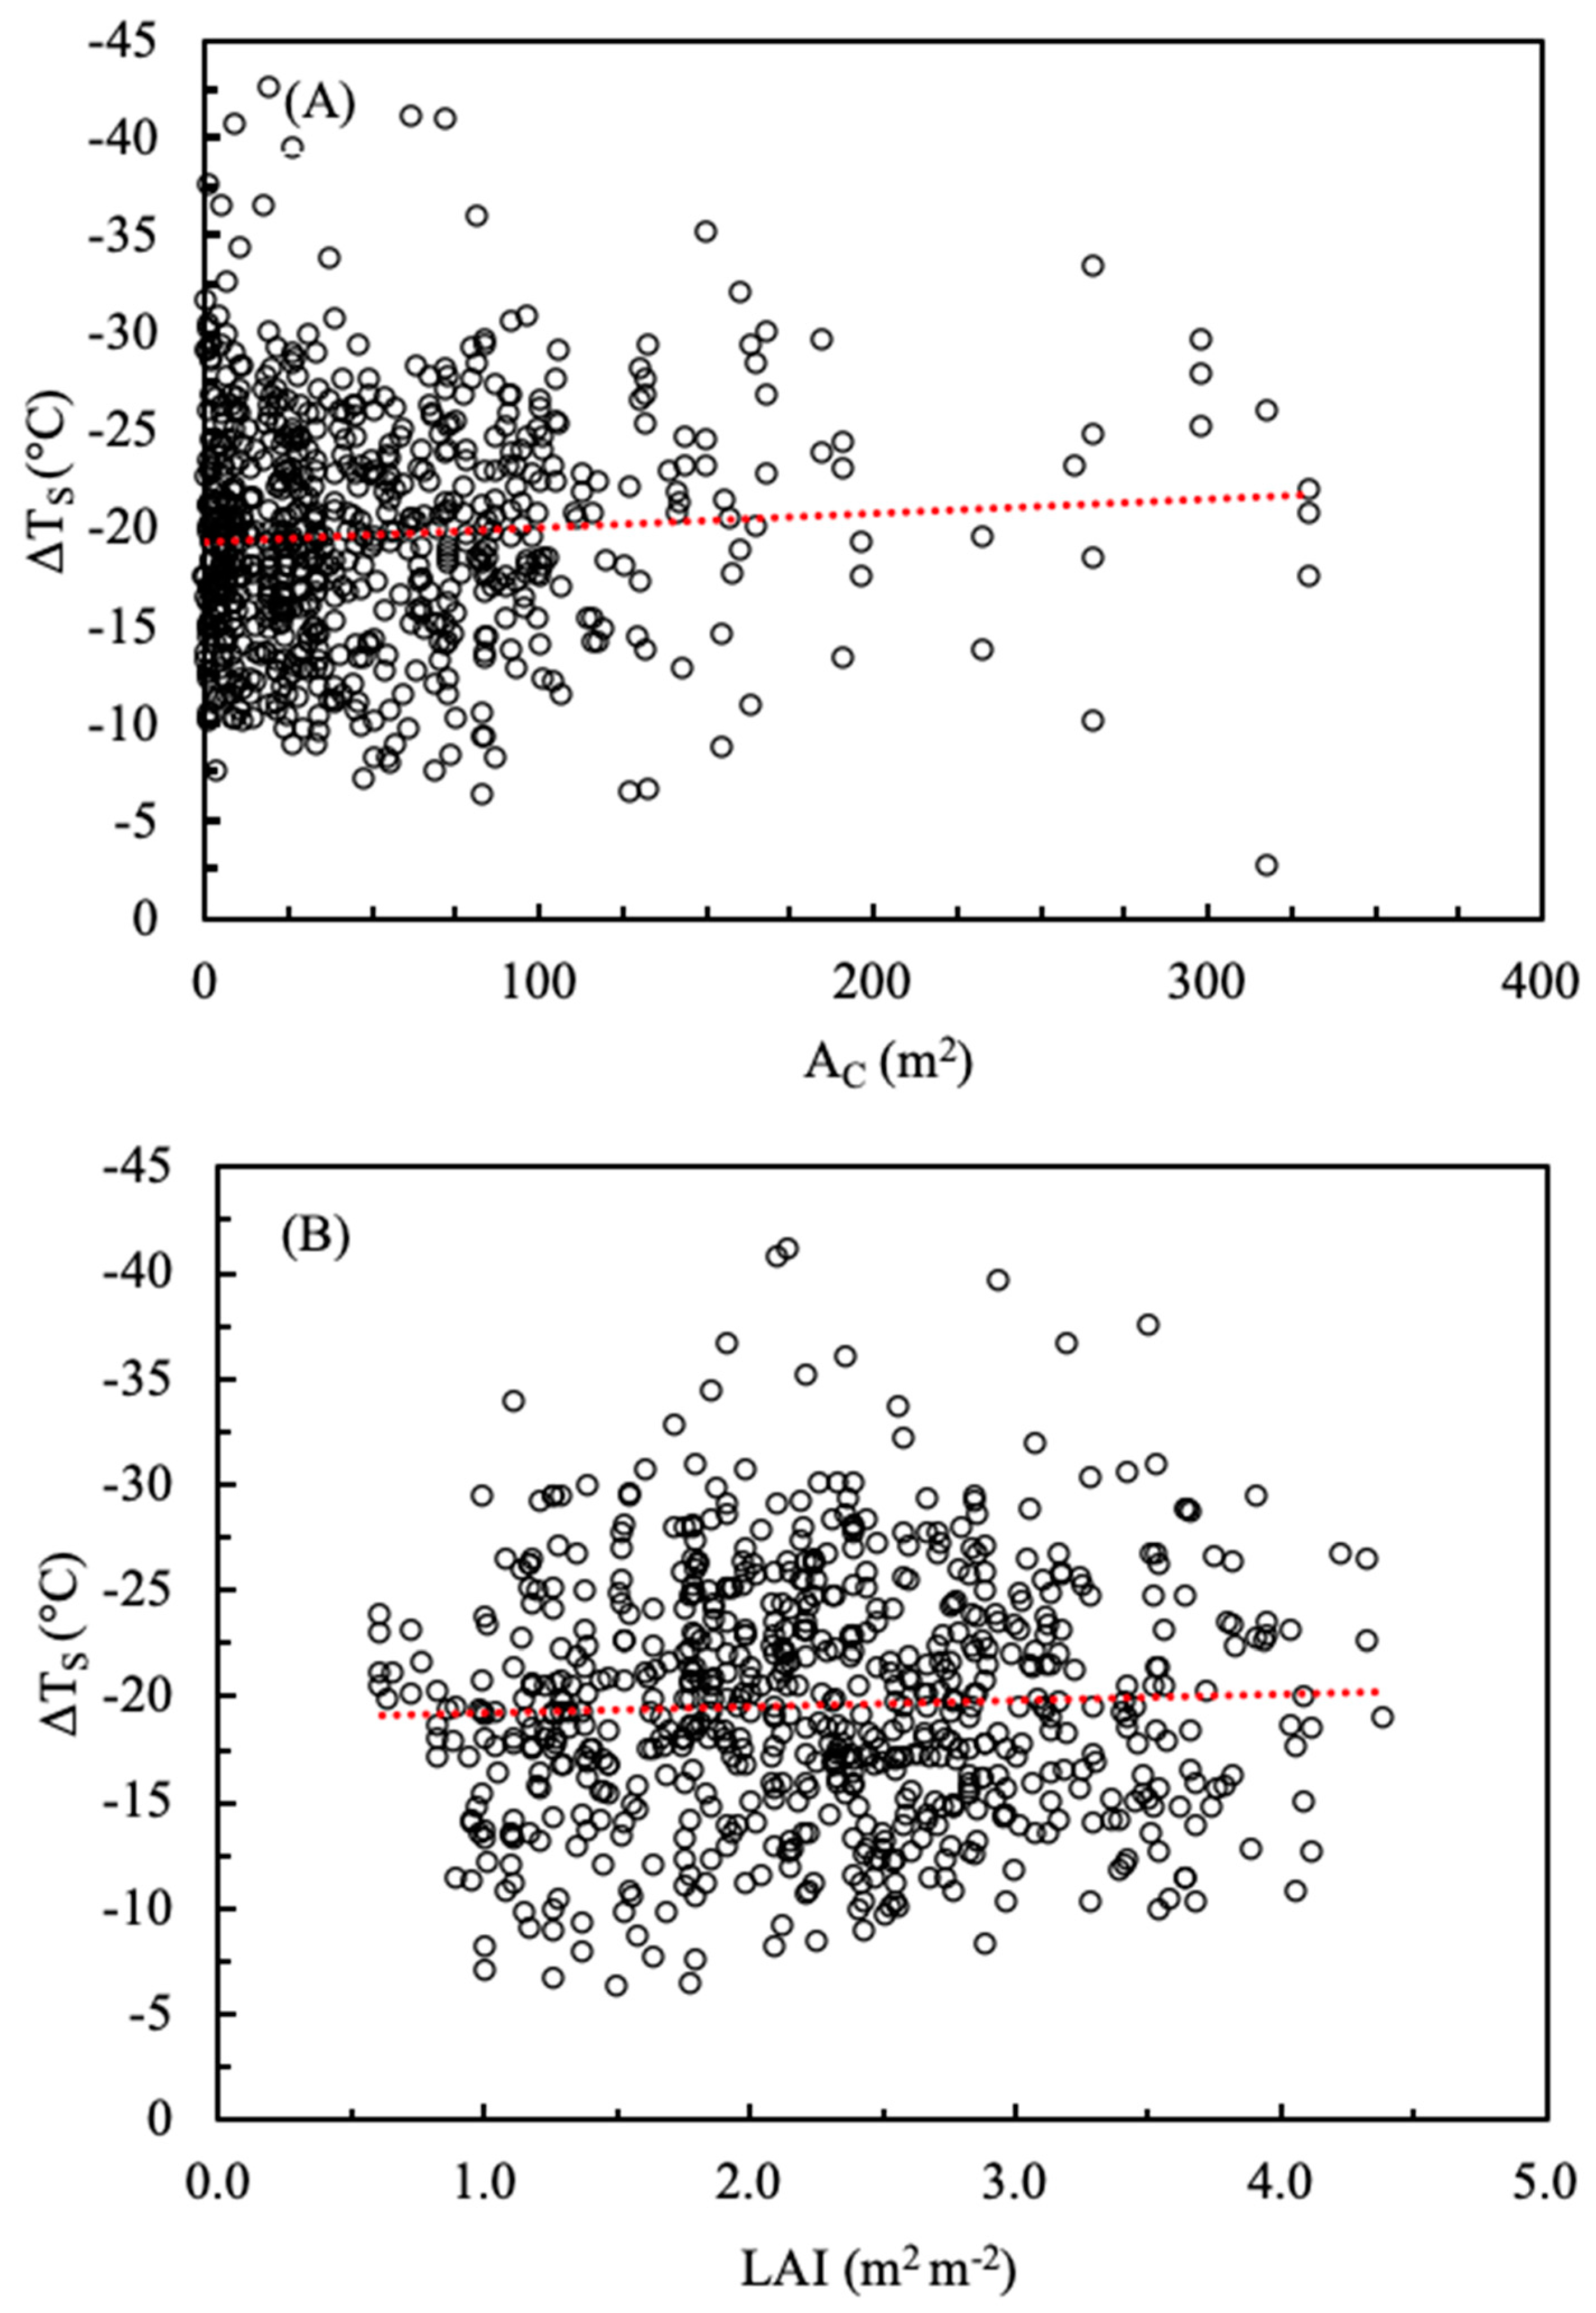
No significant effect of AC or LAI on the shaded surface temperature (TSS) or surface temperature differential (ΔTS) (p > 0.05) was found (Figure 3). Figure 4 shows the distribution of ΔTS and LAI for each species, further demonstrating that there was no systematic relationship between LAI and ΔTS among the investigated tree species. Species-specific measurements for mean, minimum, maximum and the differential of surface temperatures measured in the shade and sun are provided in Table S3.
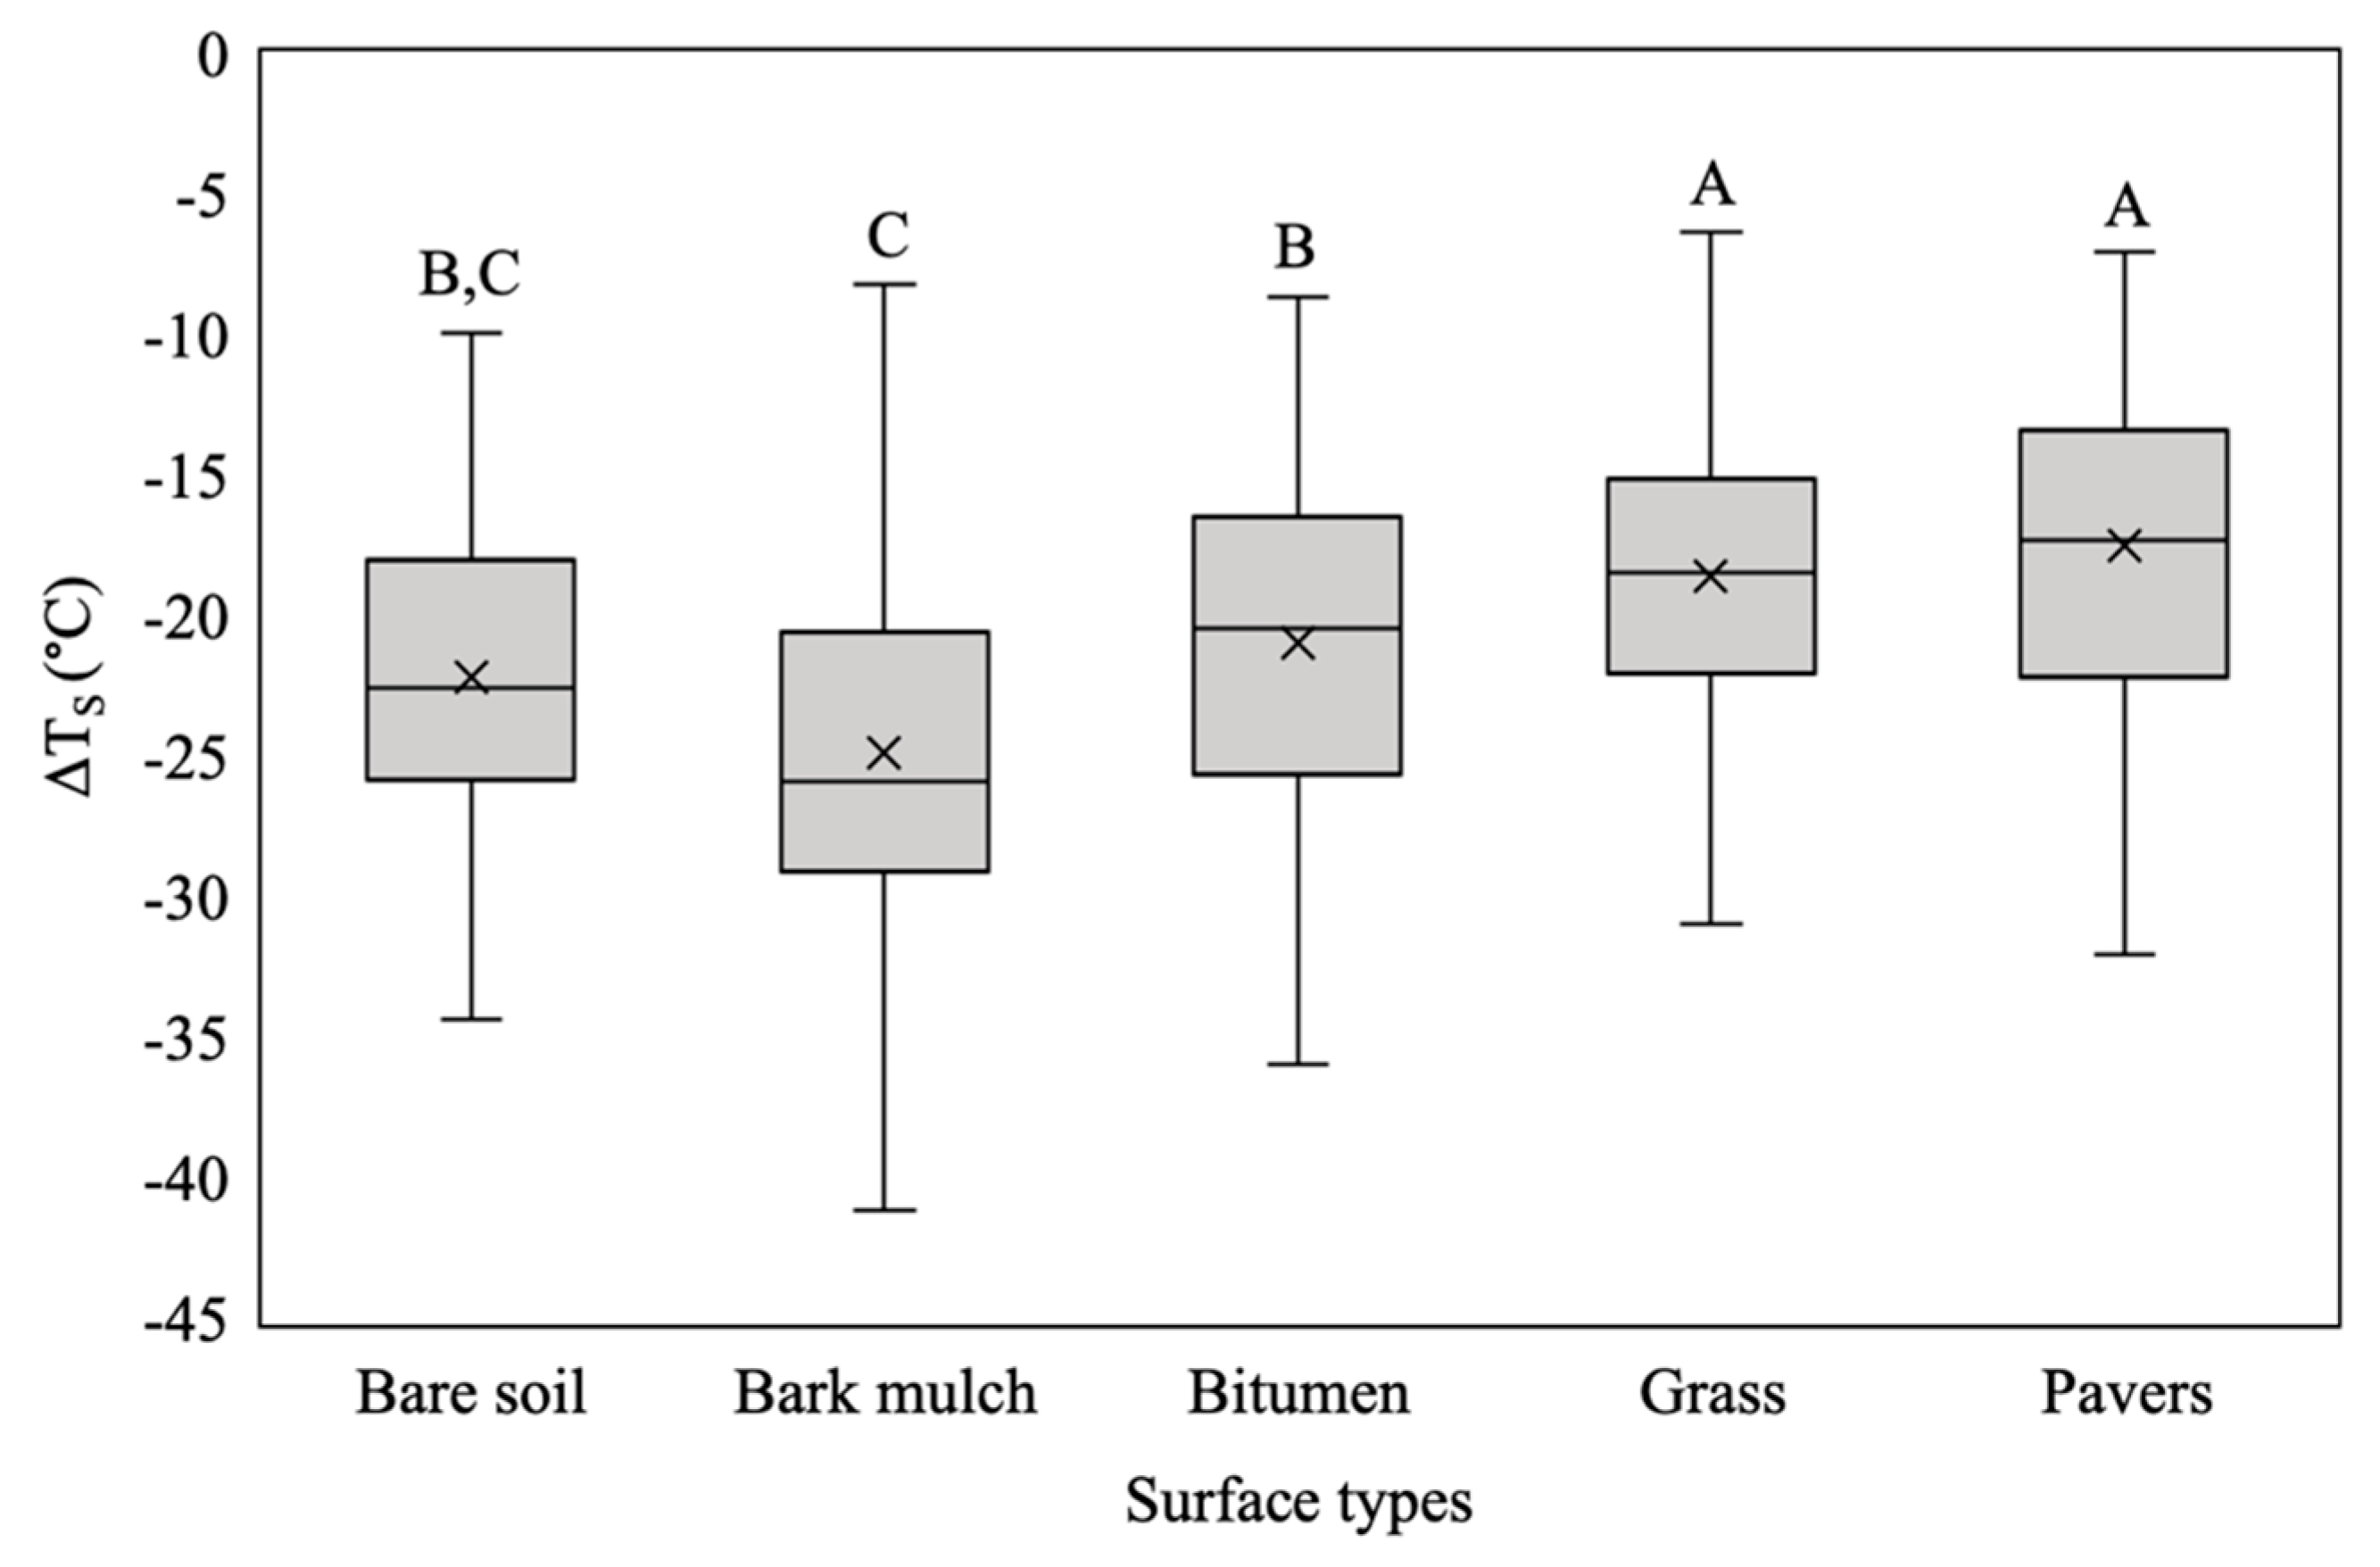
However, the effect of surface type on TSS, TSL and ΔTS was highly significant (p < 0.001). TSS ranged from 20.4 °C to 54.7 °C and bitumen had the highest mean TSS (33.5 ± 4.2 °C) followed by bark mulch (33.4 ± 3.1 °C), concrete pavers (33.1 ± 4.8 °C), bare soil (33.0 ± 2.9 °C) and grass (31.0 ± 2.7 °C) (Table 2). TSL ranged from 30.1 °C to 76.9 °C and bark mulch had the highest mean TSL (58.2 ± 8.1 °C) followed by bare soil (55.2 ± 5.9 °C), bitumen (54.5 ± 6.2 °C) and grass (49.4 ± 5.1 °C). Bark mulch showed the largest ΔTS (−24.8 ± 7.1 °C) followed by bare soil (−22.1 ± 5.6 °C), bitumen (−20.9 ± 5.8 °C) and grass (−18.5 ± 4.8 °C) respectively. Concrete pavers showed the smallest ΔTS (−17.5 ± 6.0 °C).
A Tukey HSD test revealed that TSL was significantly different between all surface types except between bark mulch and bare soil, bitumen and bare soil and pavers and grass (Figure 5). Similarly, TSS was significantly different between grass and bitumen, grass and bark mulch, grass and pavers, and also between grass and bare soil. Further, ΔTS was significantly different among all the surface types except bark mulch and bare soil, bitumen and bare soil and grass and pavers (Table 3).
Shaded globe temperature (GTS) and globe temperature differential (ΔTG) did not show any significant relationship with the tree morphological parameters (p > 0.05). Data for species-specific globe temperature measurements collected in the shade and sun, as well as ΔTG are provided in Table S4. Absolute GTS ranged from 26.3 to 44.5 °C and bark mulch had the highest mean GTS (37.9 ± 2.8 °C) followed by bitumen (36.9 ± 2.2 °C), pavers (36.1 ± 2.4 °C), bare soil (34.4 ± 2.2 °C) and grass (33.3 ± 3.2 °C) (Table 4). Absolute globe temperature in the sun light (GTSL) ranged from 28.4 to 54.1 °C and, consistently with rankings found in the shade, bark mulch had the highest mean GTSL (48.8 ± 2.8 °C) followed by bitumen (46.1 ± 2.2 °C), bare soil (41.5 ± 2.2 °C), pavers (40.4 ± 2.4 °C) and grass (36.5 ± 3.2 °C). Bark mulch showed the largest ΔTG (−10.9 ± 0.5 °C) and grass showed the lowest ΔTG (−3.2 ± 0.2 °C). The effect of surface types on GTS, GTSL and ΔTG was highly significant (p < 0.001). Tukey’s HSD test showed that GTS was significantly different among all the surface types except bitumen-bare soil. Similarly, GTSL was significantly different between all surface types except bitumen-pavers, pavers-bare soil and bitumen-bare soil. Further, ΔTG significantly differed between all surface types (p < 0.001) (see Table 3).

4. Discussion

4.1. Influence of Urban Trees on Surface and Globe Temperature

Tree shade reduced the surface temperatures by 20 °C on average, and species like Lophostemon confertus, Pyrus calleryana and Liquidambar styraciflua provided the largest surface temperature reduction of around 40 °C. Although this can be due to having a comparatively larger LAI, the correlation analysis between AC, LAI and the ΔTS did not show a strong, significant relationship. For example, Waterhousea floribunda had the second largest LAI among the sampled tree species, however, it had the lowest average ΔTS. Similar results were found in the globe temperature measurements. There is a globe temperature reduction up to 13 °C from the sun to the tree shade. Nevertheless, results do not support that LAI or the AC have systematically influenced this temperature reduction. Despite having both the largest LAI, Ficus macrocarpa accounted for the highest globe temperatures.
Our findings are different from the findings of other studies. For example, the study conducted by Hardin and colleagues [40] in Terre Haute, Indiana, USA, on the effect of urban leaf area on summertime urban surface temperatures found that leaf area index and surface temperature were negatively correlated. In this study, LAI accounted for 62% of variation in surface temperature. Moreover, a study by Yusof and colleagues [24] suggested that surface temperature reduction is positively correlated with LAI. They also found that tree shade reduces the surface temperature by an average of 12 °C. A study carried out in the Suzhou Industrial Park, Shanghai, China [41] concluded that the cooling effect of green areas were positively correlated with LAI. Similar findings were presented by Napoli and colleagues [42] where they found a strong relationship between ΔTS on asphalt and LAI and a weaker relationship between ΔTS on grass and LAI. Studies have found that the amount of solar radiation blocked by tree shade is strongly related to size of the crown and height of the tree [43,44], and thereby improves surface cooling. In this study, we were unable to build such a relationship with tree height or AC. There is no doubt that tree shade reduces the amount of heat absorbed by the surface underneath during the daytime; however, our study provided evidence that microclimate underneath the trees and the temperature of surface material greatly depends on the type of surface material.

4.2. Effect of Surface Types on Surface and Globe Temperature

The results showed that grass had the lowest recorded surface temperature and globe temperature both in shade and sun. This can be due to the combined effects of evapotranspiration and albedo of this surface material. Albedo can be defined as the fraction of the incident sunlight that the surface reflects [45,46]. Grass has the highest albedo (0.3–0.25) [47] of all the surface types investigated here, thus it absorbs less and reflects more radiation than the other surface types. However, it does not store incoming solar radiation and emits this energy as sensible heat like the other surface materials. The energy absorbed by grass is used to fuel the biochemical processes of photosynthesis and latent heat flux cooling, which reduces air temperature. On the contrary, bark mulch had the highest TSS TSL and GTS. It has a very low albedo 0.05 [48] compared to the other surfaces (bare soil (0.26–0.16) [49], bitumen (0.2–0.05) and concrete pavers (0.13–0.1) [47]) and thus increases the surface temperature by absorbing more radiation. However, it is worth noting that there are other factors, such as the thermal emissivity and thermal mass of surface materials, which influence the surface temperatures [50] and the extent to which surface materials contribute to the UHIE. Further experimentation is needed to evaluate individual effects of these parameters on surface temperature variations. Largest surface cooling from tree shade was observed for bark mulch followed by bare soil, bitumen, grass and pavers. The results indicated that the surface material had a strong and significant influence on surface temperature. This finding is backed-up by the globe temperature recorded above each surface material; the highest GTSL was recorded over bark mulch whereas the lowest was recorded over grass. Black globe temperature combines the effects of air movement, dry-bulb temperature, wind speed and radiant heat received from the surfaces [51]. The novel finding of this study advances our understanding of cooling provided by trees. Planting trees with wider canopies and larger LAI does not directly support urban cooling through surface temperature reduction. Rather, the surface material has a larger influence in reducing thermal loads in urban space. This finding should be integrated in urban planning and cooling strategies to mitigate UHIE.

4.3. Limitations of the Study

The majority of the sampled trees were well-established trees with a DBH of 10–50 cm. This is a clear indication that the urban landscape of Western Sydney does primarily accommodate younger mature trees and that older mature trees with wide canopies are lower in number. Research has demonstrated that the shade profile of a tree depends on the maturity, overlapping canopies and canopy extents [52,53,54]. The major proportion of our study was comprised of young mature trees with smaller and separate canopies which can influence the amount of solar radiation reaching the ground. We did not include measurements of soil moisture, which potentially influenced our surface temperature measurements of bare soil, grass and bark mulch. However, surface temperatures were only recorded during midday on a hot sunny day following one or two days of zero precipitation. Only during 2 out of 13 days did we experience a light shower (<10 mm total daily precipitation) two days prior to data collection. We thus expect that any influence of soil moisture on surface temperatures would be marginal.

5. Conclusions

This study gave a novel insight into the relationship between surface temperature and canopy characteristics. It showed that canopy characteristics such as LAI, shaded area and crown projected area do not have a strong influence on the temperature loads on surfaces. Although these canopy characteristics varied among the tested species, they were unrelated to surface temperature reductions in shade. Nevertheless, we found that surface types play a significant role in absorbing and reflecting radiation, thereby controlling surface temperatures and cooling arising from tree shade. Evapotranspiration will have an effect on surface cooling; however, further studies are needed to determine the cumulative effects of surface material and tree evapotranspiration on surface cooling. This novel finding can be integrated in urban cooling and urban planning strategies. Landscape planners and architects should consider the choice of surface materials in urban settings as a higher priority than tree species for shade quality alone when implementing urban greening strategies to mitigate urban heat.

Supplementary Materials

The following are available online at https://www.mdpi.com/1999-4907/11/11/1141/s1. Table S1: Tree species with their mean, minimum and maximum air temperature in the shade (TAS), in the sun (TASL) and the differential between these (ΔTA). Table S2: Mean, minimum and maximum TAS, TASL and ΔTA recorded in bare soil, grass, bark mulch, pavers and bitumen. Table S3: Tree species with their mean, minimum and maximum shaded surface temperature (TSS), sunlit surface temperature (TSL) and surface temperature differential (ΔTS). Table S4: Tree species with their mean, minimum and maximum globe temperature in the shade (GTS), in the sunlight (GTSL) and the differential between the them (ΔTG).

Author Contributions

K.T.U.N. collected and analysed the data and wrote the draft manuscript. P.S. designed the study and assisted with analyses of data and writing the manuscript. T.M.G. contributed to data analyses and writing of the manuscript. All authors have read and agreed to the published version of the manuscript.

Funding

This research received no external funding.

Acknowledgments

Substantial assistance in the field by Prabath Darshana and Dhilan Elvitigala is acknowledged. Constructive suggestions of the anonymous reviewers that helped to improve the quality of the work are highly appreciated.

Conflicts of Interest

The authors declare that they have no conflict of interest.

References

  1. Parsaee, M.; Joybari, M.; Mirzaei, P.; Haghighat, F. Urban heat Island, urban climate maps and urban development policies and action plans. Environ. Technol. Innov. 2019, 14, 100341. [Google Scholar] [CrossRef]
  2. Iping, A.; Kidston-Lattari, J.; Simpson-Young, A.; Duncan, E.; McManus, P. (Re) Presenting urban heat Islands in Australian cities: A study of media reporting and implications for urban heat and climate change debates. Urban Clim. 2019, 27, 420–429. [Google Scholar] [CrossRef]
  3. Gartland, L. Heat Islands: Understanding and Mitigating Heat in Urban Areas; Earthscan: London, UK, 2008; ISBN 978-184-407-250-7. [Google Scholar]
  4. Hopkins, G.; Goodwin, C. Living Architecture: Green Roofs and Walls; CSIRO Pub.: Collingwood, Australia, 2011; ISBN 978-064-309-663-9. [Google Scholar]
  5. Salamanca, F.; Georgescu, M.; Mahalov, A.; Moustaoui, M.; Wang, M. Anthropogenic heating of the urban environment due to air conditioning. J. Geophys. Res. Atmos. 2014, 119, 5949–5965. [Google Scholar] [CrossRef]
  6. Priyadarsini, R. Urban heat Island and its impact on building energy consumption. Adv. Build. Energy Res. 2009, 3, 261–270. [Google Scholar] [CrossRef]
  7. Yang, F.; Lau, S.; Qian, F. Thermal comfort effects of urban design strategies in high-rise urban environments in a sub-tropical climate. Archit. Sci. Rev. 2011, 54, 285–304. [Google Scholar] [CrossRef]
  8. Zhao, Q.; Wentz, E.; Murray, A. Tree shade coverage optimization in an urban residential environment. Build. Environ. 2017, 115, 269–280. [Google Scholar] [CrossRef] [Green Version]
  9. Akbari, H.; Kurn, D.M.; Bretz, S.E.; Hanford, J.W. Peak power and cooling energy savings of shade trees. Energy Build. 1997, 25, 139–148. [Google Scholar] [CrossRef] [Green Version]
  10. Wang, Z.; Zhao, X.; Yang, J.; Song, J. Cooling and energy saving potentials of shade trees and urban lawns in a desert city. Appl. Energy 2016, 161, 437–444. [Google Scholar] [CrossRef]
  11. Nowak, D.; Appleton, N.; Ellis, A.; Greenfield, E. Residential building energy conservation and avoided power plant emissions by urban and community trees in the United States. Urban For. Urban Green. 2017, 21, 158–165. [Google Scholar] [CrossRef] [Green Version]
  12. Wang, X.; Yao, J.; Yu, S.; Miao, C.; Chen, W.; He, X. Street trees in a chinese forest city: Structure, benefits and costs. Sustainability 2018, 10, 674. [Google Scholar] [CrossRef] [Green Version]
  13. Staats, H.; Swain, R. Cars, trees, and house prices: Evaluation of the residential environment as a function of numbers of cars and trees in the street. Urban For. Urban Green. 2020, 47, 126554. [Google Scholar] [CrossRef]
  14. Zhang, Y.; Dong, R. Impacts of street-visible greenery on housing prices: Evidence from a hedonic price model and a massive street view image dataset in Beijing. Isprs Int. J. Geo-Inf. 2018, 7, 104. [Google Scholar] [CrossRef] [Green Version]
  15. Matzarakis, A.; Rutz, F.; Mayer, H. Modelling radiation fluxes in simple and complex environments—Application of the rayman model. Int. J. Biometeorol. 2006, 51, 323–334. [Google Scholar] [CrossRef] [PubMed]
  16. Astell-Burt, T.; Feng, X. Urban green space, tree canopy and prevention of cardiometabolic diseases: A multilevel longitudinal study of 46 786 Australians. Int. J. Epidemiol. 2020, 49, 926–933. [Google Scholar] [CrossRef] [PubMed] [Green Version]
  17. Jennings, V.; Gragg, R.; Brown, C.; Hartel, D.; Kuehler, E.; Sinykin, A.; Johnson, E.; Kondo, M. Structural characteristics of tree cover and the association with cardiovascular and respiratory health in tampa, FL. J. Urban Health 2019, 96, 669–681. [Google Scholar] [CrossRef]
  18. Fahmy, M.; Sharples, S.; Yahiya, M. LAI based trees selection for mid latitude urban developments: A microclimatic study in Cairo, Egypt. Build. Environ. 2010, 45, 345–357. [Google Scholar] [CrossRef] [Green Version]
  19. Lin, B.-S.; Lin, Y.-J. Cooling effect of shade trees with different characteristics in a subtropical urban park. HortScience 2010, 45, 83–86. [Google Scholar] [CrossRef] [Green Version]
  20. Sanusi, R.; Johnstone, D.; May, P.; Livesley, S.J. Microclimate benefits that different street tree species provide to sidewalk pedestrians relate to differences in plant area index. Landsc. Urban Plan. 2017, 157, 502–511. [Google Scholar] [CrossRef]
  21. Armson, D.; Stringer, P.; Ennos, A. The effect of tree shade and grass on surface and globe temperatures in an urban area. Urban For. Urban Green. 2012, 11, 245–255. [Google Scholar] [CrossRef]
  22. Feyisa, G.L.; Dons, K.; Meilby, H. Efficiency of parks in mitigating urban heat island effect: An example from Addis Ababa. Landsc. Urban Plan. 2014, 123, 87–95. [Google Scholar] [CrossRef]
  23. Tan, Z.; Lau, K.K.-L.; Ng, E. Urban tree design approaches for mitigating daytime urban heat island effects in a high-density urban environment. Energy Build. 2016, 114, 265–274. [Google Scholar] [CrossRef]
  24. Yusof, N.S.; Hussain, N.H.M.; Rusli, N. Analysing street heritage trees surface temperature for UHI mitigation using remote sensing and GIS application. Malays. J. Sustain. Environ. 2019, 6, 77. [Google Scholar] [CrossRef] [Green Version]
  25. Yuan, F.; Bauer, M.E. Comparison of impervious surface area and normalized difference vegetation index as indicators of surface urban heat island effects in landsat imagery. Remote Sens. Environ. 2007, 106, 375–386. [Google Scholar] [CrossRef]
  26. Barbierato, E.; Bernetti, I.; Capecchi, I.; Saragosa, C. Quantifying the impact of trees on land surface temperature: A downscaling algorithm at city-scale. Eur. J. Remote Sens. 2019, 52, 74–83. [Google Scholar] [CrossRef] [Green Version]
  27. Trlica, A.; Hutyra, L.; Schaaf, C.; Erb, A.; Wang, J. Albedo, land cover, and daytime surface temperature variation across an urbanized landscape. Earth’s Future 2017, 5, 1084–1101. [Google Scholar] [CrossRef] [Green Version]
  28. Santamouris, M.; Ding, L.; Fiorito, F.; Oldfield, P.; Osmond, P.; Prasad, D.; Synnefa, A. Passive and active cooling for the built environment-analysis and assessment of the cooling potential and mitigation technologies using performance data from 220 large scale projects. Sol. Energy 2017, 154, 14–33. [Google Scholar] [CrossRef]
  29. Zhou, D.; Zhao, S.; Liu, S.; Zhang, L.; Zhu, C. Surface urban heat island in China’s 32 major cities: Spatial patterns and drivers. Remote Sens. Environ. 2014, 152, 51–61. [Google Scholar] [CrossRef]
  30. Climate Statistics for Australian Locations. Available online: http://www.bom.gov.au/climate/averages/tables/cw_066062.shtml (accessed on 19 June 2020).
  31. Bureau of Meteorology. Greater Sydney in May 2020: Above Average Rainfall and Cooler Days. Available online: http://www.bom.gov.au/climate/current/month/nsw/sydney.shtml (accessed on 3 February 2020).
  32. Sidiqui, P.; Huete, A.; Devadas, R. Spatio-temporal mapping and monitoring of urban heat Island patterns over Sydney, Australia using MODIS and Landsat-8. In Proceedings of the 4th International Workshop on Earth Observation and Remote Sensing Applications, Guangzhou, China, 4–6 July 2016. [Google Scholar]
  33. Amati, M.; Boruff, B.; Caccetta, P.; Devereux, D.; Kaspar, J.; Phelan, K.; Saunders, A. Where should All the Trees Go? Investigating the Impact of Tree Canopy Cover on Socio-Economic Status and Wellbeing in LGA’s; Horticulture Innovation Australia: Sydney, Australia, 2017. [Google Scholar]
  34. Greater Sydney Commission. The Pulse of Greater Sydney; Greater Sydney Commission: Parramatta, Australia, 2019. [Google Scholar]
  35. The Urban Developer. How Western Sydney has Transformed over the Last Decade. Available online: https://theurbandeveloper.com/articles/how-western-sydney-has-transformed-over-the-last-decade (accessed on 10 February 2020).
  36. Regional Population Growth, Australia, 2018–2019. Available online: https://www.abs.gov.au/AUSSTATS/[email protected]/mf/3218.0 (accessed on 9 April 2020).
  37. Pfautsch, S.; Peri, P.; Macfarlane, C.; van Ogtrop, F.; Adams, M. Relating water use to morphology and environment of Nothofagus from the world’s most southern forests. Trees 2013, 28, 125–136. [Google Scholar] [CrossRef]
  38. Fang, M.; Yue, G.; Yu, Q. The study on an application of otsu method in canny operator. In Proceedings of the International Symposium on Information Processing, Huangshan, China, 21–23 August 2009; pp. 109–112. [Google Scholar]
  39. da Silva, T.; Santos, G.; Duarte, A.; Turco, S.; Cruz Neto, J.; Jardim, A.; dos Santos, T. Black globe temperature from meteorological data and a bioclimatic analysis of the brazilian northeast for saanen goats. J. Therm. Biol. 2019, 85, 102408. [Google Scholar] [CrossRef] [PubMed]
  40. Hardin, P.; Jensen, R. The effect of urban leaf area on summertime urban surface kinetic temperatures: A terre haute case study. Urban For. Urban Green. 2007, 6, 63–72. [Google Scholar] [CrossRef]
  41. Xiao, X.; Dong, L.; Yan, H.; Yang, N.; Xiong, Y. The influence of the spatial characteristics of urban green space on the urban heat Island effect in Suzhou industrial park. Sustain. Cities Soc. 2018, 40, 428–439. [Google Scholar] [CrossRef]
  42. Napoli, M.; Massetti, L.; Brandani, G.; Petralli, M.; Orlandini, S. Modeling tree shade effect on urban ground surface temperature. J. Environ. Qual. 2016, 45, 146–156. [Google Scholar] [CrossRef]
  43. Gillner, S.; Vogt, J.; Tharang, A.; Dettmann, S.; Roloff, A. Role of street trees in mitigating effects of heat and drought at highly sealed urban sites. Landsc. Urban Plan. 2015, 143, 33–42. [Google Scholar] [CrossRef]
  44. Gómez-Muñoz, V.; Porta-Gándara, M.; Fernández, J. Effect of tree shades in urban planning in hot-arid climatic regions. Landsc. Urban Plan. 2010, 94, 149–157. [Google Scholar] [CrossRef]
  45. Coakley, J. Reflectance and albedo, surface. Encycl. Atmos. Sci. 2003, 1914–1923. [Google Scholar] [CrossRef]
  46. Akbari, H. Cooling our Communities: A Guidebook on Tree Planting and Light-Colored Surfacing; U.S. Environmental Protection Agency, Office of Policy Analysis, Climate Change Division: Washington, DC, USA, 1992. [Google Scholar]
  47. Zeman, F. Metropolitan Sustainability; Woodhead Pub.: Sawston, Cambridge, UK, 2012; p. 112. [Google Scholar]
  48. Tripathi, R.; Katiyar, T. Effect of mulches on the thermal regime of soil. Soil Tillage Res. 1984, 4, 381–390. [Google Scholar] [CrossRef]
  49. Gascoin, S.; Ducharne, A.; Ribstein, P.; Perroy, E.; Wagnon, P. Sensitivity of bare soil albedo to surface soil moisture on the moraine of the zongo glacier (Bolivia). Geophys. Res. Lett. 2009, 36. [Google Scholar] [CrossRef]
  50. Hulley, M. The urban heat Island effect: Causes and potential solutions. Metrop. Sustain. 2012, 79–98. [Google Scholar] [CrossRef]
  51. Panagakis, P. Black-globe temperature effect on short-term heat stress of dairy ewes housed under hot weather conditions. Small Rumin. Res. 2011, 100, 96–99. [Google Scholar] [CrossRef]
  52. Downs, N.; Baldwin, L.; Parisi, A.; Butler, H.; Vanos, J.; Beckman, M.; Harrison, S. Comparing the annualised dynamic shade characteristics of twenty-one tree canopies across twenty-six municipalities in a high ambient uv climate, queensland-Australia. Appl. Geogr. 2019, 108, 74–82. [Google Scholar] [CrossRef] [Green Version]
  53. Downs, N.; Butler, H.; Baldwin, L.; Parisi, A.; Amar, A.; Vanos, J.; Harrison, S. A site-specific standard for comparing dynamic solar ultraviolet protection characteristics of established tree canopies. MethodsX 2019, 6, 1683–1693. [Google Scholar] [CrossRef] [PubMed]
  54. Rahman, M.; Armson, D.; Ennos, A. A comparison of the growth and cooling effectiveness of five commonly planted urban tree species. Urban Ecosyst. 2014, 18, 371–389. [Google Scholar] [CrossRef]
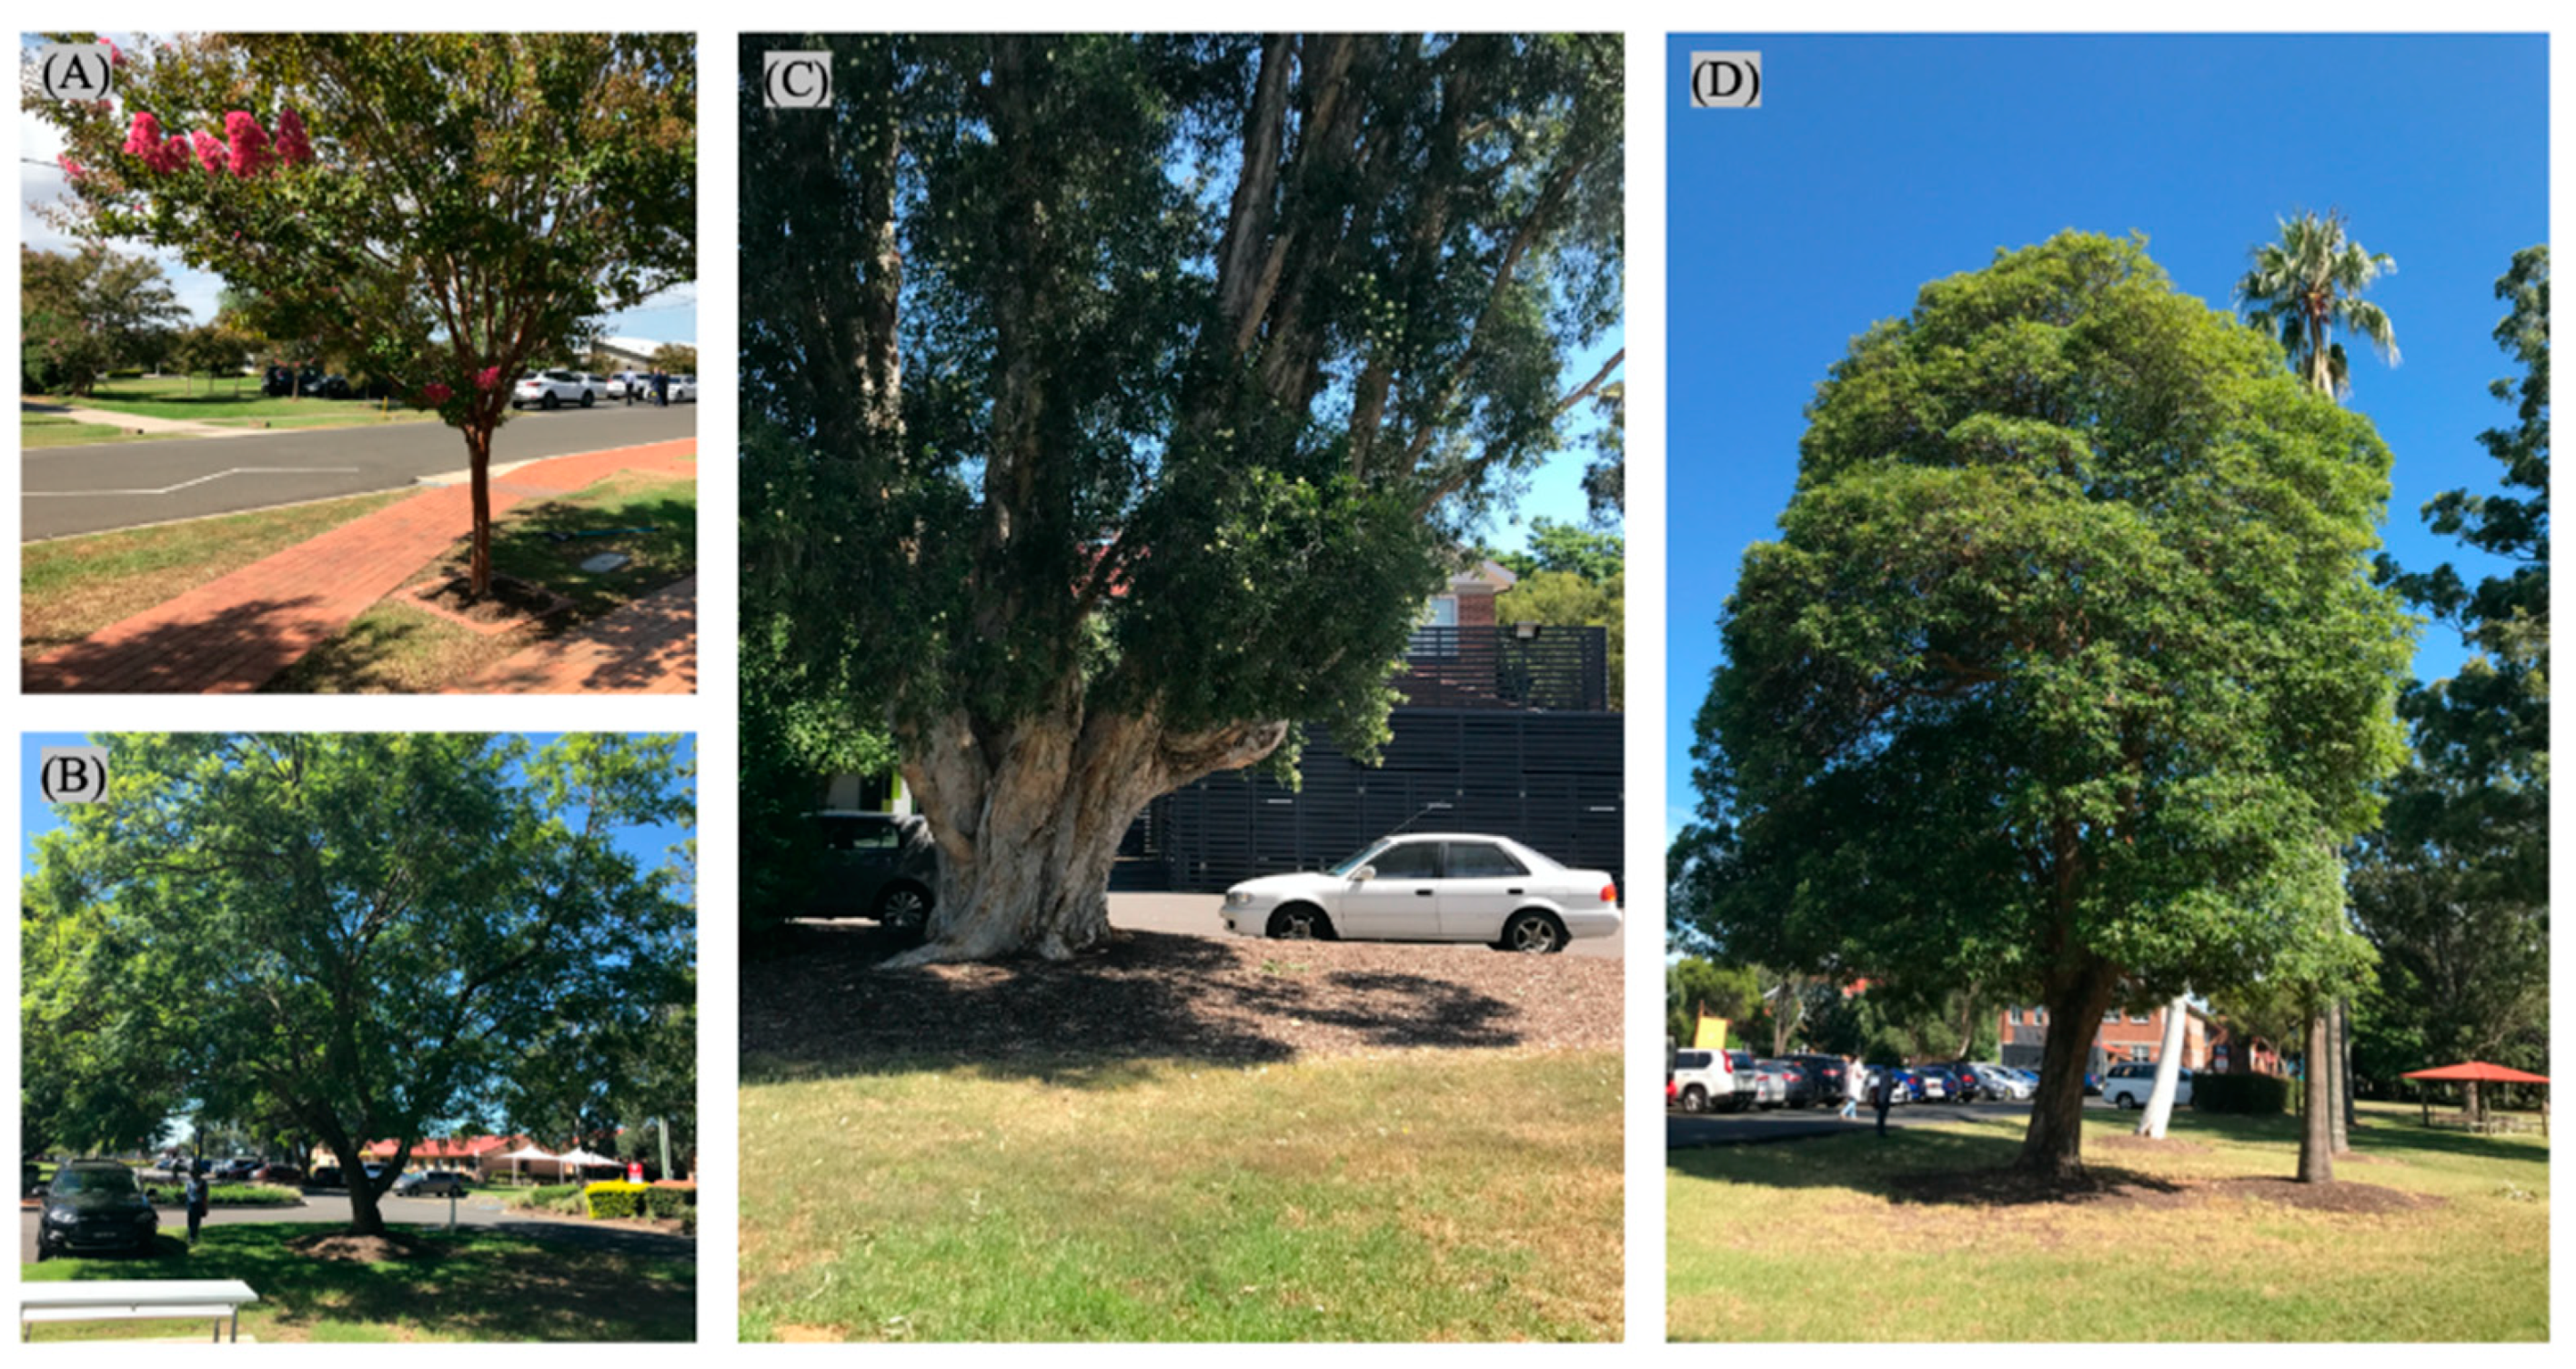
Figure 1. Examples of common tree species and surface types. (A) Crepe myrtle (Lagerstroemia L.) with brick pavers and grass in sunlight and shade. (B) Jacaranda (Jacaranda mimosifolia D.Don) with asphalt and grass in sunlight and shade. (C) Paperbark (Melaleuca quinquenervia (Cav.) S.T.Blake) with bark mulch in sunlight and shade. (D) Queensland box (Lophostemon confertus (R.Br.) Peter G.Wilson & J.T.Waterh.) with grass, bark mulch and asphalt in sunlight and shade.
Forests 11 01141 g001
Figure 2. Relationships between stem diameter at breast height (DBH) and total tree height (panel (A) and vertically projected crown area (AC; panel (B)) of 471 free-standing trees from 13 species growing in urban environments across greater Sydney, Australia. Dotted lines show best-fit functions (A: Tree height = 19.38 × DBH0.46; B: AC = 136.23 × DBH1.29). Coefficients of determination are shown.
Forests 11 01141 g002
Figure 3. Relationships between tree crown characteristics and surface cooling, calculated as differential between the surface temperature in the sun and shade of a given surface type (ΔTS). Panel (A): vertical crown projected area (AC) and surface temperature differential (ΔTS); panel (B): Leaf Area Index (LAI) and surface temperature differential (ΔTS). Data are shown for 471 individual trees from 13 species growing in urban environments across greater Sydney, Australia. Dotted lines show linear fits.
Forests 11 01141 g003
Figure 4. Distribution of the surface temperature differential (ΔTS; panel (A)) and Leaf Area Index (LAI; panel (B)) in each tree species. Distribution of LAI in each species is arranged from the highest mean LAI to the lowest mean LAI. The lower and upper line of the box shows the first and third quartile; the line and cross inside the box show the median and mean; the whiskers show minimum and maximum values.
Forests 11 01141 g004
Figure 5. Box whisker plot illustrates the distribution of surface temperature differential (ΔTS) in surface types: bare soil, bark mulch, bitumen, grass and pavers. Levels not connected by the same letter are significantly different. The lower and upper line of the box shows the first and third quartile; the line and cross inside the box show the median and mean; the whiskers show minimum and maximum values.
Forests 11 01141 g005
Table 1. Alphabetic list of tree species with their mean diameter at breast height (DBH), total height, vertical crown projected area (AC) and leaf area index (LAI). N denotes number of trees. Minimum and maximum values for DBH and height, as well as 1 Standard Deviation (SD) are shown.
SpeciesnMean DBH ± SD (m)Min /Max DBH (m)Mean Tree Height ± SD (m)Min/Max Tree Height (m)Mean AC ± SD (m2)Mean LAI ± SD (m2 m−2)
Camphor laurel480.72 ± 0.200.48/1.3113.3 ± 2.79.8/22.374.5 ± 26.31.9 ± 0.5
Casuarina equisetifolia580.45 ± 0.240.06/1.1214.0 ± 5.93.8/22.859.1 ± 39.61.7 ± 0.5
Corymbia citriodora150.31 ± 0.200.09/0.7011.0 ± 4.45.7/21.024.2 ± 10.30.9 ± 0.2
Eucalyptus saligna190.64 ± 0.220.38/1.3026.3 ± 4.317.8/35.392.3 ± 46.91.4 ± 0.3
Ficus macrocarpa480.26 ± 0.170.06/0.939.3 ± 4.44.1/21.029.6 ± 22.63.4 ± 0.5
Jacaranda mimosifolia400.51 ± 0.260.09/0.9613.5 ± 4.55.6/22.7499.5 ± 85.52.0 ± 0.6
Lagerstroemia550.12 ± 0.050.03/0.258.2 ± 2.83.9/13.512.9 ± 8.62.6 ± 0.4
Liquidambar styraciflua130.59 ± 0.300.10/1.1216.8 ± 5.75.6/27.995.5 ± 74.42.5 ± 0.3
Lophostemon confertus490.35 ± 0.330.04/1.2612.5 ± 6.94.6/28.036.1 ± 43.42.1 ± 0.4
Melaleuca quinquenervia190.84 ± 0.330.34/1.6017.1 ± 2.513.8/24.055.1 ± 23.42.1 ± 0.3
Platanus acerifolia170.52 ± 0.260.08/0.9716.8 ± 5.14.3/24.896.5 ± 44.52.8 ± 0.4
Pyrus calleryana460.19 ± 0.130.04/0.688.0 ± 2.24.5/13.317.8 ± 18.42.6 ± 0.8
Waterhousea floribunda440.13 ± 0.070.04/0.297.3 ± 1.84.0/12.29.4 ± 6.82.9 ± 0.5
Table 2. Mean, minimum and maximum shaded surface temperature (TSS), sunlit surface temperature (TSL) and surface temperature differential (ΔTS) recorded on bare soil, grass, bark mulch, concrete pavers and bitumen.
Surface TypesMean TSS ± SD (°C)Min /Max TSS (°C)Mean TSL ± SD (°C)Min/Max TSL (°C)Mean ΔTS ± SD (°C)Min/Max ΔTS (°C)
Bare soil33.0 ± 2.927.5/40.455.2 ± 5.944.8/69.9−22.1 ± 5.5−9.9/−34.3
Grass31.0 ± 2.722.5/40.249.4 ± 5.130.1/64.0−18.5 ± 4.8−6.3/−30.9
Bark mulch33.4 ± 3.127.6/42.558.2 ± 8.142.8/76.9−24.8 ± 7.1−8.2/−41.1
Pavers33.1 ± 4.820.4/54.750.1 ± 5.633.6/60.5−17.5 ± 6.0−7.0/−32.0
Bitumen 33.5 ± 4.225.9/44.954.5 ± 6.240.7/69.6−20.9 ± 5.8−8.6/−35.9
Table 3. Tukey’s HSD pairwise comparison of the surface temperature differential (ΔTS) and black globe temperature differential (ΔTG) observed among the five surface types: concrete pavers, grass, bitumen, bark mulch and bare soil.
PaversGrassBitumenBark MulchBare Soil
(a) Surface temperature differential (ΔTS)
Pavers 0.59170.2432<0.0001<0.0001
Grass0.5917 <0.0001<0.00010.0187
Bitumen0.2432<0.0001 <0.00010.8692
Bark mulch<0.0001<0.0001<0.0001 <0.0001
Bare soil<0.00010.01870.8692<0.0001
(b) Black globe temperature differential (ΔTG)
Pavers <0.0001<0.00010.0096<0.0001
Grass<0.0001 <0.0001<0.0001<0.0001
Bitumen<0.0001<0.0001 <0.00010.0166
Bark mulch0.0096<0.0001<0.0001 <0.0001
Bare soil<0.0001<0.00010.0166<0.0001
Table 4. Mean, minimum and maximum shaded globe temperature (GTS), sunlit globe temperature (GTSL), and globe temperature differential (ΔTG) recorded over bare soil, grass, bark mulch, concrete pavers and bitumen.
Surface TypesMean GTS ± SD (°C)Min /Max GTS (°C)Mean GTSL ± SD (°C)Min/Max GTSL (°C)Mean ΔTG ± SD (°C)Min/Max ΔTG (°C)
Bare soil34.4 ± 2.226.3/41.541.5 ± 2.233.4/48.6−7.2 ± 0.1−7.3/−7.0
Grass33.3 ± 3.225.3/43.136.5 ± 3.228.4/46.3−3.2 ± 0.1−3.4/−3.0
Bark mulch37.9 ± 2.832.2/43.048.8 ± 2.839.3/58.3−10.9 ± 0.3−10.3/−11.5
Pavers36.1 ± 2.429.6/39.640.4 ± 2.433.8/43.9−4.3 ± 0.1−4.3/−4.3
Bitumen 36.9 ± 2.233.4/44.546.1 ± 2.238.1/54.1−9.5 ± 0.2−10.5/−8.5
Publisher’s Note: MDPI stays neutral with regard to jurisdictional claims in published maps and institutional affiliations.