Article

Effects of Elevated Temperature and Ozone in Brassica juncea L.: Growth, Physiology, and ROS Accumulation

Department of Environmental Horticulture, University of Seoul, Seoul 02504, Korea
*
Author to whom correspondence should be addressed.
Forests 2020, 11(1), 68; https://doi.org/10.3390/f11010068
Submission received: 29 November 2019 / Revised: 26 December 2019 / Accepted: 3 January 2020 / Published: 6 January 2020
(This article belongs to the Special Issue Impacts of Ozone on Forest Plants and Ecosystems)

Abstract

:
Global warming and ozone (O3) pose serious threats to crop yield and ecosystem health. Although neither of these factors will act individually in reality, most studies have focused on the responses of plants to air pollution or climate change. Interactive effects of these remain poorly studied. Therefore, this study was conducted to assess the effects of optimal (22/20 °C day/night) and elevated temperature (27/25 °C) and/or ambient (10 ± 10 nL L−1) and elevated O3 concentrations (100 ± 10 nL L−1) on the growth, physiology, and reactive oxygen species (ROS) accumulation of leaf mustard (Brassica juncea L.). The aim was to examine whether elevated temperature increase the O3 damage due to increasing stomatal conductance, and thus, O3 flux into the leaf. Significant reductions in photosynthetic rates occurred under O (elevated O3 with optimal temperatures) and OT (elevated O3 and temperature) conditions compared to C (controls). Stomatal conductance was significantly higher under T than in the C at 7 DAE. Under OT conditions, O3 flux significantly increased compared to that in O conditions at 7 days after exposure (DAE). Significant reductions in total fresh and dry weight were observed under OT conditions compared to those under O. Furthermore, significant reductions in levels of carotenoids and ascorbic acid were observed under OT conditions compared to O. Lipid peroxidation and accumulation of ROS such as hydroxyl radical, hydrogen peroxide, and superoxide radical were higher under O and OT conditions than in C conditions at 7 and 14 DAE. As a result of O3 stress, the results of the present study indicated that the plant injury index significantly increased under OT compared to O conditions. This result suggested that elevated temperature (+5 °C) may enhance O3 damage to B. juncea by increasing stomatal conductance and O3 flux into leaves.

Graphical Abstract

1. Introduction

The fifth assessment report of the Intergovernmental Panel on Climate Change (IPCC) reported that human activities, such as rapid industrialization, urbanization, and increased vehicle traffic, are causing substantial climate change [1]. Climate change is recognized as an important threat to ecosystem health. Global warming and air pollution resulting from anthropogenic activities can cause especially severe damage to plants. Furthermore, ecosystem is highly sensitive to environmental characteristics [2]. The global average temperature is expected to increase by 1.5 °C to 4.8 °C within this century due to increasing greenhouse gas emissions by human activities, which will lead to greater global warming and associated problems for ecosystems [1].
Higher temperatures can increase plant growth, but temperatures much higher than a species’ ideal range will be detrimental to crops due to them actually limiting plant growth and development [3]. Higher temperatures may cause photosynthetic rate to decrease, but also conversely cause stomatal conductance and transpiration to increase. Therefore, increased temperature stress is usually associated with reduced water availability [4]. Decreased photosynthesis may be attributed to decreased activity of Rubisco and an enzyme involved in carbon fixation. Also, the functioning of photosystem II (PS II), located in the thylakoid membranes, is highly reduced or partly stopped under elevated temperature conditions because it is thermolabile [5]. Under elevated temperatures, plants produce various metabolites, including antioxidants and heat shock proteins (HSPs), by different pathways to deal with problems related to thermal stress [6]. For example, cell membrane fluidity is markedly increased by elevated temperatures, which results in solute leakage, the production of reactive oxygen species (ROS), and oxidative damage [7].
In addition to future global warming, the tropospheric ozone (O3) concentration is predicted to increase by 20% compared with present levels in the future since emissions of the precursors of O3 formation (e.g., NOx, CO, and VOCs) are constantly increasing [8]. The O3 concentration specially in East Asia has risen steeply due to anthropogenic gas emission from China’s rapid economic growth and industrial development. For instance, in Korea, the O3 concentration has doubled over the last three decades [9]. Furthermore, since the release of O3 and its precursors from China are predicted to increase in the future, the O3 concentration in Korea will also continue to rise [10]. The main chemical reaction involved in ozone formation is the photolysis of NO2, which produces nitrogen oxide (NO) and an oxygen atom (O). The O atom reacts with oxygen (O2) molecules in the atmosphere to form O3. In the other reaction, VOCs react with hydroxyl radicals (OH) to generate water vapor (H2O). The remaining organic radical (R-) combines with O2 to form a peroxyl radical (RO2), which can make NO2. The resulting nitrogen dioxide molecule can then undergo photolysis, forming ozone [11].
O3 has high phytotoxicity, and directly causes noticeable damage to plants. Exposure to increased O3 concentrations induces several plant responses at the physiological, biochemical, and morphological levels [12,13]. Elevated O3 exposure induces visible foliar symptoms, decreases photosynthesis, produces reductions in plant growth, and changes plant interactions with disease organisms [14]. Of especial concern is the fact that high ozone concentrations may impair physiological processes within plants, including photosynthesis. It is well-known that plants grown under high ozone concentrations feature decreased rates of CO2 assimilation. Due to these changes in net photosynthesis rates, the production of nonstructural carbohydrates, including sucrose and starch, also decreased [15]. O3 enters the leaf through the stomata, and then it rapidly causes damage to cell wall and plasma membrane by forming ROS [16]. ROS play critical roles as detrimental molecules that have adverse effects on proteins, DNA, and lipids. ROS accumulation also initiates signaling pathways in the plant in response to stress [17]. The responses of the plant against O3 involve the use of antioxidant systems to remove toxic compounds, mitigating cellular damage. Therefore, the weakening of antioxidative defense systems could increase the susceptibility of plant tissues to ozone exposure [18]. O3 injury on plants may cause visible foliar symptoms in plants. The occurrence of visible symptoms in leaves is an important tool for assessing the effects of ozone on vegetation [19]. Symptoms of ozone injury in the leaves include interveinal patches of light-green or whitish coloring, or bronzing, and reddening patterns. In broad-leaved trees, leaves mainly show interveinal bronzing, bleaching, and reddening symptoms [20].
Interactive effects of increased temperatures and O3 likely occur in natural environments, as neither of these nor other environmental factors act individually on plants there [21]. The responses of plants to combined environmental factors may cause changes in plants that are not predictable from the results of previous studies of single environmental factors [22]. Although many researchers have recently reported the effects of elevated O3 or temperatures on plants, the interactive effects of these are less studied. In the case of O3 and elevated temperature, stomata can be important since O3 enters the plant through the stomata and it has been suggested that elevated temperature may occur intensify O3 stress due to relation between stomata and temperature [23]. Additionally, leaf mustard is cultivated not only in greenhouses as a crop, but also grown in open fields as one of forest plants where they can be exposed to increased temperatures and ozone levels at the same time. Therefore, more attention needs to be paid to the effects of both of these environmental conditions on this plant, which is mainly grown as edible plant, also used for medicinal purposes. In this study, the individual and combined effects of elevated temperature and elevated O3 were studied on leaf mustard (Brassica juncea L.), which is usually grown in East Asia and one of the important species in forest ecosystem. The aims of the present study were to investigate the effects of optimal and elevated temperatures and/or ambient and elevated O3 concentrations on the growth, physiological, and biochemical characteristics of this plant. And, it was to observe whether elevated temperature increases O3 damage to this leaf vegetable due to higher O3 flux into leaves resulting from increasing stomatal conductance. It was hypothesized that: (i) Interactive effects of elevated temperature and elevated O3 adversely affect growth, physiological, and biochemical characteristics of leaf mustard; (ii) the negative effects of these factor increase with exposure duration; and (iii) elevated temperature aggravates O3 damage to Brassica juncea L. by increasing O3 uptake through increasing stomatal conductance and transpiration.

2. Materials and Methods

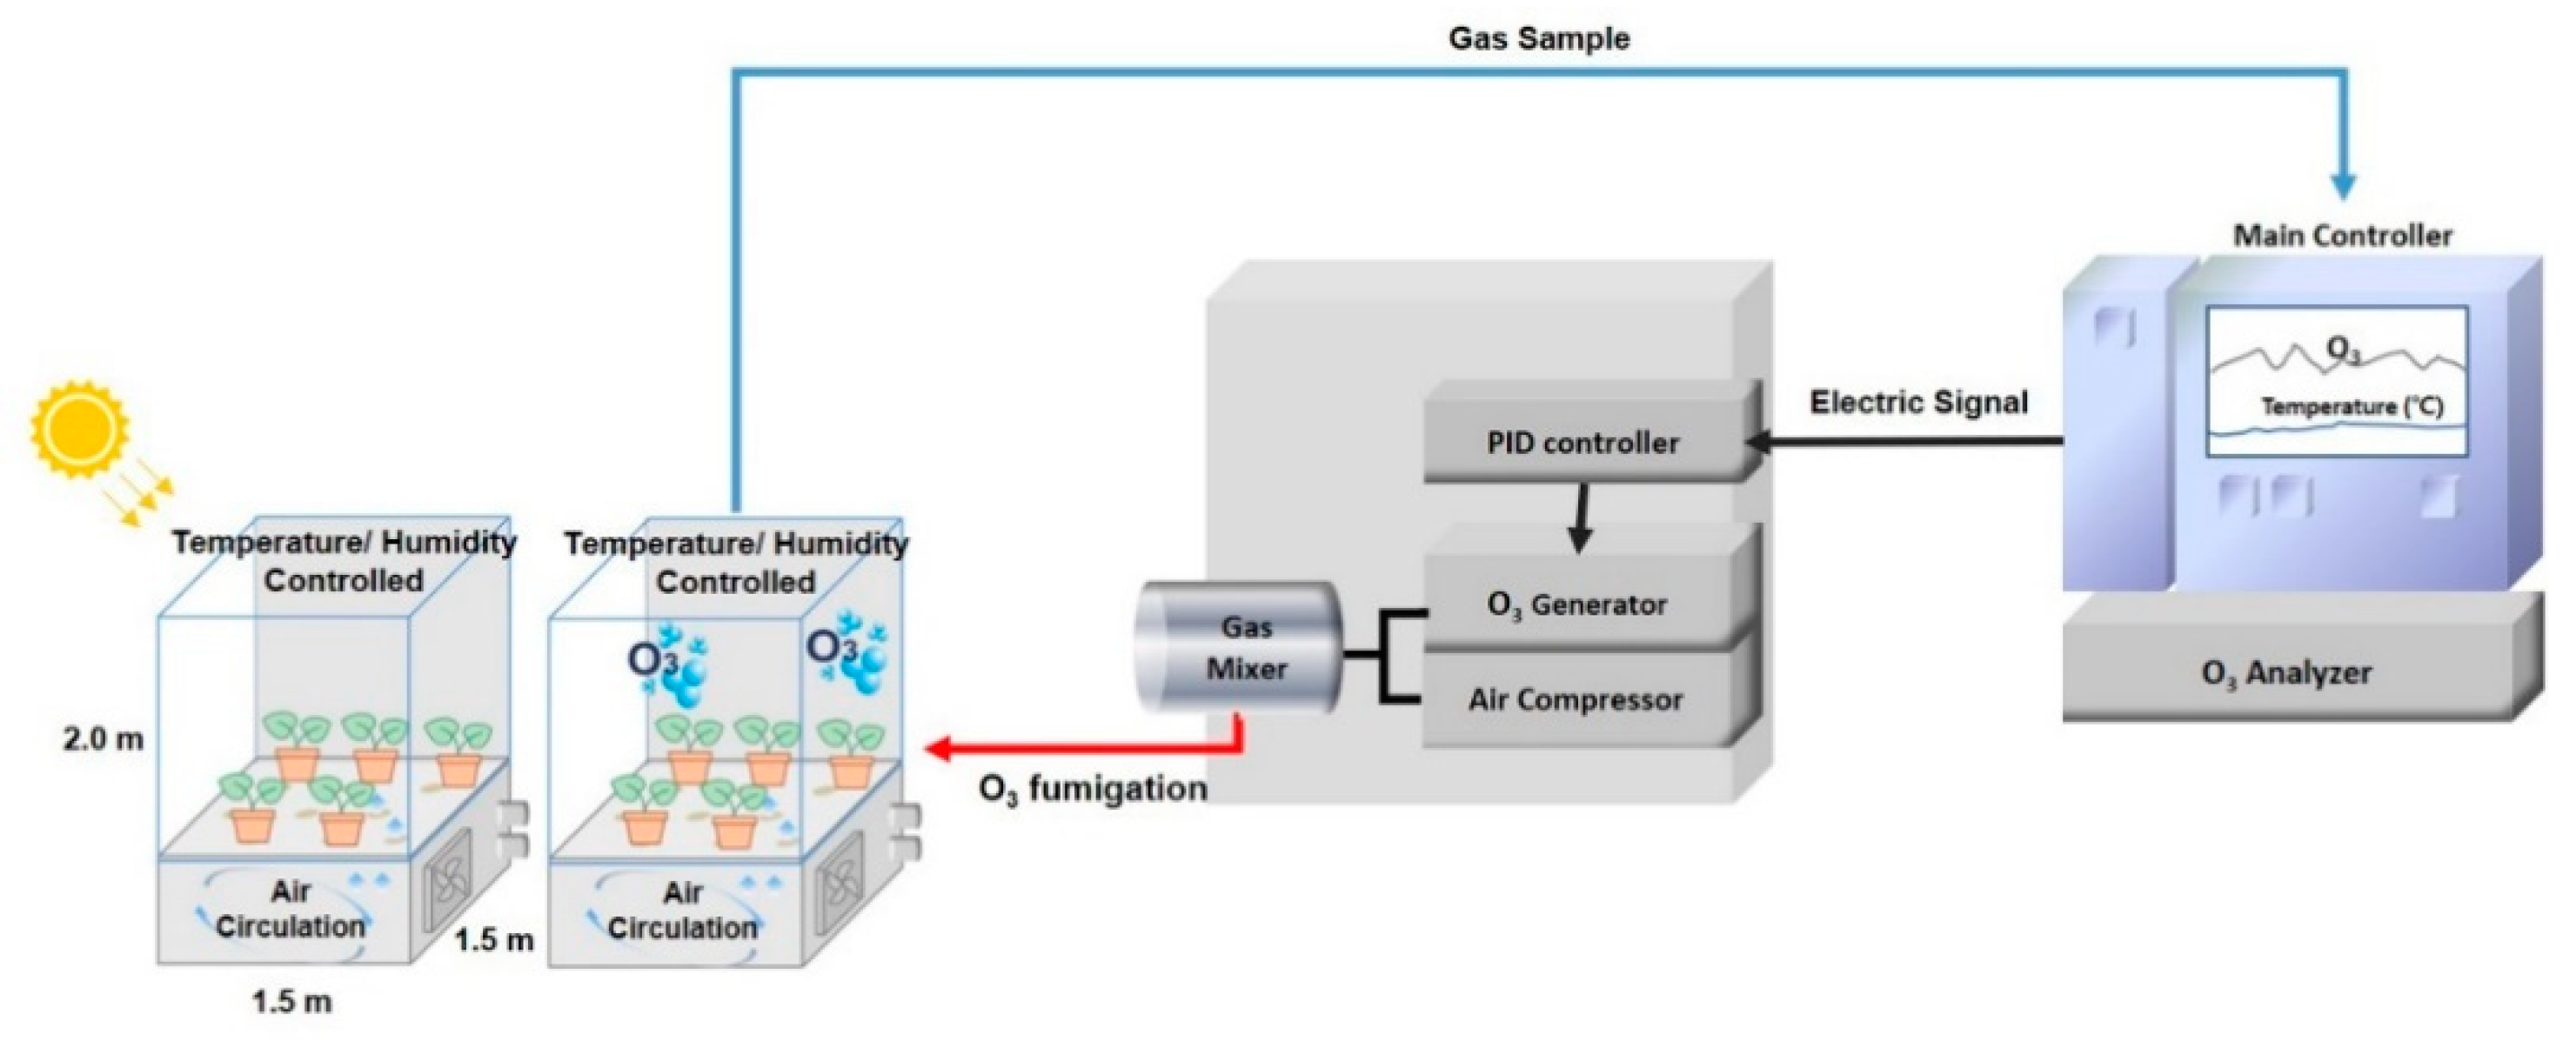
2.1. Plant Materials and Growth Conditions

Seedlings of leaf mustard (Brassica juncea L.), which is usually grown in East Asia, were used as test plants in this study. Plant culture was performed in a closed-type plant factory (temperature: 20 ± 2 °C; relative humidity: 60 ± 5%; light intensity: 200 ± 20 mol m−2 s−1; day length: 16 h) at the University of Seoul, Seoul, Korea (37°34′57.5′′ N, 127°03′39.1′′ E). The seedlings were cultivated for 2 weeks after germination and then transplanted into 3 L plastic pots filled with horticultural substrate including perlite, vermiculate and peat moss (Green Partner, Nongwoo Bio, Suwon, Korea). Before treatments began, the seedlings were pre-adapted to conditions of a phytotron growth chamber with sunlight for one week. All plants were watered well on a daily basis to avoid them having a water deficit. Their positions in the chamber were regularly changed after irrigation to prevent positional effects. For each test, 15 plants were kept in a control chamber, and another 15 were placed in a treatment chamber. Leaf sampling was performed two times, at 7 and 14 days after exposure (DAE) between 09.00 h and 12.00 h. For each group, fully expanded leaves were used for analyses of growth, physiology, and biochemistry. Samples were kept at −80 °C until analyses.

2.2. Experimental Treatments

The experiment was conducted by using a phytotron growth chamber (Growth chamber, Koito Industries, Yokohama, Japan) with an ozone generator (ON-1-2, Nippon Ozone Co., Tokyo, Japan) from March to April of 2018. Each chamber within the phytotron unit was 1.5 m wide, 1.5 m long, and 2.0 m in height. The temperature, relative humidity, and O3 concentration in each chamber could be accurately and precisely controlled. In the O3 control system, a photometric O3 analyzer (Model 400E, Teledyne instruments Inc., San Diego, CA, USA) was used to ensure that the intended O3 concentrations were maintained in the chambers, with O3 introduced as needed by connecting an O3 generator to the chamber via Teflon tubes (Figure 1).
Treatments were established 3 weeks after plant germination and were continued for 2 weeks. The treatments used were: (1) Ambient O3 (10 ± 10 nL L−1) + optimal temperatures (22/20 °C day/night) (i.e., control, C); (2) ambient O3 (10 ± 10 nL L−1) + elevated temperature (27/25 °C) (T); (3) elevated O3 (100 ± 10 nL L−1) + optimal temperatures (22/20 °C) (O); and (4) elevated O3 (100 ± 10 nL L−1) + elevated temperature (27/25 °C) (OT). The elevated O3 concentration used was chosen to match the hourly average maximum O3 concentration from March to July 2016 measured in South Korea [24]. The elevated temperature used were selected as those 5 °C above the optimal temperature range of leaf mustard. Elevated O3 conditions were applied to test plants for 8 h daily from 09.30 h to 17.30 h to adapt to the daylight period that O3 levels are often associated with, whereas elevated temperature and relative humidity were controlled for 24 h daily.

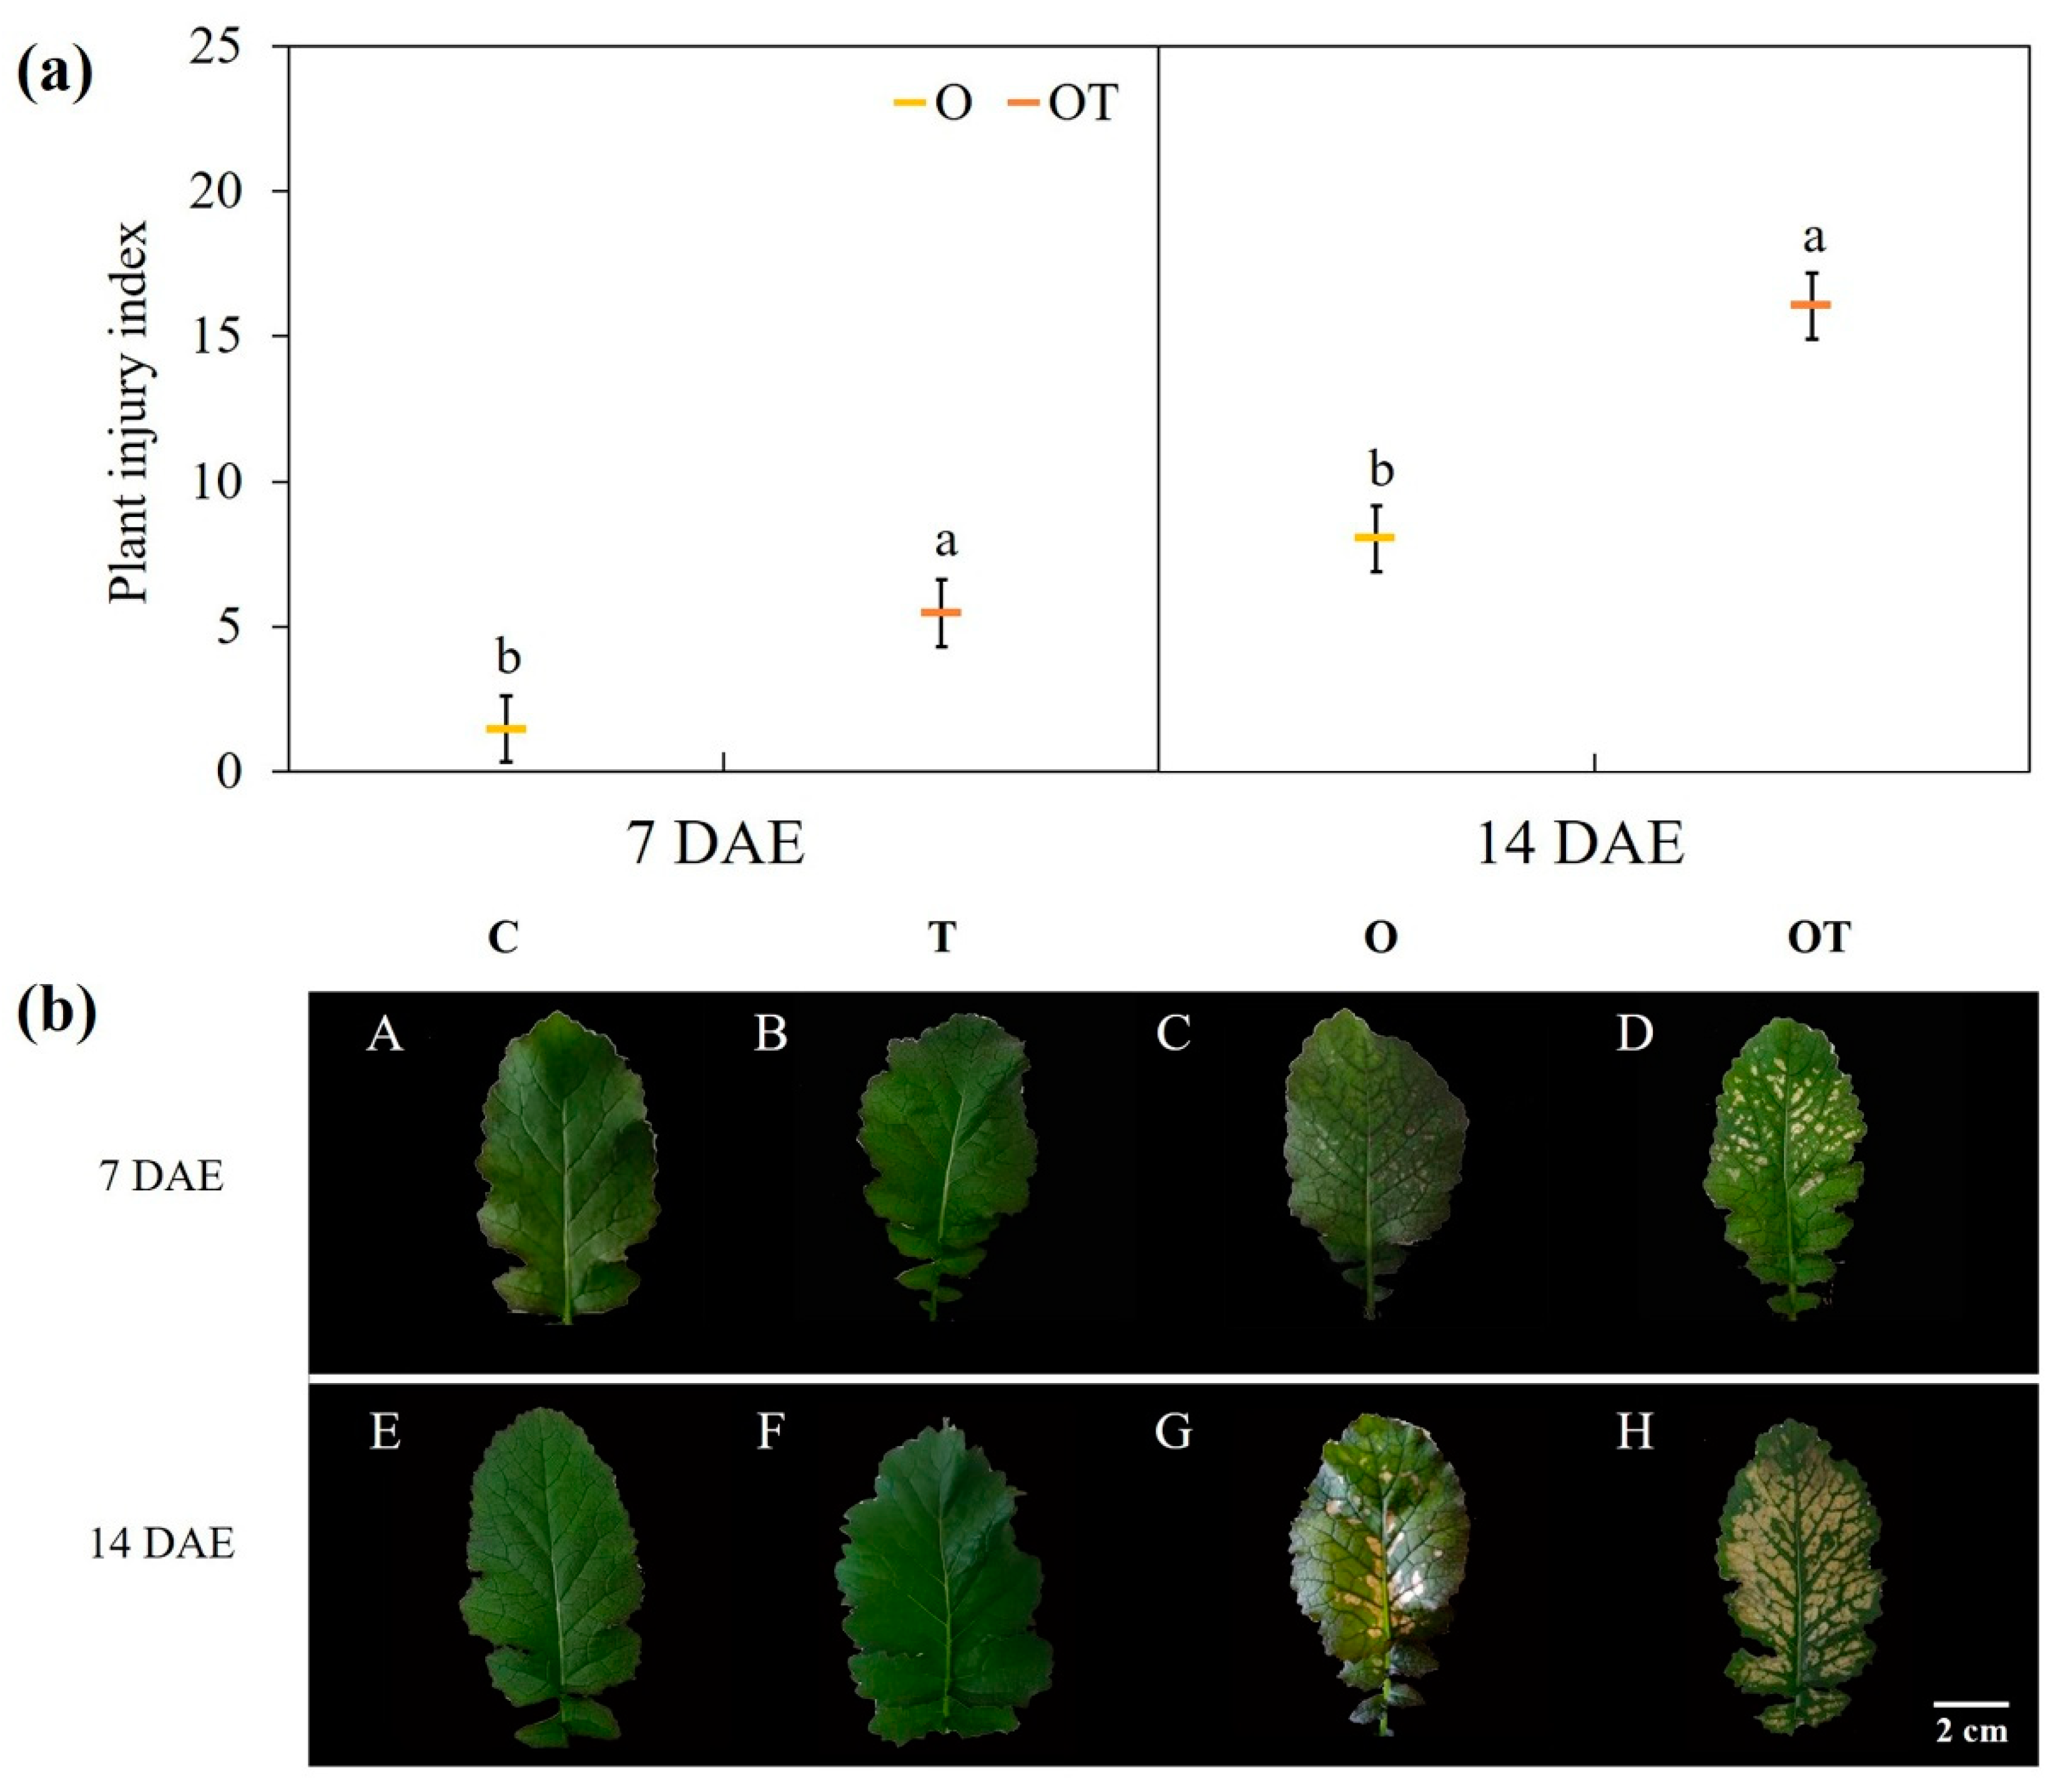
2.3. Plant Injury Indices

All plants in each treatment were examined daily to check for the occurrence and timing of the first visible symptoms of O3 damage. The severity of O3 injuries was quantified two times at 7 and 14 DAE. Visible ozone injury symptoms were quantified in terms of the percentage of leaves that were injured per each plant (LA) and the average percentage of the total area of the symptomatic leaves that showed injuries (AA) for each plant using the ICP Forests criteria [25]. A plant injury index to quantify the extent of visible ozone damage symptoms was calculated by combining the two measurements mentioned above using the following formula from [26].
Plant   injury   index   =   ( LA × AA ) / 100

2.4. Measurement of Gas Exchange Parameters and Calculation of Ozone Flux

Measurements of leaf gas exchange parameters (net photosynthetic rate (Anet), stomatal conductance (gs), intercellular CO2 concentration (Ci), and transpiration rate (E)) were made at 7 and 14 DAE between 09.00 h and 12.00 h. Water use efficiency (WUE) was calculated by the relationship as the ratio between net photosynthetic rate and transpiration rate (Anet/E). The second to fourth fully developed leaves of five replicate plants were measured using a portable photosynthesis measurement system (Li-6400 XT, LI-COR Inc., Lincoln, NE, USA) with an LED light source chamber (6400-02B, LI-COR Inc., Lincoln, NE, USA) [27]. During these measurements, the CO2 concentration was maintained at 400 μmol mol−1 under a block temperature held at 25 °C and a relative humidity (RH) between 50% and 60%. Average photosynthetically active radiation (PAR) was fixed at a near-saturation light intensity of 1000 μmol m−2 s−1. The air flow rate was held constant at 500 μmol s−1. Each leaf gas exchange parameter was allowed to stabilize for at least 5 min.
Ozone fluxes into leaves were estimated using the method of [28] with the formula below:
O 3   flux   =   g O 3   ( [ O 3 ] a     [ O 3 ] l )
where g O 3 is the rate of the rate of O3 flux into the leaf, [O3]a is O3 concentration in ambient air and [O3]l is O3 concentration in the leaf interior. The value of g O 3 was determined by dividing the stomatal conductance by the ratio of the binary diffusivities of water vapor and O3 in air (1.68). [O3]a was estimated as the bulk air concentration of O3 when measuring the conductance of water vapor. [O3]l was set to zero according to the findings of [16]. In practice, it was reported that O3 concentration in the leaf interior is higher than zero under intense O3 exposure by [29]. However, we did not consider this assumption because intercellular O3 concentration was unknown and typically small compared to those in chamber. In this method, O3 flux was simply estimated as a measurement of the severity of O3 stress on plants [30].

2.5. Measurement of Carotenoids and Ascorbic Acid

Carotenoids were extracted from 0.1 g of fresh leaf placed in 10 mL 80% (v/v) acetone for 14 days at 4 °C. The carotenoids content of the extract was quantified through measuring its absorbance (A) at 663 nm, 645 nm, and 470 nm using a microplate reader (Epoch microplate Spectrophotometer, Synergy-Bio Tek, Winooski, VT, USA). The content of carotenoids was calculated according to the method of [31].
Carotenoid (mg g−1 FW) = [A470 + (0.114(A663) − (0.638-A645)] × V/100 × W
where A470 is absorbance at 470 nm, A663 is absorbance at 663 nm, A645 is absorbance at 645 nm, V is sample volume (mL) and W is weight of fresh leaf (g).
The amount of ascorbic acid in the leaf was estimated using a method based on the reduction of 2,6–dichlorophenol indophenol (DCPIP) reported by [32]. In this method, 0.1 g fresh weight of sample was homogenized in 1.5 mL of ice-cold extraction solution (0.5% oxalic acid). After centrifugation at 10,000 rpm for 15 min, 0.2 mL of the supernatant was then added to 1 mL of DCPIP (20 μg/mL) with constant shaking. The absorbance of the pink color obtained was measured at 520 nm. The pink color was then bleached by adding a drop of 10 μL of 1% ascorbic acid and absorbance was measured at 520 nm again. The difference between the two measurements was used to quantify the content of ascorbic acid.
Ascorbic   acid   ( mg   g 1   FW )   =   ( E O     E s     E t )   ×   V W   ×   100 × 100
where EO is optical density of a blank sample, Es is optical density of plant sample, Et is optical density of sample with ascorbic acid, V is sample volume (mL) and W is weight of fresh leaf (g).

2.6. Measurement of Lipid Peroxidation and Reactive Oxygen Species

Lipid peroxidation was measured following the protocol of [33]. After 0.1 g of leaf sample was ground up and mixed with liquid nitrogen, the sample was homogenized in 1 mL of 0.1% (w/v) trichloroacetic acid (TCA), followed by centrifugation at 10,000 rpm for 10 min. Of the resulting supernatant, 0.5 mL of the resulting supernatant was added to 1.5 mL of 20% TCA containing 0.5% (w/v) thiobarbituric acid (TBA), and then the mixture was boiled in a water bath at 95 °C for 15 min. After cooling it on ice, the mixture was again centrifugated at 10,000 rpm for 10 min. The absorbance (A) of the supernatant was measured at 532 nm, and the values corresponding to 600 nm using a microplate reader were subtracted. Lipid peroxidation was quantified in terms of malondialdehyde (MDA) content, which was determined using the Lambert–Beer law with an extinction coefficient of 155 mM−1cm−1:
MDA   ( nmol   g 1   FW )   =   ( ( A 532   A 600 ) / 155,000 )   × 10 6
where A532 is absorbance at 532 nm and A600 is absorbance at 600 nm.
The hydrogen peroxide (H2O2) content of leaf samples was quantified using the methods of [34]. In these methods, the extract of a 0.1 g leaf sample frozen in liquid nitrogen was obtained through extraction in 1 mL of 0.1% TCA, and then centrifugated at 12,000 rpm for 15 min. Then, 0.5 mL of the supernatant was homogenized in 0.5 mL of 100 mM potassium phosphate buffer (pH 7.8) and 1 mL of 1 M potassium iodide (KI). After keeping the mixture in the dark for one hour, its absorbance at 390 nm was measured. Quantification of H2O2 content was then made using a standard curve.
Determination of superoxide anion radical (O2) content was carried out by using a modified version of the methods of [35]. The superoxide anion radical (O2) content in samples was quantified based on its ability to reduce nitro blue tetrazolium (NBT). To do this, 0.1 g of leaf sample ground up in liquid nitrogen was added into 1.5 mL of a reaction mixture of 10 mM potassium phosphate buffer (pH 7.8), 0.05% NBT, and 10 mM sodium azide (NaN3). After 20 min of incubation at room temperature, the 0.5 mL of reaction solution was heated in a water bath at 85 °C for 15 min and then rapidly cooled. The content of O2 was determined as the resultant absorbance at 580 nm per 1 g of fresh weight (A580 g−1 FW).
Hydroxy radical (OH) levels in the leaf were measured using the methods of [36], with minor modifications. In these, 0.1 g of leaf sample ground up in liquid nitrogen was homogenized with 1 mL of 50 mM sodium phosphate buffer (pH 7), and then centrifugated at 12,000 rpm for 10 min at 4 °C. After centrifugation, 0.5 mL of the supernatant was mixed with 1 mL of 1 mM 2-deoxyribose. The reaction was performed at room temperature in the dark for 45 min. Subsequently, 0.5 mL of the solution was added to 1 mL of 1% (w/v) TBA in 2.8% (w/v) TCA. After that, the solution was immediately boiled for 10 min. Finally, samples were cooled on ice for 10 min. The level of OH was quantified based on the absorbance at 540 nm, and was expressed as absorbance at 540 nm per 1 g of fresh weight (A540 g−1 FW).

2.7. Measurement of Growth Characteristics

All plants in each chamber were harvested at 14 DAE. Five plants per treatment were randomly selected for taking growth measurements. Leaf area was determined in three fully expanded leaves using winFolia image software (winFolia, Regent Instruments Inc., Sainte-Foy, QC, Canada). To measure the fresh weights of above- and belowground plant parts, soil particles were flushed out from the plants’ root. Then, all plant parts were dried separately for 48 h at 60 °C to determine their dry weights. Specific leaf area (SLA) was calculated based on the leaf area and dry weight of each leaf following [37].

2.8. Statistical Analyses

The experiment was set up as a randomized block design with five replicates per block and treatment. The individual and interactive effects of elevated O3, temperature, and sampling date on mean growth, physiological, and biochemical characteristics of B. juncea were analyzed through two-way or three-way analyses of variance (ANOVAs). Tukey’s HSD (p ≤ 0.05) was performed as a post hoc test to investigate significant differences among levels of different factors on the parameters tested. For each parameter, the statistical significance of 7 and 14 DAE differences under different treatment was analyzed using the independent t-test. All analyses were performed using SPSS Statistics 25 software (SPSS Inc., Chicago, IL, USA).

3. Results

3.1. Plant Injury Indices

The first visible symptoms of O3 damage, such as necrosis and chlorosis, were observed on the surfaces of the leaves of plants under the OT treatment at 3 DAE, and under the O these first appeared at 5 DAE. Plants grown under C and T did not show any visible injury symptoms (Figure 2b). Plant injury indices at 7 DAE were 1.47 and 5.46 under the O and OT, respectively. At 14 DAE, this index had increased by about 3 times in the OT (Figure 2a). The plant injury index of leaves was significantly lower in the O than in the OT at both 7 and 14 DAE. The plant injury index increased more sharply under OT than in the O.

3.2. Growth Characteristics

The total fresh and dry weights of plants were significantly decreased under the T (by 29.3% and 20.7%, respectively), O (by 42.9% and 49.04%), and OT (by 58.6% and 61.8%) compared to those in C (Table 1). Root dry weight significantly decreased by 40.1% under T, 61.3% under O, and 81.3% under OT compared to that in C, whereas shoot dry weight was not significantly reduced under T compared to C. Significant reductions in root dry weights were observed under O and T, however (by 41.8% and 47.6%, respectively). Shoot:root ratios (SRR) significantly increased under OT compared to those under T (79.1%) (Table 1). However, significant increases were not observed in SRR under T and O compared to C. The two-way ANOVAs showed that differences in fresh and dry weight were significant between individual main factors, whereas their interactions only had a significant effect on total fresh weight but not dry weight (Table S1). Specific leaf area (SLA) significantly increased under O and OT compared to C. Increases in SLA relative to C were 14.4%, 30%, and 35.2% in the T, O, and OT, respectively (Table 1). Significant differences in SLA were not observed between the O and T. Elevated temperature significantly affected SLA, and SLA was also strongly affected by elevated O3. However, the interaction between temperature and O3 did not significantly affect SLA (Table S1).

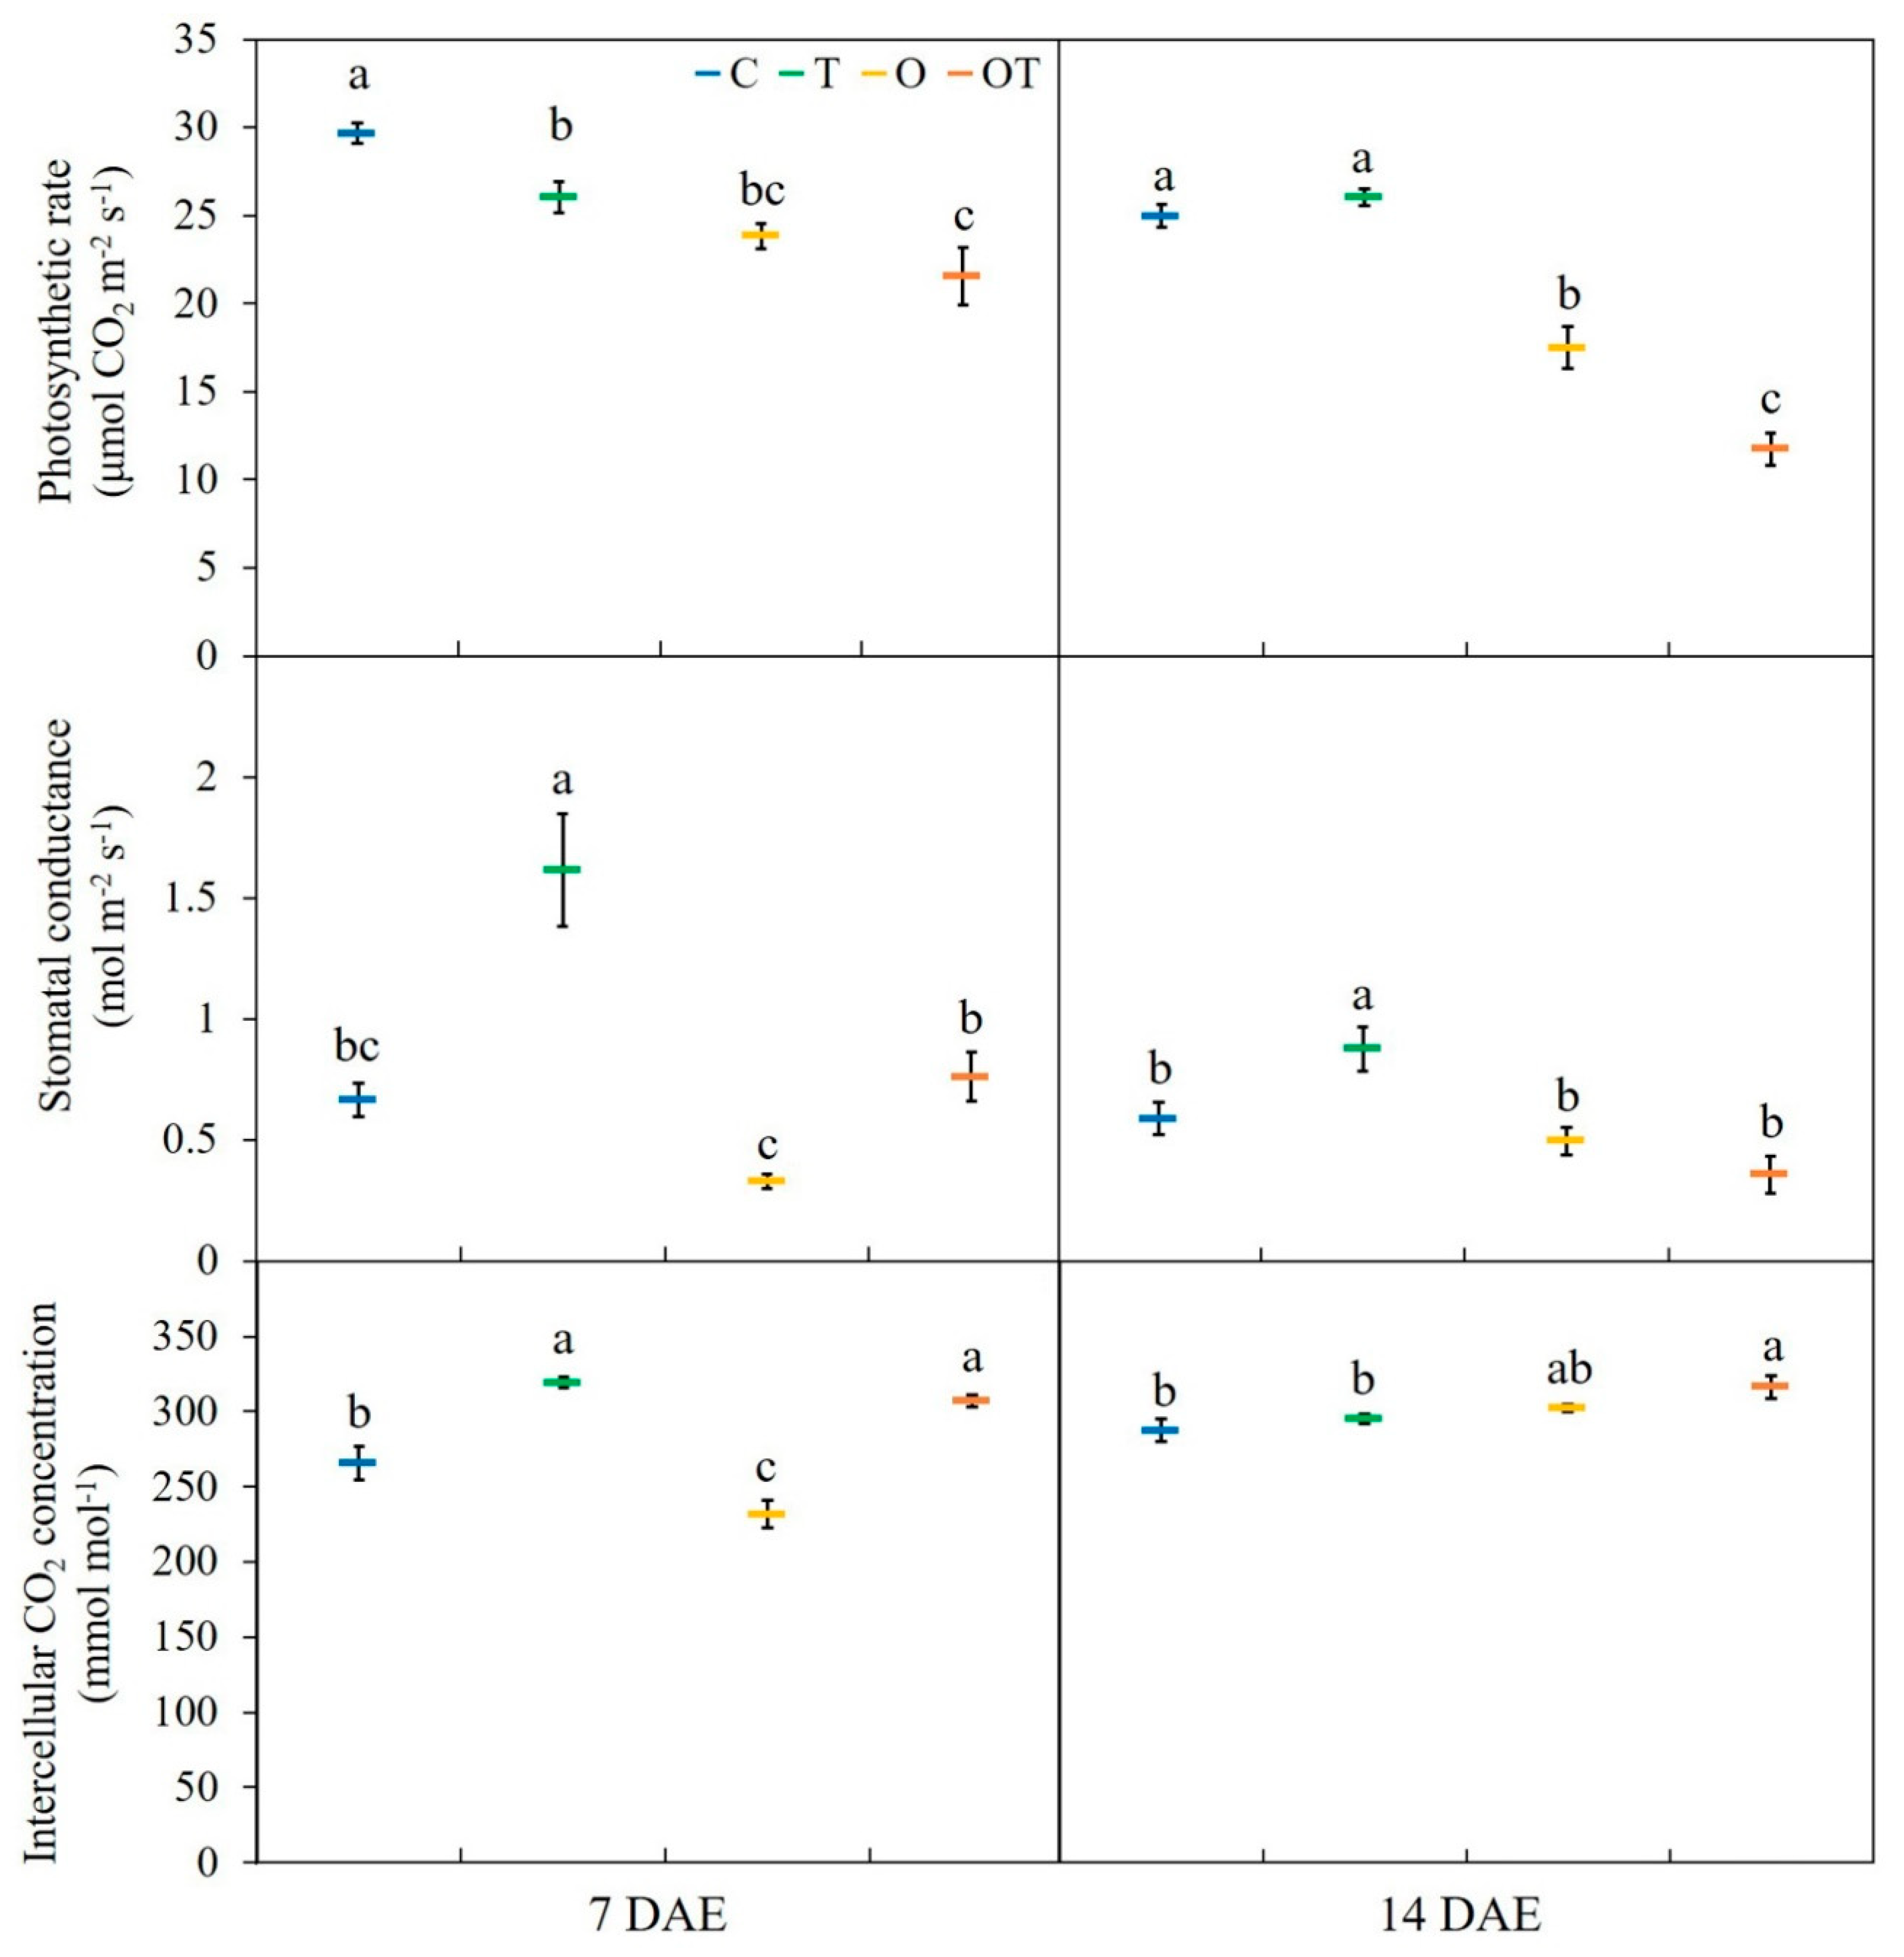
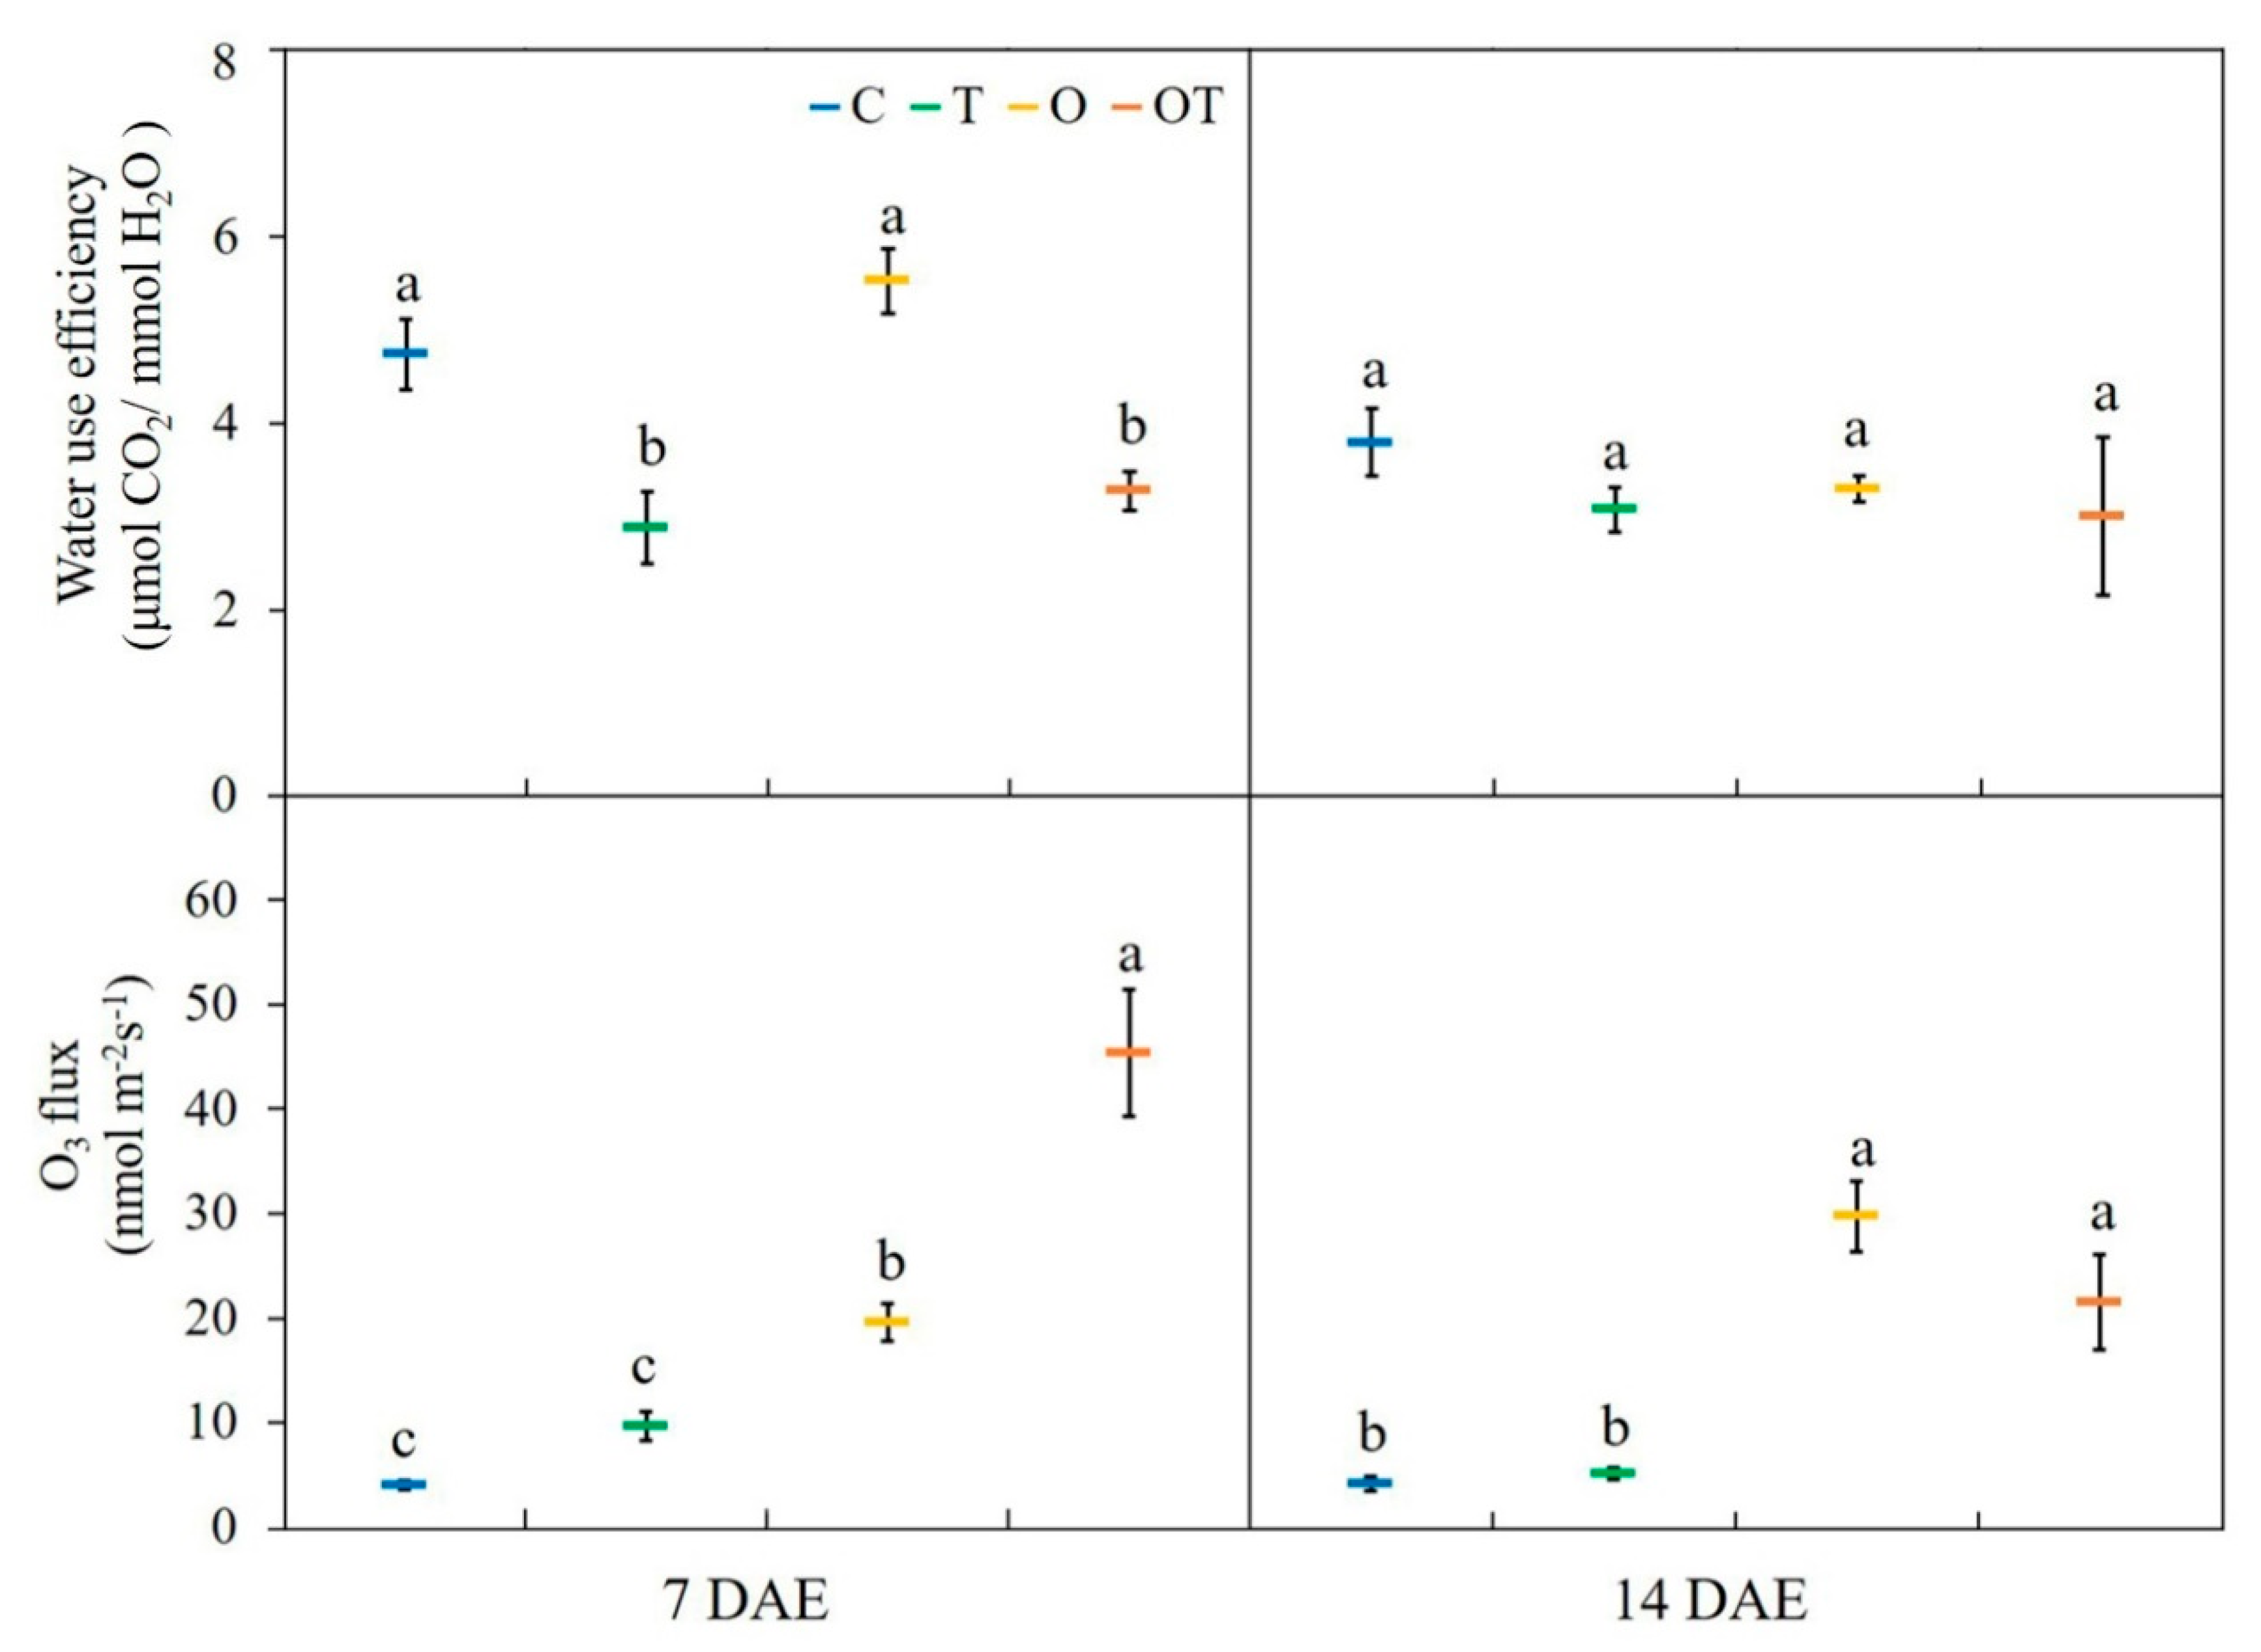
3.3. Gas Exchange Characteristics and O3 Flux

Photosynthesis rates (Anet) significantly decreased under O (19.7%), and OT (27.4%) compared to those in C at 7 DAE, and were also significantly reduced under O (29.9%) and OT (52.9%) compared to C at 14 DAE; however, elevated temperature did not significantly affect the photosynthesis rate of B. juncea relative to controls at 7 and 14 DAE (Figure 3). The three-way ANOVA indicated that differences in Anet were due to significant effects of all the individual factors and their interactions, except for the temperature × O3 and temperature × date interactions (Table S1). Stomatal conductance (gs) was significantly higher by 58.4% under T than in the C at 7 DAE. Stomatal conductance of plants in the OT treatment was also higher than that in the C at 7 DAE. At 14 DAE, there were no significant differences among treatments (Figure 3). The three-way ANOVA showed that gs was significantly affected by all of the individual factors and their interactions, except for the O3 × sampling date and temperature × O3 × sampling date interactions (Table S1). Intercellular CO2 concentrations (Ci) were significantly increased under T (15.2%) and OT (13.1%), whereas those of plants grown under O showed significant reductions of 12.9% compared to C at 7 DAE. At 14 DAE, concentrations had significantly increased under OT (9.8%) compared to those at C (Figure 3). Ci was significantly impacted by the individual effects of elevated temperature and sampling date. The interactions between temperature × sampling date and O3 × sampling date also significantly impacted Ci (Table S1). Plants grown under T had transpiration rates (E) that were significantly greater than those of C by 34.0 at 7 DAE (Figure S1). E was significantly affected by elevated temperature, as well as by elevated O3 (Table S1). Water use efficiency (WUE) significantly decreased under T (34.4%) and OT (30.8%) compared to C at 7 DAE (Figure 4). However, significant changes were not observed among all treatments at 14 DAE. WUE was significantly affected by elevated temperature and sampling date (Table S1). Estimates of ozone flux into the leaf underwent large and significant increases under O (79.8 and 85.6%) and OT (91.2 and 80.1%) compared to controls at 7 and 14 DAE, respectively. O3 flux into plants grown under OT was significantly higher by 56.7% than that for plants in the O at 7 DAE. In contrast, the flux into plants in the T was 27.4% higher than that for plants under OT at 14 DAE (Figure 4). Differences in O3 flux were highly significant as a result of elevated O3, and were also affected significantly by elevated temperature, sampling date, and the interactions among all factors (Table S1).

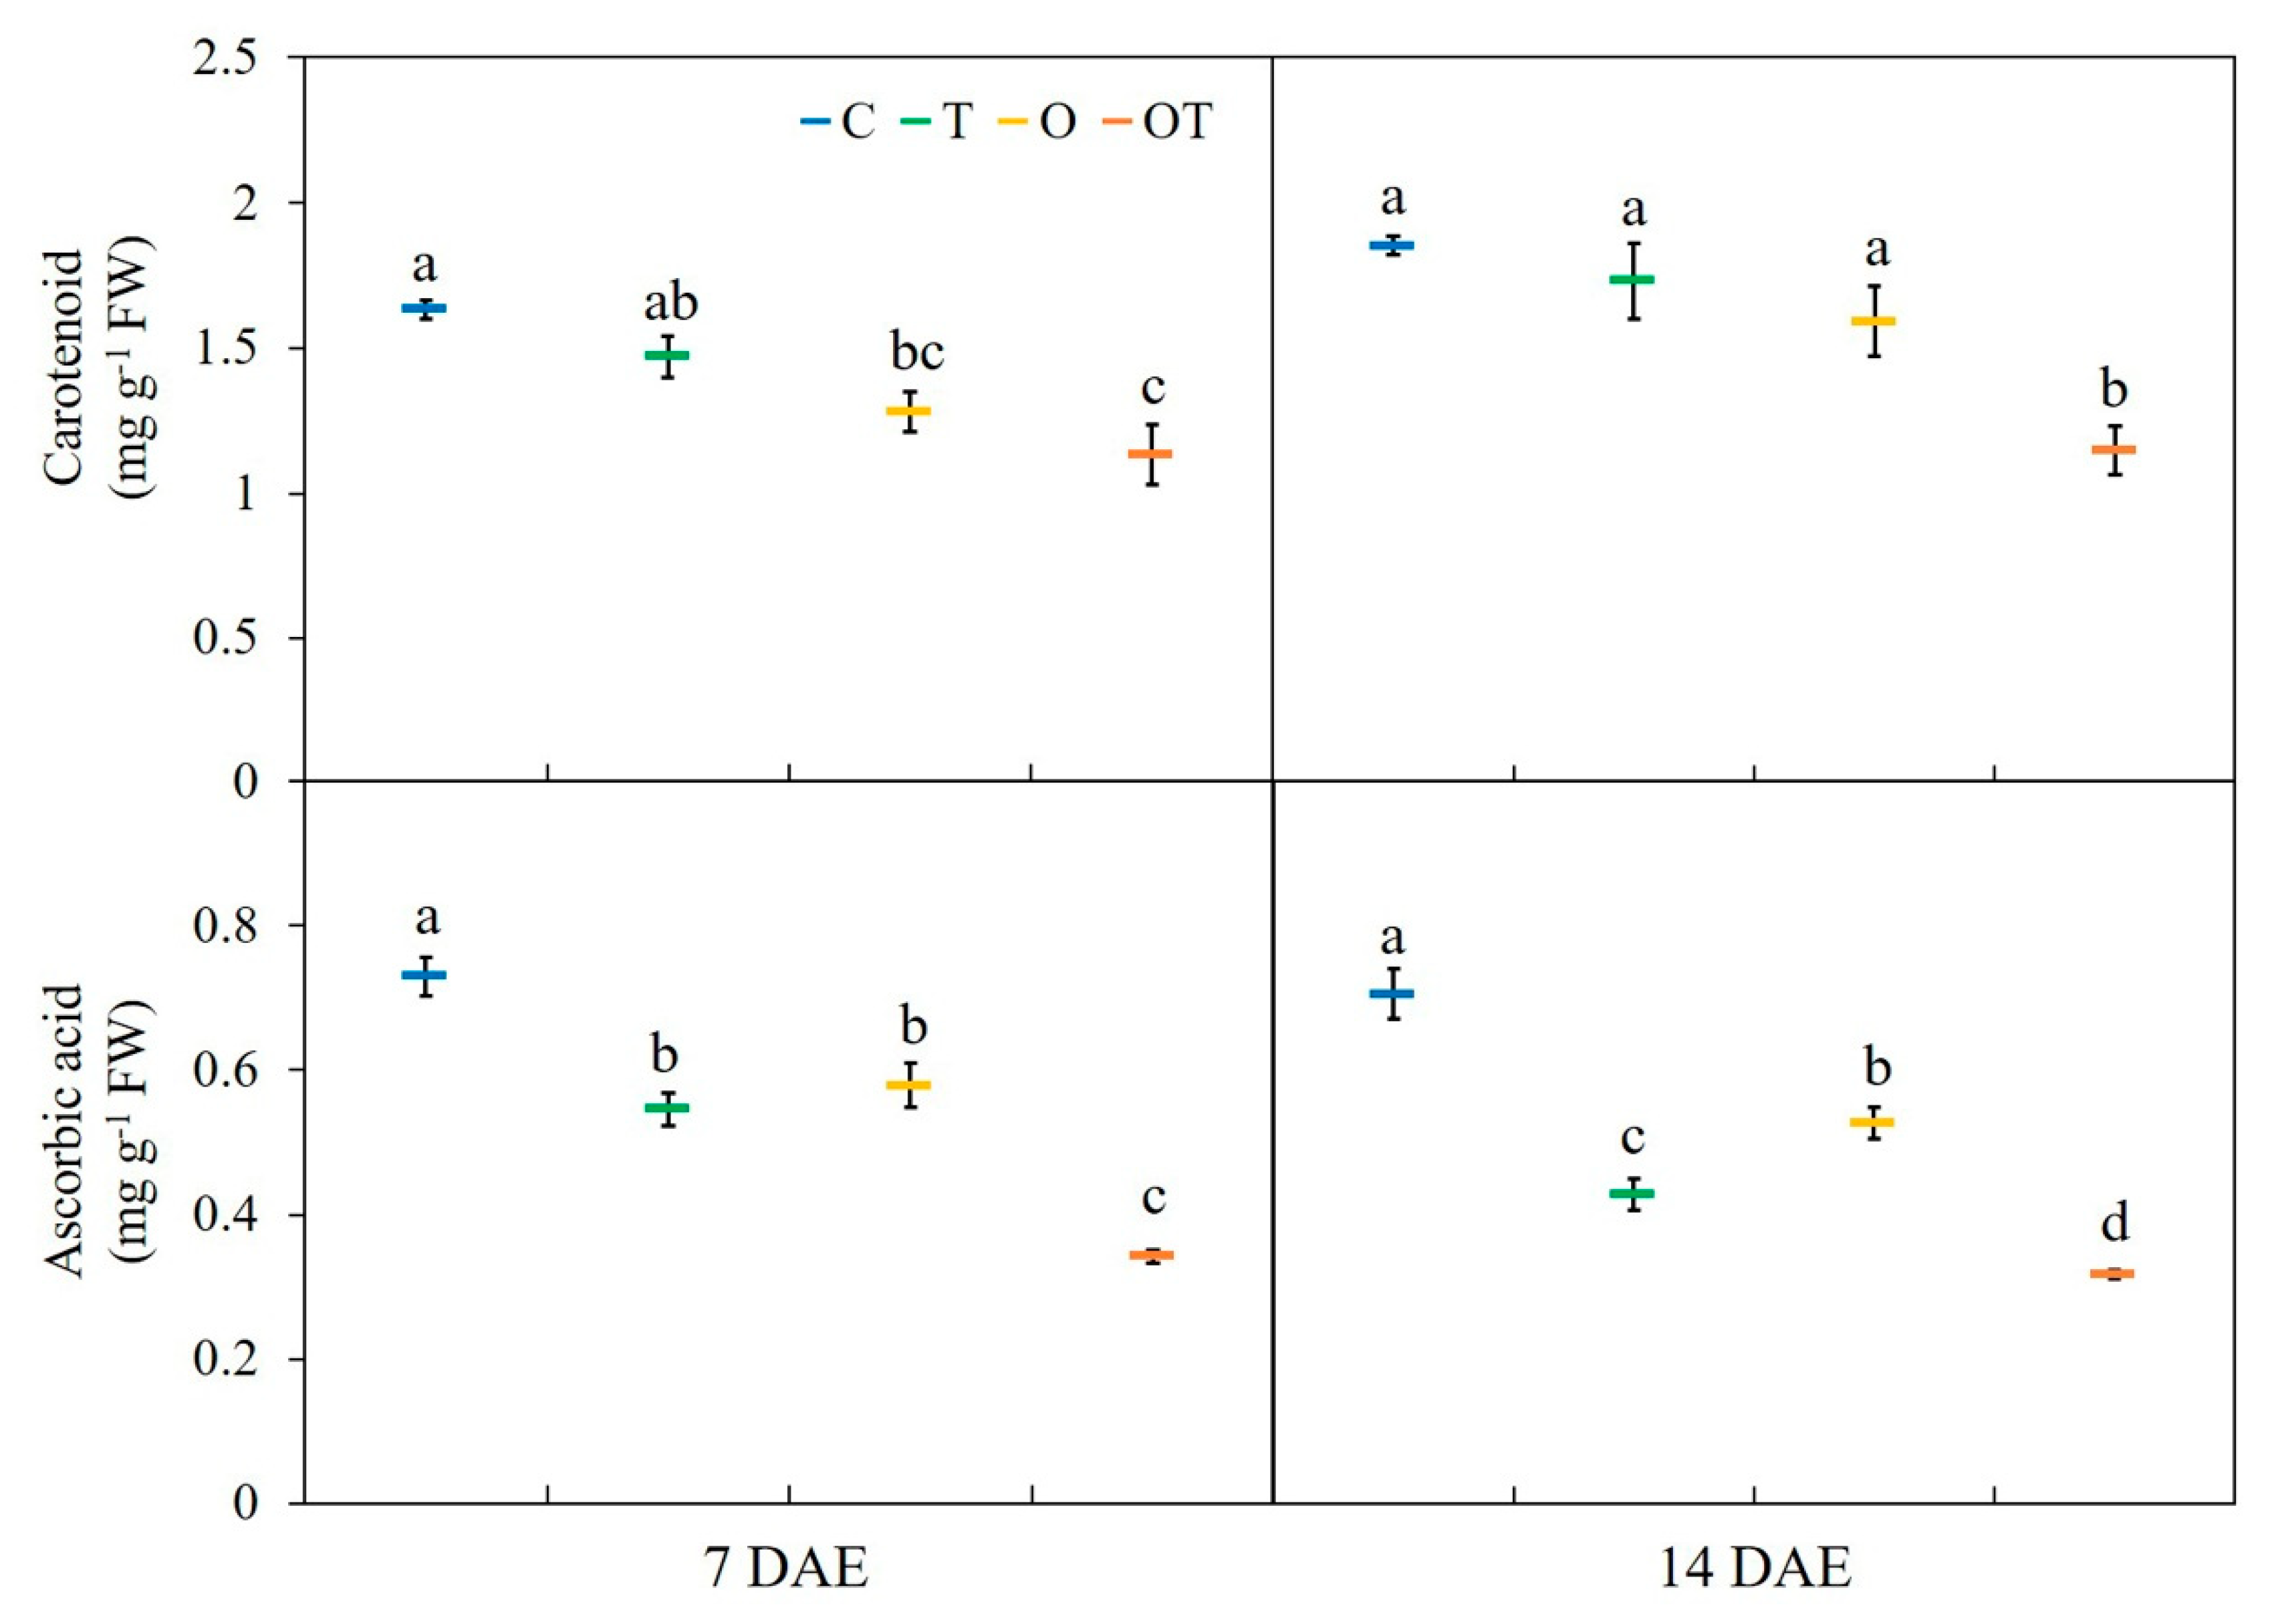
3.4. Carotenoid and Ascorbic Acid Contents

Carotenoid content was significantly lower in O and OT (by 27.34% and 44%, respectively) treatments than in the C treatment at 7 DAE, whereas the carotenoid content of plants under OT conditions only was significantly decreased (by 24.9%) compared to C at 14 DAE (Figure 5). There was no significant change in this content under T conditions relative to C at 7 or 14 DAE. Ascorbic acid was significantly decreased under T (25% and 39%), O (21% and 34%), and OT (53% and 55%) conditions compared to C at both 7 and 14 DAE, respectively. There were also significant differences between the O and OT treatments at both 7 and 14 DAE (Figure 5). According to three-way ANOVAs, elevated temperature, O3, and sampling date all individually affected carotenoid and ascorbic acid content of plants, while all interactions among factors did not significantly affect changes in these parameters (Table S1).

3.5. Lipid Peroxidation and Reactive Oxygen Species (ROS) Accumulation
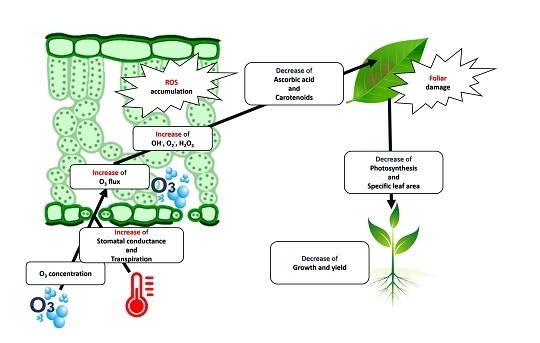
Overall, lipid peroxidation was significantly increased under O (86% and 56%), and OT (90% and 63%) conditions compared to C at 7 and 14 DAE, respectively. There was no significant difference between C and T, or between O and OT conditions, at 14 DAE (Figure 6). The three-way ANOVA indicated that variations in lipid peroxidation due to all individual factors were highly significant, while all of their interactions did not significantly affect this parameter (Table S1). In terms of hydroxyl radical (OH) accumulation, significant increases of 33.3% compared to C were found under OT conditions, respectively, at 7 DAE. Similarly, that in OT (50.5%) treatments was higher than in C at 14 DAE. No significant difference between the O and OT treatment was observed at either 7 or 14 DAE (Figure 6). Changes in OH as a result of elevated O3 and sampling date were significant. Elevated temperature did not affect variations in OH according to the three-way ANOVA results (Table S1). The hydrogen peroxide (H2O2) content of plants significantly increased under T, O, and OT (47.1%, 61.4%, and 72.3% respectively) conditions compared to C at 7 DAE. At 14 DAE, that of plants in the O and OT (50.9% and 53.8%) treatments was significantly higher than in C. However, there was no significant difference between O and OT treatments at 14 DAE. The superoxide radical (O2) content of plants in O (67% and 65.8%) and OT (63% and 72.9%) treatments was significantly higher than that in C plants at 7 and 14 DAE, respectively. There was no significant difference between C and T treatments, nor between the O and OT treatments, at either 7 or 14 DAE (Figure 6). Changes in H2O2 and O2 content as a result of elevated O3 were highly significant according to the three-way ANOVA results. Elevated temperature and sampling date also had significant individual effects on changes in H2O2 and O2 content. However, all interactions among factors did not significantly affect these content (Table S1).

4. Discussion

In this study, we clearly observed visible foliar damage on the adaxial surface of the leaves of plants held under O and OT at both 7 and 14 DAE. Visible symptoms are regarded as important indicators of O3 sensitivity in plants [38]. The first appearance of visible symptoms occurred at 3 DAE under OT and at 5 DAE under O. Visible symptoms were found first in the oldest leaves, whereas foliar damage did not appear in the youngest leaves at that time. Based on when visible symptoms began to manifest, the results of this study indicate that leaf mustard is a species that is sensitive to ozone. Plants that have relatively high stomatal conductance could be more susceptible to the negative effects of ozone [39]. In the less sensitive spinach (Spinacia oleracea L.), the first symptoms of ozone damage were not detected until after 32 days of exposure to 60 nL L−1 O3 [40]. Visible symptoms of damage in plants grown under OT were more severe than those in plants grown under O (Figure 2). This indicates that elevated temperature aggravates O3-induced foliar damage, since elevated temperatures also led to increased stomatal conductance [41]. Elevated temperature may increase atmospheric vapor pressure deficit (VPD), which increases evapotranspiration and open stomata. It is well known that abscisic acid (ABA) controls stomatal open and closure which is regulated by VPD and temperature [42].
In terms of the responses of the growth characteristics, the significant reductions in total fresh weight and dry weight under O and OT were the most noticeable. This indicates that the resistance of leaf mustard to O3 combined with elevated temperature was not enough to prevent growth inhibition. In fact, the total fresh and dry weights of plants grown under elevated temperature alone were significantly decreased compared to plants under control (Table 1). Under elevated temperatures, the biomass of plants typically decreases as a result of decreased rates of photosynthesis [43,44]. Brassica napus grown at temperatures 5 °C above optimum had lower biomass than those grown under control [22]. The potential growth increase of plants in warm conditions may depend on how closely to their optimum temperature they are grown [45]. Our results suggest that elevated ozone also affects the growth parameters, especially total fresh and dry weight, of plants more severely than temperature does (Table 1). O3-induced reduction of photosynthesis and carbon allocation can negatively impact root dry weight more than shoot dry weight under elevated O3 conditions [46]. This phenomenon was also shown in the changes to shoot:root ratios observed in this study (Table 1). Changes in root dry weight under OT led to increased shoot:root ratios compared to those of C plants. The impacts of O3 on plant growth can alter the partitioning of plant assimilates among different plant parts [47].
Significant differences in specific leaf area (SLA) were also found between plants under C and those exposed to elevated levels of O3 (Table 1). The SLA of B. juncea increased under O and OT, indicating that the expansion of leaf area was relatively higher than the biomass accumulation in the leaves in these treatments compared to C [47]. SLA has been well known as a key traits explaining plants responses to environmental changes [48]. Physiological change mainly in CO2 assimilation due to increased O3 might lead to an increase in SLA by decreasing biomass accumulation [49]. The expansion of leaves is related to a complex suite of factors, including plant hormones, that mediate responses to environmental conditions [50,51]. In this study, elevated temperature affected the SLA of plants less severely than elevated O3 did as revealed by no significant change in this content under T compared to C (Table 1). Furthermore, the interactions between elevated O3 and temperatures observed indicated that the increase in SLA was more severe due to these two factors acting in combination than when they acted in isolation.
Lower photosynthetic rates (Anet) were observed under O and OT compared to those in C plants (Figure 3). Plants under elevated O3 conditions are characterized by reduced photosynthesis at the leaf level [52,53]. Anet is the primary physiological process mediating plant growth, and it can be limited by stomatal conductance and/or non-stomatal factors such as Rubisco activity, photosynthetic pigment content, and photochemical efficiency [54]. Also, reduced mesophyll conductance is related to an increase of O3 may limit improvements of photosynthesis [55]. In many O3 studies, Anet was decreased under elevated O3 so that it reduced plant growth [56,57,58]. Considering the key role of temperature in affecting plant growth and development, exposure to elevated temperature may occur irreversible damage [59]. However, in this study, there was no significant difference between photosynthesis rates under elevated temperature and control conditions at 14 DAE (Figure 3). When a plant experiences increased temperature, thermal acclimation allows it to improve efficiency at CO2 assimilation at elevated temperature [45]. In this study, Anet was decreased more under conditions with elevated O3 and elevated temperature than under elevated O3 alone. This suggests that elevated temperature can enhance O3 damage to plants due to them causing increased O3 flux which be affected by stomatal conductance (gs) [53]. gs was significantly increased by elevated temperature in this study (Figure 3). Unlike increased temperature, O3 damage may be blocked by the closure of stomata as a defense mechanism against O3 stress [60]. Elevated O3 may occur a rapid transient decrease in gs. In this study, the stomatal conductance of plants grown under OT significantly decreased compared to that in plants under T, as described above, whereas there was no significant difference between the C and O (Figure 3). According to more recent studies, gs is not always decreased by elevated O3, but the degree of O3 flux still affects stomatal conductance [61,62]. Obviously, as E = VPD × gs, transpiration rate (E) also increased simultaneously with gs under elevated temperatures [63]. In addition, this kind of increase in E resulted in reduced water use efficiency (WUE) under T and OT compared to C and O at 7 DAE, respectively (Figure 4 and Figure S1). However, there was no significant difference between these parameters in O and OT at 14 DAE. Due to acclimation in elevated temperature over time, difference between low and high WUE decreased during stress period [64]. Long-term exposure to elevated O3 may causes decreased stomatal function, leading to decreased gs and O3 flux. Alterations in gs, E, and WUE caused by elevated temperature resulted in changes in O3 flux into the leaf as it was estimated using the value of gs (Figure 4). The results indicated that elevated temperature induced increased O3 flux, which then enhanced O3 damage to the plant to some extent. Conversely, some studies have investigated the protective effects of elevated CO2 against O3 injury via it causing reduced O3 flux into leaves [28,65,66].
During this study, the reduced carotenoid content observed under OT can be attributed to oxidative bursts caused by reactive oxygen species (ROS) accumulation [67]. Carotenoids are regarded as pigments that play major roles in plant protection against oxidative stress [68].
Ascorbic acid is also a well-known ROS scavenger that can play a major role as a substrate for ascorbate peroxidase (APX) that allows it to detoxify hydrogen peroxide (H2O2) [69]. This study showed that the ascorbic acid content of plants under OT was severely decreased compared to that under C (Figure 5). Elevated temperature and O3 individually affected the ascorbic acid content of plants in this study (Table S1). The O3- or/and temperature-induced ROS are assumed to have reduced ascorbic acid by oxidizing it to form dehydroascorbic acid [70].
Lipid peroxidation significantly increased under OT compared to O at 7 DAE. However, at 14 DAE no significant difference was observed between O and OT (Figure 6). This result can mean that O3 damage occurred to plants grown under OT before it occurred to those grown under O (Table S2). Many studies have reported that O3 induced lipid peroxidation of membranes in leafy vegetables [65,67]. The oxidative lipid damage in cellular membranes is one of the O3 effects. And, it is associated with biogenic volatile organics (BVOCs) which are leading to increased O3 formation in atmosphere [71]. BVOCs predominantly leak out from the impaired cell tissue by O3 damage. Elevated temperature also leads to evaporation and release of a part of the pools of BVOCs [72].
The hydroxyl radical (OH) is one of the most highly reactive ROS, and can cause much lipid peroxidation of cell membranes and weaken cellular structures. The formation of OH may be caused by the generation of O2 [73]. In this study, increased accumulation of OH under O and OT compared to C was observed (Figure 6). According to the three-way ANOVA conducted, only elevated O3 significantly affected OH production (Table S1). This study indicates that increased production of OH with ozone exposure showed the same trend as increased lipid peroxidation.
Hydrogen peroxide (H2O2) is usually formed as part of the responses of plants to stressful situations [74]. H2O2 is produced by the detoxification of the superoxide radical (O2) by MnSOD. It is often reported that H2O2 levels increase under heat stress [75,76]. Many studies have also suggested that higher O3 concentrations are related to increased H2O2 production [77,78]. Unlike OH, H2O2 is the most stable ROS, so it is possible for it to diffuse rapidly across cell membranes [79]. In this study, the H2O2 content of plants grown under O and OT significantly increased compared to C. Furthermore, there was a significant difference in the production of this ROS between C and T conditions, suggesting that the production of H2O2 was affected by heat-induced abiotic stress (Figure 6). The limited CO2 assimilation ability resulting from O3 stress in plants that occurs due to stomatal closure may increase the production of O2 [80]. O2 is the most important oxyradical produced in the apoplast and dismutates to H2O2 naturally [81]. This study indicated that the production of the superoxide radical tends to be similarly affected by ozone and temperature as the other ROS examined were. Under O and OT, increased superoxide radical content was observed at 7 and 14 DAE (Figure 6).

5. Conclusions

This study demonstrated that elevated temperature enhances the negative effects of ozone on the condition of leaf mustard (Brassica juncea L.) by changing its growth and physiological characteristics, as well as ROS accumulation in its tissues. It was found that O3 flux, which leads to an increase in the O3 stress affecting plants, increased under elevated O3 conditions combined with higher temperatures (OT) more than it did under elevated O3 conditions with optimal temperatures (O) at 7 DAE. For this reason, plant injury index from visible foliar symptoms of ozone damage were the most severe under OT conditions at 14 DAE. Foliar damage led to changes in growth parameters. Under OT, there was a reduction in total fresh weight and dry weight compared to those in the O, whereas the shoot:root ratio (SRR) and specific leaf area (SLA) increased. In terms of photosynthetic rate, that of plants grown under OT conditions decreased more than that of plants in the O treatment at 14 DAE. However, significant increases in intercellular CO2 were observed under these conditions at 7 DAE. Stomatal conductance and transpiration played an important role in enhancing O3 flux into the leaf, which aggravated the extent of O3 damage to the plants. Elevated temperature enhanced O3-induced accumulation of reactive oxygen species (ROS), such as the hydroxyl radical (OH), superoxide radical (O2), and hydrogen peroxide (H2O2). The generation of ROS is regarded as an indicator of the degree of O3 damage in plants. This study confirmed the hypothesis that elevated temperature aggravates O3 damage to leaf mustard by increasing its stomatal conductance. The results further imply that increased tropospheric O3 concentrations will become more detrimental to leafy vegetables under projected higher future temperatures.

Supplementary Materials

The following are available online at https://www.mdpi.com/1999-4907/11/1/68/s1, Table S1: Analyses of variance of the main effects of temperature, O3, and sampling date and their interactions on growth parameters, gas exchange characteristics, O3 flux, carotenoid, ascorbic acid, lipid peroxidation, as well as accumulation of hydroxyl radical, hydrogen peroxide, and superoxide radical. Data were analyzed using three-way or two-way ANOVAs. Table S2: Comparison of 7 and 14 DAE (days after exposure) differences of each parameter under different ambient and elevated temperature and O3 treatments, respectively. Data are summarized as means ± SE (n = 5) and were analyzed using the independence t-test. Statistical significance: * p ≤ 0.05; ** p ≤ 0.01; *** p ≤ 0.001. C: optimal temperatures and ambient O3; T: elevated temperature and ambient O3; O: optimal temperatures and elevated O3; OT: elevated temperature and elevated O3; DAE: Days after exposure. Figure S1: Transpiration rate of Brassica juncea L. under different ambient and elevated temperature and O3 treatments at 7 DAE and 14 DAE.

Author Contributions

S.Y.W. as a corresponding author, developed the conceptualization and funding acquisition, edited the manuscript, and supervised the present study. J.K.L. designed the experiments, analyzed the data, and wrote the manuscript. M.J.K. and J.K.L. developed analytical methods. H.D.K., S.H.P. and Y.J.L. assembled in data input and analysis. J.H.P. and K.A.L. reviewed the manuscript. All authors have read and agreed to the published version of the manuscript.

Funding

This research was funded by Basic Science Research Program through the National Research Foundation of Korea (NRF), grant number No. 2018R1D1A1A02044683.

Acknowledgments

This research was supported by Basic Science Research Program through the National Research Foundation of Korea (NRF) funded by the Ministry of Education (No. 2018R1D1A1A02044683).

Conflicts of Interest

The authors declare no conflict of interest.

References

  1. Pachauri, R.K.; Allen, M.R.; Barros, V.R.; Broome, J.; Cramer, W.; Christ, R.; Church, J.A.; Clarke, L.; Dahe, Q.; Dasgupta, P. Climate Change 2014: Synthesis Report; Contribution of Working Groups I, II and III to the Fifth Assessment Report of the Intergovernmental Panel on Climate Change; IPCC: Geneva, Switzerland, 2014; p. 151. [Google Scholar]
  2. Ainsworth, E.A.; Rogers, A.; Leakey, A.D. Targets for crop biotechnology in a future high-CO2 and high-O3 world. Plant Physiol. 2008, 147, 13–19. [Google Scholar] [CrossRef] [Green Version]
  3. Wardlaw, I.F.; Wrigley, C.W. Heat tolerance in temperate cereals: An overview. Funct. Plant Biol. 1994, 21, 695–703. [Google Scholar] [CrossRef]
  4. Qaderi, M.M.; Kurepin, L.V.; Reid, D.M. Effects of temperature and watering regime on growth, gas exchange and abscisic acid content of canola (Brassica napus) seedlings. Environ. Exp. Bot. 2012, 75, 107–113. [Google Scholar] [CrossRef]
  5. Fahad, S.; Bajwa, A.A.; Nazir, U.; Anjum, S.A.; Farooq, A.; Zohaib, A.; Sadia, S.; Nasim, W.; Adkins, S.; Saud, S. Crop production under drought and heat stress: Plant responses and management options. Front. Plant Sci. 2017, 8, 1147. [Google Scholar] [CrossRef] [Green Version]
  6. Bokszczanin, K.L.; Fragkostefanakis, S.; Bostan, H.; Bovy, A.; Chaturvedi, P.; Chiusano, M.L.; Firon, N.; Iannacone, R.; Jegadeesan, S.; Klaczynskid, K. Perspectives on deciphering mechanisms underlying plant heat stress response and thermotolerance. Front. Plant Sci. 2013, 4, 315. [Google Scholar] [CrossRef] [PubMed]
  7. Bohnert, H.J.; Gong, Q.; Li, P.; Ma, S. Unraveling abiotic stress tolerance mechanisms–getting genomics going. Curr. Opin. Plant Biol. 2006, 9, 180–188. [Google Scholar] [CrossRef] [PubMed]
  8. Chan, C.K.; Yao, X. Air pollution in mega cities in China. Atmos. Environ. 2008, 42, 1–42. [Google Scholar] [CrossRef]
  9. Park, J.H.; Lee, D.K.; Gan, J.; Park, C.; Kim, S.; Sung, S.; Jung, T.Y.; Hong, S.C. Effects of climate change and ozone concentration on the net primary productivity of forests in South Korea. Forests 2018, 9, 112. [Google Scholar] [CrossRef] [Green Version]
  10. Nagashima, T.; Ohara, T.; Sudo, K.; Akimoto, H. The relative importance of various source regions on East Asian surface ozone. Atmos. Chem. Phys. 2010, 10, 11305–11322. [Google Scholar] [CrossRef] [Green Version]
  11. Li, K.; Jacob, D.J.; Liao, H.; Shen, L.; Zhang, Q.; Bates, K.H. Anthropogenic drivers of 2013–2017 trends in summer surface ozone in China. Proc. Natl. Acad. Sci. USA 2019, 116, 422–427. [Google Scholar] [CrossRef] [Green Version]
  12. Dizengremel, P.; Le Thiec, D.; Hasenfratz-Sauder, M.; Vaultier, M.; Bagard, M.; Jolivet, Y. Metabolic-dependent changes in plant cell redox power after ozone exposure. Plant Biol. 2009, 11, 35–42. [Google Scholar] [CrossRef] [PubMed]
  13. Renaut, J.; Bohler, S.; Hausman, J.; Hoffmann, L.; Sergeant, K.; Ahsan, N.; Jolivet, Y.; Dizengremel, P. The impact of atmospheric composition on plants: A case study of ozone and poplar. Mass Spectrom. Rev. 2009, 28, 495–516. [Google Scholar] [CrossRef] [PubMed]
  14. Krupa, S.; McGrath, M.T.; Andersen, C.P.; Booker, F.L.; Burkey, K.O.; Chappelka, A.H.; Chevone, B.I.; Pell, E.J.; Zilinskas, B.A. Ambient ozone and plant health. Plant Dis. 2001, 85, 4–12. [Google Scholar] [CrossRef] [Green Version]
  15. Picchi, V.; Monga, R.; Marzuoli, R.; Gerosa, G.; Faoro, F. The ozone-like syndrome in durum wheat (Triticum durum Desf.): Mechanisms underlying the different symptomatic responses of two sensitive cultivars. Plant Physiol. Biochem. 2017, 112, 261–269. [Google Scholar] [CrossRef] [PubMed]
  16. Laisk, A.; Kull, O.; Moldau, H. Ozone concentration in leaf intercellular air spaces is close to zero. Plant Physiol. 1989, 90, 1163–1167. [Google Scholar] [CrossRef] [PubMed] [Green Version]
  17. Jaspers, P.; Kangasjärvi, J. Reactive oxygen species in abiotic stress signaling. Physiol. Plant 2010, 138, 405–413. [Google Scholar] [CrossRef] [PubMed]
  18. Clark, A.J.; Landolt, W.; Bucher, J.B.; Strasser, R.J. Beech (Fagus sylvatica) response to ozone exposure assessed with a chlorophyll a fluorescence performance index. Environ. Pollut. 2000, 109, 501–507. [Google Scholar] [CrossRef]
  19. Ainsworth, E.A.; Yendrek, C.R.; Sitch, S.; Collins, W.J.; Emberson, L.D. The effects of tropospheric ozone on net primary productivity and implications for climate change. Annu. Rev. Plant Biol. 2012, 63, 637–661. [Google Scholar] [CrossRef] [Green Version]
  20. Moura, B.B.; Alves, E.S.; Marabesi, M.A.; De Souza, S.R.; Schaub, M.; Vollenweider, P. Ozone affects leaf physiology and causes injury to foliage of native tree species from the tropical Atlantic Forest of southern Brazil. Sci. Total Environ. 2018, 610, 912–925. [Google Scholar] [CrossRef]
  21. Frenck, G.; Van der Linden, L.; Mikkelsen, T.N.; Brix, H.; Jørgensen, R.B. Increased [CO2] does not compensate for negative effects on yield caused by higher temperature and [O3] in Brassica napus L. Eur. J. Agron. 2011, 35, 127–134. [Google Scholar] [CrossRef] [Green Version]
  22. Qaderi, M.M.; Kurepin, L.V.; Reid, D.M. Growth and physiological responses of canola (Brassica napus) to three components of global climate change: Temperature, carbon dioxide and drought. Physiol. Plant 2006, 128, 710–721. [Google Scholar] [CrossRef]
  23. Hansen, E.M.; Hauggaard-Nielsen, H.; Launay, M.; Rose, P.; Mikkelsen, T.N. The impact of ozone exposure, temperature and CO2 on the growth and yield of three spring wheat varieties. Environ. Exp. Bot. 2019, 168, 103868. [Google Scholar] [CrossRef]
  24. National Institute of Environmental Research. Annual Report of Air Quality in Korea 2016; National Institute of Environmental Research: Incheon, Korea, 2017; pp. 17–26. [Google Scholar]
  25. Feng, Z.; Sun, J.; Wan, W.; Hu, E.; Calatayud, V. Evidence of widespread ozone-induced visible injury on plants in Beijing, China. Environ. Pollut. 2014, 193, 296–301. [Google Scholar] [CrossRef] [PubMed]
  26. Calatayud, V.; García-Breijo, F.J.; Cervero, J.; Reig-Armiñana, J.; Sanz, M.J. Physiological, anatomical and biomass partitioning responses to ozone in the Mediterranean endemic plant Lamottea dianae. Ecotoxicol. Environ. Saf. 2011, 74, 1131–1138. [Google Scholar] [CrossRef] [PubMed]
  27. Farquhar, G.D.; Von Caemmerer, S.; Berry, J.A. A biochemical model of photosynthetic CO2 assimilation in leaves of C3 species. Planta 1980, 149, 78–90. [Google Scholar] [CrossRef] [Green Version]
  28. Fiscus, E.L.; Reid, C.D.; Miller, J.E.; Heagle, A.S. Elevated CO2 reduces O3 flux and O3-induced yield losses in soybeans: Possible implications for elevated CO2 studies. J. Exp. Bot. 1997, 48, 307–313. [Google Scholar] [CrossRef] [Green Version]
  29. Moldau, H.; Bichele, I. Plasmalemma protection by the apoplast as assessed from above-zero ozone concentrations in leaf intercellular air spaces. Planta 2002, 214, 484–487. [Google Scholar] [CrossRef]
  30. Li, S.; Harley, P.C.; Niinemets, Ü. Ozone-induced foliar damage and release of stress volatiles is highly dependent on stomatal openness and priming by low-level ozone exposure in Phaseolus vulgaris. Plant Cell Environ. 2017, 40, 1984–2003. [Google Scholar] [CrossRef] [Green Version]
  31. Arnon, D.I. Copper enzymes in isolated chloroplasts. Polyphenoloxidase in Beta Vulgaris. Plant Physiol. 1949, 24, 1–15. [Google Scholar] [CrossRef] [Green Version]
  32. Keller, T.; Schwager, H. Air pollution and ascorbic acid. For. Pathol. 1977, 7, 338–350. [Google Scholar] [CrossRef]
  33. Heath, R.L.; Packer, L. Photoperoxidation in isolated chloroplasts: I. Kinetics and stoichiometry of fatty acid peroxidation. Arch. Biochem. Biophys. 1968, 125, 189–198. [Google Scholar] [CrossRef]
  34. Alexieva, V.; Sergiev, I.; Mapelli, S.; Karanov, E. The effect of drought and ultraviolet radiation on growth and stress markers in pea and wheat. Plant Cell Environ. 2001, 24, 1337–1344. [Google Scholar] [CrossRef]
  35. Doke, N. Involvement of superoxide anion generation in the hypersensitive response of potato tuber tissues to infection with an incompatible race of Phytophthora infestans and to the hyphal wall components. Physiol. Plant Pathol. 1983, 23, 345–357. [Google Scholar] [CrossRef]
  36. Tiedemann, A.V. Evidence for a primary role of active oxygen species in induction of host cell death during infection of bean leaves with Botrytis cinerea. Physiol. Mol. Plant Pathol. 1997, 50, 151–166. [Google Scholar] [CrossRef]
  37. Hunt, R. Plant Growth Curves. The Functional Approach to Plant Growth Analysis; Edward Arnold Ltd.: London, UK, 1990; pp. 98–120. [Google Scholar]
  38. Zhang, L.; Xiao, S.; Chen, Y.J.; Xu, H.; Li, Y.G.; Zhang, Y.W.; Luan, F.S. Ozone sensitivity of four Pakchoi cultivars with different leaf colors: Physiological and biochemical mechanisms. Photosynthetica 2017, 55, 478–490. [Google Scholar] [CrossRef]
  39. Reich, P.B. Quantifying plant response to ozone: A unifying theory. Tree Physiol. 1987, 3, 63–91. [Google Scholar] [CrossRef] [PubMed]
  40. González-Fernández, I.; Elvira, S.; Calatayud, V.; Calvo, E.; Aparicio, P.; Sánchez, M.; Alonso, R.; Bermejo, V.B. Ozone effects on the physiology and marketable biomass of leafy vegetables under Mediterranean conditions: Spinach (Spinacia Oleracea L.) and Swiss chard (Beta Vulgaris L. Var. cycla). Agric. Ecosyst. Environ. 2016, 235, 215–228. [Google Scholar] [CrossRef]
  41. Law, R.D.; Crafts-Brandner, S.J. Inhibition and acclimation of photosynthesis to heat stress is closely correlated with activation of ribulose-1, 5-bisphosphate Carboxylase/Oxygenase. Plant Physiol. 1999, 120, 173–182. [Google Scholar] [CrossRef] [PubMed] [Green Version]
  42. Tallman, G. Are diurnal patterns of stomatal movement the result of alternating metabolism of endogenous guard cell ABA and accumulation of ABA delivered to the apoplast around guard cells by transpiration? J. Exp. Bot. 2004, 55, 1963–1976. [Google Scholar] [CrossRef] [Green Version]
  43. Barnabás, B.; Jäger, K.; Fehér, A. The effect of drought and heat stress on reproductive processes in cereals. Plant Cell Environ. 2008, 31, 11–38. [Google Scholar] [CrossRef]
  44. Apgaua, D.M.; Tng, D.Y.; Forbes, S.J.; Ishida, Y.F.; Vogado, N.O.; Cernusak, L.A.; Laurance, S.G. Elevated temperature and CO2 cause differential growth stimulation and drought survival responses in eucalypt species from contrasting habitats. Tree Physiol. 2019, 39, 1806–1820. [Google Scholar] [CrossRef] [PubMed]
  45. Yamori, W.; Hikosaka, K.; Way, D.A. Temperature response of photosynthesis in C3, C4, and CAM plants: Temperature acclimation and temperature adaptation. Photosynth. Res. 2014, 119, 101–117. [Google Scholar] [CrossRef] [PubMed]
  46. Tiwari, S.; Agrawal, M.; Marshall, F.M. Seasonal variations in adaptational strategies of Beta vulgaris L. plants in response to ambient air pollution: Biomass allocation, yield and nutritional quality. Trop. Ecol. 2010, 51, 353–363. [Google Scholar]
  47. Kumari, S.; Agrawal, M. Growth, yield and quality attributes of a tropical potato variety (Solanum tuberosum L. cv. Kufri chandramukhi) under ambient and elevated carbon dioxide and ozone and their interactions. Ecotoxicol. Environ. Saf. 2014, 101, 146–156. [Google Scholar] [CrossRef] [PubMed]
  48. Rosbakh, S.; Römermann, C.; Poschlod, P. Specific leaf area correlates with temperature: New evidence of trait variation at the population, species and community levels. Alpine Bot. 2015, 125, 79–86. [Google Scholar] [CrossRef]
  49. Biswas, D.K.; Xu, H.; Li, Y.G.; Ma, B.L.; Jiang, G.M. Modification of photosynthesis and growth responses to elevated CO2 by ozone in two cultivars of winter wheat with different years of release. J. Exp. Bot. 2013, 64, 1485–1496. [Google Scholar] [CrossRef] [PubMed] [Green Version]
  50. Savaldi-Goldstein, S.; Peto, C.; Chory, J. The epidermis both drives and restricts plant shoot growth. Nature 2007, 446, 199. [Google Scholar] [CrossRef]
  51. Riikonen, J.; Percy, K.E.; Kivimäenpää, M.; Kubiske, M.E.; Nelson, N.D.; Vapaavuori, E.; Karnosky, D.F. Leaf size and surface characteristics of Betula papyrifera exposed to elevated CO2 and O3. Environ. Pollut. 2010, 158, 1029–1035. [Google Scholar] [CrossRef]
  52. Ashmore, M.R. Assessing the future global impacts of ozone on vegetation. Plant Cell Environ. 2005, 28, 949–964. [Google Scholar] [CrossRef]
  53. Fiscus, E.L.; Booker, F.L.; Burkey, K.O. Crop responses to ozone: Uptake, modes of action, carbon assimilation and partitioning. Plant Cell Environ. 2005, 28, 997–1011. [Google Scholar] [CrossRef]
  54. Zhang, W.; Feng, Z.; Wang, X.; Niu, J. Elevated ozone negatively affects photosynthesis of current-year leaves but not previous-year leaves in evergreen Cyclobalanopsis glauca seedlings. Environ. Pollut. 2014, 184, 676–681. [Google Scholar] [CrossRef]
  55. Gago, J.; Carriquí, M.; Nadal, M.; Clemente-Moreno, M.J.; Coopman, R.E.; Fernie, A.R.; Flexas, J. Photosynthesis optimized across land plant phylogeny. Trends Plant Sci. 2019, 24. [Google Scholar] [CrossRef] [PubMed]
  56. Pell, E.; Schlagnhaufer, C.D.; Arteca, R.N. Ozone-induced oxidative stress: Mechanisms of action and reaction. Physiol. Plant 1997, 100, 264–273. [Google Scholar] [CrossRef]
  57. Morgan, P.B.; Ainsworth, E.A.; Long, S.P. How does elevated ozone impact soybean? A meta-analysis of photosynthesis, growth and yield. Plant Cell Environ. 2003, 26, 1317–1328. [Google Scholar] [CrossRef]
  58. Morgan, P.B.; Bernacchi, C.J.; Ort, D.R.; Long, S.P. An in vivo analysis of the effect of season-long open-air elevation of ozone to anticipated 2050 levels on photosynthesis in soybean. Plant Physiol. 2004, 135, 2348–2357. [Google Scholar] [CrossRef] [Green Version]
  59. Posch, B.C.; Kariyawasam, B.C.; Bramley, H.; Coast, O.; Richards, R.A.; Reynolds, M.P.; Trethowan, R.; Atkin, O.K. Exploring high temperature responses of photosynthesis and respiration to improve heat tolerance in wheat. J. Exp. Bot. 2019, 70, 5051–5069. [Google Scholar] [CrossRef] [PubMed]
  60. Wieser, G.; Matyssek, R. Linking ozone uptake and defense towards a mechanistic risk assessment for forest trees. New Phytol. 2007, 174, 7–9. [Google Scholar] [CrossRef]
  61. Bernacchi, C.J.; Leakey, A.D.; Heady, L.E.; Morgan, P.B.; Dohleman, F.G.; McGrath, J.M.; Gillespie, K.M.; Wittig, V.E.; Rogers, A.; Long, S.P. Hourly and seasonal variation in photosynthesis and stomatal conductance of soybean grown at future CO2 and ozone concentrations for 3 years under fully open-air field conditions. Plant Cell Environ. 2006, 29, 2077–2090. [Google Scholar] [CrossRef]
  62. Uddling, J.; Hogg, A.J.; Teclaw, R.M.; Carroll, M.A.; Ellsworth, D.S. Stomatal uptake of O3 in aspen and aspen-birch forests under free-air CO2 and O3 enrichment. Environ. Pollut. 2010, 158, 2023–2031. [Google Scholar] [CrossRef]
  63. Hartikainen, K.; Riikonen, J.; Nerg, A.; Kivimäenpää, M.; Ahonen, V.; Tervahauta, A.; Kärenlampi, S.; Mäenpää, M.; Rousi, M.; Kontunen-Soppela, S. Impact of elevated temperature and ozone on the emission of volatile organic compounds and gas exchange of silver birch (Betula pendula Roth). Environ. Exp. Bot. 2012, 84, 33–43. [Google Scholar] [CrossRef]
  64. Rashid, M.A.; Andersen, M.N.; Wollenweber, B.; Zhang, X.; Olesen, J.E. Acclimation to higher VPD and temperature minimized negative effects on assimilation and grain yield of wheat. Agric. For. Meteorol. 2018, 248, 119–129. [Google Scholar] [CrossRef]
  65. Kumari, S.; Agrawal, M.; Tiwari, S. Impact of elevated CO2 and elevated O3 on Beta vulgaris L.: Pigments, metabolites, antioxidants, growth and yield. Environ. Pollut. 2013, 174, 279–288. [Google Scholar] [CrossRef] [PubMed]
  66. Kumari, S.; Agrawal, M.; Singh, A. Effects of ambient and elevated CO2 and ozone on physiological characteristics, antioxidative defense system and metabolites of potato in relation to ozone flux. Environ. Exp. Bot. 2015, 109, 276–287. [Google Scholar] [CrossRef]
  67. Calatayud, A.; Barreno, E. Response to ozone in two lettuce varieties on chlorophyll a fluorescence, photosynthetic pigments and lipid peroxidation. Plant Physiol. Biochem. 2004, 42, 549–555. [Google Scholar] [CrossRef] [PubMed]
  68. Stahl, W.; Sies, H. Antioxidant activity of carotenoids. Mol. Aspects Med. 2003, 24, 345–351. [Google Scholar] [CrossRef]
  69. Noctor, G.; Foyer, C.H. Ascorbate and glutathione: Keeping active oxygen under control. Ann. Rev. Plant Biol. 1998, 49, 249–279. [Google Scholar] [CrossRef]
  70. Smith, I.K.; Vierheller, T.L.; Thorne, C.A. Properties and functions of glutathione reductase in plants. Physiol. Plant 1989, 77, 449–456. [Google Scholar] [CrossRef]
  71. Fehsenfeld, F.; Calvert, J.; Fall, R.; Goldan, P.; Guenther, A.B.; Hewitt, C.N.; Lamb, B.; Liu, S.; Trainer, M.; Westberg, H. Emissions of volatile organic compounds from vegetation and the implications for atmospheric chemistry. Glob. Biogeochem. Cycles 1992, 6, 389–430. [Google Scholar] [CrossRef]
  72. Ghirardo, A.; Koch, K.; Taipale, R.; Zimmer, I.; Schnitzler, J.; Rinne, J. Determination of de novo and pool emissions of terpenes from four common boreal/alpine trees by 13CO2 labelling and PTR-MS analysis. Plant Cell Environ. 2010, 33, 781–792. [Google Scholar] [CrossRef]
  73. Gill, S.S.; Tuteja, N. Reactive oxygen species and antioxidant machinery in abiotic stress tolerance in crop plants. Plant Physiol. Biochem. 2010, 48, 909–930. [Google Scholar] [CrossRef]
  74. Foyer, C.H.; Shigeoka, S. Understanding oxidative stress and antioxidant functions to enhance photosynthesis. Plant Physiol. 2011, 155, 93–100. [Google Scholar] [CrossRef] [PubMed] [Green Version]
  75. Zhao, Q.; Fujiwara, Y.; Kondo, T. Mechanism of cell death induction by nitroxide and hyperthermia. Free Radic. Biol. Med. 2006, 40, 1131–1143. [Google Scholar] [CrossRef] [PubMed]
  76. Kikusato, M.; Toyomizu, M. Crucial role of membrane potential in heat stress-induced overproduction of reactive oxygen species in avian skeletal muscle mitochondria. PLoS ONE 2013, 8, e64412. [Google Scholar] [CrossRef]
  77. Grimes, H.D.; Perkins, K.K.; Boss, W.F. Ozone degrades into hydroxyl radical under physiological conditions: A spin trapping study. Plant Physiol. 1983, 72, 1016–1020. [Google Scholar] [CrossRef] [Green Version]
  78. Ahlfors, R.; Brosché, M.; Kollist, H.; Kangasjärvi, J. Nitric oxide modulates ozone-induced cell death, hormone biosynthesis and gene expression in Arabidopsis thaliana. Plant J. 2009, 58, 1–12. [Google Scholar] [CrossRef]
  79. Foyer, C.H.; Lopez-Delgado, H.; Dat, J.F.; Scott, I.M. Hydrogen peroxide-and glutathione-associated mechanisms of acclimatory stress tolerance and signalling. Physiol. Plant 1997, 100, 241–254. [Google Scholar] [CrossRef]
  80. Mignolet-Spruyt, L.; Xu, E.; Idänheimo, N.; Hoeberichts, F.A.; Mühlenbock, P.; Brosché, M.; Van Breusegem, F.; Kangasjärvi, J. Spreading the news: Subcellular and organellar reactive oxygen species production and signalling. J. Exp. Bot. 2016, 67, 3831–3844. [Google Scholar] [CrossRef] [Green Version]
  81. Ogawa, K.; Kanematsu, S.; Asada, K. Intra-and extra-cellular localization of “cytosolic” CuZn-superoxide dismutase in spinach leaf and hypocotyl. Plant Cell Physiol. 1996, 37, 790–799. [Google Scholar] [CrossRef] [Green Version]
Figure 1. Schematic diagram of the phytotron growth chamber and its environmental control system.
Forests 11 00068 g001
Figure 2. (a) Plant injury index and (b) visible symptom of Brassica juncea L. under different ambient and elevated temperature and O3 treatments at 7 (A–D) and 14 (E–F) DAE. Data are plotted as means ± standard error (SE) (n = 5). Different letters indicate significant differences between treatments at p < 0.05 according to Tukey’s HSD test. O: optimal temperatures and elevated O3; OT: elevated temperature and elevated O3; DAE: Days after exposure. (A, E) Leaf appearance under control conditions at 7 and 14 DAE; (B, F) leaf appearance at elevated temperature and ambient O3 at 7 and 14 DAE; (C, G) leaf appearance at optimal temperatures and elevated O3 at 7 DAE and 14 DAE; and (D, H) leaf appearance under elevated temperature and O3 conditions at 7 and 14 DAE. (C, D, G, H) Chlorosis was observed on the adaxial side of the leaf.
Forests 11 00068 g002
Figure 3. Photosynthetic rate, stomatal conductance, and intercellular CO2 concentration of Brassica juncea L. under different ambient and elevated temperature and O3 treatments at 7 DAE and 14 DAE. Data are plotted as means ± SE (n = 5). Different letters signify significant differences among treatments at p < 0.05 according to Tukey’s HSD test. C: optimal temperatures and ambient O3; T: elevated temperature and ambient O3; O: optimal temperatures and elevated O3; OT: elevated temperature and elevated O3; DAE: Days after exposure.
Forests 11 00068 g003
Figure 4. Water use efficiency and O3 flux of Brassica juncea L. under different ambient and elevated temperature and O3 treatments at 7 DAE and 14 DAE. Data are plotted as means ± SE (n = 5). Different letters signify significant differences among treatments at p < 0.05 according to Tukey’s HSD test. C: optimal temperatures and ambient O3; T: elevated temperature and ambient O3; O: optimal temperatures and elevated O3; OT: elevated temperature and elevated O3; DAE: Days after exposure.
Forests 11 00068 g004
Figure 5. Carotenoids and ascorbic acid of Brassica juncea L. under different ambient and elevated temperature and O3 treatments at 7 DAE and 14 DAE. Data are plotted as means ± SE (n = 5). Different letters signify significant differences among treatments at p < 0.05 according to Tukey’s HSD test. C: optimal temperatures and ambient O3; T: elevated temperature and ambient O3; O: optimal temperatures and elevated O3; OT: elevated temperature and elevated O3; DAE: Days after exposure.
Forests 11 00068 g005
Figure 6. Lipid peroxidation, Hydroxyl radical (OH), Hydrogen peroxide (H2O2) and superoxide radical (O2) accumulation of Brassica juncea L. under different ambient and elevated temperature and O3 treatments at 7 DAE and 14 DAE. Data are plotted as means ± SE (n = 5). Different letters signify significant differences among treatments at p < 0.05 according to Tukey’s HSD test. C: optimal temperatures and ambient O3; T: elevated temperature and ambient O3; O: optimal temperatures and elevated O3; OT: elevated temperature and elevated O3; DAE: Days after exposure.
Forests 11 00068 g006
Table 1. Total fresh weight, total dry weight, shoot dry weight, root dry weight, shoot:root ratio (SRR), and specific leaf area (SLA) of Brassica juncea L. under different ambient and elevated temperature and O3 treatments at 14 DAE.
ParametersControlElevated Temp.Elevated O3Elevated Temp. × O3
Total fresh weight (g)77.85 ± 1.79 a54.85 ± 1.85 b44.51 ± 1.77 c32.32 ± 1.43 d
Total dry weight (g)8.82 ± 0.49 a6.99 ± 0.07 b4.49 ± 0.19 c3.37 ± 0.27 c
Shoot dry weight (g)4.73 ± 0.19 a4.55 ± 0.18 a2.91 ± 0.13 b2.62 ± 0.14 b
Root dry weight (g)4.08 ± 0.51 a2.45 ± 0.19 b1.58 ± 0.11 bc0.75 ± 0.16 c
Shoot:root ratio (SRR)1.02 ± 0.13 b1.95 ± 0.12 b2.11 ± 0.16 b4.89 ± 1.12 a
Specific leaf area (SLA) (cm2 g−1)273.43 ± 7.30 c312.72 ± 10.58 bc355.38 ± 12.99 ab369.77 ± 14.93 a
Data are summarized as means ± SE (n = 5). Different letters signify significant differences among treatments at p < 0.05 according to Tukey’s HSD test.

