Abstract
This study investigated visible foliar ozone (O3) injury in three deciduous tree species with different growth patterns (indeterminate, Alnus glutinosa (L.) Gaertn.; intermediate, Sorbus aucuparia L.; and determinate, Vaccinium myrtillus L.) from May to August 2018. Ozone effects on the timing of injury onset and a plant injury index (PII) were investigated using two O3 indices, i.e., AOT40 (accumulative O3 exposure over 40 ppb during daylight hours) and PODY (phytotoxic O3 dose above a flux threshold of Y nmol m−2 s−1). A new parameterization for PODY estimation was developed for each species. Measurements were carried out in an O3 free-air controlled exposure (FACE) experiment with three levels of O3 treatment (ambient, AA; 1.5 × AA; and 2.0 × AA). Injury onset was found in May at 2.0 × AA in all three species and the timing of the onset was determined by the amount of stomatal O3 uptake. It required 4.0 mmol m−2 POD0 and 5.5 to 9.0 ppm·h AOT40. As a result, A. glutinosa with high stomatal conductance (gs) showed the earliest emergence of O3 visible injury among the three species. After the onset, O3 visible injury expanded to the plant level as confirmed by increased PII values. In A. glutinosa with indeterminate growth pattern, a new leaf formation alleviated the expansion of O3 visible injury at the plant level. V. myrtillus showed a dramatic increase of PII from June to July due to higher sensitivity to O3 in its flowering and fruiting stage. Ozone impacts on PII were better explained by the flux-based index, PODY, as compared with the exposure-based index, AOT40. The critical levels (CLs) corresponding to PII = 5 were 8.1 mmol m−2 POD7 in A. glutinosa, 22 mmol m−2 POD0 in S. aucuparia, and 5.8 mmol m−2 POD1 in V. myrtillus. The results highlight that the CLs for PII are species-specific. Establishing species-specific O3 flux-effect relationships should be key for a quantitative O3 risk assessment.
1. Introduction
Tropospheric ozone (O3) is one of the major concerns for forest health due to its phytotoxicity [1]. Despite the fact that peak O3 concentrations have tended to decrease in the eastern part of United States and some European countries due to precursor emission controls [2], the global background O3 concentration still remains high enough to cause negative impacts on tree physiology [3].
Visible foliar injury by O3 (O3 visible injury) is the first unequivocal visually detectable sign of O3 damage and indicates an impairment of leaf physiological functions [4]. Hoshika et al., 2012a [5] reported that the percent of surface injury was negatively correlated with leaf gas exchange rate, highlighting a reduced photosynthesis and loss of stomatal control in poplar leaves with more than 5% injury. Ozone visible injury has been broadly investigated in native and exotic trees, shrubs, and herbs in Asia, Europe, and North America, and partly validated under controlled conditions [6,7,8].
An exposure-based index such as AOT40 (accumulated exposure over a threshold of 40 ppb) is used to assess O3 risks to European forest trees [9,10]. Previous studies have reported an AOT40-based assessment of the first symptom onset of O3 visible injury in field [11,12] or open-top chambers [13,14]. Those studies suggested that an O3 critical level (CL) by 5 to 10 ppm∙h AOT40 could protect the sensitive tree species from O3 visible injury. However, it has been recognized that O3 damage depends on stomatal O3 uptake rather than only O3 exposure [15]. To improve our quantitative assessment of O3 effects on trees, a stomatal O3 flux-based index such as PODY (phytotoxic ozone dose above a flux threshold of Y nmol m−2 s−1) has been the focus. PODY is estimated using the deposition of ozone and stomatal exchange model (DO3SE) [16]. Sicard et al., 2016 [17] estimated PODY using the DO3SE model and analyzed field observation data in Southeastern France and Northwestern Italy. They proposed the stomatalflux-based standard to assess O3 visible injury for two deciduous species (Fagus sylvatica and Fraxinus excelsior) and two conifer species (Pinus cembra and P. halepensis) as representative O3 sensitive species (approximately 20 mmol m−2 of POD0 corresponded to 5% injury). Many symptomatic species have been recorded in field monitoring campaigns [8,18,19]. Paoletti et al., 2019 [8] recently found O3 visible injury in 23 tree species across forest sites in France, Italy, and Romania. Nevertheless, knowledge is still limited on species-specific model parameters to calculate stomatal O3 uptake for establishing the O3 flux-effect relationship in most symptomatic tree species.
The species-specific tree response to O3 can be affected by the growth pattern (i.e., indeterminate or determinate) [20]. In elevated O3, the tree species with indeterminate pattern (e.g., poplar) can initiate new leaf formation to replace damaged older leaves [21]. This response can limit the development of O3 visible injury at the plant level for those species. In this study, we selected three European cool-temperate deciduous tree species with different growth patterns, i.e., Alnus glutinosa (L.) Gaertn. (indeterminate) [22], Sorbus aucuparia L. (intermediate) [23], and Vaccinium myrtillus L. (determinate) [24]. These three species have often shown O3 visible injury in field forest sites [8]. The aim of this study was to achieve the species-specific parameterization of the DO3SE model in these three tree species, examining both the onset date of O3 visible injury and its expansion at the whole plant level using a plant injury index (PII) [4] in an O3 free-air controlled exposure (O3 FACE) experiment. The PII can be more closely related to the plant physiological status and especially whole plant carbon loss than to first symptom onset [14]. Three hypotheses were tested as follows: (i) Are species with higher stomatal O3 uptake more sensitive to O3? (ii) Does the tree growth pattern affect the expansion of O3 visible injury at plant level? and (iii) Is the flux-based approach better than the exposure-based one to explain the PII?
2. Materials and Methods
2.1. Experimental Site and Plant Material
Measurements were conducted at an O3 FACE facility located in Sesto Fiorentino, in central Italy (43° 48’ 59″ N, 11° 12’ 01″ E, 55 m a.s.l.). The details of the system are described in Paoletti et al., 2017 [25]. Five-year old saplings of A. glutinosa and S. aucuparia, and three-year old saplings of V. myrtillus were obtained from a nearby nursery in December 2017. Plants were transplanted into plastic pots (50 L for A. glutinosa and S. aucuparia and 25 L for V. myrtillus) containing a mixture of sand:peat:soil = 1:1:1 (v:v:v). In 2018, plants were exposed to the following three levels of O3 concentration: Ambient air (AA), 1.5 times ambient O3 concentration (1.5 × AA), and twice ambient O3 concentration (2.0 × AA). Three replicated blocks (5 m × 5 m × 2 m) were set to each O3 treatment (n = 3) with three (A. glutinosa and S. aucuparia) or six (V. myrtillus) plants (total 27 plants for A. glutinosa and S. aucuparia, and 54 plants for V. myrtillus). Ozone concentrations in each treatment were recorded continuously by an O3 monitor (Mod. 202, 2B Technologies, Boulder, CO, USA). All plants were irrigated to keep field capacity at 1- to 3-day intervals to prevent water stress. We monitored the light intensity, relative humidity, air temperature, precipitation, and wind speed above the O3 FACE facility (2.5 m height) using a WatchDog meteorological station (Model 2000, Spectrum Technologies, Inc., Aurora, IL, USA).
2.2. Assessment of Ozone Visible Injury
The onset of O3 visible injury was assessed every 2 to 3 days in May 2018. After we found the first symptom in any O3 treatment, the percentage of symptomatic leaves per plant (LA) and the percentage injured area in the symptomatic leaves (AA) were scored (A. glutinosa on 31 May, 21 June, 10 and 21 July, and 8 and 20 August; S. aucuparia on 31 May, 21 June, 10 July, and 8 and 20 August; V. myrtillus on 31 May, 21 June, 4, and 11 and 19 July) with a ×10 hand lens and the help of photoguides (Innes et al. 2001 and Paoletti et al. 2009). All attached leaves were scored and counted by the same two observers. To assess the whole plant injury, a PII was calculated combining the two parameters, [4].
2.3. Modeling of Stomatal Conductance
Leaf gas exchange was measured in fully expanded sun-exposed leaves (1 to 3 plants per replicated plot per each O3 treatment) using a portable infrared gas analyzer (CIRAS-2 PP Systems, Herts, UK). Measurements were made on the days with clear sky in the morning (8 h to 10 h), afternoon (13 h to 15 h) and evening (16 h to 19 h) from May to October 2018. Natural illumination was used for the measurement. The CO2 concentration in the chamber (Ca) was set to 400 ppm. The temperature and relative humidity in the chamber were adjusted manually to the ambient condition. Pooled data (210 for A. glutinosa, 217 for S. aucuparia, and 216 for V. myrtillus) were used to estimate the parameters of the DO3SE model [16], as follows:
where gmax is the maximum stomatal conductance, i.e., mmol O3 m−2 projected leaf area (PLA) s−1. The other functions are all expressed as relative terms and are scaled from 0 to 1. The model accounts for the minimum stomatal conductance (fmin) and the variation in gs according to phenology (fphen), photosynthetic photon flux density (PPFD) (flight), temperature (ftemp), vapor pressure deficit (VPD) (fVPD), and soil water content (fSWC). The fSWC was not applied in this study (fSWC = 1) because the soil moisture was equivalent to field capacity. The gmax and fmin values were set as 95th and 5th percentile values recorded in the experiment. Parameterizations of other functions were carried out using a boundary line analysis [26,27]. Further details on fphen, flight, ftemp, and fVPD calculations are provided in CLRTAP (2017) [16].
2.4. Calculation of Ozone Indices
AOT40 was calculated by using hourly O3 concentrations during daylight hours (short wave radiation > 50 W m−2) according to CLRTAP (2017) [16]. It is given by:
where [O3]i is the ith measured hourly O3 concentration (ppb) with i equal to 1 … n in the integral and n is the number of hours included in the calculation period.
Stomatal O3 uptake (Fst, nmol m−2 s−1) was calculated as:
where rc is the leaf surface resistance (= 1/(gs + gext), s m−1), gext is the external leaf or cuticular conductance (s m−1) [16], and rb is the leaf boundary layer resistance, given as:
where u is wind speed (m s−1) and Ld is the species-specific leaf dimension (A. glutinosa 0.07 m, S. aucuparia 0.04 m, and V. myrtillus 0.04 m obtained as averaged value of 3 to 5 leaves of two plants in each block in each O3 treatment) [16].
PODY (mmol m−2) was estimated from hourly data as:
where Fst_i is the ith hourly stomatal O3 uptake (nmol m−2 s−1) and n is the number of hours included in the calculation period. Y is a species-specific threshold of stomatal O3 uptake (nmol m−2 s−1).
Exposure- or flux-based dose-response functions were determined from a linear regression between PII and AOT40 or PODY over a threshold of Y (Y from 0 to 10, with an increment of 0.5 nmol m−2 s−1). Two criteria were applied to select the best dose-response function which included: (1) the confidence interval (C.I.) must include Y-intercept = 0, and (2) among the functions meeting criterion 1, the equation with the highest R2 value was chosen. CLs were calculated as the level when PII reaches 5. In fact, a significant decline of physiological performance was found in leaves with more than 5 of PII [14].
2.5. Data Analysis
Statistical analyses were performed using SPSS (20.0, SPSS, Chicago, IL, USA). To assess the effects of O3 on the number of attached leaves, a two-way analysis of variance (ANOVA) was applied. Data were checked for normal distribution and homogeneity of variance (Levene’s test). Since the PII data were not normally distributed, the Kruskal–Wallis analysis of variance was applied to examine the effect of O3. The relationships between PII and O3 indices were fitted using a simple linear regression. Results were considered significant at p < 0.05.
3. Results
3.1. Ozone Concentration and Meteorological Factors
Daily mean PPFD, air temperature, wind speed, and relative humidity (mean ± S.E.) during the exposure period (May to October 2018) were 527 ± 13 μmol m−2 s−1, 22.8 ± 0.3 °C, 0.3 ± 0.0 m s−1, and 55.6% ± 0.8%, respectively (Figure 1). Total rainfall was 136 mm. Daily mean O3 concentration (mean ± S.E.) in AA, 1.5 × AA, and 2.0 × AA was 35.2 ± 0.7 ppb, 53.1 ± 1.1 ppb, and 65.2 ± 1.4 ppb, respectively.
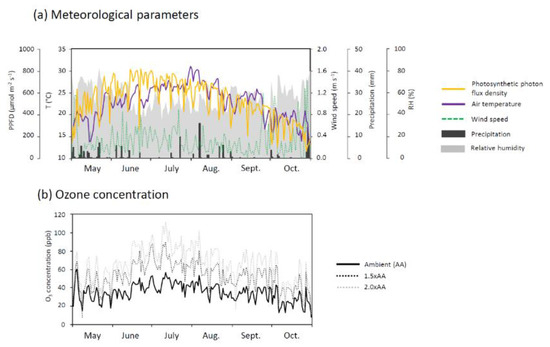
Figure 1.
Meteorological factors and O3 concentration over the experimental period (from May to October 2018) showing daily mean values of photosynthetic photon flux density (PPFD), air temperature (T), wind speed, precipitation, relative humidity (RH), and the following three levels of ozone concentrations at the O3 FACE: Ambient air (AA), 1.5 times ambient O3 concentration (1.5 × AA), and twice ambient O3 concentration (2.0 × AA).
3.2. Ozone Visible Injury
The first O3 visible injuries were observed in 2.0 × AA on 18 May for A. glutinosa, on 21 May for S. aucuparia, and on 26 May for V. myrtillus (Table 1). Ozone visible injury occurred as dark or reddish stippling on the upper leaf surface (Figure 2) and was more severe in older than in younger leaves. The AOT40 corresponding to the onset of O3 visible injury was 5.6 to 8.9 ppm·h, and the POD0 corresponding to the occurrence of injury was approximately 4.0 mmol m−2 regardless of tree species. After the onset of O3 visible injury, the PII value increased in all species (Figure 3) due to an increased number of symptomatic leaves and injured leaf area (data not shown). Ozone significantly increased PII values in A. glutinosa on 21 June (1.5 × AA, +224% and 2.0 × AA, +656%), 8 August (1.5 × AA, +400% and 2.0 × AA, +1163%), and 20 August (1.5 × AA, +440% and 2.0 × AA, +2169%). Ozone-induced increases of PII were also found in S. aucuparia on 20 August (1.5 × AA, +101% and 2.0 × AA, +182%) and V. myrtillus on 19 July (1.5 × AA, +65% and 2.0 × AA, +172%). Ozone stimulated the number of attached leaves in A. glutinosa on 20 August (Figure 4); however, such an increase was not found in S. aucuparia and V. myrtillus.

Table 1.
The date of first symptom onset of O3 visible foliar injury and corresponding ozone indices (POD0, phytotoxic ozone dose above a flux threshold of 0 nmol m−2 s−1 and AOT40, accumulated exposure over a threshold of 40 ppb) for Alnus glutinosa, Sorbus aucuparia, and Vaccinium myrtillus in 2.0 × AA (twice ambient O3 concentration).
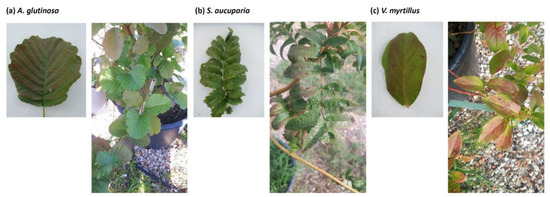
Figure 2.
Photographs of symptomatic leaves in Alnus glutinosa, Sorbus aucuparia, and Vaccinium myrtillus in an O3 FACE experiment in 2018. Dark or reddish stippling on the upper leaf surface was found.
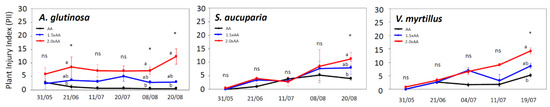
Figure 3.
Plant injury index (PII) in Alnus glutinosa, Sorbus aucuparia, and Vaccinium myrtillus exposed to three levels of O3 concentration (AA, ambient O3 concentration 1.5 × AA, and ambient O3 concentration 2.0 × AA). The points represent mean ± S.E. (n = 3 plots). Asterisks show the significance of Kruskal–Wallis tests: * p < 0.05 and ns, not significant. Different letters show significant differences among treatments in each date (p < 0.05, Mann–Whitney U test).
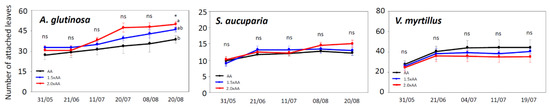
Figure 4.
Number of attached leaves in Alnus glutinosa, Sorbus aucuparia, and Vaccinium myrtillus exposed to three levels of O3 concentration (AA, ambient O3 concentration 1.5 × AA, and ambient O3 concentration 2.0 × AA). The points represent mean ± S.E. (n = 3 plots). Asterisks show the significance of ANOVA tests: * p < 0.05 and ns, not significant. Different letters show significant differences among treatments in each date (p < 0.05, Tukey test).
3.3. Parameterization of Stomatal Conductance Model
The gmax value was 300, 240, and 140 mmol m−2 s−1 in A. glutinosa, S. aucuparia, and V. myrtillus, respectively (Table 2 and Figure 5). The fmin values were similar in all three species, i.e., 0.13 to 0.17. The response of gs to PPFD (flight) indicated that V. myrtillus had a higher a value (0.0104) relative to A. glutinosa (0.0024) and S. aucuparia (0.0043). The optimal temperature for stomatal opening was 20 to 30 °C in all species. A VPD higher than around 1 kPa induced stomatal closure regardless of the species. The fphen values peaked from June to August in all three species. Estimated gs values were in good agreement with the measured values as confirmed by the coefficient of determination (R2 = 0.46 to 0.61) and root mean square error (RMSE = 31 to 57 mmol O3 m−2 s−1) (Figure S1).
Table 2.
Summary of parameters in the DO3SE stomatal conductance model for Alnus glutinosa, Sorbus aucuparia, and Vaccinium myrtillus.
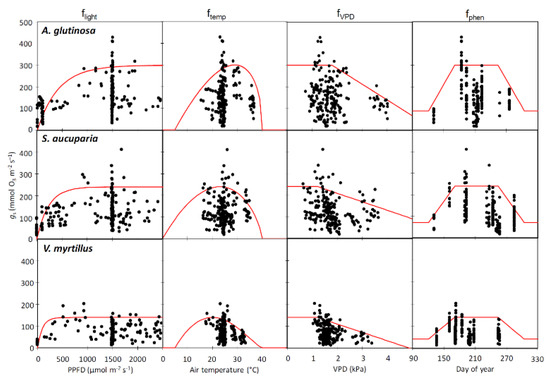
Figure 5.
Parameterization of flight, ftemp, fVPD, and fphen in stomatal conductance model for Alnus glutinosa, Sorbus aucuparia, and Vaccinium myrtillus exposed to three levels of O3 concentration (AA, ambient O3 concentration 1.5 × AA, and 2.0 × AA). Red lines show model functions and black points show measured stomatal conductance.
3.4. Dose-Response Relationship for Plant Injury Index
In A. glutinosa, the first criterion (Y-intercept = 0 included in C.I.) was reached in the regressions between PII and AOT40 or POD0−7. Among these indices, POD7 had the highest R2 (0.54) (Table S1). On the one hand, the CL corresponding to PII = 5 based on POD7 was 8.1 mmol m−2 (Figure 6) and, on the other hand, the AOT40-based CL was 33 ppm·h. In S. aucuparia, the first criterion was achieved for AOT40 and POD0−5.5. The highest R2 value was found in POD0 (0.87). The CLs in this species were found to be 22 mmol m−2 POD0 and 30 ppm·h AOT40. In V. myrtillus, the first criterion was achieved for AOT40 and POD1−4. POD1 had the highest R2 value (0.82), while the exposure-based index AOT40 performed equally well (R2 = 0.81). The CLs was 5.8 mmol m−2 POD1 and 20 ppm·h AOT40 in this species.
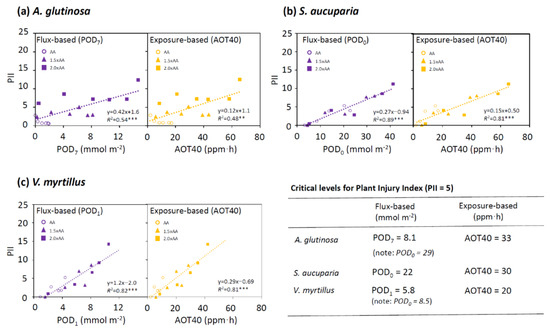
Figure 6.
Dose-response relationships for plant injury index (PII) in Alnus glutinosa, Sorbus aucuparia, and Vaccinium myrtillus using two O3 indices, PODY (phytotoxic ozone dose above a flux threshold of Y nmol m−2 s−1) and AOT40 (accumulated exposure over a threshold of 40 ppb). The critical levels (CLs) corresponding to PII = 5 were also shown. Simple linear regressions were applied. *** p < 0.001 and ** p < 0.01.
4. Discussion
4.1. New DO3SE Parameterization in Three Deciduous Tree Species
An accurate parameterization of the gs model is essential to develop a flux-based approach for O3 risk assessment [26,28]. The model performance with new parameterization was comparable to that in previous studies [26,29]. A comparison of the three target species showed that the gmax value was relatively high in A. glutinosa (300 mmol m−2 s−1) as compared with the other species (S. aucuparia, 240 mmol m−2 s−1 and V. myrtillus, 140 mmol m−2 s−1). This value was within the range for a previous field observation of this species (170 to 380 mmol m−2 s−1) [30,31,32]. A high gs enhanced stomatal O3 uptake, thus, leading to higher O3 damage [15]. The level of gmax in A. glutinosa was comparable to that of the other O3-sensitive species such as Oxford poplar clone (340 to 520 mmol m−2 s−1) [27,33] and Fagus crenata (315 mmol m−2 s−1) [34,35].
Interestingly, the parameter a, in the flight function, was relatively high in V. myrtillus among the three species, suggesting a lower light saturating point of gs. Karlsson, 1987 [36] and Gerdol et al., 2000 [37] reported a relatively low light saturating point of photosynthesis (200 to 300 μmol m−2 s−1 of PPFD) in this species. V. myrtillus is known as a shade tolerant species [38] while the other two species are light demanding [39,40]. In fact, a high a value in flight function was found in other shade tolerant species such as F. crenata (a = 0.0086) [34], while a lower a was obtained in a light-demanding poplar clone (Populus maximowiczii Henry x berolinensis Dippel, a = 0.0020) [27].
In the afternoon, a high VPD often closes stomata together with high air temperature [41]. This was supported by the parameters in fVPD and ftemp for the three species. In fact, gs was decreased by 29%, 29%, and 49%, in A. glutinosa, S. aucuparia, and V. myrtillus, respectively, when VPD reached 3 kPa. In addition, gs was decreased by 13%, 38%, and 68%, in A. glutinosa, S. aucuparia, and V. myrtillus, respectively, when air temperature reached 35 °C. Since ambient O3 concentrations were elevated in the afternoon, those functions were fundamental for the stomatal O3 flux calculation [28].
4.2. Flux-Based Assessment of Ozone Visible Injury
The foliar symptoms of A. glutinosa, S. aucuparia, and V. myrtillus in this experiment were similar to those observed in the field at ambient O3 levels [8]. The first foliar symptoms were observed in May in all species exposed to 2.0 × O3. The onset occurred at 5 to 9 ppm·h AOT40. This is supported by the findings in previous studies where 5 to 10 ppm∙h AOT40 caused an emergence of O3 visible injury for sensitive tree species such as F. sylvatica [11]. In addition, the present study found that approximately 4 mmol m−2 POD0 was enough to cause the onset of O3 visible injury regardless of tree species. A. glutinosa with a high gmax quickly reached this critical point of POD0 and showed the first symptom earlier than the other two species. In species with a high gs, the O3 dose can easily exceed the metabolic capacity for detoxification, and therefore can quickly cause O3 visible injury [42].
After the onset, the O3 visible injury expanded to the plant level in all three species as confirmed by the increase in PII values. The increases of PII were well correlated with flux-based indices (PODY) in each species. The PODY showed a higher R2 than AOT40, suggesting that PODY was better than AOT40 to assess PII. This is supported by the fact that O3 impacts are more closely related to O3 uptake than to external O3 exposure [15]. Previous studies suggested a threshold Y as an assumed threshold below which stomatal O3 flux by the plant may be detoxified [16]. The result shows that Y was relatively higher in A. glutinosa (Y = 7) as compared with other two species (Y = 0 to 1). This suggests that A. glutinosa can have a higher capacity for O3 detoxification than the other two species, although this species had a high stomatal O3 uptake.
Sicard et al., 2016 [17] indicated that 22 mmol m−2 of POD0 corresponded to 5% visible injury in O3-sensitive deciduous F. sylvatica according to field measurements. Our results in A. glutinosa and S. aucuparia support their findings because the CLs corresponding to PII = 5 on the basis of POD0 were 22 and 29 mmol m−2 in A. glutinosa and S. aucuparia, respectively. However, the CL in V. myrtillus was much lower than that of the other two species. On the basis of PII, V. myrtillus was more sensitive to O3 than A. glutinosa and S. aucuparia. This is because V. myrtillus had a dramatic increase in PII from June to July. Although it had a relatively low gs and thus low stomatal O3 uptake, this species was highly susceptible to O3 in these months. V. myrtillus had a vegetative stage in May and then flowering and fruiting stages from June to July [43]. In fact, previous studies found that the capacity to detoxify O3 was lower when the plants were flowering or producing fruits [44,45,46].
The seasonal dynamics of PII differed among the species. In S. aucuparia and V. myrtillus, the PII values showed a monotonic increase, while A. glutinosa had a rather constant PII during June to August. Novak et al., 2003 [13] reported that several species (Populus nigra, Prunus avium, and Salix alba) similarly had a leveling or even decreasing trend of total injured leaf area during the season. In general, O3 visible injury usually appears on older leaves [4]. However, new leaf formation in A. glutinosa was significantly increased by elevated O3, while damaged old leaves were shed. This new leaf growth can alleviate the expansion of O3 visible injury at the plant level in A. glutinosa. An accelerated leaf turnover can be considered as a compensation response to O3 stress in plants with indeterminate growth pattern [20]. However, PII in 2.0 × AA was still significantly higher than that in AA in A. glutinosa, suggesting that such leaf growth did not fully compensate for the O3 damage.
5. Conclusions
The present O3 FACE experiment successfully confirmed O3 visible injury in three cool-temperate deciduous tree species, A. glutinosa, S. aucuparia, and V. myrtillus. The onset of O3 visible injury in these species required 4.0 mmol m−2 POD0 and 5.5 to 9.0 ppm·h AOT40. The timing of the first symptom onset among the species was determined by the amount of stomatal O3 uptake. The early emergence of O3 visible injury in A. glutinosa was related to high gs; however, PII was affected not only by stomatal O3 uptake but also by other species-specific ecophysiological traits. The dynamics of PII suggest that an increased fructification (flowering, fruiting) can weaken the state of the V. myrtillus tree, then, finally the trees can be more sensitive to O3 [47]. In addition, PII values in A. glutinosa were affected by its indeterminate growth pattern, and a new leaf formation alleviated the expansion of O3 visible injury at the plant level in this species. Nevertheless, O3 impacts on PII were better explained by the flux-based index, PODY, than by the exposure-based index, AOT40, especially in A. glutinosa, although it changed in a complex manner. The CLs corresponding to PII = 5 were 8.1 mmol m−2 POD7 in A. glutinosa, 23 mmol m−2 POD0 in S. aucuparia, and 5.8 mmol m−2 POD1 in V. myrtillus.
Forest trees also suffer from other climate change factors such as elevated CO2, nitrogen deposition, warming, the risk of flooding, drought, and forest fire [42]. The interactions between O3 and other climate change factors are crucial to establish the species-specific O3 flux-effect relationship for the O3 risk assessment.
Supplementary Materials
The following are available online at https://www.mdpi.com/1999-4907/11/1/82/s1, Figure S1: Comparison between measured and estimated gs in Alnus glutinosa, Sorbus aucuparia and Vaccinium myrtillus. Table S1: Summary for R2 and the information of confidential interval (C.I.) in exposure or flux-based dose-response functions for plant injury index (PII).
Author Contributions
Y.H., P.S., A.D.M., and E.P. conceived the study; Y.H. and E.C. carried out the experiment and collected the data; Y.H., B.M. and S.M. undertook the statistical analyses. All authors were involved in writing the paper, although Y.H. took a lead role. All authors have read and agreed to the published version of the manuscript.
Funding
We are grateful for the financial support to the MITIMPACT project (INTERREG V A—Italy—France ALCOTRA), Fondazione Cassa di Risparmio di Firenze (2013/7956), and the LIFE project MOTTLES (LIFE15 ENV/IT/000183) of the European Commission.
Acknowledgments
We thank Alessandro Materassi, Gianni Fasano, and Francesco Sabatini for maintenance of the ozone FACE; Moreno Lazzara and Iacopo Manzini for support during field work.
Conflicts of Interest
The authors declare no conflict of interest.
References
- Grulke, N.E.; Heath, R.L. Ozone effects on plants in natural ecosystems. Plant Biol. 2019. [Google Scholar] [CrossRef] [PubMed]
- Lefohn, A.S.; Malley, C.S.; Smith, L.; Wells, B.; Hazucha, M.; Simon, H.; Naik, V.; Mills, G.; Schultz, M.G.; Paoletti, E.; et al. Tropospheric ozone assessment report: Global ozone metrics for climate change, human health, and crop/ecosystem research. Elem. Sci. Anthr. 2018, 6, 28. [Google Scholar] [CrossRef] [PubMed]
- Mills, G.; Pleijel, H.; Malley, C.S.; Sinha, B.; Cooper, O.; Schultz, M.; Neufeld, H.S.; Simpson, D.; Sharps, K.; Feng, Z.; et al. Tropospheric Ozone Assessment Report: Present day tropospheric ozone distribution and trends relevant to vegetation. Elem. Sci. Anthr. 2018, 6, 47. [Google Scholar] [CrossRef]
- Paoletti, E.; Ferrara, A.M.; Calatayud, V.; Cerveró, J.; Giannetti, F.; Sanz, M.J.; Manning, W.J. Deciduous shrubs for ozone bioindication: Hibiscus syriacus as an example. Environ. Pollut. 2009, 157, 865–870. [Google Scholar] [CrossRef]
- Hoshika, Y.; Omasa, K.; Paoletti, E. Whole-tree water use efficiency is decreased by ambient ozone and not affected by O3-induced stomatal sluggishness. PLoS ONE 2012, 7, e39270. [Google Scholar] [CrossRef]
- Innes, J.L.; Skelly, J.M.; Schaub, M. Ozone and broadleaved species. In A Guide to the Identification of Ozone-Induced Foliar Injury; Paul Haupt Verlag: Bern, Switzerland, 2001. [Google Scholar]
- Feng, Z.; Sun, J.; Wan, W.; Hu, E.; Calatayud, V. Evidence of widespread ozone-induced visible injury on plants in Beijing, China. Environ. Pollut. 2014, 193, 296–301. [Google Scholar] [CrossRef]
- Paoletti, E.; Alivernini, A.; Anav, A.; Badea, O.; Carrari, E.; Chibulescu, S.; Conte, A.; Ciriani, M.L.; Dalstein-Richier, L.; De Marco, A.; et al. Toward stomatal–flux based forest protection against ozone: The MOTTLES approach. Sci. Tot. Environ. 2019, 691, 516–527. [Google Scholar] [CrossRef]
- Fuhrer, J.; Skärby, L.; Ashmore, M.R. Critical levels for ozone effects on vegetation in Europe. Environ. Pollut. 1997, 97, 91–106. [Google Scholar] [CrossRef]
- Hůnová, I.; Schreiberová, M. Ambient ozone phytotoxic potential over the Czech forests as assessed by AOT40. iForest Biogeosci. For. 2012, 5, 153–162. [Google Scholar] [CrossRef]
- Baumgarten, M.; Werner, H.; Häberle, K.-H.; Emberson, L.D.; Fabian, P.; Matyssek, R. Seasonal ozone response of mature beech trees (Fagus sylvatica) at high altitude in the Bavarian forest (Germany) in comparison with young beech grown in the field and in phytotrons. Environ. Pollut. 2000, 109, 431–442. [Google Scholar] [CrossRef]
- Van der Heyden, D.; Skelly, J.; Innes, J.; Hug, C.; Zhang, J.; Landolt, W.; Bleuler, P. Ozone exposure thresholds and foliar injury on forest plants in Switzerland. Environ. Pollut. 2001, 111, 321–331. [Google Scholar] [CrossRef]
- Novak, K.; Skelly, J.M.; Schaub, M.; Kräuchi, N.; Hug, C.; Landolt, W.; Bleuler, P. Ozone air pollution and foliar injury development on native plants of Switzerland. Environ. Pollut. 2003, 125, 41–52. [Google Scholar] [CrossRef]
- Calatayud, V.; Cerveró, J.; Sanz, M.J. Foliar, physiological and growth responses of four maple species exposed to ozone. Wat. Air Soil Pollut. 2007, 185, 239–254. [Google Scholar] [CrossRef]
- Paoletti, E. Ozone impacts on forests. In CAB Reviews: Perspectives in Agriculture, Veterinary Science, Nutrition and Natural Resources; CABI: Wallingford, UK, 2007. [Google Scholar]
- CLRTAP. Mapping Critical Levels for Vegetation, Chapter III of Manual on methodologies and criteria for modelling and mapping critical loads and levels and air pollution effects, risks and trends, 2017. In UNECE Convention on Long-Range Transboundary Air Pollution; Programme Coordinating Centre, Federal Research Centre for Forestry and Forest Products: Hamburg, Germany, 2017; Available online: www.icpmapping.org (accessed on 8 November 2019).
- Sicard, P.; De Marco, A.; Dalstein-Richier, L.; Tagliaferro, F.; Paoletti, E. An epidemiological assessment of stomatal ozone flux-based critical levels for visible ozone injury in Southern European forests. Sci. Tot. Environ. 2016, 541, 729–741. [Google Scholar] [CrossRef]
- Paoletti, E. Impact of ozone on Mediterranean forests: A review. Environ. Pollut. 2006, 144, 463–474. [Google Scholar] [CrossRef]
- Schaub, M.; Calatayud, V. Assessment of visible foliar injury induced by ozone. In Forest Monitoring: Methods for Terrestrial Investigations in Europe with an Overview of North America and Asia; Ferretti, M., Fischer, R., Eds.; Elsevier: London, UK, 2013; pp. 205–221. [Google Scholar]
- Pell, E.J.; Brendley, B.W.; Sinn, J.P. Ozone-induced accelerated foliar senescence: Implications for toxicity and compensation. In Proceedings 1995 Meeting of the Northern Global Change Program; Hom, J., Birdsey, R., O’Brian, K., Eds.; Gen. Tech. Rep. NE-214; U.S. Department of Agriculture, Forest Service, Northeastern Forest Experiment Station: Radnor, PA, USA, 1996; pp. 13–19. [Google Scholar]
- Hoshika, Y.; De Carlo, A.; Baraldi, R.; Neri, L.; Carrari, E.; Agathokleous, E.; Zhang, L.; Fares, S.; Paoletti, E. Ozone-induced impairment of night-time stomatal closure in O3-sensitive poplar clone is affected by nitrogen but not by phosphorus enrichment. Sci. Tot. Environ. 2019, 692, 713–722. [Google Scholar] [CrossRef]
- Vogel, C.S.; Curtis, P.S.; Thomas, R.B. Growth and nitrogen accretion of dinitrogen-fixing Alnus glutinosa (L.) Gaertn. under elevated carbon dioxide. Plant Ecol. 1997, 130, 63–70. [Google Scholar] [CrossRef]
- Heide, O.M. Temperature rather than photoperiod controls growth cessation and dormancy in Sorbus species. J. Exp. Bot. 2011, 62, 5397–5404. [Google Scholar] [CrossRef]
- Selås, V.; Sønsteby, A.; Heide, O.M.; Opstad, N. Climatic and seasonal control of annual growth rhythm and flower formation in Vaccinium myrtillus (Ericaceae), and the impact on annual variation in berry production. Plant Ecol. Evolut. 2015, 148, 350–360. [Google Scholar] [CrossRef]
- Paoletti, E.; Materassi, A.; Fasano, G.; Hoshika, Y.; Carriero, G.; Silaghi, D.; Badea, O. A new-generation 3D ozone FACE (Free Air Controlled Exposure). Sci. Tot. Environ. 2017, 575, 1407–1414. [Google Scholar] [CrossRef]
- Alonso, R.; Elvira, S.; Sanz, M.J.; Gerosa, G.; Emberson, L.D.; Bermejo, B.; Gimeno, B.S. Sensitivity analysis of a parameterization of the stomatal component of the DO3SE model for Quercus ilex to estimate ozone fluxes. Environ. Pollut. 2008, 155, 473–480. [Google Scholar] [CrossRef] [PubMed]
- Hoshika, Y.; Carrari, E.; Zhang, L.; Carriero, G.; Pignatelli, S.; Fasano, G.; Materassi, A.; Paoletti, E. Testing a ratio of photosynthesis to O3 uptake as an index for assessing O3-induced foliar visible injury in poplar trees. Environ. Sci. Pollut. Res. 2018, 25, 8113–8124. [Google Scholar] [CrossRef] [PubMed]
- Emberson, L.D.; Büker, P.; Ashmore, M.R. Assessing the risk caused by ground level ozone to European forest trees: A case study in pine, beech and oak across different climate regions. Environ. Pollut. 2007, 147, 454–466. [Google Scholar] [CrossRef] [PubMed]
- Xu, Y.; Shang, B.; Yuan, X.; Feng, Z.; Calatayud, V. Relationships of CO2 assimilation rates with exposure- and flux-based O3 metrics in three urban tree species. Sci. Tot. Environ. 2018, 613–614, 233–239. [Google Scholar] [CrossRef]
- Oleksyn, J.; Karolewski, P.; Giertych, M.J.; Zytkowiak, R.; Reich, P.B.; Tjoelker, M.G. Primary and secondary host plants differ in leaf-level photosynthetic response to herbivory: Evidence from Alnus and Betula grazed by the alder beetle, Agelastica alni. New Phytol. 1998, 140, 239–249. [Google Scholar] [CrossRef]
- Kučerová, A.; Pokorný, J.; Radoux, M.; Nemcova, M.; Cadelli, D.; Dušek, J. Evapotranspiration of small-scale constructed wetlands planted with ligneous species. In Transformations of Nutrients in Natural and Constructed Wetlands; Vymazal, J., Ed.; Backhuys Publishers: Kerkwerve, The Netherlands, 2001; pp. 413–427. [Google Scholar]
- Kupper, P.; Ivanova, H.; Söber, A.; Rohula-Okunev, G.; Sellin, A. Night and daytime water relations in five fast-growing tree species: Effects of environmental and endogenous variables. Ecohydrology 2017, 11, e1927. [Google Scholar] [CrossRef]
- Marzuoli, R.; Gerosa, G.; Desotgiu, R.; Bussotti, F.; Ballarin-Denti, A. Ozone fluxes and foliar injury development in the ozone-sensitive poplar clone Oxford (Populus maximowiczii x Populus berolinensis). Tree Physiol. 2009, 29, 67–76. [Google Scholar] [CrossRef]
- Hoshika, Y.; Watanabe, M.; Inada, N.; Koike, T. Modeling of stomatal ozone conductance for estimating ozone uptake of Fagus crenata under experimentally enhanced free-air ozone exposure. Wat. Air Soil Pollut. 2012, 223, 3893–3901. [Google Scholar] [CrossRef]
- Hoshika, Y.; Watanabe, M.; Inada, N.; Koike, T. Effects of ozone-induced stomatal closure on ozone uptake and ist changes due to leaf age in sun and shade leaves of Siebold’s beech. J. Agric. Meteorol. 2015, 71, 218–226. [Google Scholar] [CrossRef]
- Karlsson, P.S. Niche differentiation with respect to light utilization among coexisting dwarf shrubs in a subarctic woodland. Polar Biol. 1987, 8, 35–39. [Google Scholar] [CrossRef]
- Gerdol, R.; Iacumin, P.; Marchesini, R.; Bragazza, L. Water- and nutrient-use efficiency of a deciduous species, Vaccinium myrtillus, and an evergreen species, V. vitis-idaea, in a subalpine dwarf shrub heath in the southern Alps, Italy. Oikos 2000, 88, 19–32. [Google Scholar] [CrossRef]
- Tonteri, T.; Salemaa, M.; Rauto, P.; Hallikainen, V.; Korpela, L.; Merilä, P. Forest management regulates temporal change in the cover of boreal plant species. For. Ecol. Manag. 2016, 381, 115–124. [Google Scholar] [CrossRef]
- Claessens, H.; Oosterbaan, A.; Savill, P.; Rondeux, J. A review of the characteristics of black alder (Alnus glutinosa (L.) Gaertn.) and their implications for silvicultural practices. Forestry 2010, 83, 163–175. [Google Scholar] [CrossRef]
- Giertych, M.; Karolewski, P.; Oleksyn, J. Carbon allocation in seedlings of deciduous tree species depends on their shade tolerance. Acta Physiol. Plant. 2015, 37, 216. [Google Scholar] [CrossRef]
- Larcher, W. Physiological Plant Ecology, 4th ed.; Springer: New York, NY, USA, 2003. [Google Scholar]
- Matyssek, R.; Clarke, N.; Cudlin, P.; Mikkelsen, T.N.; Tuovinen, J.P.; Wieser, G.; Paoletti, E. Climate Change, Air Pollution and Global Challenges: Understanding and persPectives from Forest Research. In Developments in Environmental Science; Elsevier: Amsterdam, The Netherlands, 2013; 622p. [Google Scholar]
- Pellegrini, E.; Hoshika, Y.; Paoletti, E. Ozone effects on the quality of Common Bilberry fruits. Unpublished work.
- Vandermeiren, K.; De Temmerman, L.; Hookham, N. Ozone sensitivity of Phaseolus vulgaris in relation to cultivar differences, growth stage and growing conditions. Wat. Air Soil Pollut. 1995, 85, 1455–1460. [Google Scholar] [CrossRef]
- Morgan, P.B.; Ainsworth, E.A.; Long, S.P. How does elevated ozone impact soybean? A meta-analysis of photosynthesis, growth and yield. Plant Cell Environ. 2003, 26, 1317–1328. [Google Scholar] [CrossRef]
- Feng, Z.; Pang, J.; Nouchi, I.; Kobayashi, K.; Yamakawa, T.; Zhu, J. Apoplastic ascorbate contributes to the differential ozone sensitivity in two varieties of winter wheat under fully open-air field conditions. Environ. Pollut. 2010, 158, 3539–3545. [Google Scholar] [CrossRef]
- Braun, S.; Schindler, C.; Rihm, B. Growth trends of beech and Norway spruce in Switzerland: The role of nitrogen deposition, ozone, mineral nutrition and climate. Sci. Tot. Environ. 2017, 599–600, 637–646. [Google Scholar] [CrossRef]
© 2020 by the authors. Licensee MDPI, Basel, Switzerland. This article is an open access article distributed under the terms and conditions of the Creative Commons Attribution (CC BY) license (http://creativecommons.org/licenses/by/4.0/).