Abstract
In recent decades, Norway spruce (Picea abies L. Karst.) forests of the High Tatra Mountains have suffered unprecedented tree mortality caused by European spruce bark beetle (Ips typographus L.). Analysis of the spatiotemporal pattern of bark beetle outbreaks across the landscape in consecutive years can provide new insights into the population dynamics of tree-killing insects. A bark beetle outbreak occurred in the High Tatra Mountains after a storm damaged more than 10,000 ha of forests in 2004. We combined yearly Landsat-derived bark beetle infestation spots from 2006 to 2014 and meteorological data to identify the susceptibility of forest stands to beetle infestation. We found that digital elevation model (DEM)-derived potential radiation loads predicted beetle infestation, especially in the peak phase of beetle epidemic. Moreover, spots attacked at the beginning of our study period had higher values of received solar radiation than spots at the end of the study period, indicating that bark beetles prefer sites with higher insolation during outbreak. We conclude that solar radiation, easily determined from the DEM, better identified beetle infestations than commonly used meteorological variables. We recommend including potential solar radiation in beetle infestation prediction models.
1. Introduction
Massive forest mortality events affecting many tree species in the last two decades have prompted concerns that drought, insects, and wildfire may devastate more forests in the coming decades [1]. Mountain spruce forests (Picea abies L. Karst.) are shaped by disturbances, ranging in severity from low- to stand-replacing. The main drivers of such disturbances in the Carpathians are wind and bark beetle outbreaks [2,3], the latter usually initiated by extreme weather events [4,5] and affected by forest management [6,7,8].
In Europe, the European spruce bark beetle (Ips typographus L.) is an insect species that often reaches epidemic levels [9,10]. Between outbreaks, beetles persist at small endemic populations in scattered refuges of food. When there is a sudden increase in suitable hosts and favorable weather conditions [11,12], they erupt to outbreak numbers [13,14,15]. The heat- and drought-induced physiological stress on trees likely triggers the development of forest insects, such as bark beetles [12,16]. The economic consequences of these types of disturbances are of particular importance, especially in Europe, the USA, Canada, and Russia [17].
European spruce bark beetles mostly colonize trees with impaired defenses and their larvae feed on the phloem and cambium cells, thereby increasing the disruption of phloem tissues [18]. I. typographus creates infestation spots ranging from several neighboring infested trees to large continuous areas of dead mature trees (Figure 1). The needles of beetle-infested trees fade over time, which allows for the identification of infested trees by optical remote sensing methods [19].
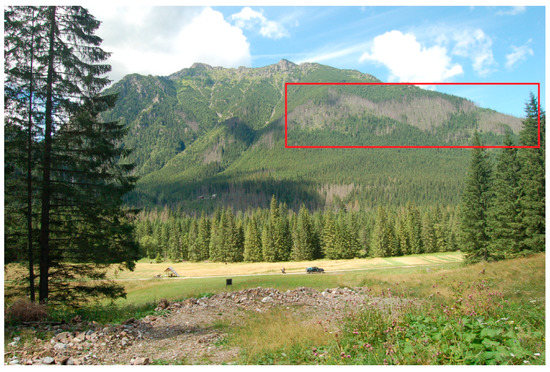
Figure 1.
Example of bark beetle–infested trees in the High Tatra Mountains National Park, Slovakia. Bark beetle-infested trees are in the red rectangle (Photo: Pavel Mezei.).
Although I. typographus is one of the most studied forest insect pests, its spatiotemporal infestation patterns in mountainous forests are not completely understood due to a variety of biotic and abiotic factors and their interactions. Analysis of the spatiotemporal patterns of bark beetle outbreaks across the landscape in several consecutive years can reveal new insights into the drivers of outbreak development [20,21]. Colonization of new hosts by bark beetles is a key process in the response of insect populations to changing environmental conditions and a key driver of population dynamics. Offspring are forced to emerge and forage for new habitats. The higher the number of simultaneously attacking beetles, the higher the chance of overcoming host tree defense mechanisms. However, experiments studying dispersal across space and time are scarce. Population-level dispersal success is strongly environment-dependent [22,23,24]. Favorable microclimatic conditions induced by topography, as well as temperature and sunlight, may enhance the probability of local attack [25,26]. Regarding host selection processes in I. typographus populations, prior studies listed tree vigor and physiology [15,27,28], forest composition and host characteristics [25,29,30], and the distance from previous infestations [31,32] as the most significant factors influencing the probability that a site will be infested. There is evidence that solar radiation affects infestation patterns of I. typographus [26,33,34]. Higher pheromone trap catches at sun-exposed sites [35,36] corresponded to higher infestation occurrences at sun-exposed sites [34,37]. Incoming solar radiation (insolation), received from the sun, is the primary energy source that drives many of the earth’s physical and biological processes. Our previous studies, based on forest inventory data, showed the importance of solar radiation [29] and temperature [38] in triggering I. typographus induced tree mortality. Here, we examine the environmental conditions of spatially explicit locations of infested trees based on Landsat imagery in a national park zone where no sanitary or salvage logging has been applied. A better understanding of the drivers of bark beetle spot occurrence is critical to predict outbreak dynamics and future dynamics of subalpine forests. In this work, we use spatially explicit locations of beetle infestations acquired through remote sensing. We used Landsat-derived beetle infestation spots from 2006 to 2014 in the High Tatra Mountains [39] to quantify the contributions of temperature and radiation to spatiotemporal patterns. Further, we tested the effects of these variables according to individual outbreak phases, i.e., incipient, peak, and decline. Specifically, we sought to answer the following three questions: (1) Do bark beetle spots originate at locations with distinct patterns of temperature conditions or potential solar radiation at a landscape level? (2) Which of the tested variables are linked closer to bark beetle spot occurrence? (3) Are temperature or potential solar radiation patterns of landscapes associated with bark beetle population dynamics according to outbreak phases?
2. Methods
2.1. Study Area
The study area is located in the High Tatra Mountains of Central Europe, the highest mountains in the Carpathians, which extend to 2655 m a.s.l. (Figure 2). The High Tatra Mountains are located on the border between Poland on the north and Slovakia on the south. The studied forests are located in two national parks, Tatrzański Park Narodowy (TPN, Poland) and Tatranský národný park (TANAP, Slovakia). Our study area covers 28,532 ha of forests, dominated mainly by Norway spruce (Picea abies). The codominant tree species is Larix decidua Mill. and admixtures are Pinus sylvestris L. and Abies alba Mill. The ground vegetation is dominated by Vaccinium myrtillus L., V. vitis-idaea L., Calamagrostis villosa, and Homogyne alpina L. Rocky cambisol is the prevailing soil type. Stands are characterized by high altitudinal variability from the lower mountain zone to the timber line, ranging from 700 m to 1700 m above sea level (a.s.l.). The study area is characterized by deep valleys and mountain ridges. Populations of I. typographus in the study area are largely univoltine, although favorable weather conditions may allow beetles to complete a sister generation [38,40,41]. The study area was hit by a storm in 2004, after which the bark beetle outbreak began [42].
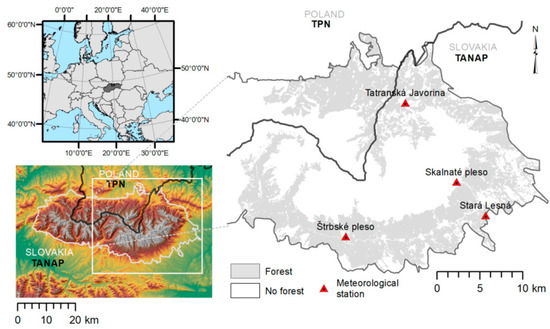
Figure 2.
Location of the study area in the High Tatra Mountains. Grey represents the area of forest cover under our investigation; red triangles represent meteorological stations.
2.2. Meteorological and Topographic Data
To understand the potential effects of temperature on bark beetle spot occurrence, we obtained meteorological data comprising two variables previously identified as important for I. typographus population dynamics, as follows: (1) Mean air temperature sums (ATmeanSum) [43] and (2) maximum daily air temperature sums (ATmaxSum) [38,44]. All variables were calculated from the period from 1 April to 31 October [45]. We consider this temporal window as the main season for bark beetles in Central Europe as, outside this period, the temperatures are frequently beyond the developmental threshold of I. typographus in the study area. Daily mean and maximum air temperatures were estimated using daily regression analysis, which incorporated elevation and relative solar radiation as predictive variables. For each day, we computed a unique set of regression coefficients based on the aggregated hourly temperature data from 4 stations (Table 1). Estimates of maximum and mean air temperatures were then calculated using appropriate daily regression coefficients, elevation, and estimated solar radiation as input variables [45]. The temperature sums were then calculated by adding all daily temperatures in the period from 1 April to 31 October. Topographic data were derived from the digital elevation model (DEM) with a resolution of 30 m (available from Space Shuttle Radar Topography Mission, http://dwtkns.com/srtm30m). We calculated the potential solar radiation (PotRad) (Wh/m2) using the Area Solar Radiation tool (ArcGIS, Esri, Redlands, CA, USA) using the geographical information system. The Area Solar Radiation tool calculates solar insolation across the entire landscape. It accounts site latitude, elevation, steepness (slope) and compass direction (aspect), daily and seasonal shifts of the sun angle, and effects of shadows cast by surrounding topography [46]. The resulting solar radiation neglects local shading conditions by trees. The calculations were repeated for each day on the input topographic surface, producing yearly insolation maps for the entire study period from 1 April to 31 October.

Table 1.
Locations of meteorological stations inside our study area.
2.3. Identification of Bark Beetle Infestation
We used freely available Landsat-based land cover classification for the Tatra Mountains from 2005 to 2014 (30 m resolution, see Reference [42] for details and data availability) to create yearly time series of bark beetle infestation patterns. The land cover classification captures the spatial extent of green intact forests and four disturbances types, as follows: Bark beetle-infested trees, fire, clear-cuts, and windthrows occurring in the Tatra Mountains over the study period. From raster data, we extracted bark beetle infestations spots for each year, which represent accurate fine-grain (30 × 30 m) records of the spatiotemporal development of tree mortality due to I. typographus outbreak [42]. We further reclassified beetle infestation data into two categories for each year in our 10-year period, as follows: Pixels infested by bark beetles (1) and forest (0). Pixels infested by bark beetles in year, T, were removed from the raster layer of the subsequent year, T+1.
2.4. Statistical Analysis
A set of a priori models [47] was selected prior to analysis. These models were constructed using climatic variables (ATmeanSum, ATmaxSum, and PotRad) identified as important for bark beetle population dynamics in order to test which one would best explain the infestation pattern of I. typographus. As these three variables highly correlated to each other, we have not used them in multivariate modelling. We divided our analysis into two parts. In the first part, we compared three models where we extracted cell values from raster images of infestations for each year (0, not infested; 1, infested) and cell values from rasters of temperature and potential solar radiation for each aligning pixel for the same year. We used logistic regression [48] and the glm function in R [49] to model the relationship between infestation spots and predictor variables. The information-theory (I-T) approach [50,51] was used to assess three competing models. Apart from selecting the most parsimonious model, I-T model selection also arranges models in order of parsimony. Models were ranked according to the Akaike information criterion (AIC); the most parsimonious model was selected based on the lowest AIC value [47]. We also calculated Akaike weights to arrange candidate models in order of parsimony, where Akaike weight is a number from 0 to 1, providing a measure of the relative likelihood of each model, given the data and candidate model set. For comparison, we included the intercept-only model as a baseline [50]. In the second part of our analysis, we worked with the predictor variable, which was fitted as the most parsimonious according to the above-mentioned criteria. This comprised the analysis of average solar radiation and meteorological values of infested vs. non-infested pixels for each year in the study area. We calculated the average value of the selected meteorological or topographic variables for infested and non-infested pixels for each year and used the Shapiro–Wilks test to test for normality of the data for the whole outbreak period and for particular outbreak phases. We compared the two groups by Analysis of Variance (ANOVA) in case of normality and by the nonparametric Mann–Whitney U test in cases of data deviating from normality. We did this comparison according to outbreak phases and for the whole study period.
3. Results
During the study period (2005–2014), 8945 out of the 28,532 ha of forest was infested by bark beetles (Figure 3a). The first infestations detected by Landsat started in 2006 and the yearly average infested area by bark beetles reached 993 ha. Based on the amount of infested trees, we identified years 2005 and 2006 as the incipient phase (n = 2), 2007 to 2010 as the peak phase (n = 4), and 2011 to 2014 (n = 4) as the decline phase of the epidemics.
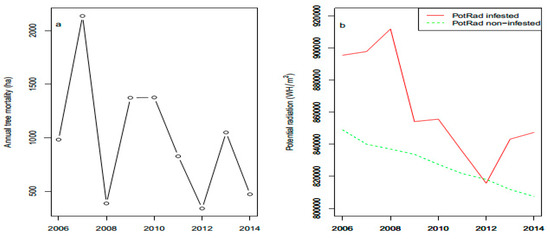
Figure 3.
Time series of bark beetle infestations (a) and potential radiation of infested and non-infested pixels from 1 April to 31 October in the High Tatra Mountains, 2006–2014 (b).
3.1. Environmental Drivers of Insect Infestation
We used logistic regression to model the relationships between the occurrences of bark beetle spots and each of the explanatory variables’ maximum temperature sums, mean temperature sums, and potential radiation. We did not create multivariate logistic regression models, since there was a high level of correlation among the three explanatory variables (r2 > 0.70). Instead, we used each variable separately in univariate regression models to analyze their individual relationship with bark beetle spot occurrences in order to identify the best meteorological predictor. According to the I-T approach, the most parsimonious model was the one with the lowest AIC number and the highest Akaike weight, which was model 3 (Table 2). Potential radiation was the best explanatory variable for I. typographus infestations in a mountainous terrain.
Table 2.
Model formula and Akaike information criterion (AIC) for the four fitted logistic regression models selected for 2005 to 2014 in the High Tatra Mountains. I signifies infestation by bark beetles; * intercept-only model.
3.2. Infested vs. Noninfested Spots
We found significant differences between potential radiation of infested vs. noninfested pixels for the whole outbreak period (Figure 4a), as well as for the peak and decline phases (Figure 4b,c). Pixels of infested forests derived from Landsat satellite images received higher loads of solar radiation from 1 April to 31 October than non-infested forests (Figure 3b).
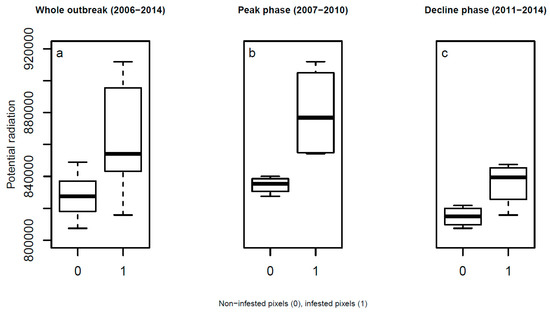
Figure 4.
Comparison of potential solar radiation of pixels with noninfested and infested trees during the (a) whole bark beetle outbreak (Mann–Whitney U Test: W = 12, p = 0.01), (b) the peak phase (ANOVA, F = 9.18, p = 0.02) and (c) the decline phase (ANOVA, F = 7.21, p = 0.0363) in the High Tatra Mountains.
ATmeanSum and ATmaxSum showed weaker effects on bark beetle spot occurrence (p = 0.06 and 0.07 for the whole period; graphs not shown) than PotRad, which is in agreement with the model selection results (Table 2). We did not report the incipient-epidemic phase because it only had two years, which was not sufficient to perform the analysis.
Of all the involved outbreak phases, the peak phase showed the strongest response of bark beetle spots to potential solar radiation (Figure 4b). The post-epidemic phase of an outbreak also showed differences between infested and noninfested spots of forests (Figure 4c). The time series of potential radiation of bark beetle infestation spots indicates that bark beetles infested the most sun-exposed sites at the beginning of an outbreak (Figure 3b). Infestations started at sun-exposed sites and moved to less sun-exposed areas.
4. Discussion
In recent decades, forests of the High Tatra Mountains have been subjected to large-scale windfall episodes and bark beetle outbreaks. In 2004, a 2.5 million m3 storm felling occurred and I. typographus used the wind-felled trees to build up their population during the first two seasons after the storm [13]. Our study examined bark beetle infestations in a national park zone, where no sanitary or salvage logging was applied, from 2005 to 2014. Newly infested bark beetle spots occurred each year during this period. Previous studies reported higher bark beetle activity with incoming potential solar radiation [26,36]. Our results show that bark beetle spots occurred in sites with higher potential solar radiation loads, especially during peak and decline outbreak phases. Both our analysis approaches (Table 2, Figure 4a–c) show that the occurrence of beetle spots was driven by potential solar radiation.
Bark beetle infestation spots showed a preference for sites with higher potential solar radiation loads (Figure 4a–c). Bark beetle physiology, reproduction, and population dynamics are mainly climate- and temperature-driven [9,41,52]. Other factors, such as natural enemies [35,53] were not considered in this study, mainly due to the lack of data on natural enemies at the landscape scale. In our case, potential solar radiation was shown to be more related to infestation patterns of I. typographus than the interpolated meteorological variables’ mean or maximum temperature sums. We attribute this finding to the effect of solar radiation on microclimatic conditions, especially bark temperatures, for the beetle development and the attractiveness of trees to bark beetles [34,36,45]. Important to note is the possible inhibitory effect of very high temperatures on bark beetle development. The lower developmental threshold is 8.3 °C, whereas temperatures above 38.9 °C inhibit beetle development [54]. The average temperatures of stems in the study area are reported to be in the range suitable for bark beetle development [55].
It has been assumed that a stressed physiological state of trees leads to outbreaks of phloem-feeding insects, since impaired protein synthesis can lead to increased nitrogen compounds in phloem and the attractiveness of phloem increases. If phloem transport ceases, the plant might die, because carbon cannot be delivered to tissues of infested trees [18,30,56]. Forest decline events are particularly sensitive to temperature [57] and topographic exposure and south- and west-facing trees encounter an enhanced probability of bark beetle damage [58].
Landscape-scale analysis of mountain pine beetle outbreaks showed that bark beetle occurrence is strongly affected by heat [44,59]. Outbreaks of cambium-feeding beetles follow droughts [27] and often become more severe in overmature trees under stress [56]. In the High Tatras, Norway, spruce is a naturally dominant tree species, with examples of old-growth mountain spruce forests in harsh conditions. Our hypothesis offers an explanation for the initiation of beetle infestation spots, which occurred at sites with the highest levels of incoming solar radiation. The association between bark beetle spots and radiation observed here supports the idea that stressed trees may promote the rapid growth of bark beetle populations. Drought is regarded as a main stressor triggering the development of epidemic bark beetle populations [28,60,61]. While we did not directly measure drought indices, we note that higher radiation is usually associated with warmer temperatures, which tend to co-occur with drought.
Topography is a major factor determining the the spatial variability of insolation over the landscape. Variation in elevation, orientation (slope and aspect), and shadows cast by topographic features all affect the amount of insolation received at different locations. This variability also changes with the time of day and the time of year and, in turn, contributes to the variability of the microclimate, including factors such as air and soil temperature regimes, evapotranspiration, snow melt patterns, soil moisture, and light available for photosynthesis. Higher levels of incoming radiation facilitate insect development [54,62]. Using potential solar radiation as one of the factors affecting the occurrence of bark beetle spots offers an alternative to direct measurement of variables on the landscape scale. Forest practitioners and managers are often in situations where they need to decide on future management actions. Although several decision-support systems for bark beetles exist [24,45,63,64,65], they are often not available in particular countries or require extensive data, programming skills, or software. Calculation of potential solar radiation is widely available in most geographical information systems [66] and can provide a fast method for selecting the most exposed sites for potential future bark beetle infestations on a landscape scale. Solar radiation can easily be integrated with other GIS data and can help model physical and biological processes as they are affected by the sun.
Contrary to the expectation that warmer temperatures would favor bark beetle outbreaks [65], bark beetle spot occurrence was not strongly linked to temperature sums, although we were not able to test the effect of daily temperatures on the emergence (swarming) of beetles. Mean and maximum temperature sums proved to be less connected to bark beetle spots than potential solar radiation. In the analysis of infestation phases and infested vs. noninfested pixels, both meteorological variables reached very small p-values, on the margin of statistical significance (p < 0.1). We do not consider these results trivial and we think they should not be dismissed because of their “nonsignificance” [67]. The statistical modeling was based on data on bark beetle infestations from Landsat satellite images, while air temperatures were interpolated for the whole landscape from the available meteorological stations. We think that a p-value slightly above the 0.05 threshold can have biological meaning, which is supported by other studies [68]. An insufficient number of meteorological stations may be one reason for the finding that potential radiation outperformed temperature sums and our previous findings related to the importance of maximum temperature sums [38]. As temperature parameters are biologically viable, they should not be excluded in future research; they just were not among those chosen as the best representatives for describing bark beetle-infested spots in the study area.
Forest naturalness can also play part in the susceptibility of trees to bark beetles [69]. Most of our study area consisted of near-natural forests at higher elevations. Slope class and soil type can be used to assess the susceptibility of trees to bark beetles when meteorological data are not available [70].
5. Conclusions
We found that initiation of beetle infestation spots strongly depends on solar radiation loads, especially during peak and decline phases of beetle outbreak. While previous findings emphasized the importance of climate variables on bark beetle population dynamics, our results highlight the applicability of easily GIS-derived solar radiation maps to predict the incidence of beetle infested trees during the peak and decline phase of I. typographus beetle outbreaks. Our simple approach might help forest practitioners identify places with the highest risks of beetle infestations in following years.
Forest managers could use solar radiation information to pro-actively monitor sun-exposed stands or stands adjacent to clear-cuts and edges to improve the efficacy of detection and mitigation to slow down the development of bark beetle outbreaks. A positive response of bark beetle spots to solar radiation at the landscape scale has been clearly demonstrated in this study. The fundamental mechanisms underlying the responses of trees and insects should be fully explored by studying the distribution of radiation in forests and its effect on individual trees by examining the behavioral responses of beetles.
Author Contributions
Conceptualization, P.M.; Methodology, P.M., M.P., J.G.R., and R.J.; Formal Analysis, P.M.; Data Curation, M.P. and J.Š.; Writing—Original Draft Preparation, P.M.; Writing—Review and Editing, P.M., M.P., J.G.R., J.Š., and R.J.; Visualization, P.M. and M.P.; Supervision, R.J.; Project Administration, J.Š.; Funding Acquisition, P.M., R.J. and J.Š.
Funding
This study was made possible by generous funding and support from the Schwarz Fund of the Slovak Academy of Sciences and as part of the projects of the Slovak Research and Development Agency under contracts APVV-15-0425, APVV-18-0347, and VEGA 02/0053/14 and the Ministry of Education, Science, Research and Sport of the Slovak Republic and the Slovak Academy of Sciences, contract 1-0500-19.
Acknowledgments
In addition to the funding sources listed above, we would like to acknowledge the current and past colleagues who assisted with data gathering, management, and analysis. Special thanks go to Sigrid Netherer for her valuable comments on an earlier version of the manuscript.
Conflicts of Interest
The authors declare no conflict of interest.
References
- Seidl, R.; Thom, D.; Kautz, M.; Martin-Benito, D.; Peltoniemi, M.; Vacchiano, G.; Wild, J.; Ascoli, D.; Petr, M.; Honkaniemi, J.; et al. Forest disturbances under climate change. Nat. Clim. Chang. 2017, 7, 395–402. [Google Scholar] [CrossRef] [PubMed]
- Holeksa, J.; Jaloviar, P.; Kucbel, S.; Saniga, M.; Svoboda, M.; Szewczyk, J.; Szwagrzyk, J.; Zielonka, T.; Żywiec, M. Models of disturbance driven dynamics in the West Carpathian spruce forests. For. Ecol. Manag. 2017, 388, 79–89. [Google Scholar] [CrossRef]
- Janda, P.; Trotsiuk, V.; Mikoláš, M.; Bače, R.; Nagel, T.A.; Seidl, R.; Seedre, M.; Morrissey, R.C.; Kucbel, S.; Jaloviar, P.; et al. The historical disturbance regime of mountain Norway spruce forests in the Western Carpathians and its influence on current forest structure and composition. For. Ecol. Manag. 2017, 388, 67–78. [Google Scholar] [CrossRef] [PubMed]
- Rouault, G.; Candau, J.; Lieutier, F.; Nageleisen, L.; Martin, J.; Warzee, N. Effects of drought and heat on forest insect populations in relation to the 2003 drought in Western Europe. Ann. For. Sci. 2006, 63, 613–624. [Google Scholar] [CrossRef]
- De Groot, M.; Ogris, N.; Kobler, A. The effects of a large-scale ice storm event on the drivers of bark beetle outbreaks and associated management practices. For. Ecol. Manag. 2018, 408, 195–201. [Google Scholar] [CrossRef]
- De Groot, M.; Diaci, J.; Ogris, N. Forest management history is an important factor in bark beetle outbreaks: Lessons for the future. For. Ecol. Manag. 2019, 433, 467–474. [Google Scholar] [CrossRef]
- Mezei, P.; Blaženec, M.; Grodzki, W.; Škvarenina, J.; Jakuš, R. Influence of different forest protection strategies on spruce tree mortality during a bark beetle outbreak. Ann. For. Sci. 2017, 74, 65. [Google Scholar] [CrossRef]
- Grodzki, W.; Jakuš, R.; Lajzová, E.; Sitková, Z.; Maczka, T.; Škvarenina, J. Effects of intensive versus no management strategies during an outbreak of the bark beetle Ips typographus (L.) (Col. Curculionidae, Scolytinae) in the Tatra Mts. in Poland and Slovakia. Ann. For. Sci. 2006, 63, 55–61. [Google Scholar] [CrossRef]
- Marini, L.; Økland, B.; Jönsson, A.M.; Bentz, B.; Carroll, A.; Forster, B.; Grégoire, J.-C.; Hurling, R.; Nageleisen, L.M.; Netherer, S.; et al. Climate drivers of bark beetle outbreak dynamics in Norway spruce forests. Ecogr. Cop. 2017. in print. [Google Scholar] [CrossRef]
- Senf, C.; Seidl, R. Natural disturbances are spatially diverse but temporally synchronized across temperate forest landscapes in Europe. Glob. Chang. Biol. 2018, 24, 1201–1211. [Google Scholar] [CrossRef]
- Cooper, L.A.; Reed, C.C.; Ballantyne, A.P. Mountain pine beetle attack faster growing lodgepole pine at low elevations in western Montana, USA. For. Ecol. Manag. 2018, 427, 200–207. [Google Scholar] [CrossRef]
- Csank, A.Z.; Miller, A.E.; Sherriff, R.L.; Berg, E.E.; Welker, J.M. Tree-ring isotopes reveal drought sensitivity in trees killed by spruce beetle outbreaks in south-central Alaska. Ecol. Appl. 2016, 26, 2001–2020. [Google Scholar] [CrossRef] [PubMed]
- Økland, B.; Nikolov, C.; Krokene, P.; Vakula, J. Transition from windfall- to patch-driven outbreak dynamics of the spruce bark beetle Ips typographus. For. Ecol. Manag. 2016, 363, 63–73. [Google Scholar] [CrossRef]
- White, T.C.R. The universal “bottom-up” limitation of animal populations by their food is illustrated by outbreaking species. Ecol. Res. 2019, 336–338. [Google Scholar] [CrossRef]
- Louis, M.; Dohet, L.; Grégoire, J.C. Fallen trees’ last stand against bark beetles. For. Ecol. Manag. 2016, 359, 44–50. [Google Scholar] [CrossRef]
- Sangüesa-Barreda, G.; Linares, J.C.; Camarero, J.J. Reduced growth sensitivity to climate in bark-beetle infested Aleppo pines: Connecting climatic and biotic drivers of forest dieback. For. Ecol. Manag. 2015, 357, 126–137. [Google Scholar] [CrossRef]
- Ivantsova, E.D.; Pyzhev, A.I.; Zander, E.V. Economic consequences of insect pests outbreaks in Boreal Forests: A literature review. J. Sib. Fed. Univ. Humanit. Soc. Sci. 2019, 4, 627–642. [Google Scholar] [CrossRef]
- Salmon, Y.; Dietrich, L.; Sevanto, S.; Hölttä, T.; Dannoura, M.; Epron, D. Drought impacts on tree phloem: From cell-level responses to ecological significance. Tree Physiol. 2018, 39, 173–191. [Google Scholar] [CrossRef]
- Wulder, M.A.; Dymond, C.C.; White, J.C.; Leckie, D.G.; Carroll, A.L. Surveying mountain pine beetle damage of forests: A review of remote sensing opportunities. For. Ecol. Manag. 2006, 221, 27–41. [Google Scholar] [CrossRef]
- Aukema, B.H.; Carroll, A.L.; Zhu, J.; Raffa, K.F.; Sickley, T.A.; Taylor, S.W. Landscape level analysis of mountain pine beetle in British Columbia, Canada: Spatiotemporal development and spatial synchrony within the present outbreak. Ecogr. Cop. 2006, 29, 427–441. [Google Scholar] [CrossRef]
- Chen, H. A spatiotemporal pattern analysis of historical mountain pine beetle outbreaks in British Columbia, Canada. Ecogr. Cop. 2014, 37, 344–356. [Google Scholar] [CrossRef]
- Kausrud, K.; Økland, B.; Skarpaas, O.; Grégoire, J.C.; Erbilgin, N.; Stenseth, N.C. Population dynamics in changing environments: The case of an eruptive forest pest species. Biol. Rev. 2012, 87, 34–51. [Google Scholar] [CrossRef] [PubMed]
- Wermelinger, B. Ecology and management of the spruce bark beetle Ips typographus—A review of recent research. For. Ecol. Manag. 2004, 202, 67–82. [Google Scholar] [CrossRef]
- Kautz, M.; Imron, M.A.; Dworschak, K.; Schopf, R. Dispersal variability and associated population-level consequences in tree-killing bark beetles. Mov. Ecol. 2016, 4, 9. [Google Scholar] [CrossRef] [PubMed]
- Jakuš, R.; Edwards-Jonášová, M.; Cudlín, P.; Blaženec, M.; Ježík, M.; Havlíček, F.; Moravec, I. Characteristics of Norway spruce trees (Picea abies) surviving a spruce bark beetle (Ips typographus L.) outbreak. Trees Struct. Funct. 2011, 25, 965–973. [Google Scholar] [CrossRef]
- Kautz, M.; Schopf, R.; Ohser, J. The “Sun-effect”: Microclimatic alterations predispose forest edges to bark beetle infestations. Eur. J. For. Res. 2013, 132, 453–465. [Google Scholar] [CrossRef]
- Matthews, B.; Netherer, S.; Katzensteiner, K.; Pennerstorfer, J.; Blackwell, E.; Henschke, P.; Hietz, P.; Rosner, S.; Jansson, P.E.; Schume, H.; et al. Transpiration deficits increase host susceptibility to bark beetle attack: Experimental observations and practical outcomes for Ips typographus hazard assessment. Agric. For. Meteorol. 2018, 263, 69–89. [Google Scholar] [CrossRef]
- Netherer, S.; Matthews, B.; Katzensteiner, K.; Blackwell, E.; Henschke, P.; Hietz, P.; Pennerstorfer, J.; Rosner, S.; Kikuta, S.; Schume, H.; et al. Do water-limiting conditions predispose Norway spruce to bark beetle attack? New Phytol. 2015, 205, 1128–1141. [Google Scholar] [CrossRef] [PubMed]
- Mezei, P.; Grodzki, W.; Blaženec, M.; Škvarenina, J.; Brandýsová, V.; Jakuš, R. Host and site factors affecting tree mortality caused by the spruce bark beetle (Ips typographus) in mountainous conditions. For. Ecol. Manag. 2014, 331, 196–207. [Google Scholar] [CrossRef]
- Louis, M.; Grégoire, J.-C.; Pélisson, P.-F. Exploiting fugitive resources: How long-lived is “fugitive”? Fallen trees are a long-lasting reward for Ips typographus (Coleoptera, Curculionidae, Scolytinae). For. Ecol. Manag. 2014, 331, 129–134. [Google Scholar] [CrossRef]
- Potterf, M.; Nikolov, C.; Kočická, E.; Ferenčík, J.; Mezei, P.; Jakuš, R. Landscape-level spread of beetle infestations from windthrown- and beetle-killed trees in the non-intervention zone of the Tatra National Park, Slovakia (Central Europe). For. Ecol. Manag. 2019, 432, 489–500. [Google Scholar] [CrossRef]
- Kautz, M.; Dworschak, K.; Gruppe, A.; Schopf, R. Quantifying spatio-temporal dispersion of bark beetle infestations in epidemic and non-epidemic conditions. For. Ecol. Manag. 2011, 262, 598–608. [Google Scholar] [CrossRef]
- Netherer, S.; Nopp-Mayr, U. Predisposition assessment systems (PAS) as supportive tools in forest management—Rating of site and stand-related hazards of bark beetle infestation in the High Tatra Mountains as an example for system application and verification. For. Ecol. Manag. 2005, 207, 99–107. [Google Scholar] [CrossRef]
- Sproull, G.J.; Bukowski, M.; McNutt, N.; Zwijacz-Kozica, T.; Szwagrzyk, J. Landscape-level spruce mortality patterns and topographic forecasters of bark beetle outbreaks in managed and unmanaged forests of the Tatra Mountains. Pol. J. Ecol. 2017, 65, 24–37. [Google Scholar] [CrossRef]
- Akkuzu, E.; Sariyildiz, T.; Kucuk, M.; Duman, A. Ips typographus (L.) and Thanasimus formicarius (L.) populations influenced by aspect and slope position in Artvin-Hatila valley national park, Turkey. Afr. J. Biotechnol. 2009, 8, 877–882. [Google Scholar]
- Mezei, P.; Jakuš, R.; Blaženec, M.; Belánová, S.; Šmídt, J. The relationship between potential solar radiation and spruce bark beetle catches in pheromone traps. Ann. For. Res. 2012, 55, 243–252. [Google Scholar]
- Netherer, S.; Pennerstorfer, J. Parameters relevant for modelling the potential development of Ips typographus (Coleoptera: Scolytidae). Integr. Pest Manag. Rev. 2001, 6, 177–184. [Google Scholar] [CrossRef]
- Mezei, P.; Jakuš, R.; Pennerstorfer, J.; Havašová, M.; Škvarenina, J.; Ferenčík, J.; Slivinský, J.; Bičárová, S.; Bilčík, D.; Blaženec, M.; et al. Storms, temperature maxima and the Eurasian spruce bark beetle Ips typographus—An infernal trio in Norway spruce forests of the Central European High Tatra Mountains. Agric. For. Meteorol. 2017, 242, 85–95. [Google Scholar] [CrossRef]
- Havašová, M.; Bucha, T.; Ferenčík, J.; Jakuš, R. Applicability of a vegetation indices-based method to map bark beetle outbreaks in the High Tatra Mountains. Ann. For. Res. 2015, 58, 1–16. [Google Scholar] [CrossRef]
- Netherer, S. Modelling of Bark Beetle Development and of Site- and Stand-Related Predisposition to Ips Typographus (L.) (Coleoptera; Scolytidae)—A Contribution to Risk Assessment; University of Natural Resources and Life Sciences (BOKU): Vienna, Austria, 2003. [Google Scholar]
- Wermelinger, B.; Seifert, M. Temperature-dependent reproduction of the spruce bark beetle Ips typographus, and analysis of the potential population growth. Ecol. Entomol. 1999, 24, 103–110. [Google Scholar] [CrossRef]
- Havašová, M.; Ferenčík, J.; Jakuš, R. Interactions between windthrow, bark beetles and forest management in the Tatra national parks. For. Ecol. Manag. 2017, 391, 349–361. [Google Scholar] [CrossRef]
- Thom, D.; Seidl, R.; Steyrer, G.; Krehan, H.; Formayer, H. Slow and fast drivers of the natural disturbance regime in Central European forest ecosystems. For. Ecol. Manag. 2013, 307, 293–302. [Google Scholar] [CrossRef]
- Chen, H.; Jackson, P.L. Spatiotemporal mapping of potential mountain pine beetle emergence—Is a heating cycle a valid surrogate for potential beetle emergence? Agric. For. Meteorol. 2015, 206, 124–136. [Google Scholar] [CrossRef]
- Baier, P.; Pennerstorfer, J.; Schopf, A. PHENIPS—A comprehensive phenology model of Ips typographus (L.) (Col., Scolytinae) as a tool for hazard rating of bark beetle infestation. For. Ecol. Manag. 2007, 249, 171–186. [Google Scholar] [CrossRef]
- Kumar, L. Comparison of Arcgis Modelled and Ground Recorded Solar Radiation Data and Opportunities for Utilisation in Environmental Models. In Proceedings of the 10th SEASC: South East Asian Survey Congress, Nusadua, Indonesia, 4–7 August 2009; pp. 311–315. [Google Scholar]
- Dochtermann, N.A.; Jenkins, S.H. Developing multiple hypotheses in behavioral ecology. Behav. Ecol. Sociobiol. 2011, 65, 37–45. [Google Scholar] [CrossRef]
- Gelman, A.; Hill, J. Data Analysis Using Regression and Multilevel/Hierarchical Models Data; Cambridge University Press: Cambridge, UK, 2017. [Google Scholar]
- R Core Team. R: A Language and Environment for Statistical Computing; R Foundation for Statistical Computing: Vienna, Austria, 2019; Available online: https://www.R-project.org/ (accessed on 19 July 2019).
- Burnham, K.P.; Anderson, D.R.; Huyvaert, K.P. AIC model selection and multimodel inference in behavioral ecology: Some background, observations, and comparisons. Behav. Ecol. Sociobiol. 2011, 65, 23–35. [Google Scholar] [CrossRef]
- Hegyi, G.; Garamszegi, L.Z. Using information theory as a substitute for stepwise regression in ecology and behavior. Behav. Ecol. Sociobiol. 2010, 65, 69–76. [Google Scholar] [CrossRef]
- Annila, E. Influence of temperature upon the development and voltinism of Ips typographus L. (Coleoptera, Scolytidae). Ann. Zool. Fenn. 1969, 6, 161–208. [Google Scholar]
- Schroeder, L.M. Escape in space from enemies: A comparison between stands with and without enhanced densities of the spruce bark beetle. Agric. For. Entomol. 2007, 9, 85–91. [Google Scholar] [CrossRef]
- Wermelinger, B.; Seifert, M. Analysis of the temperature dependent development of the spruce bark beetle Ips typographus (L.) (Col., Scolytidae). J. Appl. Entomol. 1998, 122, 185–191. [Google Scholar] [CrossRef]
- Fleischer, P.; Fleischer, P.; Ferenčík, J.; Hlaváč, P.; Kozánek, M. Elevated bark temperature in unremoved stumps after disturbances facilitates multi-voltinism in Ips typographus population in a mountainous forest. For. J. 2016, 62, 15–22. [Google Scholar] [CrossRef]
- White, T.C.R. Are outbreaks of cambium-feeding beetles generated by nutritionally enhanced phloem of drought-stressed trees? J. Appl. Entomol. 2015, 139, 567–578. [Google Scholar] [CrossRef]
- Park Williams, A.; Allen, C.D.; Macalady, A.K.; Griffin, D.; Woodhouse, C.A.; Meko, D.M.; Swetnam, T.W.; Rauscher, S.A.; Seager, R.; Grissino-Mayer, H.D.; et al. Temperature as a potent driver of regional forest drought stress and tree mortality. Nat. Clim. Chang. 2012, 3, 292–297. [Google Scholar] [CrossRef]
- Stadelmann, G.; Bugmann, H.; Wermelinger, B.; Bigler, C. Spatial interactions between storm damage and subsequent infestations by the European spruce bark beetle. For. Ecol. Manag. 2014, 318, 167–174. [Google Scholar] [CrossRef]
- DeRose, J.R.; Long, J.N. Factors influencing the spatial and temporal dynamics of engelmann spruce mortality during a spruce beetle outbreak on the Markagunt Plateau, Utah. For. Sci. 2012, 58, 1–14. [Google Scholar] [CrossRef]
- Hart, S.J.; Veblen, T.T.; Schneider, D.; Molotch, N.P. Summer and winter drought drive the initiation and spread of spruce beetle outbreak. Ecology 2017, 98, 2698–2707. [Google Scholar] [CrossRef] [PubMed]
- Hart, S.J.; Veblen, T.T.; Eisenhart, K.S.; Jarvis, D.; Kulakowski, D. Drought induces spruce beetle (Dendroctonus rufipennis) outbreaks across northwestern Colorado. Ecology 2014, 930–939. [Google Scholar] [CrossRef]
- Battisti, A.; Marini, L.; Pitacco, A.; Larsson, S. Solar radiation directly affects larval performance of a forest insect. Ecol. Entomol. 2013, 38, 553–559. [Google Scholar] [CrossRef]
- Faccoli, M.; Stergulc, F. A practical method for predicting the short-time trend of bivoltine populations of Ips typographus (L.) (Col., Scolytidae). J. Appl. Entomol. 2006, 130, 61–66. [Google Scholar] [CrossRef]
- Jönsson, A.M.; Schroeder, L.M.; Lagergren, F.; Anderbrant, O.; Smith, B. Guess the impact of Ips typographus—An ecosystem modelling approach for simulating spruce bark beetle outbreaks. Agric. For. Meteorol. 2012, 166–167, 188–200. [Google Scholar] [CrossRef]
- Bentz, B.J.; Jönsson, A.M.; Schroeder, M.; Weed, A.; Wilcke, R.A.I.; Larsson, K. Ips typographus and Dendroctonus ponderosae models project thermal suitability for Intra- and Inter-continental establishment in a changing climate. Front. For. Glob. Chang. 2019, 2, 1. [Google Scholar] [CrossRef]
- Steiniger, S.; Hay, G.J. Free and open source geographic information tools for landscape ecology. Ecol. Inform. 2009, 4, 183–195. [Google Scholar] [CrossRef]
- Amrhein, V.; Greenland, S.; Mcshane, B. Scientists rise up against statistical significance. Nature 2019, 567, 7–9. [Google Scholar] [CrossRef] [PubMed]
- Marini, L.; Ayres, M.P.; Battisti, A.; Faccoli, M. Climate affects severity and altitudinal distribution of outbreaks in an eruptive bark beetle. Clim. Chang. 2012, 115, 327–341. [Google Scholar] [CrossRef]
- Faccoli, M.; Bernardinelli, I. Composition and elevation of spruce forests affect susceptibility to bark beetle attacks: Implications for forest management. Forests 2014, 5, 88–102. [Google Scholar] [CrossRef]
- Blomqvist, M.; Kosunen, M.; Starr, M.; Kantola, T.; Holopainen, M.; Lyytikäinen-Saarenmaa, P. Modelling the predisposition of Norway spruce to Ips typographus L. infestation by means of environmental factors in southern Finland. Eur. J. For. Res. 2018, 137, 675–691. [Google Scholar] [CrossRef]


© 2019 by the authors. Licensee MDPI, Basel, Switzerland. This article is an open access article distributed under the terms and conditions of the Creative Commons Attribution (CC BY) license (http://creativecommons.org/licenses/by/4.0/).