Article

Contrasting Response to Drought and Climate of Planted and Natural Pinus pinaster Aiton Forests in Southern Spain

by
Carlos Rodriguez-Vallejo
and
Rafael M. Navarro-Cerrillo
*
Depto. Ingeniería Forestal, Laboratorio de Selvicultura, Dendrocronología y Cambio Climático, DendrodatLab- ERSAF, Universidad de Córdoba, Campus de Rabanales, Crta. IV, km. 396, 14071 Córdoba, Spain
*
Author to whom correspondence should be addressed.
Forests 2019, 10(7), 603; https://doi.org/10.3390/f10070603
Submission received: 3 July 2019 / Revised: 11 July 2019 / Accepted: 19 July 2019 / Published: 22 July 2019
(This article belongs to the Section Forest Ecology and Management)

Abstract

:
Extreme drought events and increasing aridity are leading to forest decline and tree mortality, particularly in populations near the limits of the species distribution. Therefore, a better understanding of the growth response to drought and climate change could show the vulnerability of forests and enable predictions of future dieback. In this study, we used a dendrochronological approach to assess the response to drought in natural and planted forests of the maritime pine (Pinus pinaster Aiton) located in its southernmost distribution (south of Spain). In addition, we investigated how environmental variables (climatic and site conditions) and structural factors drive radial growth along the biogeographic and ecological gradients. Our results showed contrasting growth responses to drought of natural and planted stands, but these differences were not significant after repeated drought periods. Additionally, we found differences in the climate–growth relationships when comparing more inland sites (wet previous winter and late spring precipitation) and sites located closer to the coast (early spring precipitation). Response functions emphasized the negative effect of defoliation and drought, expressed as the June standard precipitation-evapotranspiration index calculated for the 12-month temporal scale and the mean temperature in the current February, on growth. The strong relationship between climatic variables and growth enabled acceptable results to be obtained in a modeling approach. The study and characterization of this tree species’ response to drought will help to improve the adaptive management of forests under climate change.

1. Introduction

Climate change projections have been linked to significant increases in water deficits and natural disturbance regimes (fire, insect pests, windstorms, and droughts), in terms of frequency and severity in forest ecosystems across many parts of the world during the 21st century [1,2,3]. Such changes will impact across a wide range of forest ecosystems leading to changes in the forest composition, structure, productivity, and climate interactions [4]. Thus, studies predicting forest sensitivity to drought should also consider the local adaptation of trees to factors such as precipitation and temperature, soil characteristics and microtopography, as well as forest management [5] Consequently, many of these regions are undergoing extreme drought and increasing aridity, leading to forest decline and tree mortality [6,7,8,9]. These effects are more notable in regional-scale forest die-off events, which can kill thousands of trees over short timescales [10]. According to recent projections, the trend towards increased aridity will be especially severe in southern Europe, where an increasing frequency of extreme climatic events (e.g., rainless periods) is expected in the coming decades [11]. These increments in drought frequency and severity, as well as in temperature, have been found to be one of the main drivers of forest decline processes in the Mediterranean Basin [12,13]. The consequences of these climate trends will also change the functions and productivity of forests, particularly in populations near the limits of the species distribution [14,15]. Accordingly, rear-edge pine forests may be the key to understanding forest sensitivity to drought [16].
The Mediterranean Basin has been widely planted with trees and it has one of the highest proportions of planted forest in the world [17]. During the 20th century, massive pine plantations were established in Spain, many of them in the southern Iberian Peninsula, to increase forest productivity and to protect the soil against erosion processes [18]. These plantations represented up to 7% of the total forest area in Spain, but a lack of management led to very dense and homogeneous stands, which were more susceptible to warming-induced dieback [19]. Canopy dieback and widespread tree mortality have been reported in thus-planted pine forests [20,21,22]. Many studies of drought-induced decline have found relationships between growth, vigor status (defoliation), and stress factors. However, due to their complexity, it is difficult to delineate these relationships over time and space [23]. The combination of dendrochronology and permanent monitoring plots represents a valuable tool to better understand such long-term interactions [24].
Maritime pine (Pinus pinaster Aiton) is a native coniferous tree of the western Mediterranean Basin and the Atlantic coast of Portugal. It is a fast-growing species that occupies a broad range of climates, soils, and elevations. Its great plasticity allows it a wide distribution over different climatic conditions, but it grows naturally in warm temperate climates with an oceanic influence [25]. Several research groups have analyzed how climatic, structural, and environmental variables affect the response of maritime pine to drought in its southernmost distribution [20,26,27,28], as well as the differing responses of natural and planted stands [29]. Dendroecology has been effectively used in the study of the decline of P. pinaster forests [30] and to assess how defoliation affects tree radial growth [31]. The evaluation of tree-ring width and the associated parameters contributes to a better interpretation of drought-induced defoliation. For this reason, accurate estimates of tree-ring width, in relation to defoliation, are needed to help build predictions of future dieback based on climate data. Therefore, measurement of the effect of defoliation on radial growth is a logical step when gauging the potential impacts of droughts, since radial growth can be used as a predictor of tree mortality [24].
There exists a lack of information about the impact of geographical and structural factors on the climate–growth–defoliation relationships. The aim of this research was to study the influence of annual defoliation on tree growth in natural and planted southern Mediterranean maritime pine forests to assess their response to extreme climatic events. We used a dendrochronological approach to assess the differences in defoliation between natural and planted stands of P. pinaster. We hypothesized that forests from more xeric sites will show higher sensitivity to drought than forests growing under more humid and warmer conditions, and that planted forests will exhibit greater vulnerability to drought than natural stands. Our specific aims were: (1) to assess contrasting growth responses to drought, comparing the natural and planted P. pinaster forests, (2) to determine the geographical patterns of growth responses to drought and climate, and (3) to assess if climatic variables (temperature and precipitation), site and soil conditions, and structural factors (defoliation and competition) cause differences in the forest decline processes between natural and planted stands.

2. Materials and Methods
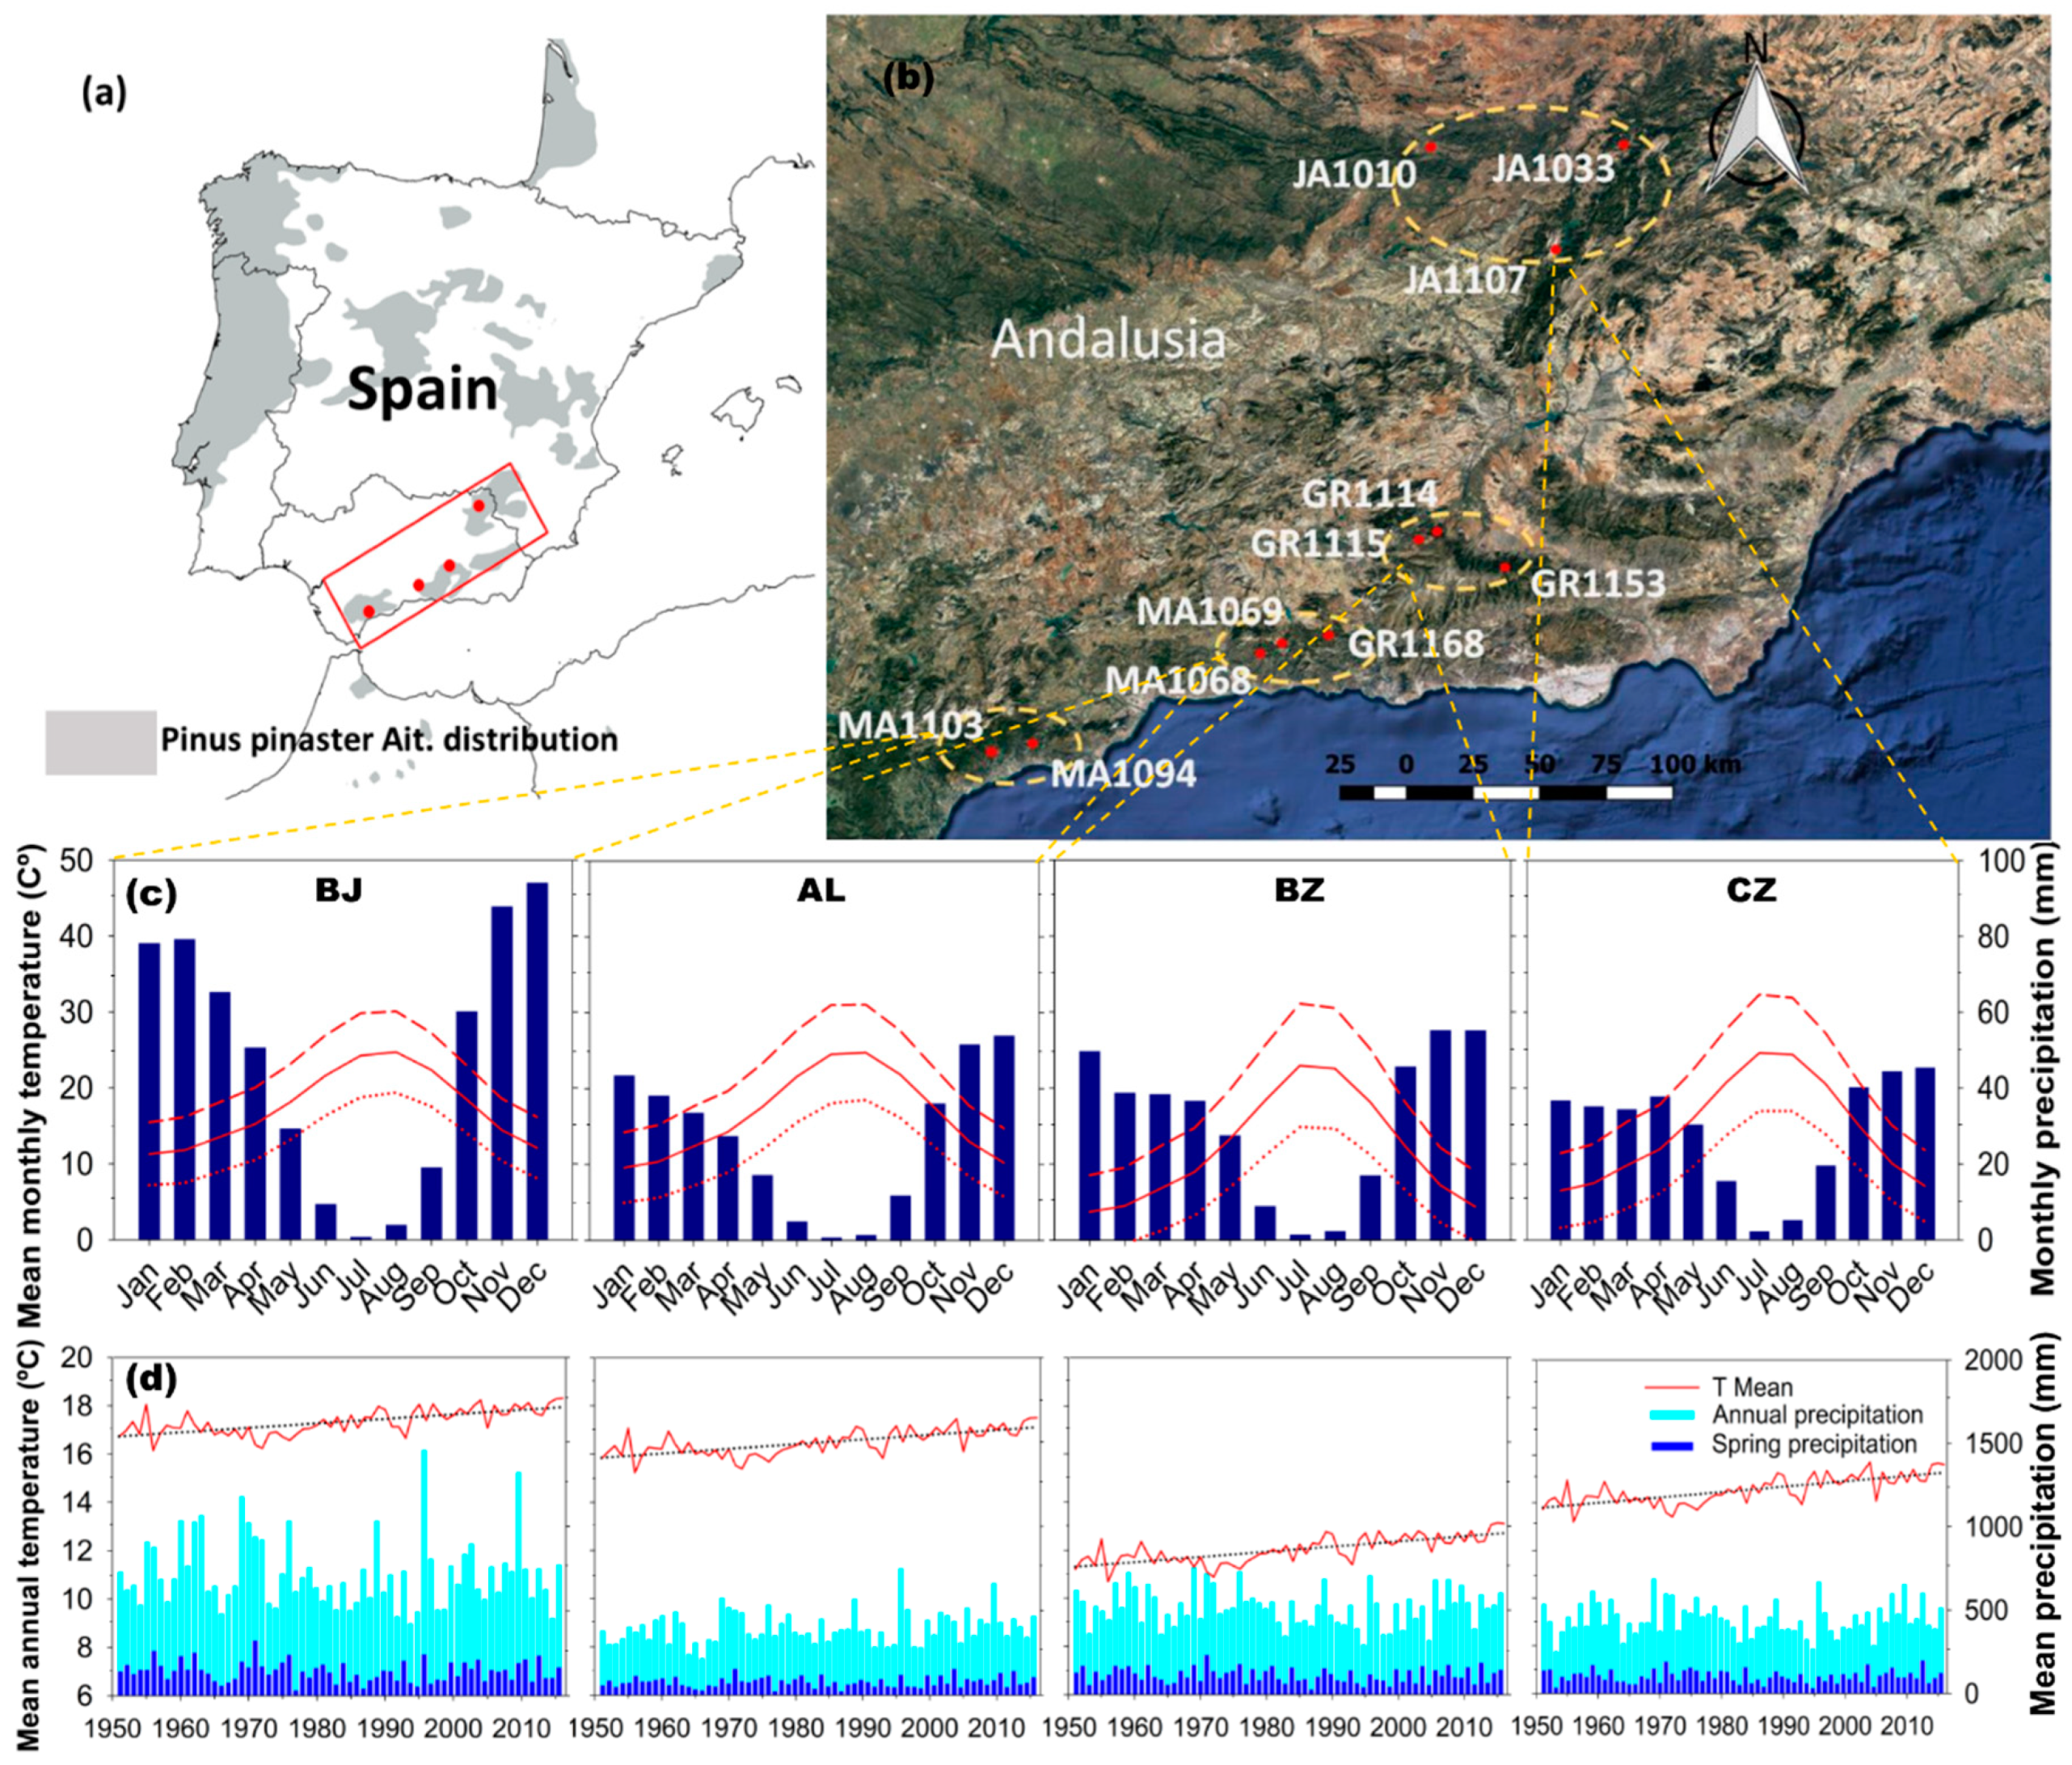
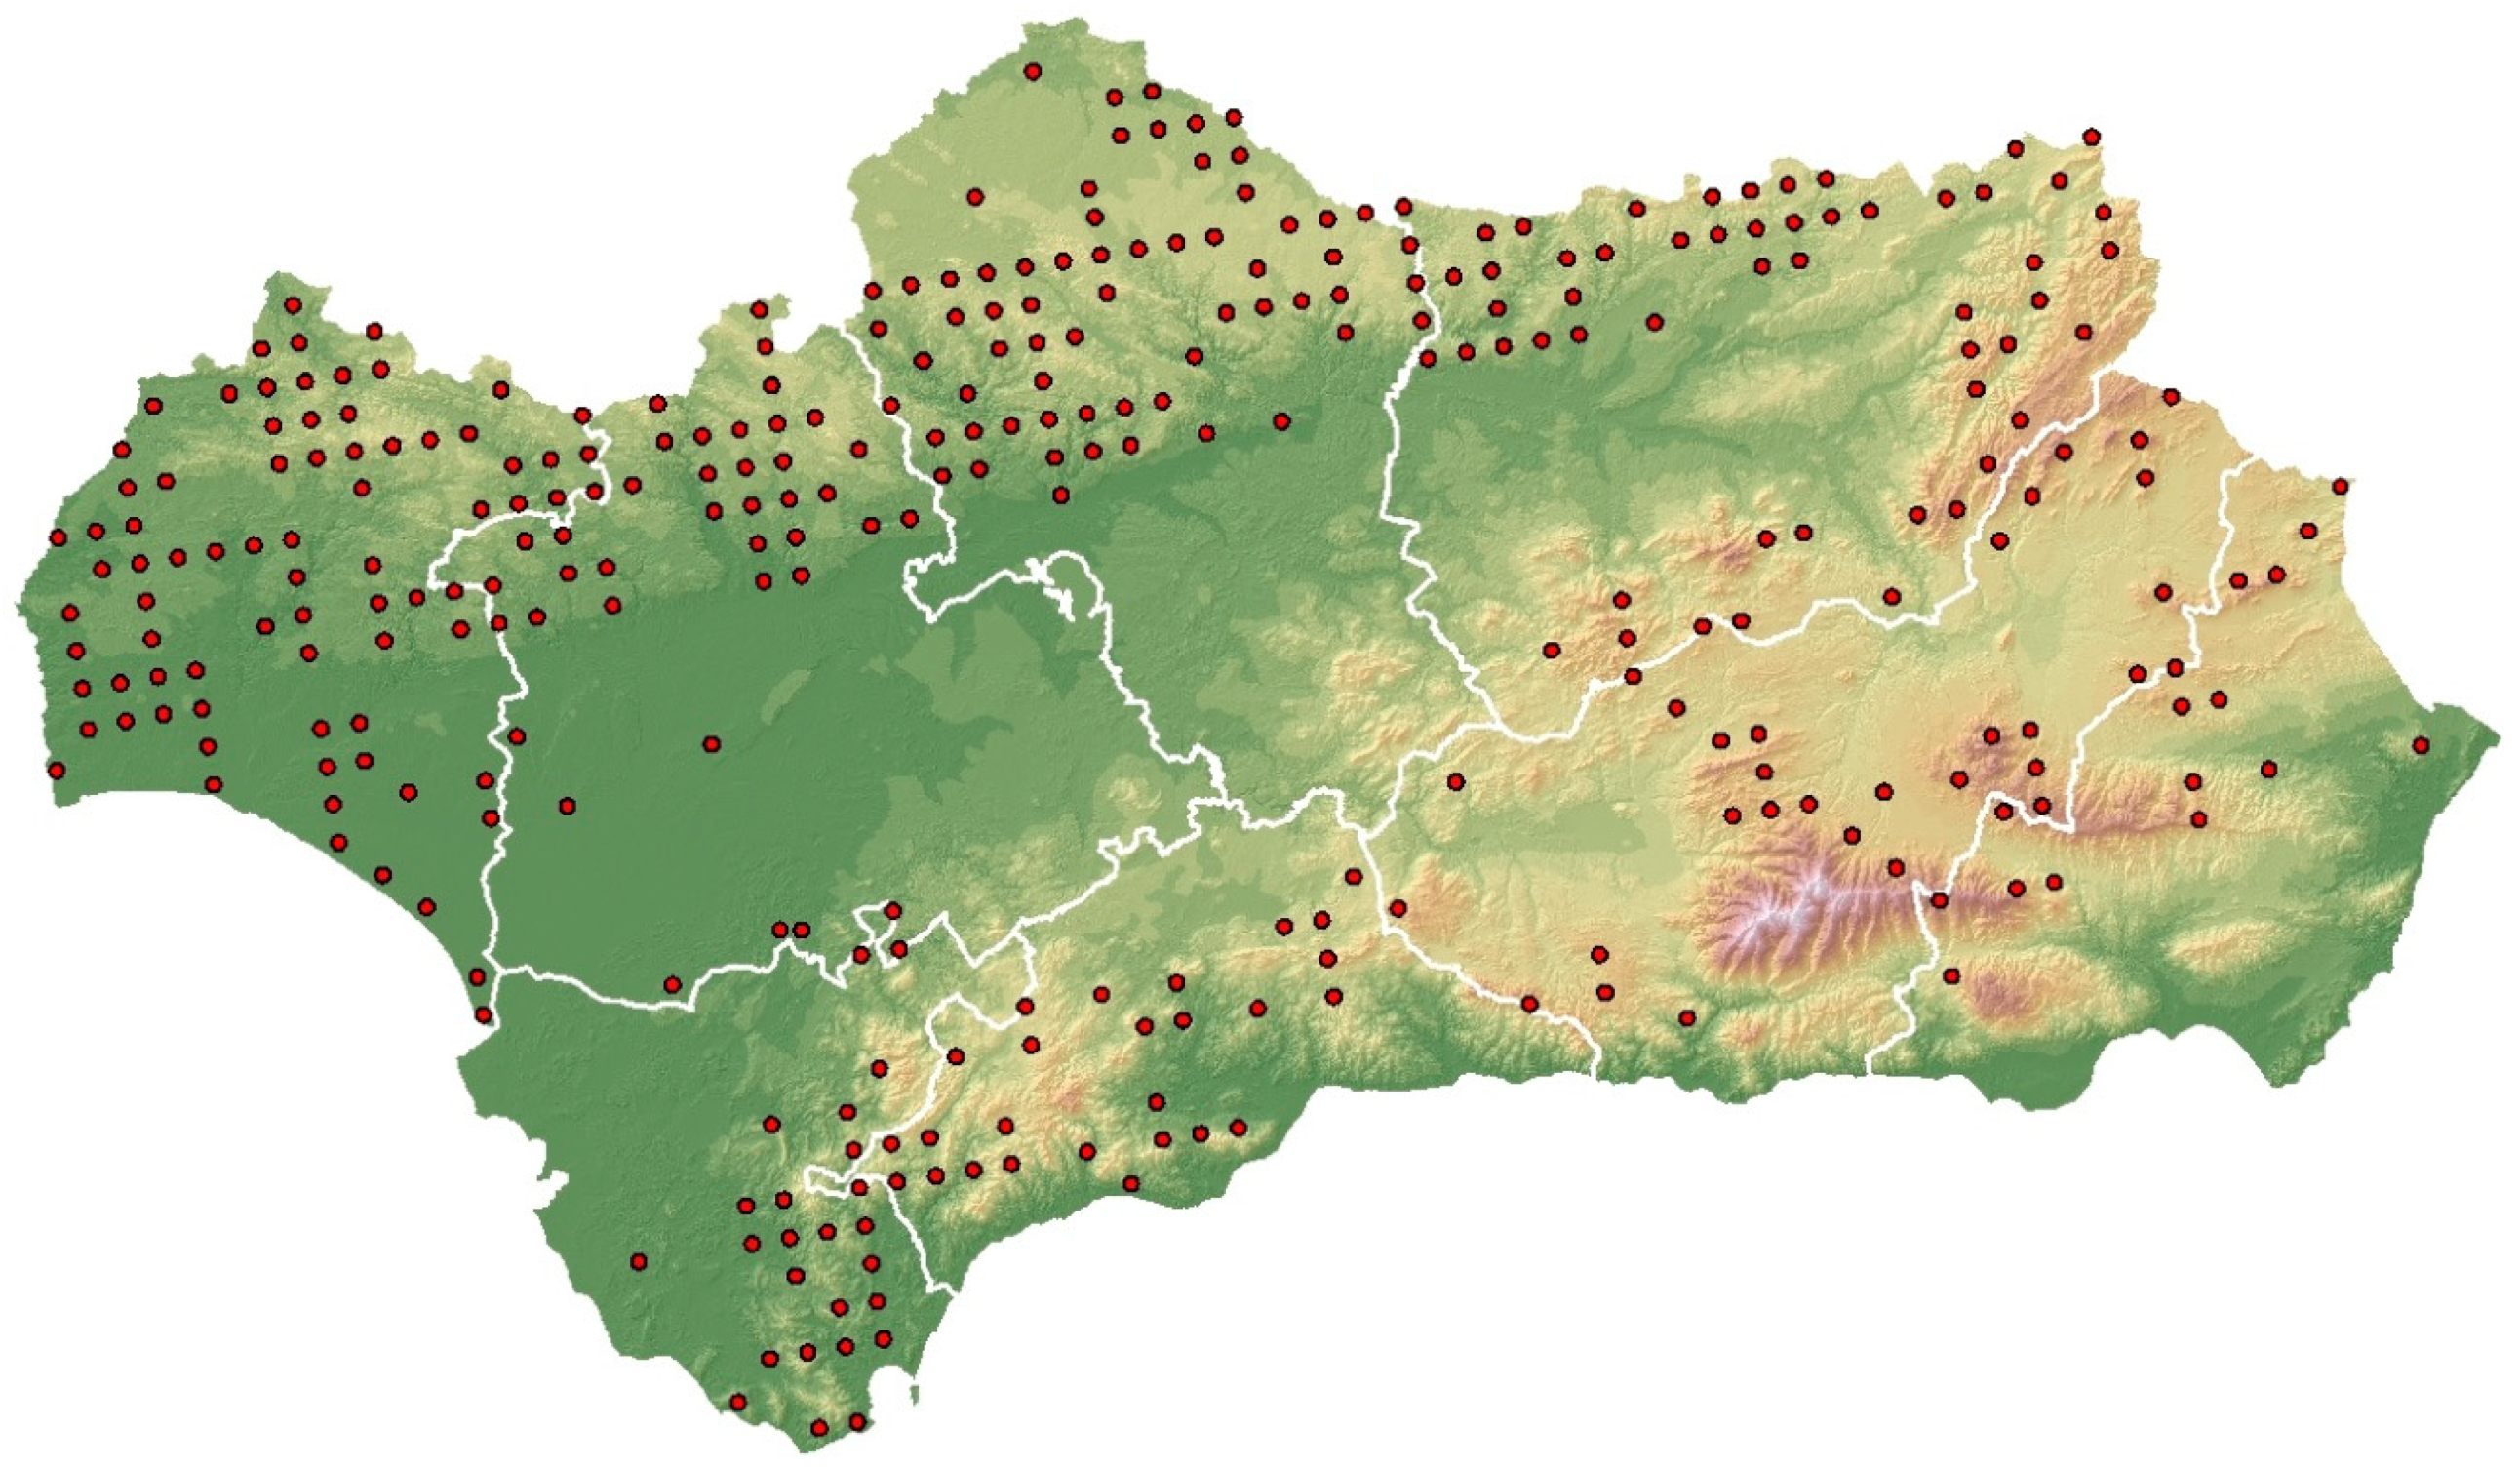
2.1. Study Sites

This research was conducted at the Andalusia Forest Health Network (hereafter, the SEDA network) (38°24′ N, 35°30′ N) (Figure 1). The SEDA network dates back to 2000, when it was created within the International Co-operative Programme on Assessment and Monitoring of Air Pollution Effects on Forests Network in Spain (CEE-ICP Forest). The SEDA network is a systematic survey of 8 × 8 km grids throughout Andalusia and it covers an area of 46.5 square km, with 355 permanent circular plots of variable area (Appendix A, Figure A1; Junta de Andalucía, 2018), in which tree defoliation and the same 24 trees are monitored annually in each grid.
The SEDA sites are exposed to a Mediterranean climate with a long and dry hot season, followed by a short warm and rainy season. The average length of the growing season is about 190 days (FAO). The mean January and July temperatures are 8.9 and 24.5 °C, respectively. The mean annual precipitation is 467 mm, of which 70% falls during winter and spring [32]. The climatic diagrams (Figure 1) illustrate a representative Mediterranean climate with strong aridity in the summer; however, differences amongst the sites were found. The average annual precipitation varies between 350 mm, at the driest sites (BZ, CZ), and 600 mm, at the more coastal site (BJ). The mean annual temperature increases from the inland site (CZ, 14.54 °C) to the southernmost site (BJ, 17.33 °C). Since 1950, the mean temperatures have risen in the study area (y = 0.0193x + 15.475; p < 0.001).
This study focused on Pinus pinaster sampling plots from the SEDA network where the species is dominant, with at least 12 trees per plot, giving a total of 11 plots comprising of five natural and six planted stands (Figure 1b; Table 1). The plots were located in the east of Andalusia, distributed in four different locations over a wide range of climatic and edaphic conditions from north-east to south-west, and a range of elevations from 250 to 1600 m.a.s.l (Table 1). The vegetation in the selected plots is dominated by P. pinaster, and the understory is composed mostly of Cistus sp., with Erica scoparia L. and Ulex baeticus Boiss. in the wetter areas, and Genista sp. and Retama sp. in the drier areas [33]. The trees of P. pinaster sampled in the planted (natural) sites were, on average, 54 (94) years old and their mean height and diameter at breast height (1.3 m, DBH) were 10.3 m (11.4 m) and 29.3 cm (34.8 cm), respectively (Table 1). The planted sites had higher density values (450 stems ha−1 vs. 330 stems ha−1).

2.2. Field Sampling Methods

In each plot, the height (h, m), DBH (cm), and location of each tree were recorded. Annual levels of defoliation were quantified according to a percentage scale with an accuracy of 5% (0%–5%, 6%–10%, 96%–100%), always for the same 24 trees of each plot [34]. We excluded the suppressed and young trees (DBH < 12 cm) from the analysis. In addition, we excluded trees when a high level of defoliation occured simultaneously with the presence of biotic defoliators in the survey, thereby attempting to focus on drought-induced defoliation. A point-centered quadrat (PCQ) was established, using the selected tree as its center, to calculate the Reineke competition index [35] for each sampled site, tree density, and basal area (Table 1).

2.3. Climatic Data

The was limited availability of reliable climatic data from meteorological stations located close to the study area, mostly due to the gaps in these data for the observation period. We used 0.25°-gridded daily data for the temperature (mean, maximum, and minimum) and total precipitation available for the period 1950–2016 from the E-OBS [32]. These data were used to obtain monthly climatic data and temporal trends in temperature and precipitation, thereby characterizing, the climatic conditions and tendencies for each location, respectively (Figure 1). To assess the drought intensity over time and its effect on radial growth, we calculated the Standardized Precipitation-Evapotranspiration Index at 6-month (183 days) (SPEI6) and 12-month (365) (SPEI12) scales, using temperature and precipitation data as described in Reference [36]. The SPEI is an appropriate index to evaluate the growth response to drought, as negative values correspond to water deficit and should be related to decreases in growth, whereas positive values signify wetter conditions, which should correspond to growth increases. The possibility of obtaining the index for different time scales is useful to evaluate the effect of the accumulation of dry periods prior to growth [28].

2.4. Tree-Ring Methods

At least 12 randomly distributed P. pinaster trees were sampled in each plot. A 5.1-mm-diameter increment borer was used to core the trees. In each plot, two cores per tree were taken at a 1.3 m height in the summer of 2013, and then a re-sample was carried out in the summer of 2017 to increase the locations. The sample number was chosen following the recommendations by Fritts (2001) [37], and thus, a total of 258 cores were collected (Table 2). Two increment cores, separated by at least 60°, were extracted from each sample tree at approximately 1.3 m above ground level (the height at which the DBH was measured). The location of the core extraction was based on the tree bole orientation and growth form, avoiding the direction of the maximum slope. The samples were labeled in the field and then taken to the University of Córdoba Dendrochronology laboratory (DendrodatLab), where the increment cores were air-dried, mounted on wood boards, and sanded before the tree rings were measured with a manual Henson micrometer at an accuracy of 0.01 mm. The samples were prepared, measured, and analyzed conforming to standard dendroecological protocol described in Reference [37]. The wood samples were then carefully sanded, using successively finer sandpapers, until the tree rings were clearly visible and could be visually cross-dated [38]. The tree-ring series measurements covered the years between 1848 and 2017. The tree-ring widths were scanned at a resolution of 1600 dpi and then measured to the nearest 0.01 mm using a LINTAB measuring device (Rinntech, Heidelberg, Germany). The COFECHA software [39] was used to validate the cross-dating and to assess the measurement error. A Pearson critical correlation level of 0.332 (99% confidence level) was used as a metric of cross-dating accuracy, where the individual cores were correlated with the master chronology of P. pinaster. The tree age estimation (at 1.3 m height) was obtained by counting the rings in the oldest core of each tree and then adding the estimated length of the missing core to the predicted pith position.
The tree-ring width data were transformed into the basal area increment (BAI), since this was a better indicator of growth than tree-ring width. BAI is based on the assumption that the ring circumference can be approximated by a circle [40]. Additionally, to obtain a better understanding of growth variability and to avoid the influence of long-term biological trends on radial growth, the tree-ring data were converted into indices (Ring width index (RWI) by double-detrending using the dplr package in R version 1.6.9 to fit a negative exponential function succeeded by a 20-year-long spline [41]. Conclusively, to characterize the chronologies, several dendrochronological statistics were calculated, considering the common period 1975–2013 (Table 2): TRW, mean tree-ring width (mm); BAI20, mean basal area increments of the last 20 years; AC1, first-order autocorrelation of raw tree-ring width data (a measure of year-to-year growth similarity); MS, mean sensitivity of residual chronologies (relative year-to-year variability of width in consecutive rings); Rbar, mean among-trees correlation (a measure of the similarity of the residual width indices amongst trees); EPS, expressed population signal, a measure of the statistical quality of the mean site chronology as compared to a perfect, infinitely replicated chronology [42].

2.5. Climatic Response Indices

To understand the effects of droughts and tree resilience, we selected two main droughts (1994–1995, 2005) within the study period, based on the standard precipitation-evapotranspiration index calculated for the 12-month temporal scale as a measure of severity, with values of −1.96 and −1.98, respectively. Three climate indices (Resistance, Rt; Recovery, Rc; Resilience, Rs) were calculated from the BAI data previous to, during, and after two main droughts, according to:
Rt = Dr/PreDr,
Rc = PostDr/Dr,
Rs = PostDr/PreDr,
where Dr is the BAI in the year of the drought, PreDr is the mean BAI calculated for the previous period up to three years before the drought, and PostDr is the mean BAI calculated for the period beginning three years after the drought. This avoids likely growth overlap and, also, the growth returns to normal after this time. High values of these indices indicate a greater ability to deal with the consequences of droughts.

2.6. Statistical Analysis

To assess the differences in growth between the two types of forest (natural vs. planted), we used the Student’s t-test for independent samples and repeated measures for analysis of variance (ANOVAs). Prior to the statistical analysis, the normality and homoscedasticity were examined for all variables. In the case of non-normal variables, the data were log-transformed. Differences were considered significant at a level of p = 0.05. Using simple linear regression, the pre- and post-drought ring BAI were regressed to evaluate the effect of drought on tree growth; and the correlation between the two variables was assessed using the adjusted R2 (R2adj) and p-values.
We quantified the growth response to climate and drought (Pearson correlation) using monthly, seasonal, and annual climatic variables (precipitation and mean temperature) as predictors and the residual chronologies as predictands. Growth indices and climatic series were correlated from the previous fall until October in the year of tree-ring formation, for the common period (1975–2013). Pearson correlations between RWI and SPEI were calculated for the periods prior and subsequent to the 1995 drought.
To quantify the trends in radial growth in different P. pinaster populations, we applied linear mixed-effects models [43]. In this analysis, natural and planted forests were considered together. In the models, site was a factor representing the different populations and defoliation was a variable that accounted for changing BAI trends through time. Defoliation was included in the models to control for potential differences in the growth trajectories of trees at different locations. BAI was obtained from the annual average value of the 260 radii used, focusing on the period 2000–2017, since it was the period of time from which we had the defoliation data. The June standard precipitation-evapotranspiration index calculated for the 12-month temporal scale (SPEI12_6) and the mean temperature in the current February (TMEAN_2) were used as fixed factors. Defoliation level (1—no defoliation, 0%–5%; 2—moderate defoliation, 5%–20%; 3—severe defoliation, >20%) was included as a random factor to account for the fact that each tree sample represented repeated measures over the same individual. All variables were normal or were log-transformed prior to the analysis to account for normality assumptions. Lastly, a graphical examination of the residuals and fitted values was carried out to detect the influence of outliers and to evaluate the general model fit.

3. Results

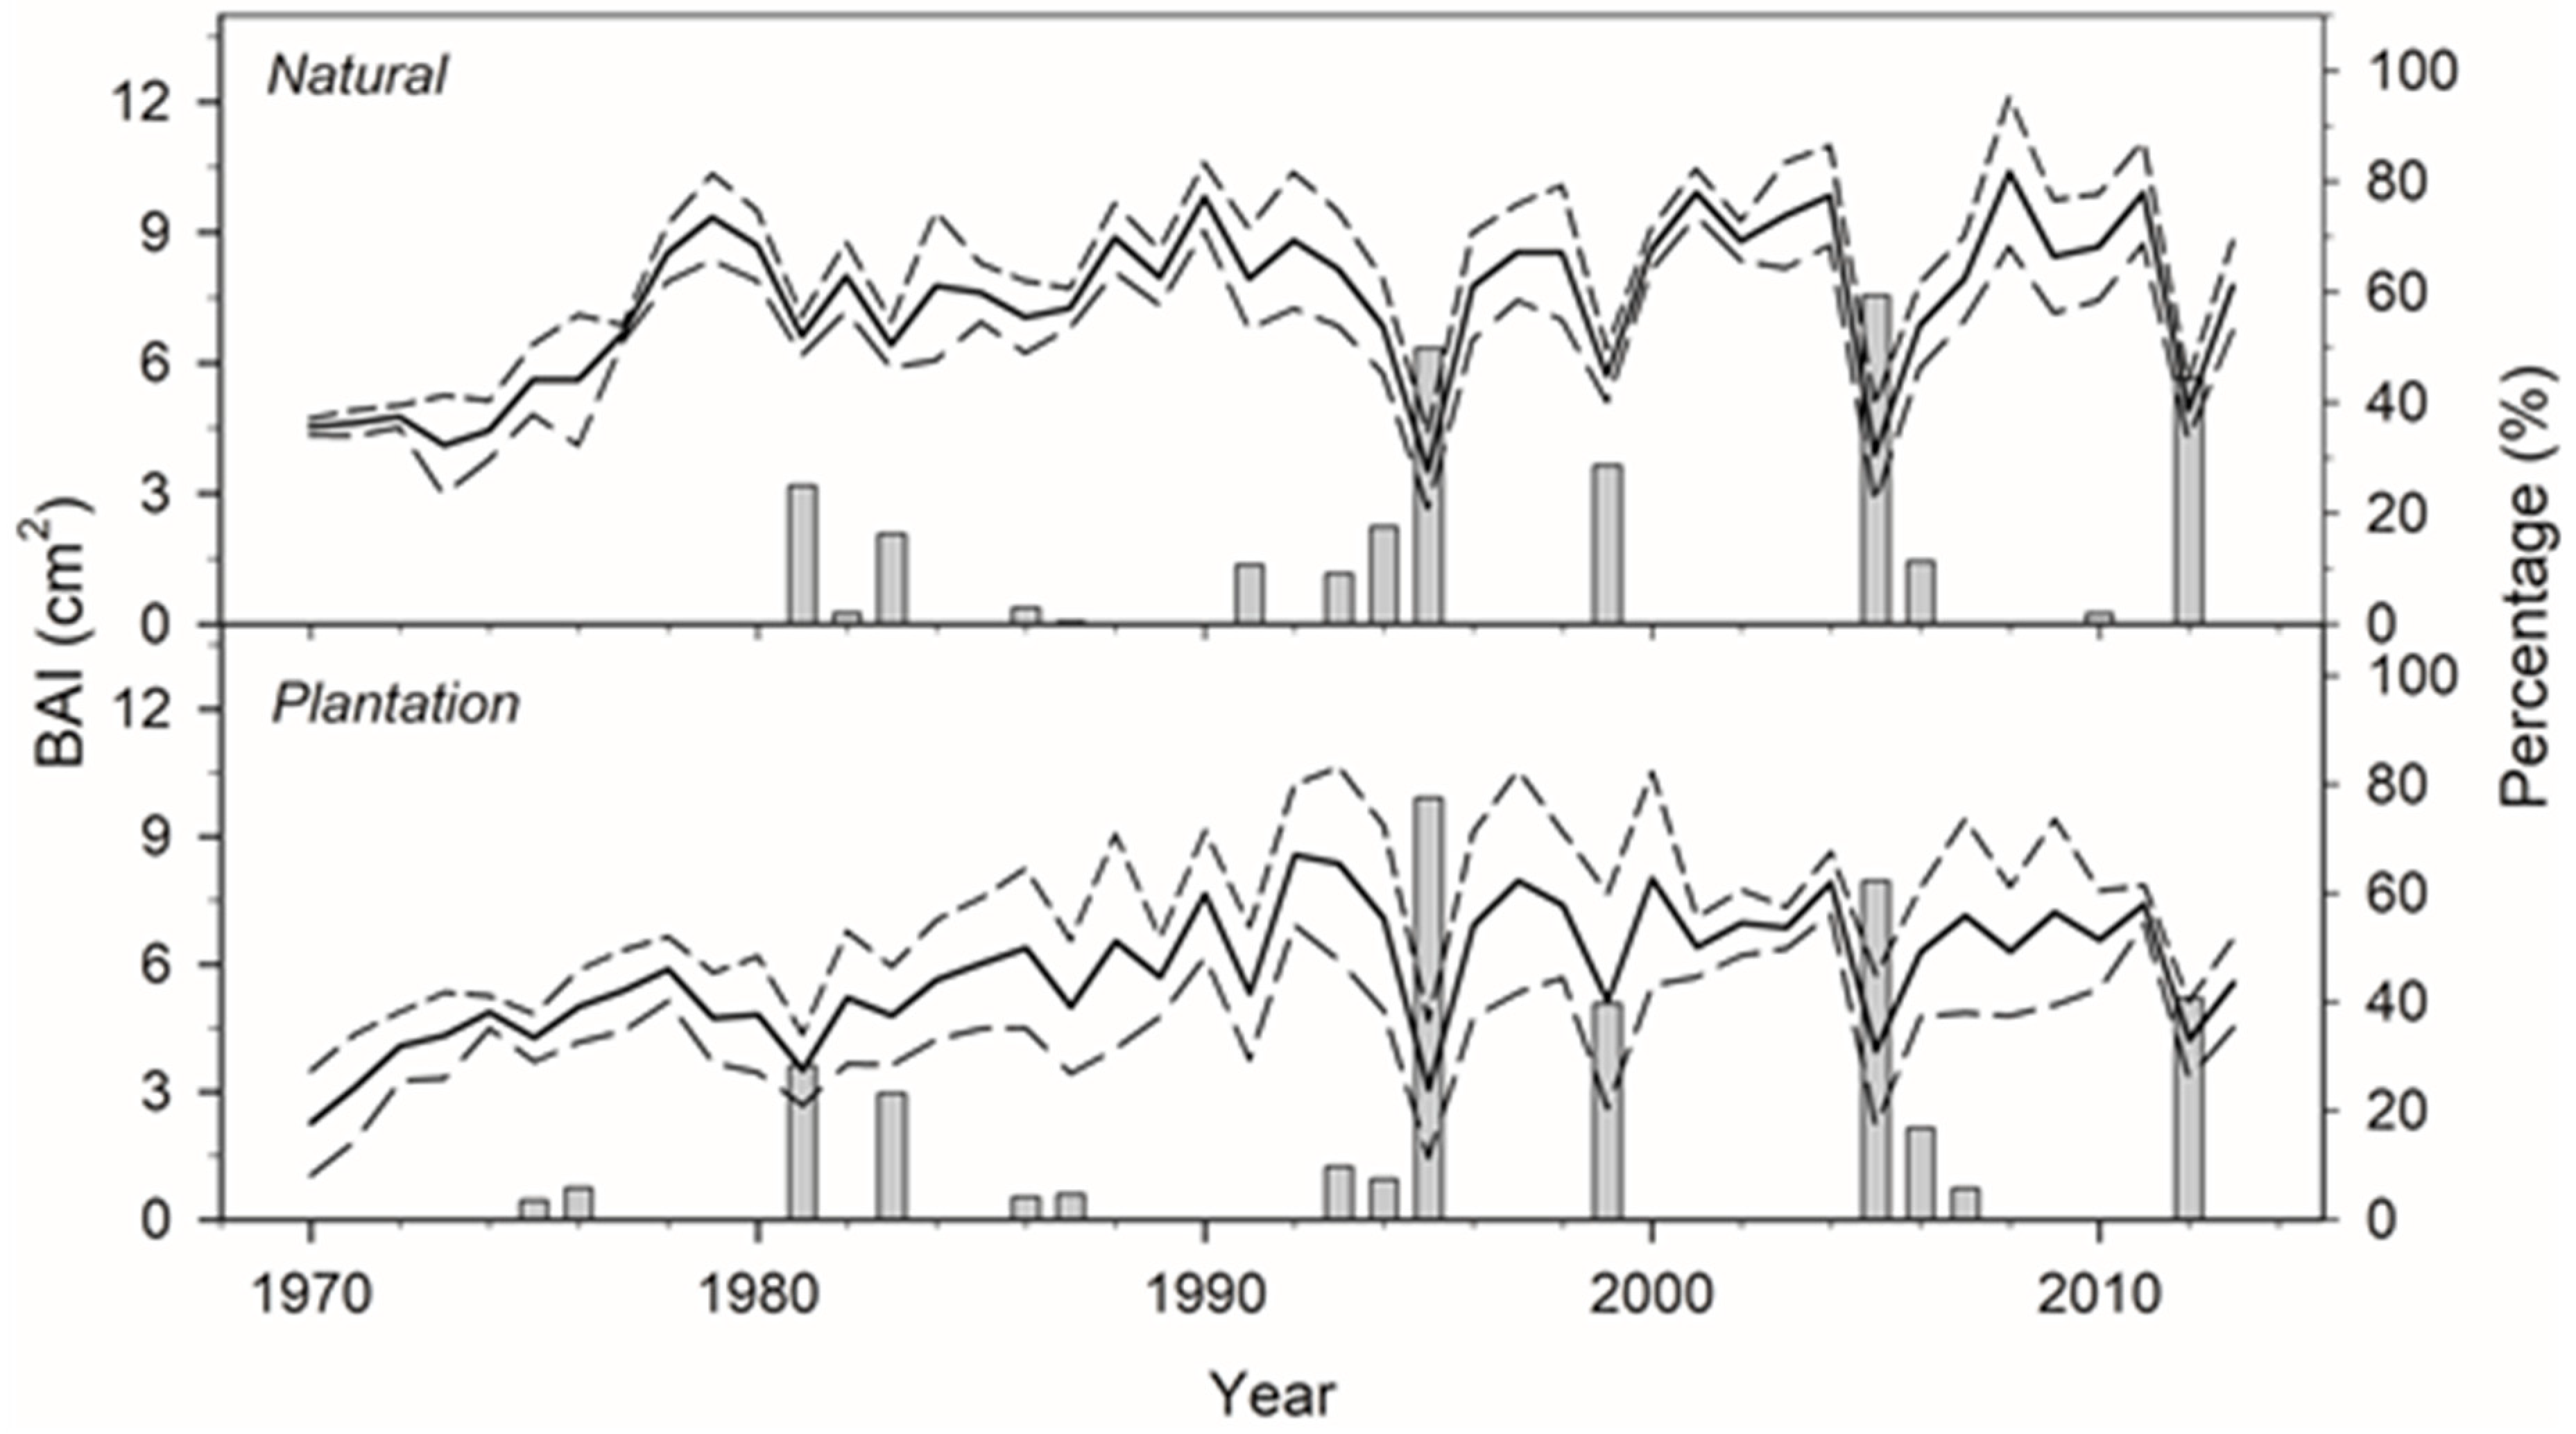
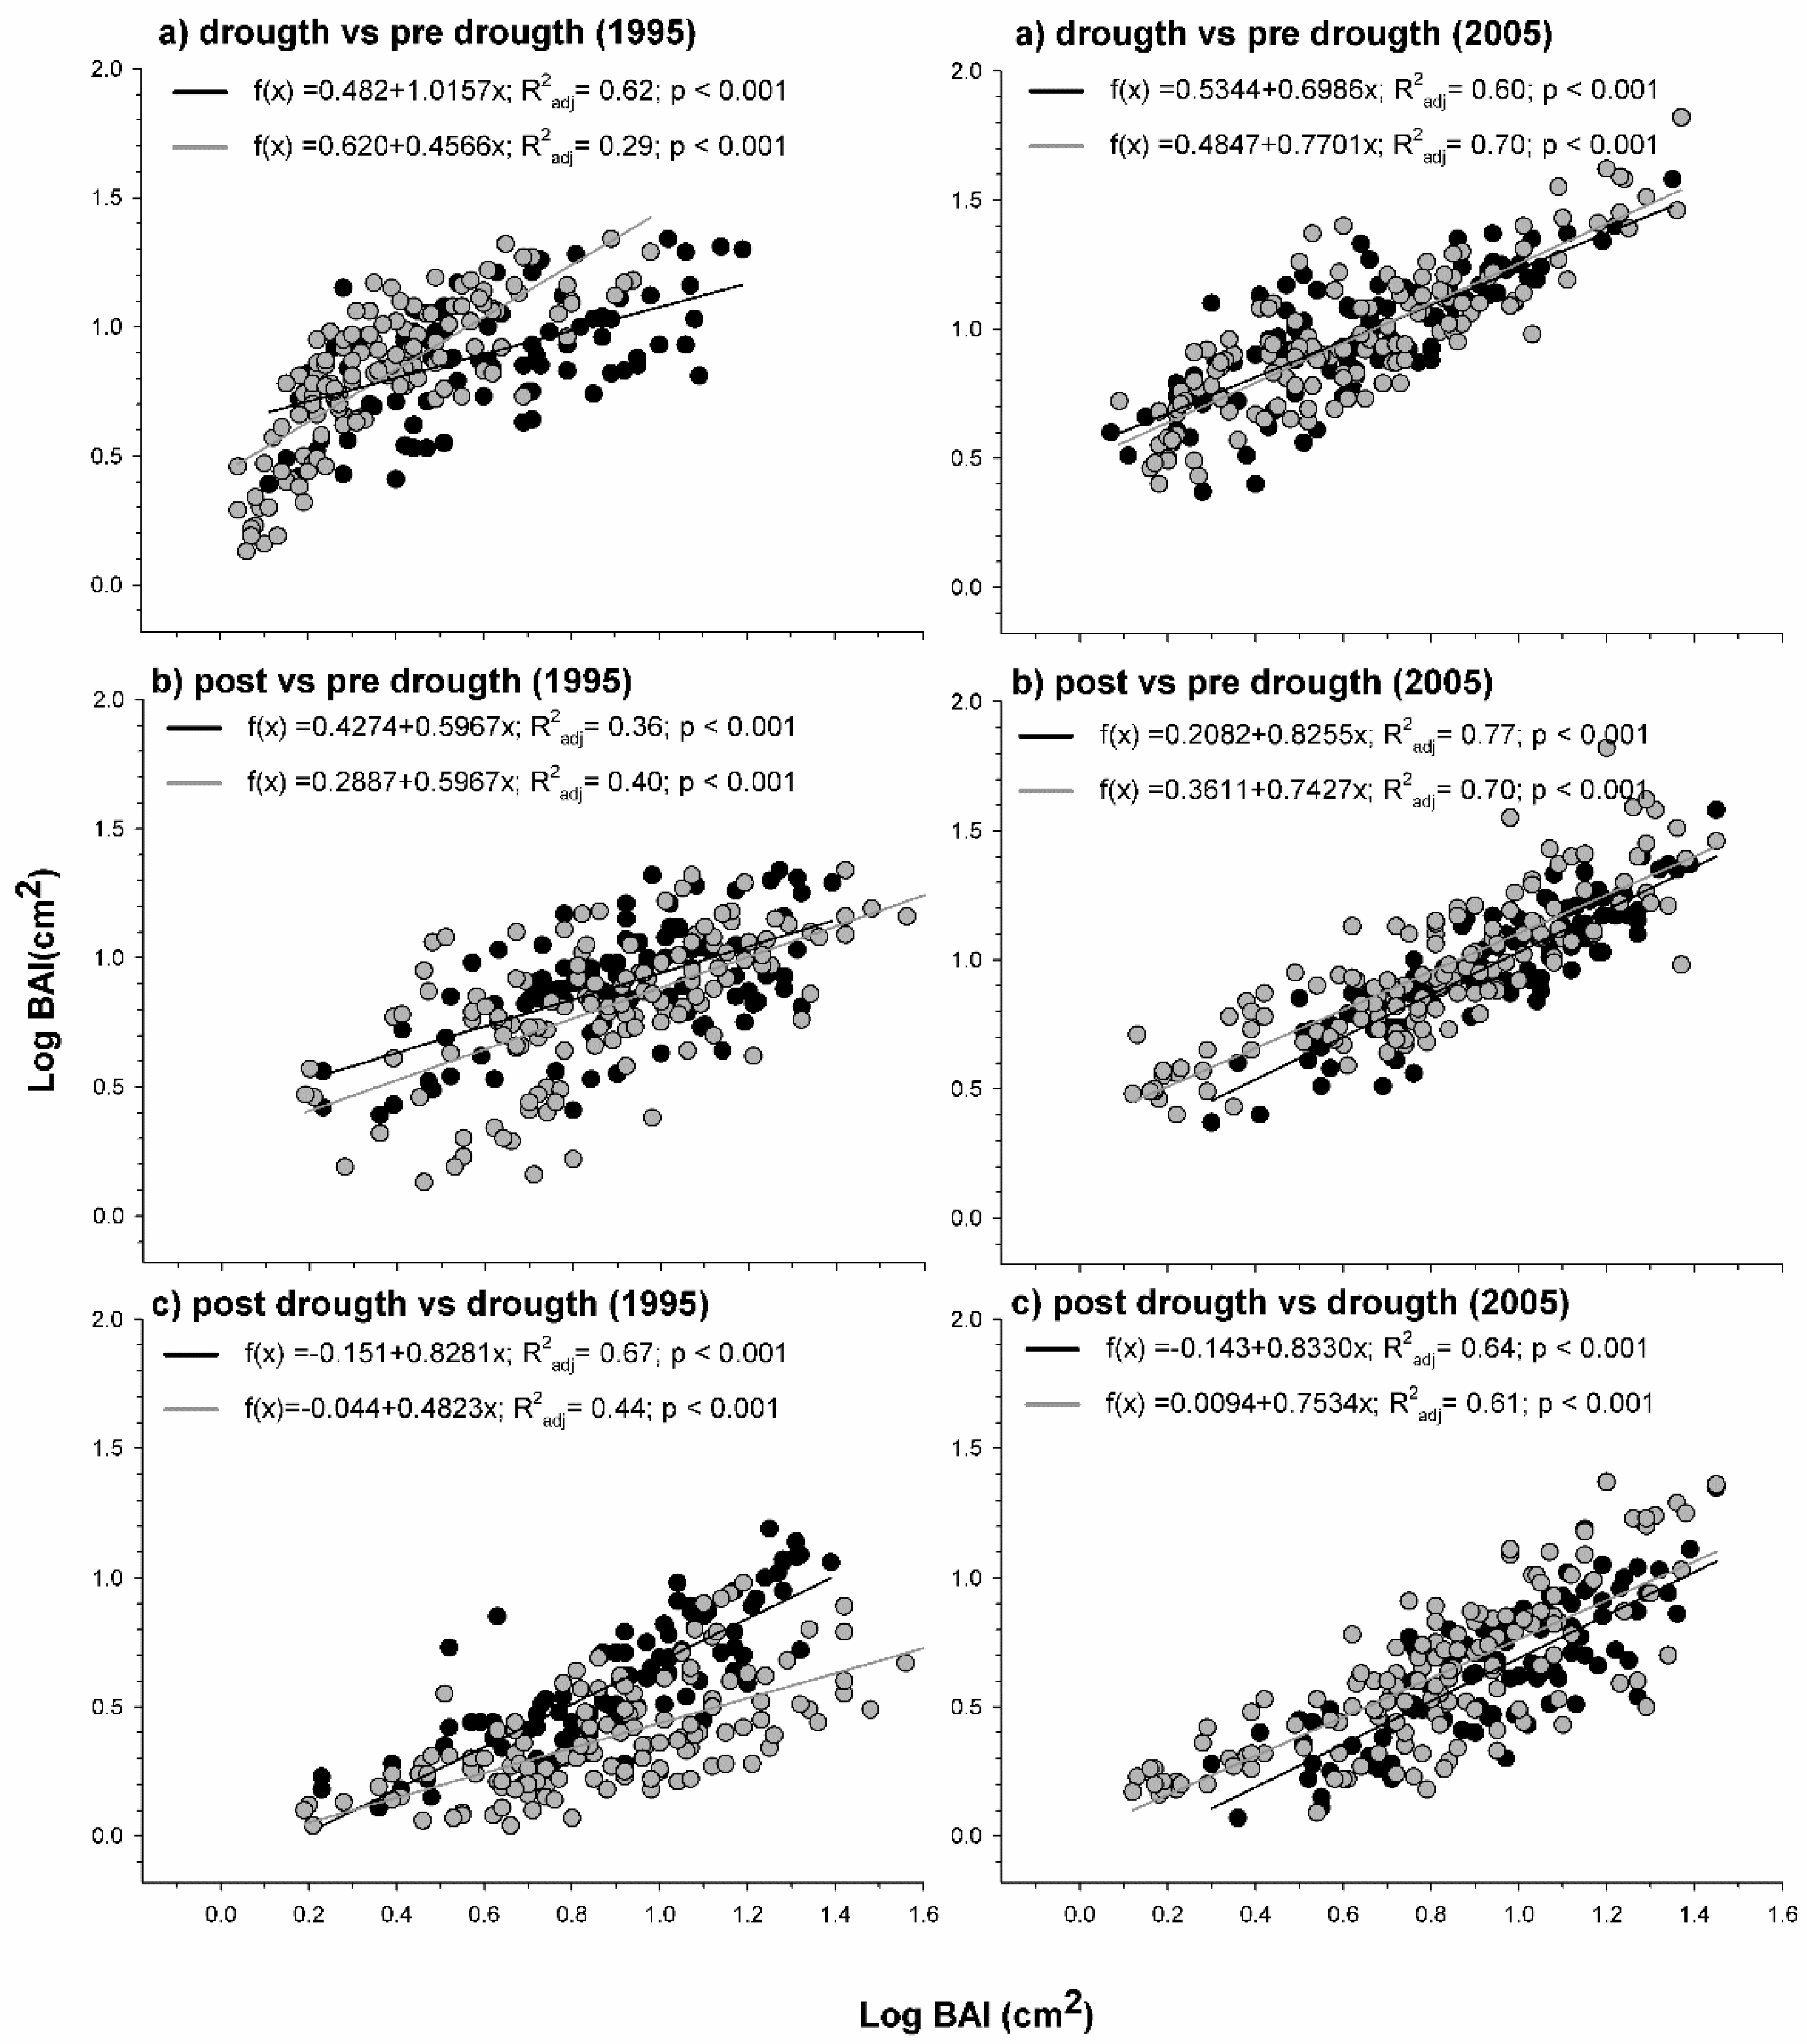
3.1. Structure, Growth, and Sensitivity to Drought

The first-order autocorrelation (AC1) of the tree-ring width individual series was higher in the natural than in the planted stands (F = 4.24, p < 0.05), suggesting greater year-to-year similarity in the growth of natural stands. On the other hand, the mean sensitivity (MS) was higher in the planted than natural stands (F = 28.21, p < 0.05), indicating greater variability of radial growth in the planted stands (Table 2). The expressed population signal (EPS) and mean correlation between trees (Rbt) were higher in the planted than in natural stands (F = 32.25, p < 0.05; F = 38.94, p < 0.05, respectively), which could confirm a greater growth coherency amongst trees in the planted stands.
We found a marked decrease in the BAI during two principal droughts (1994–1995, 2005); nevertheless, both the BAI and the impact of drought on growth varied between sites and among natural and planted stands. The mean relative reduction in BAI (BAIdec) in response to the first selected drought (1994–1995) was significantly greater (F = 24.48, p < 0.05) in planted (77.80% ± 2.50%) than in natural stands (52.00% ± 15.00%); however, no significant difference was found for the 2005 drought (Figure 2).
There was a significant and strong linear relationship between the growth before, during, and after the selected drought (Figure 3). In addition, we found differences in the correlation coefficients amongst plantations (R2adj = 0.37) and natural stands (R2adj = 0.55) for the 1995 drought. Moreover, weaker correlations were found in comparison to the 2005 drought (1995, R2adj = 0.46; 2005, R2adj = 0.67), for which there were no significant differences between the plantations and natural stands (R2adj = 0.67).

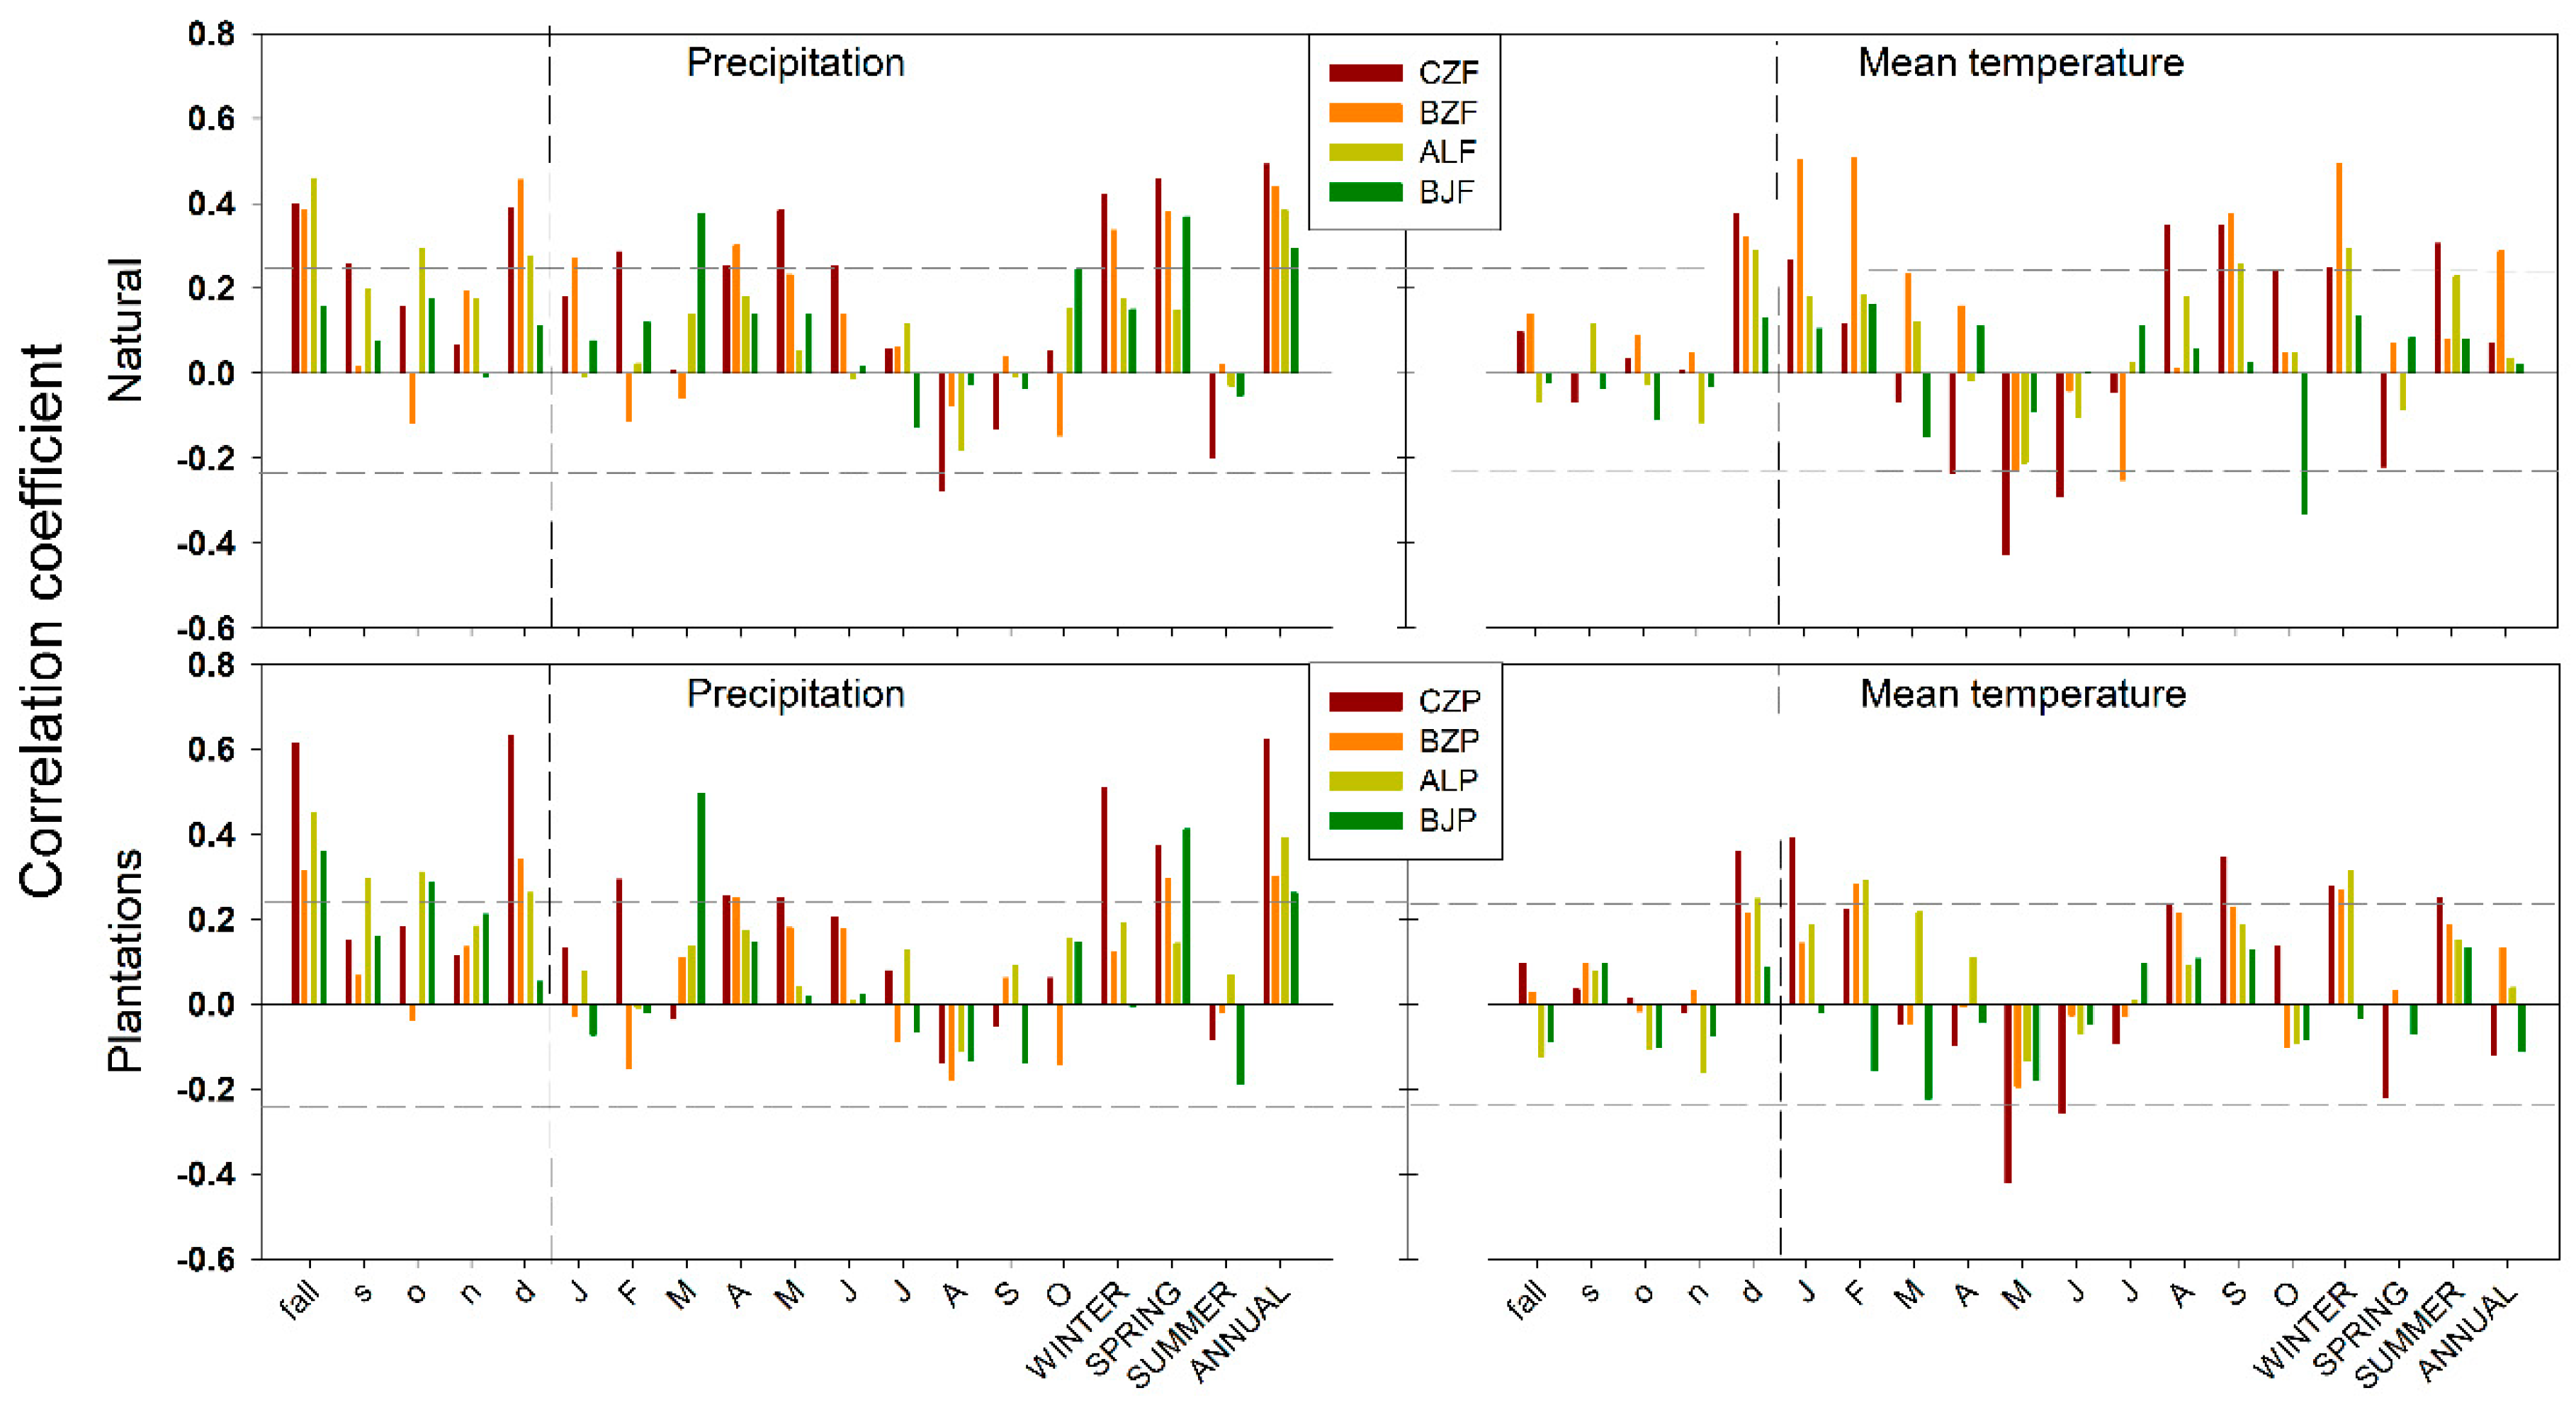
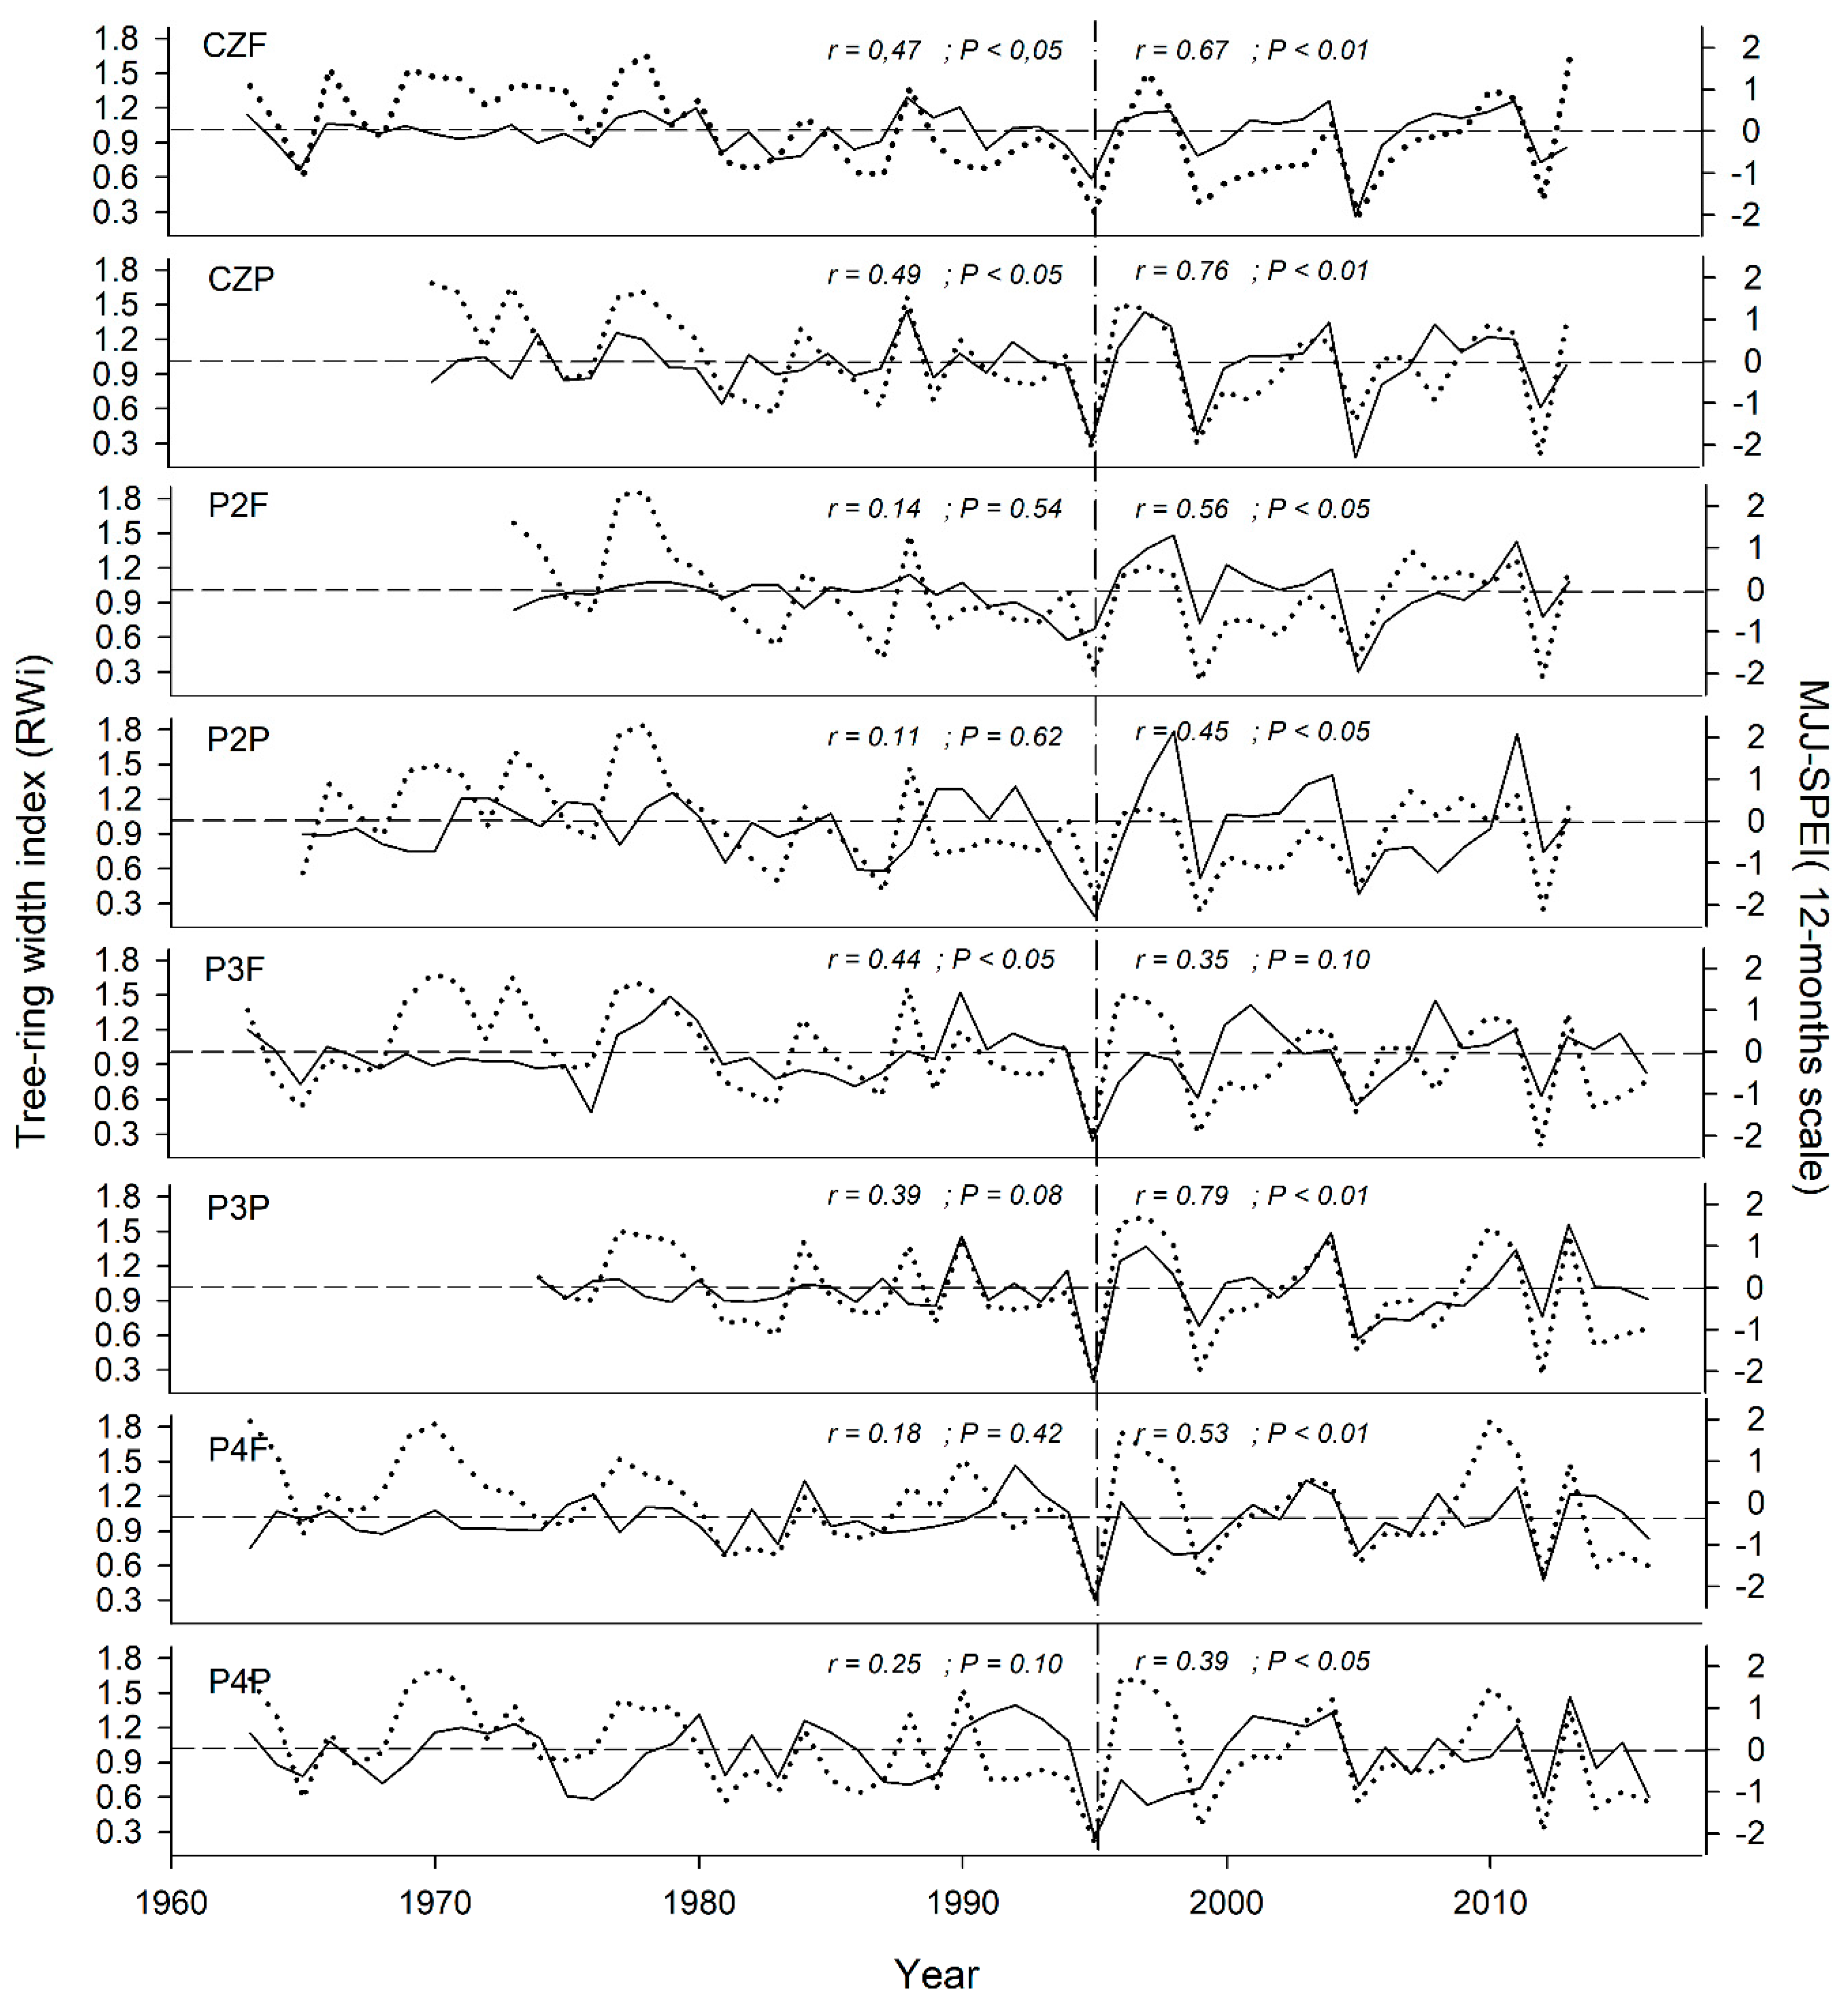
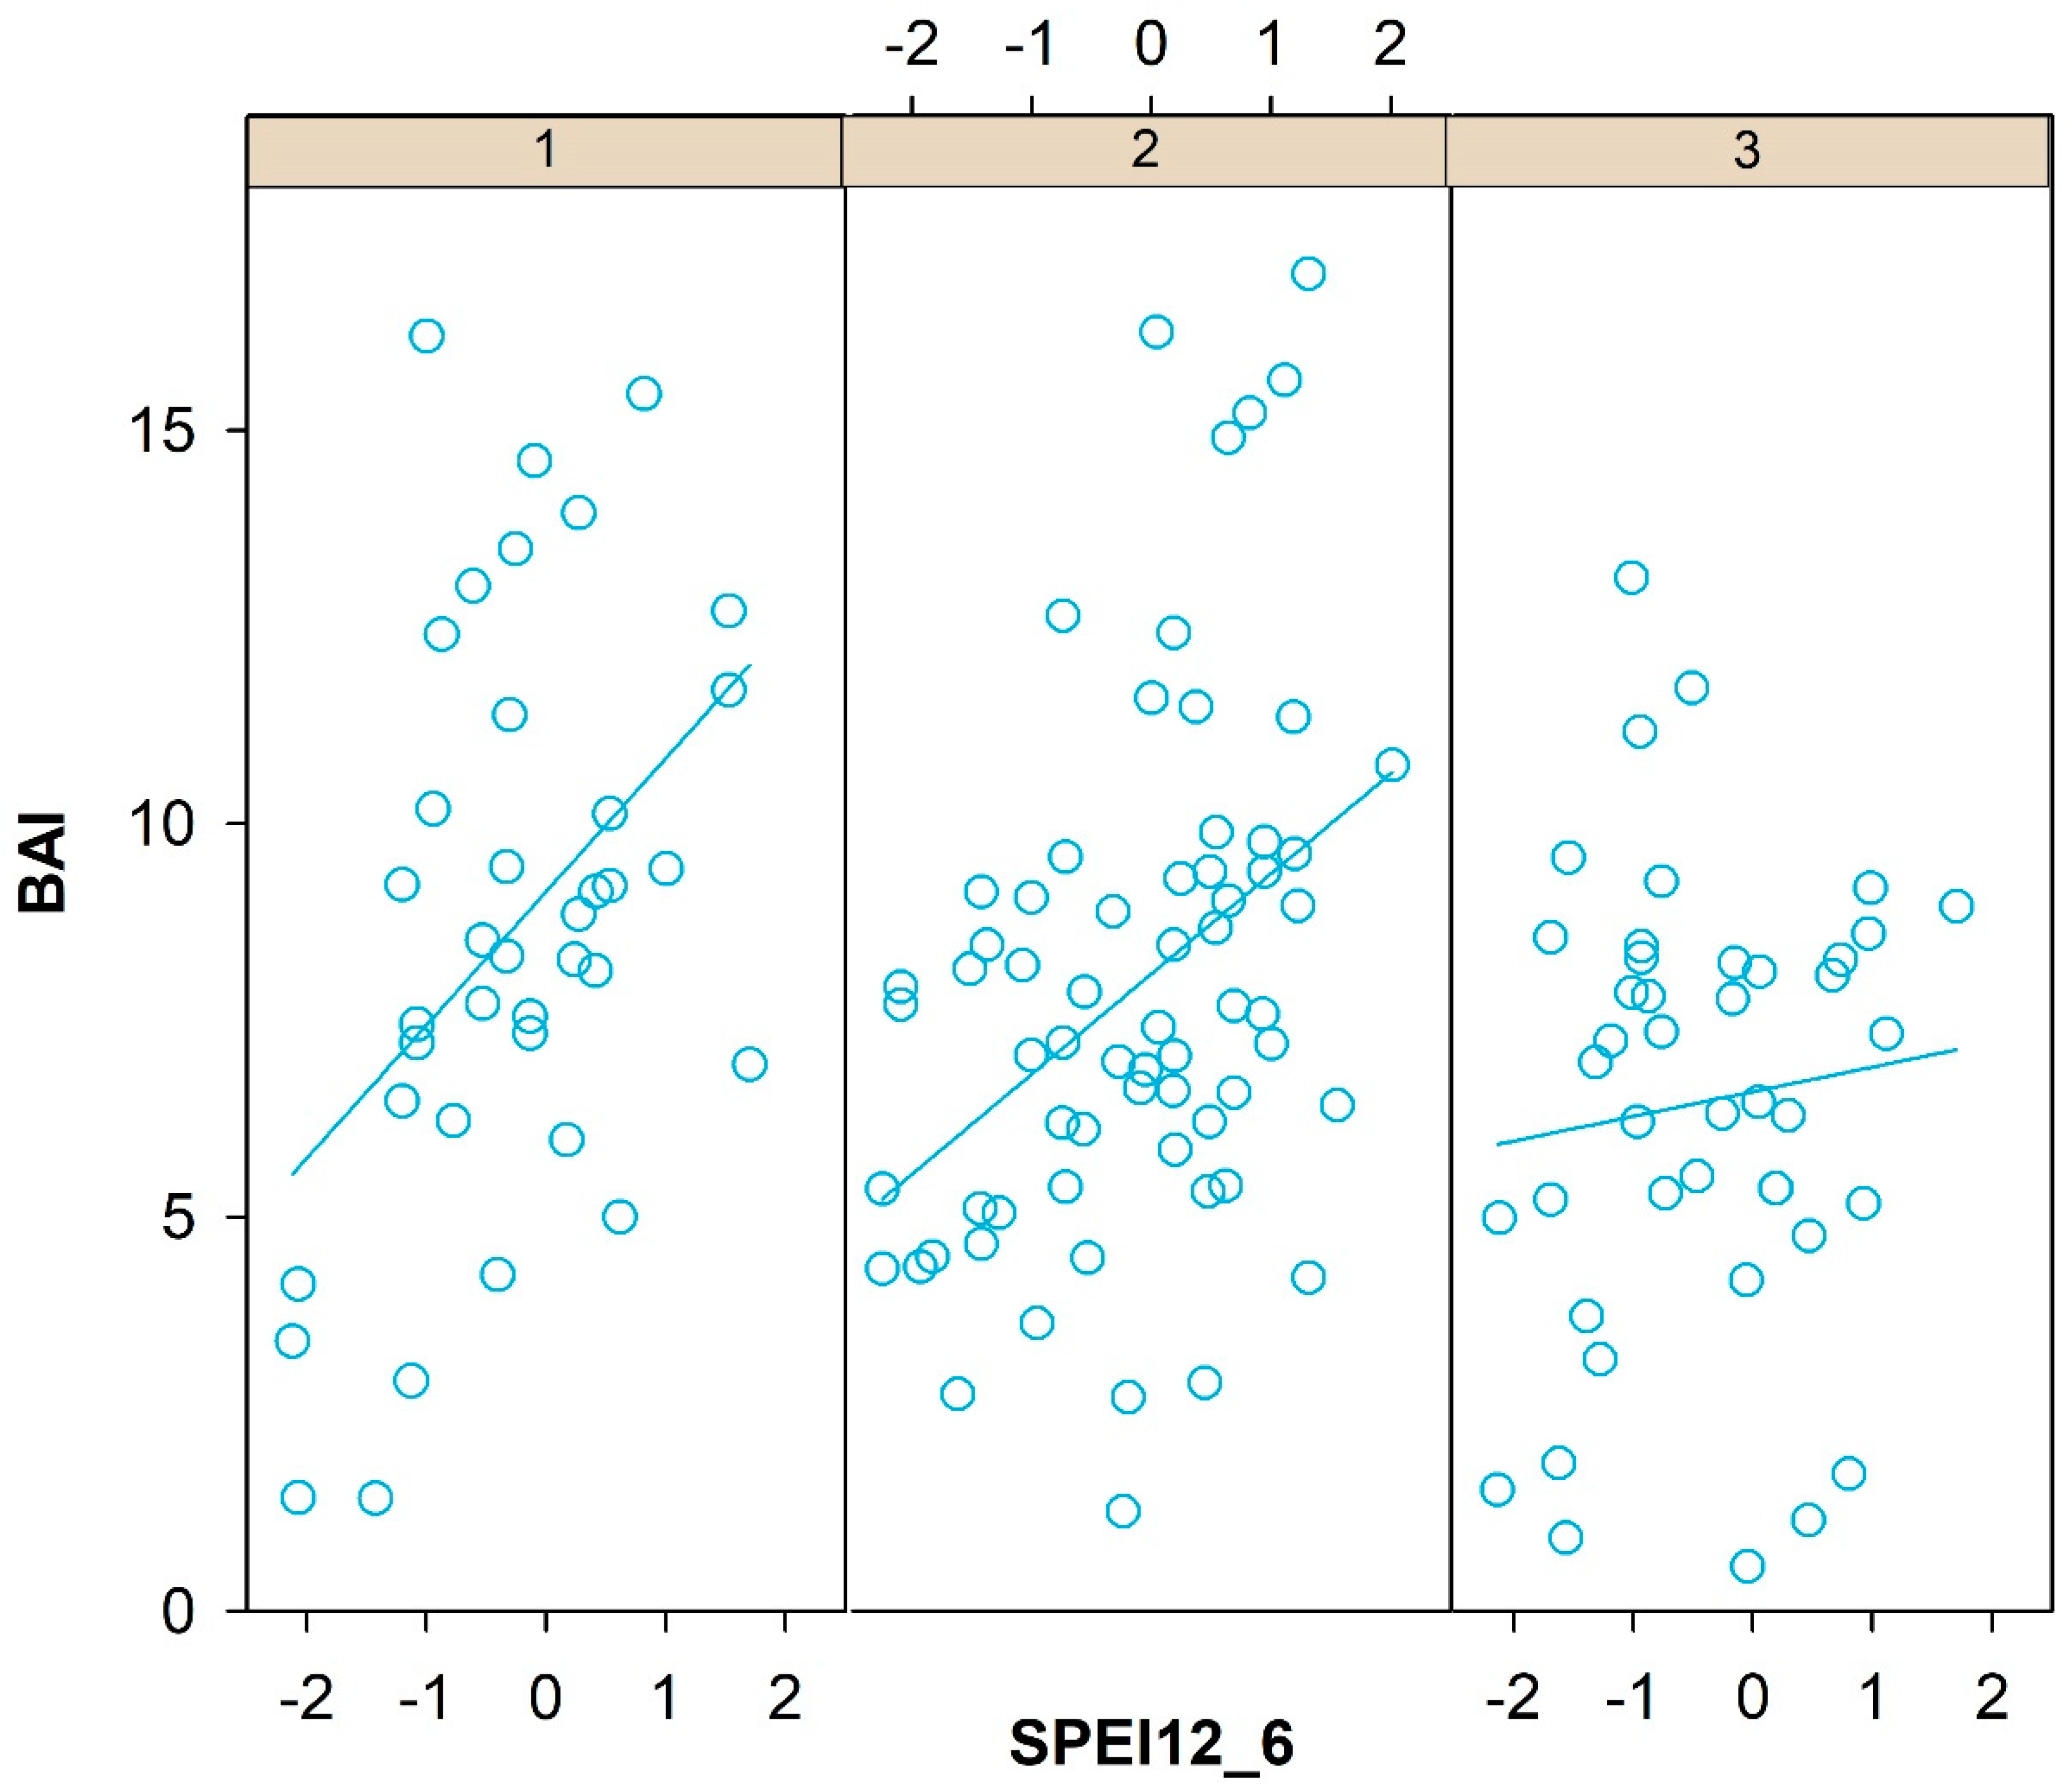
3.2. Climate-Growth Relationships

Concerning the influence of precipitation on growth, we observed (Figure 4) differences among locations. In Sierra Bermeja (BJ, dark green bars) early spring precipitation (March) enhanced growth, whereas a wet previous December and late spring precipitation (April) promoted growth in more-inland locations (CZ, BZ, and AL). In addition, the precipitation in the previous fall had a positive influence on both the natural and planted stands in all provenances of the region, except for natural forest in the wettest site (BJ). Warm conditions during winter were significantly and positively associated with growth in all locations, with the exception of the southernmost one (BJ). On the other hand, tree growth benefited from cold temperatures during spring and early summer.
The correlations between the RWI and SPEI before and after the 1995 drought (Figure 5) showed significant differences, with the exception of the natural forest at location (AL), for which the correlations were similar. ALF showed a lower correlation after 1995 than before 1995. For all other sites, the correlation values increased after the 1995 drought event. The mean increment in the correlation coefficients was higher in the planted (Δ = 0.28) than the natural stands (Δ = 0.09), when comparing the periods prior and subsequent to the 1995 drought, for all locations.

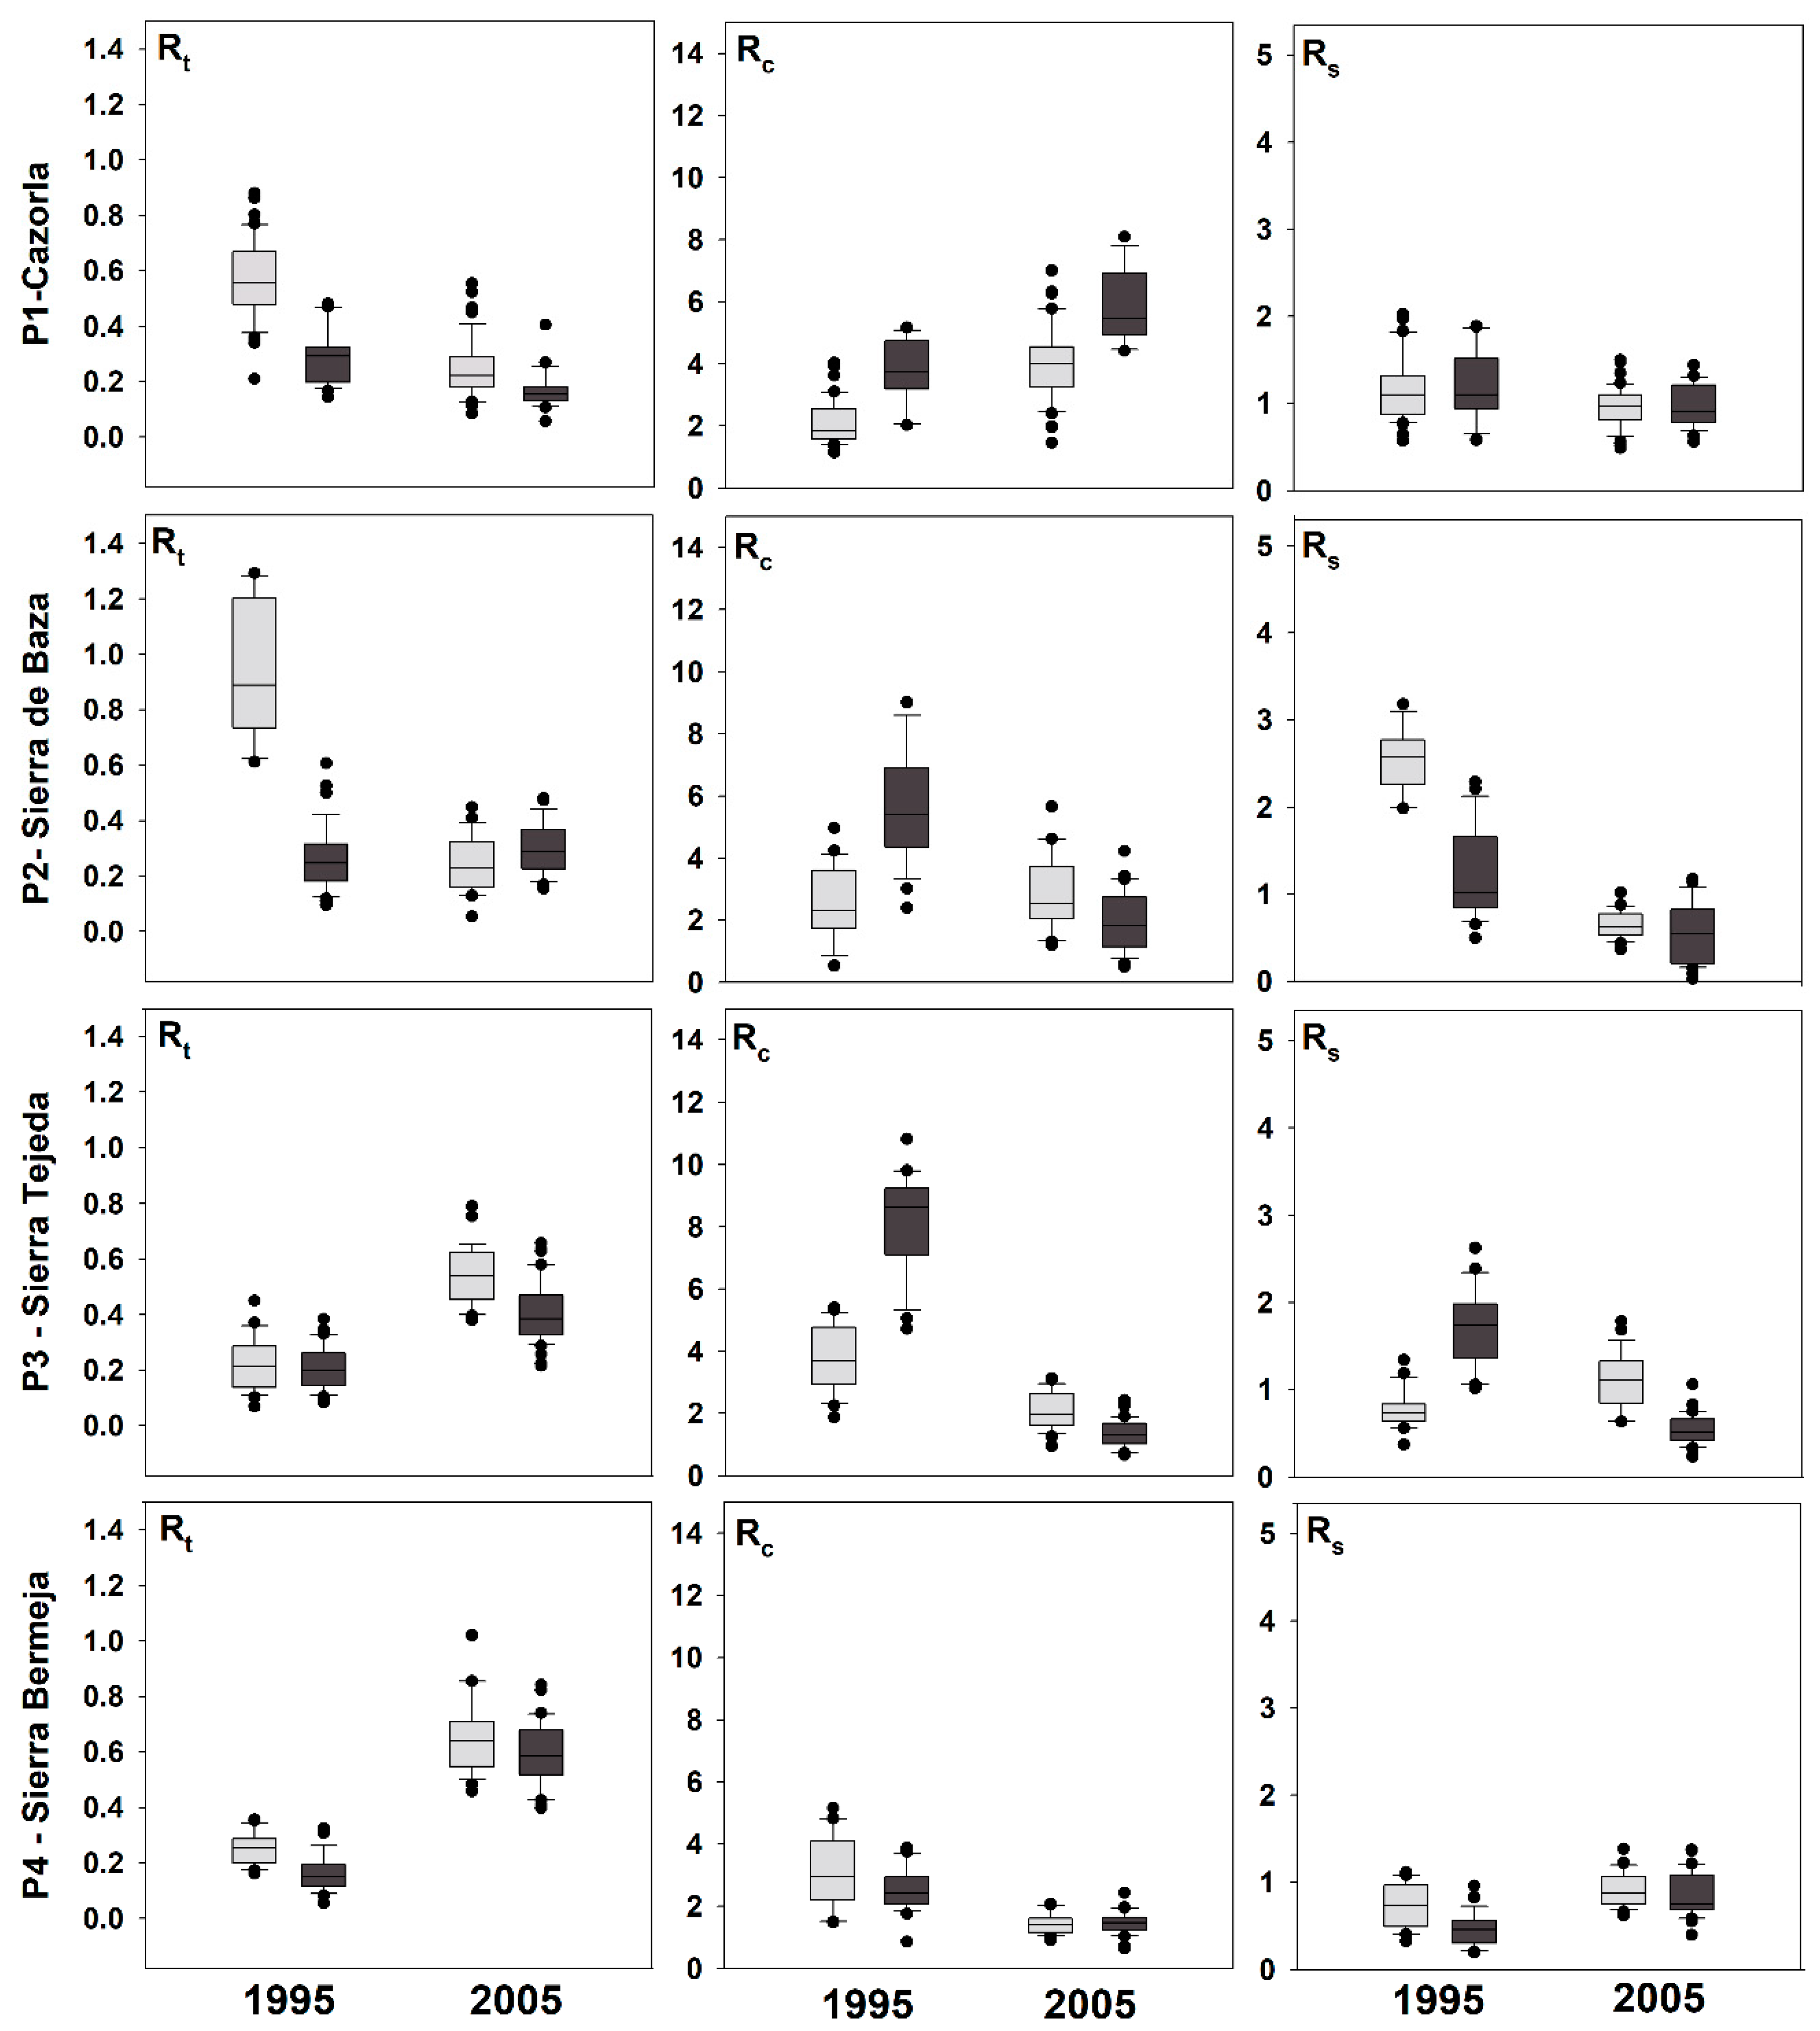
3.3. Climatic Response Indices

The stand type had a significant influence on the climate response indices, affecting all the Rc values of the 1995 drought, except at location BJ, although no differences were observed for the 2005 drought between the natural and planted forests. In addition, there were significant differences at location BZ for Rt, Rc, and Rs for the 1995 drought, unlike the 2005 drought—for which the values of these indices were similar for the natural and planted P. pinaster forests (Figure 6).

3.4. Effects of Defoliation on Growth

With respect to the influence of defoliation on growth, growth across all defoliation levels displayed significant positive correlations with SPEI12_6. However, defoliation levels 1 and 2 showed a strong positive correlation between growth and SPEI12_6, whilst defoliation level 3 was moderately correlated with growth (Figure 7). The response functions emphasized the negative effect of defoliation and drought on growth.

4. Discussion

Increased vulnerability of forests to high temperatures combined with droughts is a worldwide phenomenon that is well illustrated as coinciding with widespread mortality of tree species. It contributes to the expansion of other forest perturbations, such as forest fires and forest pest populations [29]. These interactions are altering forest ecosystems worldwide [44]. Our study was a valuable analysis of the contrasting climate sensitivities of natural and planted stands of maritime pine, which provided useful information for a better understanding of the growth responses to expected drought events. We found differential climate response to be a function of the biogeographical gradient and stand origin, as we had initially hypothesized. The results revealed a cumulative loss of resilience in response to recurrent drought, which indicated that future drought-induced mortality would happen in both natural and planted stands.

4.1. Contrasting Growth Responses to Drought in Planted and Natural Stands

Drought-induced stress of Mediterranean pines is negatively related to radial growth; accordingly, such decreases in growth related to the main droughts recorded in the south of the Mediterranean Basin have been especially significant [45]. In general, natural stands were found to have a greater resilience in response to drought, when compared with planted stands [46]. Our results for the BAI reduction in response to drought confirmed this, when comparing the natural (52% reduction) and planted (78%) stands for the first drought in the study period (1994–1995). However, this difference was insignificant during the next drought, suggesting a loss of resilience in response to the cumulative drought stress for natural stands [14]. The SPEI values were similar in both droughts (Figure 5), which indicated that they responded to similar climatic conditions in terms of duration, seasonality, and severity of the drought.
Temperatures and spring droughts have been reported as the main drivers of growth for tree species in the Mediterranean forests [12,47,48]. We found a strong, positive effect on growth from precipitation during the previous fall and current winter, implying the importance of water availability prior to the start of the growing season [49,50]. In addition, the growth was positively affected by a warmer late winter and by spring precipitation, for which we found differences between inland sites and sites with a coastal influence (Figure 4). This difference could be related to an earlier start of the growing season at the site with higher precipitation and milder temperatures (BJ) [15,28]. In agreement with previous studies, we also demonstrated that the radial growth of both the natural and planted stands was affected by long-term drought stress (Figure 5). We found a temporal variability in this relationship, which could be related to a greater importance of climate in the growth of populations near the rear edge of this species in the future [51].

4.2. Climate Response Indices

Climate response indices have been extensively used in dendrochronological studies, not only to evaluate drought impacts on maritime pine growth but also to measure the time scale of tree growth recovery after drought periods [19,29]. For the 1994–1995 drought, the values of the recovery index (Rc) were higher in planted than in natural stands, although natural stands had, in general, higher values of resistance (Rt) and resilience (Rs) indices. Besides, the climate response indices did not differ significantly between the two types of stands during the 2005 drought. During the two studied droughts, the values of Rc were lower for natural stands at more-inland locations, although differences as a function of pine provenance were not found for the planted stands. Our results agree with previous studies showing that planted stands are more vulnerable and less resilient in response to drought-induced stress [52,53]. This vulnerability has been related to structural factors and site conditions, such as high tree density or the existence of plantations beyond the ecological limits of a species [28].
The negative effect of repeated drought events over time is reflected in decreasing plasticity and resilience of natural stands, when comparing the two studied droughts (1995; 2005). One of the reasons for the loss of resilience in natural stands during the 2005 drought could be the cumulative effect of droughts after the 1995 drought. Although the two major droughts occurred in 1995 and 2005, it was noteworthy that there were other interspersed droughts (e.g., 1999), which may have exacerbated the cumulative effect of the prior droughts. The loss of resilience of the growth response to cumulative drought stress has been associated with a progressive reduction in carbohydrates reserves (carbon starvation) and hydraulic failures induced when xylem tension exceeds that cavitation thresholds, especially in isohydric species [54,55]. This progressive loss of tree vigor is related to widespread mortality events after extreme drought years [56]. Additionally, our results indicated a similar response to drought in both the natural and planted stands, after cumulative drought-induced stress. However, one single follow-up event could not be enough for this response, particularly when there was a 10 year period in between the drought events and other factors such as the relationship between drought and competition, site conditions, or incidence of pests could be implicated in resilience changes.

4.3. Effect of Defoliation on Growth

In this study, we addressed the sensitivity of Pinus pinaster, natural and planted forests together, to several defoliation levels. These results provide additional support to previous studies on forest decline showing that tree growth is constrained by climatic and site conditions, besides being conditioned by structural factors (competition, defoliation, etc.), in Mediterranean forests [19,57]. The majority of growth studies are based on the traditional forest inventory with diameter measurements. However, tree-ring series provide more accurate estimations of radial growth than inventory data because they allow reconstruction at fine resolutions [58]. However, in the P. pinaster forests, included in these climatic variables were the most important factors affecting tree growth. The previous long (SPEI12_6) climatic conditions affect maritime pine growth, which, in addition, is conditioned by the precipitation during the growing season and the temperatures prior to this period. The structural and site conditions were not significant in the variable selection process, which reflected the weak relationships between these variables and tree growth on the Pinus pinaster forest in southern Spain. In general, drought, expressed as by SPEI, led to a decline in the growth of Pinus pinaster due to stress, and it resulted in severe crown damage and the death of even large mature Pinus pinaster forests [20,29]. Significant reductions in tree growth, with increasingly negative growth effects, the higher the defoliation rates, were observed. Increased foliage removal increased the depression of growth, due to the lack of photosynthate, which is dependent on the amount of live foliage [59], thereby limiting the production of photosynthate available for maintenance and growth [31]. After crown damage, the available starch will be redirected to photosynthetic tissues (e.g., defoliation) instead of radial growth, which exacerbates the mechanisms leading to tree mortality [57,60]. Our findings also demonstrated that the strength of the correlation response of BAI to drought according to the defoliation level. Specifically, forests under severe defoliation (>20%) were less correlated with drought indices than the low defoliations stands showing a loss of resilience capacity to endure droughts [24,61,62]. This response can explain a significant part of the damage predictions and mortality observed in these forests within the context of increasing temperature and droughts, simultaneously with increased defoliation.

4.4. Management Implications

Management practices can mitigate or exacerbate the effects of drought at tree and stand levels through the manipulation of species, size, and density. In the context of plantations and anthropic forests, thinning practices regulate stand structural attributes that reduce vulnerability to drought [4,63]. In the Pinus pinaster forests in our study area, species composition can be altered directly through selective removal of suppressed or co-dominant individuals in more drought-sensible stands. Such replacement may occur naturally following drought-induced dieback or through thinning [64]. Otherwise, the fire and pest hazard that comes with non-management options could cause irreversible losses of forest areas [65]. Management of drought through active involvement in the structure and regeneration processes is a fundamental requirement for the adaptation to climatic change of this type in especially vulnerable forests.
For future researches, we recommended exploration of the growth response using individual non-linear models to get a better resolution [66]. In this study we did not consider the tree spatial location of trees and other competition indexes. This variable could improve the understanding of the growth response of trees after treatment according to Girona (2016) [58]. Thus, more research will be necessary to confirm this question.

5. Conclusions

We have illustrated the main climatic drivers concerning maritime pine radial growth and the influence of site conditions and structural factors. Planted stands are more vulnerable to drought-induced tree mortality than natural stands, although the accumulation of dry periods together with extreme drought events could constrain the growth of both natural and planted stands in the future. The main constrain to growth in inland maritime pine populations (CZ, BZ) seems to be dry conditions during late spring. In contrast, at more-coastal sites (BJ, AL), the water supply during spring—concurrent with the growing season—appears to be the main constrain. Modeling of tree radial growth is difficult due to its highly variable nature over time and space. Nevertheless, the combination of dendrochronology and defoliation, with a correct approach to the relationships between them, are useful tools for our understanding of forest decline dynamics in the future and the identification of the drivers’ factors involved in forest dieback. These models are vital for any analysis of large-scale forestry scenarios and the development of silvicultural alternatives, such as intensive thinning operations to prevent mortality of natural and planted forests.

Author Contributions

R.M.N.-C. and C.R.-V. planned and designed the research, conducted the fieldwork and performed dendrochronological experiments, contributed to data elaboration and analysis, and wrote the manuscript, with equal contributions by both authors.

Funding

This project was funded through the INIA-RTA (RTA2014-00005-00-00) and ESPECTRAMED (CGL2017-86161-R) projects.

Acknowledgments

We also acknowledge the financial and institutional support of the University of Cordoba-Campus de Excelencia CEIA3. We thank the “Consejeria de Medioambiente y Ordenación del Território” (Junta de Andalucía) and the “RED SEDA NETWORK” (Junta de Andalucía) for providing field work support. We also thank F.J. Ruíz Gómez, R. Sánchez de la Cuesta, the ERSAF group and, particularly, the staff of the Dendrochronology, Silviculture and Climate Change Laboratory at Cordoba University, for their assistance during this research.

Conflicts of Interest

The authors declare no conflict of interest.

Appendix A

Figure A1. Point location of the Andalusia Forest Health Network (SEDA network) distribution within Andalusia.
Forests 10 00603 g0a1

References

  1. Clark, J.S.; Iverson, L.; Woodall, C.W.; Allen, C.D.; Bell, D.M.; Bragg, D.C.; D’Amato, A.W.; Davis, F.W.; Hersh, M.H.; Ibanez, I.; et al. The impacts of increasing drought on forest dynamics, structure, and biodiversity in the United States. Glob. Chang. Biol. 2016, 22, 2329–2352. [Google Scholar] [CrossRef] [Green Version]
  2. Navarro, L.; Morin, H.; Bergeron, Y.; Girona, M.M. Changes in Spatiotemporal Patterns of 20th Century Spruce Budworm Outbreaks in Eastern Canadian Boreal Forests. Front. Plant Sci. 2018, 9, 1905. [Google Scholar] [CrossRef] [Green Version]
  3. Seidl, R.; Thom, D.; Kautz, M.; Martin-Benito, D.; Peltoniemi, M.; Vacchiano, G.; Wild, J.; Ascoli, D.; Petr, M.; Honkaniemi, J.; et al. Forest disturbances under climate change. Nat. Clim. Chang. 2017, 7, 395–402. [Google Scholar] [CrossRef] [Green Version]
  4. Bennett, S.; Wernberg, T.; Arackal Joy, B.; de Bettignies, T.; Campbell, A.H. Central and rear-edge populations can be equally vulnerable to warming. Nat. Commun. 2015, 6, 10280. [Google Scholar] [CrossRef]
  5. Young, D.J.N.; Stevens, J.T.; Earles, J.M.; Moore, J.; Ellis, A.; Jirka, A.L.; Latimer, A.M. Long-term climate and competition explain forest mortality patterns under extreme drought. Ecol. Lett. 2017, 20, 78–86. [Google Scholar] [CrossRef]
  6. Allen, C.D.; Macalady, A.K.; Chenchouni, H.; Bachelet, D.; McDowell, N.; Vennetier, M.; Kitzberger, T.; Rigling, A.; Breshears, D.D.; Hogg, E.H.; et al. A global overview of drought and heat-induced tree mortality reveals emerging climate change risks for forests. For. Ecol. Manag. 2010, 259, 660–684. [Google Scholar] [CrossRef] [Green Version]
  7. Allen, C.D.; Breshears, D.D.; McDowell, N.G. On underestimation of global vulnerability to tree mortality and forest die-off from hotter drought in the Anthropocene. Ecosphere 2015, 6, art129. [Google Scholar] [CrossRef]
  8. Martínez-Vilalta, J.; Lloret, F. Drought-induced vegetation shifts in terrestrial ecosystems: The key role of regeneration dynamics. Glob. Planet. Chang. 2016, 144, 94–108. [Google Scholar] [CrossRef] [Green Version]
  9. Sapes, G.; Serra-Diaz, J.M.; Lloret, F. Species climatic niche explains drought-induced die-off in a Mediterranean woody community. Ecosphere 2017, 8, e01833. [Google Scholar] [CrossRef]
  10. Adams, H.D.; Macalady, A.K.; Breshears, D.D.; Allen, C.D.; Stephenson, N.L.; Saleska, S.R.; Huxman, T.E.; McDowell, N.G. Climate-Induced Tree Mortality: Earth System Consequences. Eos 2010, 91, 153–154. [Google Scholar] [CrossRef]
  11. IPCC. Climate Change 2013: The Physical Science Basis. Contribution of Working Group I to the Fifth Assessment Report of the Intergovernmental Panel on Climate Change; Stocker, T.F., Qin, D., Plattner, G.K., Tignor, M., Allen, S.K., Boschung, J., Nauels, A., Xia, Y., Bex, V., Midgley, P.M., Eds.; Cambridge University Press: New York, NY, USA, 2013. [Google Scholar]
  12. Anderegg, W.R.L.; Kane, J.M.; Anderegg, L.D.L. Consequences of widespread tree mortality triggered by drought and temperature stress. Nat. Clim. Chang. 2013, 3, 30–36. [Google Scholar] [CrossRef]
  13. Greenwood, S.; Ruiz-Benito, P.; Martínez-Vilalta, J.; Lloret, F.; Kitzberger, T.; Allen, C.D.; Fensham, R.; Laughlin, D.C.; Kattge, J.; Bönisch, G.; et al. Tree mortality across biomes is promoted by drought intensity, lower wood density and higher specific leaf area. Ecol. Lett. 2017, 20, 539–553. [Google Scholar] [CrossRef]
  14. Lloret, F.; Keeling, E.G.; Sala, A. Components of tree resilience: Effects of successive low-growth episodes in old ponderosa pine forests. Oikos 2011, 120, 1909–1920. [Google Scholar] [CrossRef]
  15. Gazol, A.; Ribas, M.; Gutiérrez, E.; Camarero, J.J. Aleppo pine forests from across Spain show drought-induced growth decline and partial recovery. Agric. For. Meteorol. 2017, 232, 186–194. [Google Scholar] [CrossRef]
  16. Madrigal-González, J.; Andivia, E.; Zavala, M.A.; Stoffel, M.; Calatayud, J.; Sánchez-Salguero, R.; Ballesteros-Cánovas, J. Disentangling the relative role of climate change on tree growth in an extreme Mediterranean environment. Sci. Total. Environ. 2018, 642, 619–628. [Google Scholar] [CrossRef]
  17. Payn, T.; Carnus, J.M.; Freer-Smith, P.; Kimberley, M.; Kollert, W.; Liu, S.; Orazio, C.; Rodriguez, L.; Silva, L.N.; Wingfield, M.J. Changes in planted forests and future global implications. For. Ecol. Manag. 2015, 352, 57–67. [Google Scholar] [CrossRef] [Green Version]
  18. Pausas, J.G.; Bladé, C.; Valdecantos, A.; Seva, J.P.; Fuentes, D.; Alloza, J.A.; Vilagrosa, A.; Bautista, S.; Cortina, J.; Vallejo, R. Pines and oaks in the restoration of Mediterranean landscapes of Spain: New perspectives for an old practice—a review. Plant Ecol. 2004, 171, 209–220. [Google Scholar] [CrossRef]
  19. Sánchez-Salguero, R.; Camarero, J.J.; Dobbertin, M.; Fernández-Cancio, Á.; Vilà-Cabrera, A.; Manzanedo, R.D.; Zavala, M.A.; Navarro-Cerrillo, R.M. Contrasting vulnerability and resilience to drought-induced decline of densely planted vs. natural rear-edge Pinus nigra forests. For. Ecol. Manag. 2013, 310, 956–967. [Google Scholar] [CrossRef]
  20. Sánchez-Salguero, R.; Navarro, R.M.; Camarero, J.J.; Fernández-Cancio, Á. Drought-induced growth decline of Aleppo and maritime pine forests in south-eastern Spain. For. Syst. 2010, 19, 458. [Google Scholar] [CrossRef]
  21. de Luis, M.; Čufar, K.; Filippo, A.D.; Novak, K.; Papadopoulos, A.; Piovesan, G.; Rathgeber, C.B.K.; Raventós, J.; Saz, M.A.; Smith, K.T. Plasticity in Dendroclimatic Response across the Distribution Range of Aleppo Pine (Pinus halepensis). PLoS ONE 2013, 8, e83550. [Google Scholar] [CrossRef]
  22. Natalini, F.; Correia, A.C.; Vázquez-Piqué, J.; Alejano, R. Tree rings reflect growth adjustments and enhanced synchrony among sites in Iberian stone pine (Pinus pinea L.) under climate change. Ann. For. Sci. 2015, 72, 1023–1033. [Google Scholar] [CrossRef]
  23. Garzón, M.B.; de Dios, R.S.; Ollero, H.S. Effects of climate change on the distribution of Iberian tree species. Appl. Veg. Sci. 2008, 11, 169–178. [Google Scholar] [CrossRef]
  24. Sanguesa-Barreda, G.; Linares, J.C.; Camarero, J.J. Mistletoe effects on Scots pine decline following drought events: Insights from within-tree spatial patterns, growth and carbohydrates. Tree Physiol. 2012, 32, 585–598. [Google Scholar] [CrossRef]
  25. Viñas, R.; Caudullo, G.; De Rigo, D. Pinus pinaster in Europe: Distribution, habitat, usage and threats. In European Atlas of Forest Tree Species; Publications Office of the European Union: Luxembourg, 2016. [Google Scholar]
  26. Mazza, G.; Cutini, A.; Manetti, M.C. Influence of tree density on climate-growth relationships in a Pinus pinaster Ait. forest in the northern mountains of Sardinia (Italy). iForest 2014, 8, 456–463. [Google Scholar] [CrossRef]
  27. Kurz-Besson, C.B.; Lousada, J.L.; Gaspar, M.J.; Correia, I.E.; David, T.S.; Soares, P.M.M.; Cardoso, R.M.; Russo, A.; Varino, F.; Mériaux, C.; et al. Effects of Recent Minimum Temperature and Water Deficit Increases on Pinus pinaster Radial Growth and Wood Density in Southern Portugal. Front. Plant Sci. 2016, 7, 1170. [Google Scholar] [CrossRef]
  28. Caminero, L.; Génova, M.; Camarero, J.J.; Sánchez-Salguero, R. Growth responses to climate and drought at the southernmost European limit of Mediterranean Pinus pinaster forests. Dendrochronologia 2018, 48, 20–29. [Google Scholar] [CrossRef]
  29. Navarro-Cerrillo, R.; Rodriguez-Vallejo, C.; Silveiro, E.; Hortal, A.; Palacios-Rodríguez, G.; Duque-Lazo, J.; Camarero, J. Cumulative Drought Stress Leads to a Loss of Growth Resilience and Explains Higher Mortality in Planted than in Naturally Regenerated Pinus pinaster Stands. Forests 2018, 9, 358. [Google Scholar] [CrossRef]
  30. Bogino, S.M.; Bravo, F. Growth response of Pinus pinaster Ait. to climatic variables in central Spanish forests. Ann. For. Sci. 2008, 65, 506. [Google Scholar] [CrossRef]
  31. Puri, E.; Hoch, G.; Körner, C. Defoliation reduces growth but not carbon reserves in Mediterranean Pinus pinaster trees. Trees 2015, 29, 1187–1196. [Google Scholar] [CrossRef]
  32. Haylock, M.R.; Hofstra, N.; Tank, A.M.G.K.; Klok, E.J.; Jones, P.D.; New, M. A European daily high-resolution gridded data set of surface temperature and precipitation for 1950–2006. J. Geophys. Res. Atmos. 2008, 113. [Google Scholar] [CrossRef]
  33. Perez Latorre, A.V.; Hidalgo, H.; Cabezudo, B. Los tipos funcionales de la flora y vegetación de las peridotitas de Sierra Bermeja (Málaga): Estudio preliminar. In Las Zonas De Montaña: Gestión Y Biodiversidad; Universitat Autònoma de Barcelona: Barcelona, Spain, 2012. [Google Scholar]
  34. Red de equilibrios biológicos de Andalucía. Available online: http://www.juntadeandalucia.es/medioambiente/site/portalweb/menuitem.7e1cf46ddf59bb227a9ebe205510e1ca/?vgnextoid=095d7d834f2a1510VgnVCM2000000624e50aRCRD&vgnextchannel=6abe5d95c1191510VgnVCM2000000624e50aRCRD (accessed on 27 May 2019).
  35. Clyatt, K.A.; Crotteau, J.S.; Schaedel, M.S.; Wiggins, H.L.; Kelley, H.; Churchill, D.J.; Larson, A.J. Historical spatial patterns and contemporary tree mortality in dry mixed-conifer forests. For. Ecol. Manag. 2016, 361, 23–37. [Google Scholar] [CrossRef]
  36. Vicente-Serrano, S.M.; Beguería, S.; López-Moreno, J.I. A Multiscalar Drought Index Sensitive to Global Warming: The Standardized Precipitation Evapotranspiration Index. J. Clim. 2009, 23, 1696–1718. [Google Scholar] [CrossRef]
  37. Fritts, H.C. Tree Rings and Climate; The Blackburn Press: Caldwell, NJ, USA, 2001. [Google Scholar]
  38. Stokes, M.A. An Introduction to Tree-ring Dating; University of Arizona Press: Tucson, AZ, USA, 1996. [Google Scholar]
  39. Bunn, A.G. A dendrochronology program library in R (dplR). Dendrochronologia 2008, 26, 115–124. [Google Scholar] [CrossRef]
  40. Biondi, F.; Qeadan, F. A Theory-Driven Approach to Tree-Ring Standardization: Defining the Biological Trend from Expected Basal Area Increment. Tree Ring Res. 2008, 64, 81–96. [Google Scholar] [CrossRef]
  41. Mazza, G.; Manetti, M.C. Growth rate and climate responses of Pinus pinea L. in Italian coastal stands over the last century. Clim. Chang. 2013, 121, 713–725. [Google Scholar] [CrossRef]
  42. Wigley, T.M.L.; Briffa, K.R.; Jones, P.D. On the Average Value of Correlated Time Series, with Applications in Dendroclimatology and Hydrometeorology. J. Clim. Appl. Meteor. 1984, 23, 201–213. [Google Scholar] [CrossRef]
  43. Pinheiro, J.; Bates, D. Mixed-Effects Models in S and S-PLUS; Springer: New York, NY, USA, 2001. [Google Scholar]
  44. D’Orangeville, L.; Maxwell, J.; Kneeshaw, D.; Pederson, N.; Duchesne, L.; Logan, T.; Houle, D.; Arseneault, D.; Beier, C.M.; Bishop, D.A.; et al. Drought timing and local climate determine the sensitivity of eastern temperate forests to drought. Glob. Chang. Biol. 2018, 24, 2339–2351. [Google Scholar] [CrossRef]
  45. Spinoni, J.; Naumann, G.; Vogt, J.V.; Barbosa, P. The biggest drought events in Europe from 1950 to 2012. J. Hydrol. Reg. Stud. 2015, 3, 509–524. [Google Scholar] [CrossRef]
  46. Guada, G.; Camarero, J.J.; Sánchez-Salguero, R.; Cerrillo, R.M.N. Limited Growth Recovery after Drought-Induced Forest Dieback in Very Defoliated Trees of Two Pine Species. Front. Plant Sci. 2016, 7, 418. [Google Scholar] [CrossRef]
  47. Hartmann, H.; Adams, H.D.; Anderegg, W.R.L.; Jansen, S.; Zeppel, M.J.B. Research frontiers in drought-induced tree mortality: Crossing scales and disciplines. New Phytol. 2015, 205, 965–969. [Google Scholar] [CrossRef]
  48. Cailleret, M.; Jansen, S.; Robert, E.M.R.; Desoto, L.; Aakala, T.; Antos, J.A.; Beikircher, B.; Bigler, C.; Bugmann, H.; Caccianiga, M.; et al. A synthesis of radial growth patterns preceding tree mortality. Glob. Chang. Biol. 2017, 23, 1675–1690. [Google Scholar] [CrossRef]
  49. Carnicer, J.; Coll, M.; Ninyerola, M.; Pons, X.; Sánchez, G.; Peñuelas, J. Widespread crown condition decline, food web disruption, and amplified tree mortality with increased climate change-type drought. Proc. Natl. Acad. Sci. USA 2011, 108, 1474–1478. [Google Scholar] [CrossRef] [Green Version]
  50. Vicente-Serrano, S.M.; Gouveia, C.; Camarero, J.J.; Beguería, S.; Trigo, R.; López-Moreno, J.I.; Azorín-Molina, C.; Pasho, E.; Lorenzo-Lacruz, J.; Revuelto, J.; et al. Response of vegetation to drought time-scales across global land biomes. Proc. Natl. Acad. Sci. USA 2013, 110, 52–57. [Google Scholar] [CrossRef]
  51. Anderegg, W.R.L.; Martinez-Vilalta, J.; Cailleret, M.; Camarero, J.J.; Ewers, B.E.; Galbraith, D.; Gessler, A.; Grote, R.; Huang, C.; Levick, S.R.; et al. When a Tree Dies in the Forest: Scaling Climate-Driven Tree Mortality to Ecosystem Water and Carbon Fluxes. Ecosystems 2016, 19, 1133–1147. [Google Scholar] [CrossRef] [Green Version]
  52. Zhu, J.J.; Fan, Z.P.; Zeng, D.H.; Jiang, F.Q.; Matsuzaki, T. Comparison of stand structure and growth between artificial and natural forests of Pinus sylvestiris var. mongolica on sandy land. J. For. Res. 2003, 14, 103–111. [Google Scholar]
  53. Song, L.; Li, M.; Zhu, J.; Zhang, J. Comparisons of radial growth and tree-ring cellulose δ13C for Pinus sylvestris var. mongolica in natural and plantation forests on sandy lands. J. For. Res. 2017, 22, 160–168. [Google Scholar] [CrossRef]
  54. Sevanto, S.; Mcdowell, N.G.; Dickman, L.T.; Pangle, R.; Pockman, W.T. How do trees die? A test of the hydraulic failure and carbon starvation hypotheses. Plant Cell Environ. 2014, 37, 153–161. [Google Scholar] [CrossRef]
  55. Sánchez-Costa, E.; Poyatos, R.; Sabaté, S. Contrasting growth and water use strategies in four co-occurring Mediterranean tree species revealed by concurrent measurements of sap flow and stem diameter variations. Agric. For. Meteorol. 2015, 207, 24–37. [Google Scholar] [CrossRef] [Green Version]
  56. Fettig, C.J.; Mortenson, L.A.; Bulaon, B.M.; Foulk, P.B. Tree mortality following drought in the central and southern Sierra Nevada, California, U.S. For. Ecol. Manag. 2019, 432, 164–178. [Google Scholar] [CrossRef]
  57. Peña-Gallardo, M.; Vicente-Serrano, S.M.; Camarero, J.J.; Gazol, A.; Sánchez-Salguero, R.; Domínguez-Castro, F.; El Kenawy, A.; Beguería-Portugés, S.; Gutiérrez, E.; De Luis, M.; et al. Drought Sensitiveness on Forest Growth in Peninsular Spain and the Balearic Islands. Forests 2018, 9, 524. [Google Scholar] [CrossRef]
  58. Montoro Girona, M.; Morin, H.; Lussier, J.M.; Walsh, D. Radial Growth Response of Black Spruce Stands Ten Years after Experimental Shelterwoods and Seed-Tree Cuttings in Boreal Forest. Forests 2016, 7, 240. [Google Scholar] [CrossRef]
  59. Kozlowski, T.T. Carbohydrate sources and sinks in woody plants. Bot. Rev. 1992, 58, 107–222. [Google Scholar] [CrossRef]
  60. McDowell, N.; Allen, C.D.; Anderson-Teixeira, K.; Brando, P.; Brienen, R.; Chambers, J.; Christoffersen, B.; Davies, S.; Doughty, C.; Duque, A.; et al. Drivers and mechanisms of tree mortality in moist tropical forests. New Phytol. 2018, 219, 851–869. [Google Scholar] [CrossRef] [Green Version]
  61. Cavin, L.; Jump, A.S. Highest drought sensitivity and lowest resistance to growth suppression are found in the range core of the tree Fagus sylvatica L. not the equatorial range edge. Glob. Chang. Biol. 2017, 23, 362–379. [Google Scholar] [CrossRef]
  62. Gazol, A.; Camarero, J.J.; Vicente-Serrano, S.M.; Sánchez-Salguero, R.; Gutiérrez, E.; de Luis, M.; Sangüesa-Barreda, G.; Novak, K.; Rozas, V.; Tíscar, P.A.; et al. Forest resilience to drought varies across biomes. Glob. Chang. Biol. 2018, 24, 2143–2158. [Google Scholar] [CrossRef]
  63. Navarro-Cerrillo, R.M.; Sánchez-Salguero, R.; Rodriguez, C.; Duque Lazo, J.; Moreno-Rojas, J.M.; Palacios-Rodriguez, G.; Camarero, J.J. Is thinning an alternative when trees could die in response to drought? The case of planted Pinus nigra and P. Sylvestris stands in southern Spain. For. Ecol. Manag. 2019, 433, 313–324. [Google Scholar] [CrossRef]
  64. Newman, B.D.; Wilcox, B.P.; Archer, S.R.; Breshears, D.D.; Dahm, C.N.; Duffy, C.J.; McDowell, N.G.; Phillips, F.M.; Scanlon, B.R.; Vivoni, E.R. Ecohydrology of water-limited environments: A scientific vision. Wat. Res. Res. 2006, 42. [Google Scholar] [CrossRef]
  65. Camarero, J.J.; Linares, J.C.; Sangüesa-Barreda, G.; Sánchez-Salguero, R.; Gazol, A.; Navarro-Cerrillo, R.M.; Carreira, J.A. The Multiple Causes of Forest Decline in Spain: Drought, Historical Logging, Competition and Biotic Stressors. In Dendroecology: Tree-Ring Analyses Applied to Ecological Studies; Amoroso, M.M., Daniels, L.D., Baker, P.J., Camarero, J.J., Eds.; Ecological Studies; Springer International Publishing: Cham, Switzerland, 2017; pp. 307–323. [Google Scholar]
  66. Girona, M.M.; Rossi, S.; Lussier, J.M.; Walsh, D.; Morin, H. Understanding tree growth responses after partial cuttings: A new approach. PLoS ONE 2017, 12, e0172653. [Google Scholar]
Figure 1. (a) Distribution of Pinus pinaster Ait. and (b) sampled sites (red dots) distributed in four different locations in Andalusia (southern Spain). Climatic diagrams (c) and trends (d) in the mean temperature (lines) and precipitation (bars) of the study sites (see Table 1 for the site codes), for the period 1950–2017, based on 0.25° gridded monthly data from ENSEMBLES Observations gridded dataset (E-OBS) [32].
Forests 10 00603 g001
Figure 2. Basal area increments (± SD) of Pinus pinaster Ait. for natural forests and plantations (means are shown as continuous lines, SDs as dashed lines). Percentage BAI (basal area increment) growth reduction compared to the growth of the previous three years (grey bars).
Forests 10 00603 g002
Figure 3. Relationships among the log-transformed basal area increments before (a), during (b), and after (c) two important droughts (1995, 2005) for the study period. The regression and correlation coefficients, associated significance levels, and the regression lines are also represented. The distinct colors correspond to natural forest (black) and planted trees (grey).
Forests 10 00603 g003
Figure 4. Bootstrapped climate-growth relationships (Pearson correlation coefficients) for the study sites, comparing radial growth (ring-width indices) and monthly and seasonal climatic data (precipitation, mean temperature) for the natural and planted P. pinaster stands. Monthly and seasonal climatic variables from the previous and current year are abbreviated by lower and upper-case letters, respectively. Horizontal dashed lines are significant values (p < 0.05). The site codes are as in.
Forests 10 00603 g004
Figure 5. Site chronologies (tree-ring width indices, RWI; solid lines) for the studied stands and the May to July standard precipitation-evapotranspiration index (MJJ-SPEI) calculated at the 12-month scale (dotted lines) for the period 1960–2016. The Pearson correlations (r) between the RWI and SPEI12 for May, June, July (MJJ-SPEI), and the associated probability values (p) are shown for each site, for the pre-drought (1995) period (1975–1995; left) and the post-drought period (1995–2015; right).
Forests 10 00603 g005
Figure 6. Response of the resistance (Rt), recovery (Rc), and resilience (Rs) growth indices calculated for the natural forest (grey bars) and plantations (black bars) of Pinus pinaster, considering four sampled sites and two droughts (1994–1995, 2005).
Forests 10 00603 g006
Figure 7. Effects of SPEI12_6 on the BAI, based on a linear mixed-effects models fitted to basal area increment data for the period 2000–2017 according to defoliation level (1—no defoliation, 0%–5%; 2—moderate defoliation, 5%–20%; 3—severe defoliation, >20%). The relationships described by the fitted lines are significant (p < 0.05).
Forests 10 00603 g007
Table 1. Topographical and silvicultural characteristics of the Pinus pinaster forests sampled in Andalusia, ordered from north to south. Values are ranges (slope) or means ± SE. Abbreviations: F, forest (naturally regenerated stands); P, planted stands; Elev, Elevation (m.a.s.l.); Exp, Aspect, L, limestones; D, dolomites; P, peridotites; G, basal area; S, Reineke index.
Provenance ZoneStand TypeSite (Code)Lat (N)Long (W)ElevExpSlope (%)Soil TypeDBH (cm)Height (m)G (m2/ha)SDensity (Tree/ha)
Sierra de Cazorla, Segura y las Villas (CZ)PJA101038.413.421090SE10–35L34.0 ± 1.114.4 ± 0.616.5290160
FJA103338.442.59980SE0–10L/D31.0 ± 1.814.0 ± 0.839.7730500
FJA110738.112.901200S10–35LD41.1 ± 3.914.3 ± 0.723.3390140
Sierra Nevada, de Huetor y Baza (BZ)PGR115337.143.071500W35–65D19.1 ± 1.26.3 ± 0.232.47501150
FGR111437.233.451320S35–65L30.0 ± 1.510.2 ± 0.514.1285240
PGR111537.253.361350E10–35L24.1 ± 1.110.6 ± 0.347.8450930
Sierra Tejeda y Almijara (AL)FGR116836.913.751250NE10–35L38.7 ± 2.19.6 ± 0.412.5230125
PMA106836.874.02970SE35–65D30.9 ± 0.99.5 ± 0.416.5300210
PMA106936.883.931580S10–35D37.1 ± 3.613.0 ± 0.932.5576270
Sierra Bermeja (BJ)FMA110336.594.96400SW35–65P33.4 ± 1.78.2 ± 0.311.4250180
PMA109436.295.12260S>65P32.2 ± 3.28.8 ± 0.410.5195130
Table 2. Dendrochronological statistics of Pinus pinaster sites sampled in natural forests (F) or plantations (P) within Andalusia. Abbreviations: TRW, mean tree-ring width; BAI20, mean basal area increment in the last 20 years (mean ± SD); MS, mean sensitivity; Rbar, mean correlation between trees; site codes are shown in Table 1. Values are means ± SE. Different levels of significance are shown for the Student’s t-test between stand type: * 0.05 < p ≤ 0.10; ** 0.01 < p ≤ 0.05; *** p ≤ 0.01.
N Trees (Cores)Timespan (N Years)TRW ± SD (mm)BAI20AC1MSRbarEPS
Sierra de Cazorla, Segura y las Villas (CZ)CZF22 (44)1848–2013 (166)1.92 ± 0.128.74 ± 0.520.598 *0.283 ***0.3710.913
CZP12 (23)1970–2013 (44)2.40 ± 0.306.94 ± 0.610.621 *0.406 ***0.7950.988
Sierra Nevada, de Huetor y Baza (BZ)BZF12 (12)1973–2013 (41)2.36 ± 0.0.35 *6.43 ± 0.570.758 **0.3140.7870.986
BZP22 (42)1966–2013 (48)1.83 ± 0.19 *3.54 ± 0.360.676 **0.4450.5600.976
Sierra Tejeda y Almijara (AL)ALF14 (22)1910–2017 (108)1.45 ± 0.13 ***7.48 ± 0.62 *0.676 **0.295 ***0.3600.925
ALP36 (64)1974–2017 (44)3.10 ± 0.22 ***10.26 ± 0.72 *0.469 **0.383 ***0.8020.994
Sierra Bermeja (BJ)BJF12 (23)1960–2017 (58)2.54 ± 0.29 *8.62 ± 0.58 *0.590 **0.339 **0.7290.976
BJP18 (30)1936–2017 (82)1.71 ± 0.17 *5.45 ± 0.46 *0.606 **0.376 **0.5890.968

