Article

Phenotypic Correlations among Growth and Selected Wood Properties in White Spruce (Picea glauca (Moench) Voss)

1
Natural Resources Canada, Canadian Forest Service, Canadian Wood Fibre Centre, 5320-122 street NW, Edmonton, AB T6H-3S5, Canada
2
Institut de recherche sur les forêts, Université du Québec en Abitibi-Témiscamingue, 445 boul. de l’Université, Rouyn-Noranda, Québec, QC J9X-5E4, Canada
3
Natural Resources Canada, Canadian Forest Service, Canadian Wood Fibre Centre, 1055 du PEPS, P.O. Box 10380, Sainte Foy, Québec, QC G1V-4C7, Canada
4
Département des Sciences du Bois et de la Forêt, Université Laval, 2425 rue de la Terrasse, Québec, QC G1V-0A6, Canada
5
National Research Council Canada, 1200 Montreal road, Ottawa, ON K1A-0R6, Canada
6
Ministère des Forêts, de la Faune et des Parcs du Québec, Direction de la modernisation de l’industrie des produits forestiers, 5700, 4e Avenue Ouest, bureau A-202, Québec, QC G1H-6R1, Canada
*
Author to whom correspondence should be addressed.
This manuscript is part of a Ph.D. thesis by the first author, available online at depositum.uqat.ca.
Researcher emeritus.
Forests 2019, 10(7), 589; https://doi.org/10.3390/f10070589
Submission received: 1 June 2019 / Revised: 10 July 2019 / Accepted: 15 July 2019 / Published: 16 July 2019
(This article belongs to the Special Issue Tree Crown Dynamics and Morphology)

Abstract

:
We examined phenotypic relationships among radial growth-related, physical (i.e., related to wood density), and anatomical (i.e., related to tracheid dimensions) wood properties in white spruce (Picea glauca (Moench) Voss), in order to determine the strength and significance of their correlations. Additionally, principal component analysis (PCA) was used to establish if all of the properties must be measured and to determine the key properties that can be used as proxies for the other variables. Radial growth-related and physical properties were measured with an X-ray densitometer, while anatomical properties were measured with a Fiber Quality Analyzer. Fifteen wood properties (tracheid length (TL) and diameter (TD), earlywood tracheid length (ETL) and diameter (ETD), latewood tracheid length (LTL) and diameter (LTD), ring width (RW), ring area (RA), earlywood width (EWW), latewood width (LWW), latewood proportion (LWP), ring density (RD), intra-ring density variation, earlywood density (EWD), and latewood density (LWD)) were assessed. Relationships were evaluated at intra-ring and inter-ring levels in the juvenile wood (JW) and mature wood (MW) zones. Except for a few cases when mature tracheid diameter (TD) was involved, all intra-ring anatomical properties were highly and significantly correlated. Radial growth properties were correlated, with stronger relationships in MW compared to JW. Physical properties were often positively and significantly correlated in both JW and MW. A higher earlywood density coupled with a lower latewood density favored wood uniformity, i.e., the homogeneity of ring density within a growth ring. Managing plantations to suppress trees growth during JW formation, and enhancing radial growth when MW formation starts will favor overall wood quality. In order, RW-EWW-RA, TL-ETL-LTL, and RD-EWD-LWP are the three clusters that appeared in the three wood zones, the whole pith-to-bark radial section, the juvenile wood zone, and the mature wood zone.

1. Introduction

White spruce (Picea glauca (Moench) Voss) is widely distributed across North America. Its territory extends from Newfoundland, Labrador, and northern Quebec in the east to west across Canada along the northern tree limit to northwestern Alaska and south to southwestern Alaska, southern British Columbia, southern Alberta, northwestern and southeastern Manitoba, central Minnesota, central Michigan, southern Ontario, northern New York, and Maine [1]. White spruce wood is valuable for both lumber and pulpwood, and is therefore of vital economic importance. In eastern Canada, substantial artificial regeneration programs as well as tree improvement research and breeding programs have targeted this species. The positive effects of these management programs on tree growth and stem quality are documented [2,3,4,5].
Wood quality must normally have a sense only with respect to its final end-use [6]. However, one must keep in mind that overall wood quality depends on all its properties, and selection for one character may cause a change to the population mean of other correlated properties [7,8,9]. For example, maturation of tracheid length (TL), ring density (RD), and microfibril angle have been found to contribute equally to the improvement of wood mechanical properties with age and to explain more than 80% of this improvement [10]. Furthermore, the growth rate is known to alter correlations among properties [11,12]. However, end-use properties are often neglected in tree breeding and management programs [13,14,15]. Only a few studies have investigated correlations among the growth rate and wood quality of white spruce, and only for a small number of wood properties (all acronyms used in this text are listed in Table 1) at the ring level [9,15,16,17]. These studies pointed out the need for more carefully planned management if the improvement of many end-use properties was envisioned [9,16]. Therefore, correlations among the radial growth rate and physical (i.e., related to wood density) and anatomical (i.e., related to tracheid dimensions) properties of white spruce remain to be clarified.
RD is probably the most studied wood property [18]. It is considered as the key property affecting both the stiffness and strength of structural timber [19], and is therefore used to predict wood stiffness [20]. It guides raw material selection in veneers and appearance products manufacturing [19,21], since it determines wood machinability and surface hardness. RD is considered as a key indicator of pulp yield and the quality of paper products [6,22], and also an important variable in determining the biomass calorific value and carbon sequestration [23,24]. Investigations must now extend to neglected but relevant wood properties, such as the ring area (RA), TL, tracheid diameter (TD), and wood uniformity (intra-ring density variation). RA tells us about tree growth in both the radial and tangential directions [25]. TL is one of the most important wood properties for paper products because it has a significant impact on the quality of the pulp and paper and fiber-based products, such as wood–plastic composites and fiberboards. In addition, the TL radial pattern of variation clearly defines the juvenile wood (JW) and mature wood (MW) zones [26]. TD is an important property in pulp industries [27] and its radial and longitudinal variations explain a tree’s adaptation strategy to overcome hydraulic resistance [28,29]. Because measuring anatomical properties is time consuming and expensive [30], TL and, even more, TD have not been addressed enough [31]. Intra-ring density variation is an indication of the variation of wood density inside a growth ring. A greater uniformity is valuable for veneer production [21].
Wood properties of spruces change in a single ring from earlywood to latewood when considering growth, density [15,32], and anatomical [15,29,33] properties. The earlywood zone is produced under the strong influence of growth hormones, especially indole-3-acetic-acid (auxin) in the beginning of the growth season, when newly formed buds are actively elongating, and it proceeds basipetally towards the tree [18,34,35]. Latewood production coincides with the cessation of shoot elongation, proceeds acropetally, and has thicker cell walls, as a result of greater photosynthates availability [18,35,36]. Significant variations in wood properties are observed in spruces when one moves in the radial direction from JW to MW for growth [15,16], physical [15,37], and anatomical [15,16,26] properties. This pattern is due to many interrelated factors. The most important ones are the distance of the tracheid to the active living crown [18,38], the age of the cambial initial during xylogenesis [39], and the growth rate [34]. Variation from earlywood to latewood [18] and from JW to MW [16,40] have led to the statement that these woods have to be considered as different populations [12]. Earlywood and latewood properties have been used to predict whole-ring values of wood properties. RD has been predicted from the earlywood density (EWD) and latewood proportion (LWP) [37,41,42]. It has been found [41] that the earlywood width (EWW) is more correlated with RW than latewood width (LWW). Similarly, juvenile wood TL was used to predict whole section TL at breast height [29].
Understanding the phenotypic correlations among wood properties and especially clarifying those of poorly studied ones, such as RA, TL, TD, and intra-ring density variation with RD, may be very instructive. Indeed, despite its great relevance in wood industries, predicting RD remains a very difficult task. Therefore, more thorough analyses are needed using many physical, growth-related, and anatomical properties, and subdividing the tree-ring between earlywood and latewood zones, and the tree radial profile between juvenile wood and mature wood period. A high correlation between RD and other wood properties may shed light on the drivers of their variations, and help build more efficient predictive models. When increasing RW, a negative influence can be registered on TL for Sitka spruce (Picea sitchensis) [43] and Norway spruce (Picea abies (L.) Karst) [44,45]. RD is also negatively influenced by increasing RW in white spruce (Picea glauca (Moench) Voss) [16,17], black spruce (Picea mariana (Mill.) B.S.P.) [37], and Norway spruce [12]. However, other researchers rather found positive relationships between increased RW and RD in balsam fir (Abies balsamea Mill) [41] and jack pine (Pinus banksiana Lamb.) [3]. A positive relationship between RW and TL was also documented for Sitka spruce [43] and white spruce [16]. TD did not vary with the growth rate in radiata pine (Pinus radiata D. Don) [46], while Brändström [33] reported an increase in TD with RW in Norway spruce. TL does not appear to be significantly influenced by social status in Norway spruce [47]. Although an increased RW could be associated with reduced RD and TL, the variation of RD [18,44,48,49,50] and TL [45,51] with the growth rate is limited and without practical implications. These have led to the conclusion that stand productivity may be improved without sensible loss of wood quality [44,48,52]. Given the cost and tedious work associated with measuring several wood properties, one may also be interested in evaluating how close two given properties are. This could thus establish if all of the properties must be measured, or there are key properties that can be used as proxies for the other variables.
In order to improve our understanding of how wood properties are correlated at the intra-ring and inter-ring levels, and whether these correlations may be used for prediction models, this study addressed the following objectives: (1) Establish phenotypic correlations between earlywood and latewood among the selected wood properties, (2) establish phenotypic correlations between juvenile wood and mature wood among the selected wood properties, (3) group wood properties and select key properties that can be used as proxies for the other variables in the group, and (4) describe radial variations of selected wood properties in white spruce.

2. Materials and Methods

2.1. Stand Description

Material comes from 32 trees in a plantation established in 1936 in the Petawawa Research Forest, Ontario, Canada (lat. 45.59° N, long. 77.25° W, elev. 168 m). Initial stocking was 3068 trees/ha (1.8 m × 1.8 m spacing). The plantation had three thinning treatments and a control. Heavy, medium, and light thinning intensities were applied for target basal area (BA) of 18, 25, and 32 m2/ha, respectively. For each of the target BA, thinning operations were conducted threefold, in 1962, 1972, and 1982. The target BA remained the same during all thinning operations. In 2002, BA in the control plot was 44 m2/ha. Eight trees (two dominants, four codominants, and two suppressed) were randomly selected from each of the three thinning intensities and from the control plot, for a total of 32 trees. Trees were felled in July 2008 and pruned once on the ground. Discs at 1.3 m (breast height, BH) were collected for all sampled trees. Mean tree height (± SD) of the sampled trees was 21.1 ± 3.1 m, and mean diameter below bark at BH (± SD), measured with an electronic digital caliper, was 26.8 ± 6.4 cm.

2.2. Sample Collection, Preparation, and Wood Quality Attribute Assessments

Two 1.86 mm (tangential) adjacent strips centered on the pith were sawn bark to bark from each disc. One single radius per strip was carefully selected for the analyses. Direction was random. Compression wood and knots were avoided. The first strip per disc was used for measurement of radial growth-related and physical properties. These properties were measured at a 25 µm linear resolution step size with an X-ray densitometer (Quintek Measurements Systems QMS model QTRS-01X, Knoxville, TN, USA). The boundary between earlywood and latewood was delineated using the intra-ring wood density profile and the maximum derivative method [21]. RA was computed from RW assuming a circular shape. Intra-ring density variation, which is a measure of wood density homogeneity in a ring, was computed as the difference between the maximum and minimum densities of the ring. Wood sticks from earlywood and latewood were taken at 3, 6, 9, 12, 15, 20, 25, 30, 35, 40, and 45 growths rings (or cambial age) from the second wood strip. It is important to note that samples were collected at a fixed growth ring and not at determined calendar years. Indeed, the sampling strategy is a relevant issue when describing anatomical properties [29]. Wood sticks were macerated using a Franklin [53] solution consisting of (1:1 v/v) hydrogen peroxide diluted to 30% and concentrated glacial acetic acid. Each stick was placed in a test tube. The test tube was immersed in the Franklin solution and kept in hot distilled water (85–90 °C) for 5 to 6 hours until complete lignin dissolution. Delignified wood sticks were gently shaken in water with a laboratory blender to obtain a tracheid suspension. Earlywood and latewood TL were measured with a Fiber Quality Analyzer, LDA02 FQA (Op Test Equipment Inc. Hawkesbury, Ontario, Canada). A total of 4000 tracheids were measured in every sample. The TL in each zone was measured as the weight weighted length, LWW = ΣniLi3niLi2 (where i = 1, 2, 3 …N categories; n = fiber count in the (ith) category; L = contour length). Using this method, measurements were similar to true TL measurements and controlled for the bias caused by the large number of fines generated during the preparation process [30,47]. Average ring TL and TD were computed by weighting TL and TD of each wood zone with the relative RW.

2.3. Multivariate Analysis

All statistical analyses were performed using the R statistical software [54]. Correlations were computed for JW and MW separately, assuming that the transition age occurred at 15 years, as found in a previous study that used TL from this material [26]. This transition age was similar to RD [17,55], and the RA [25] transition age in spruce. We preferred Pearson’s correlations compared to other techniques since we wanted to establish a 1 by 1 relationship between two given wood properties at a given wood zone. These correlations could help in choosing explanatory variables for prediction models. Correlations were computed for all sampled trees, without distinguishing among thinning intensities. The rationale was that we wanted to establish general correlations among properties for different stands, which can largely differ in terms of growth rate, as the material of this study.
Standard errors of the Pearson’s correlations coefficients were computed from Equation (1).
s e = ( ( 1 r 2 ) / ( n 2 ) ) ,
where r = correlation estimate, n = number of observations, and n − 2 = degree of freedom.
Estimated variations induced by both thinning and social class on many wood properties (including those considered in this study) are being studied in a separate project. Principal component analysis (PCA) was performed on standardized datasets using the FactoMineR package [56]. PCA was used to observe any clustering in the 15 wood properties considered in this study and was carried out separately on the whole pith-to-bark, the juvenile wood, and the mature wood dataset.

3. Results

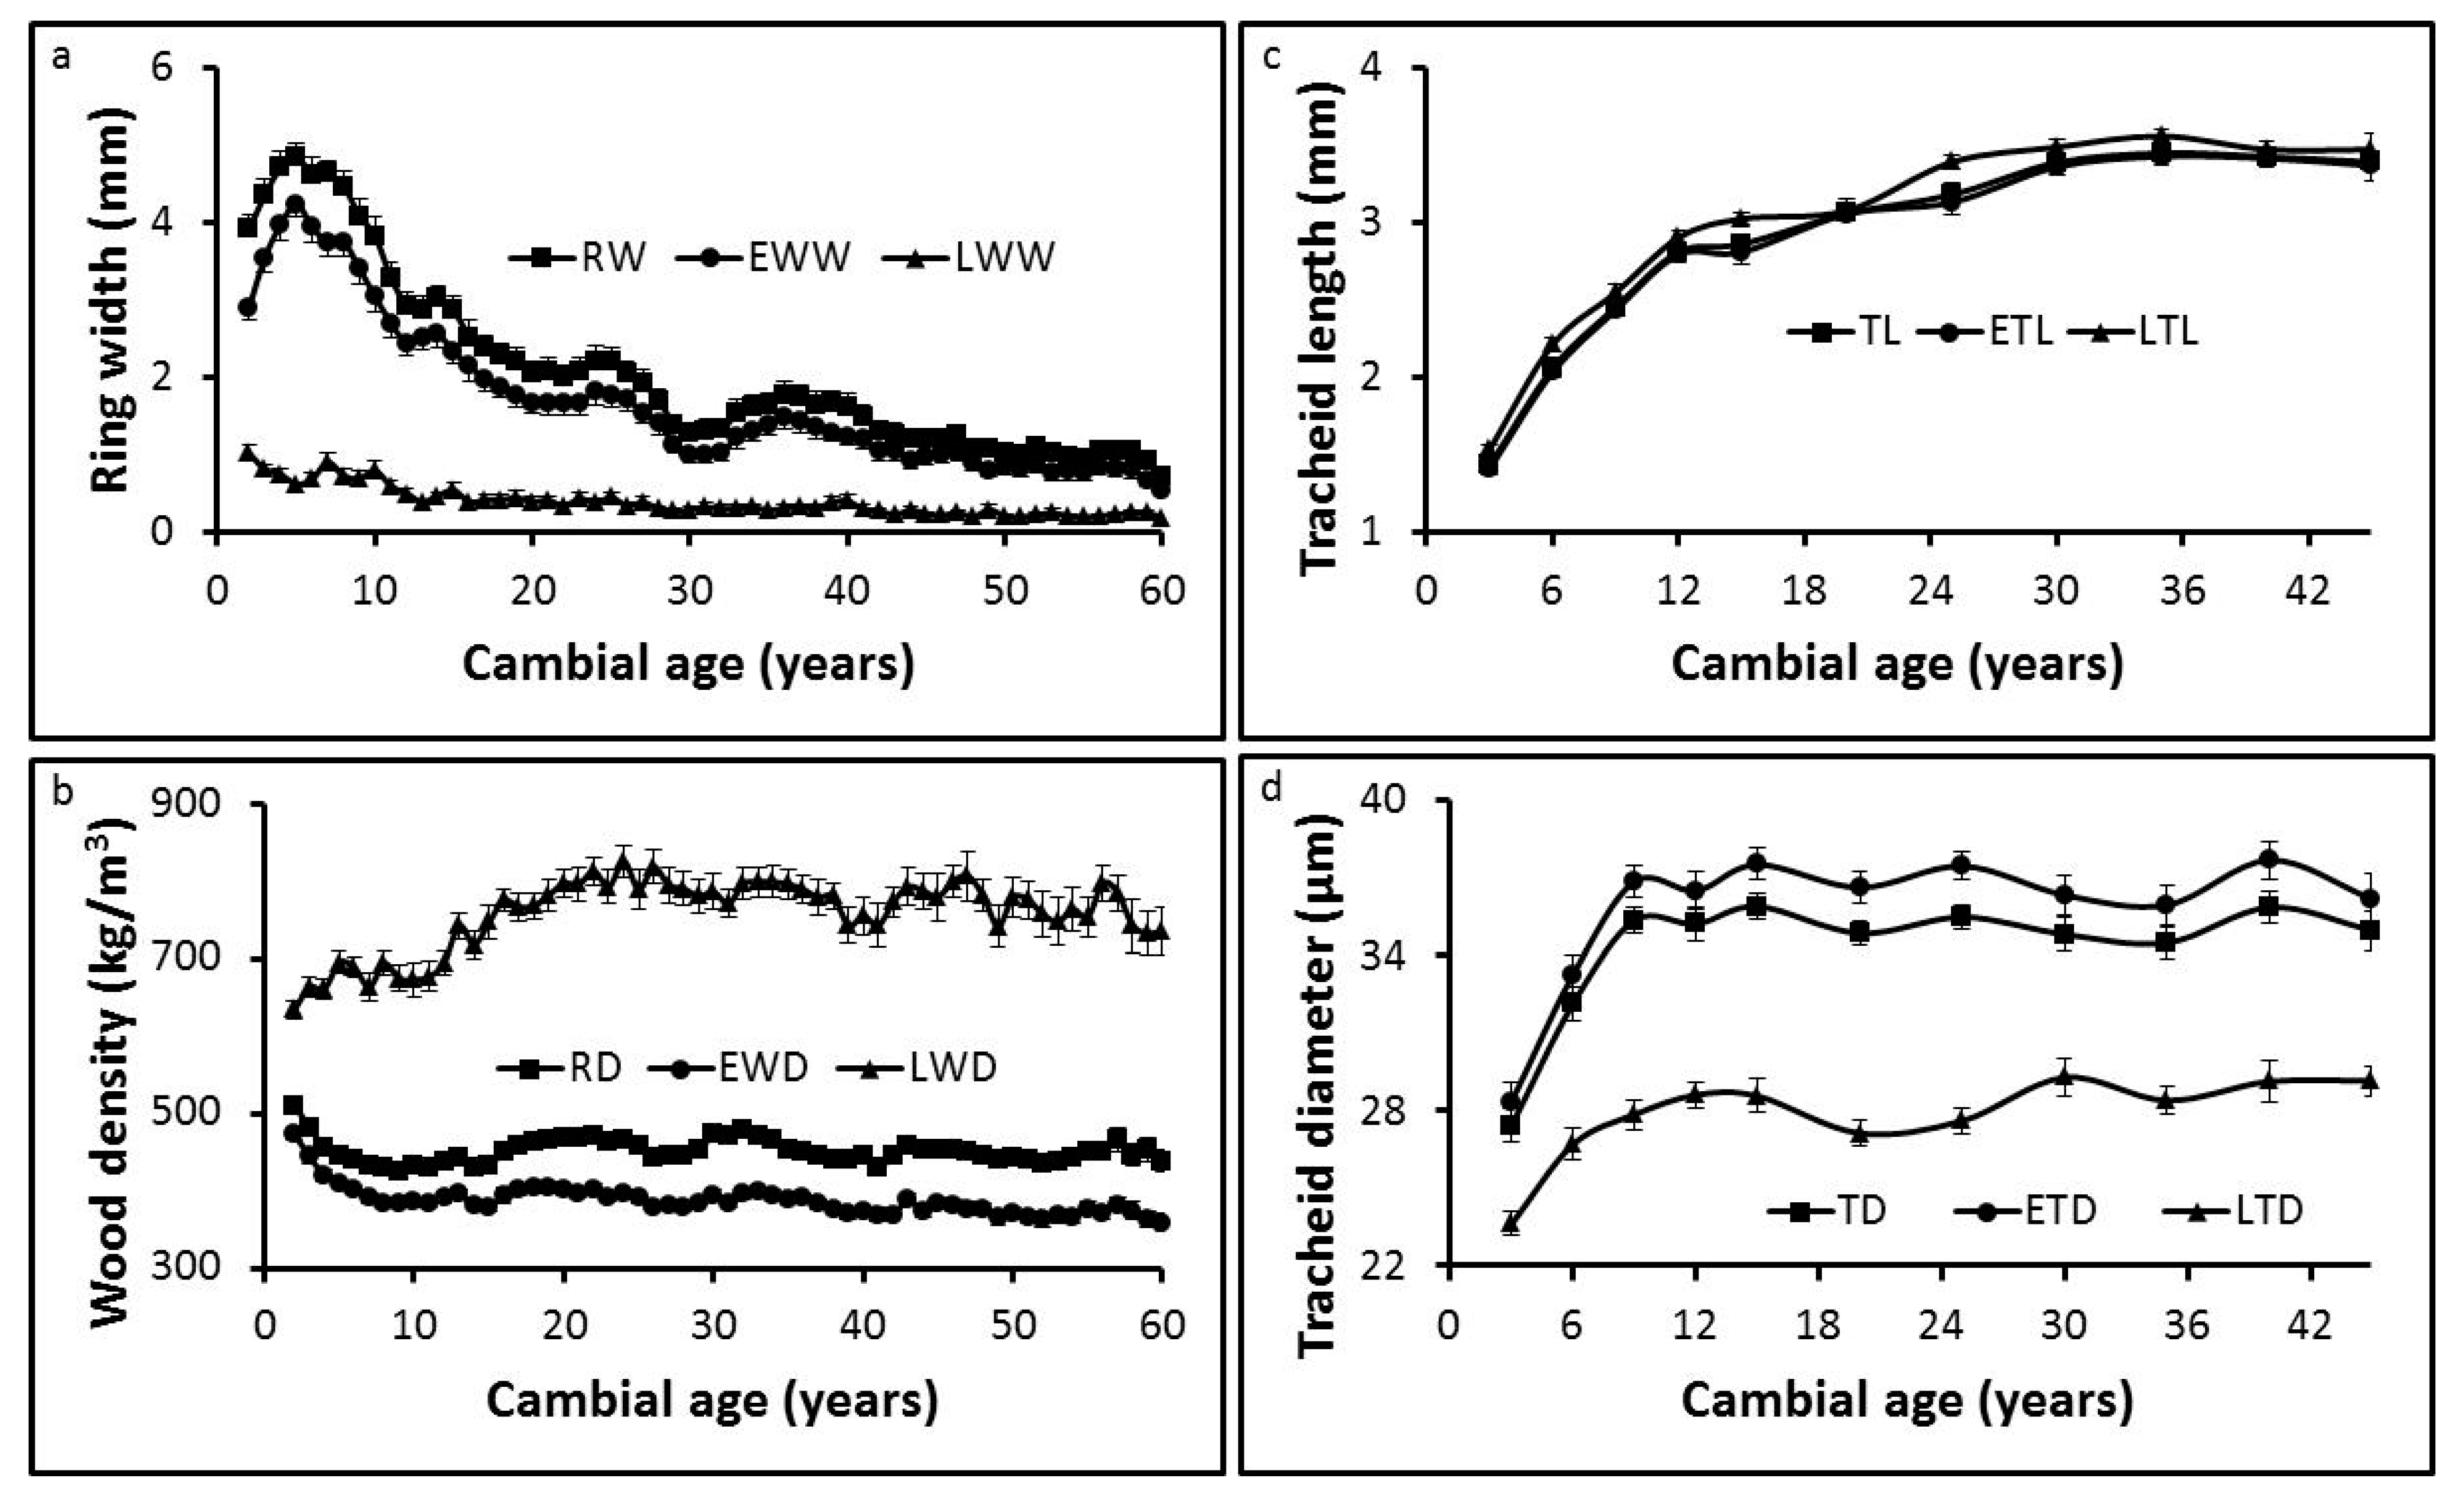
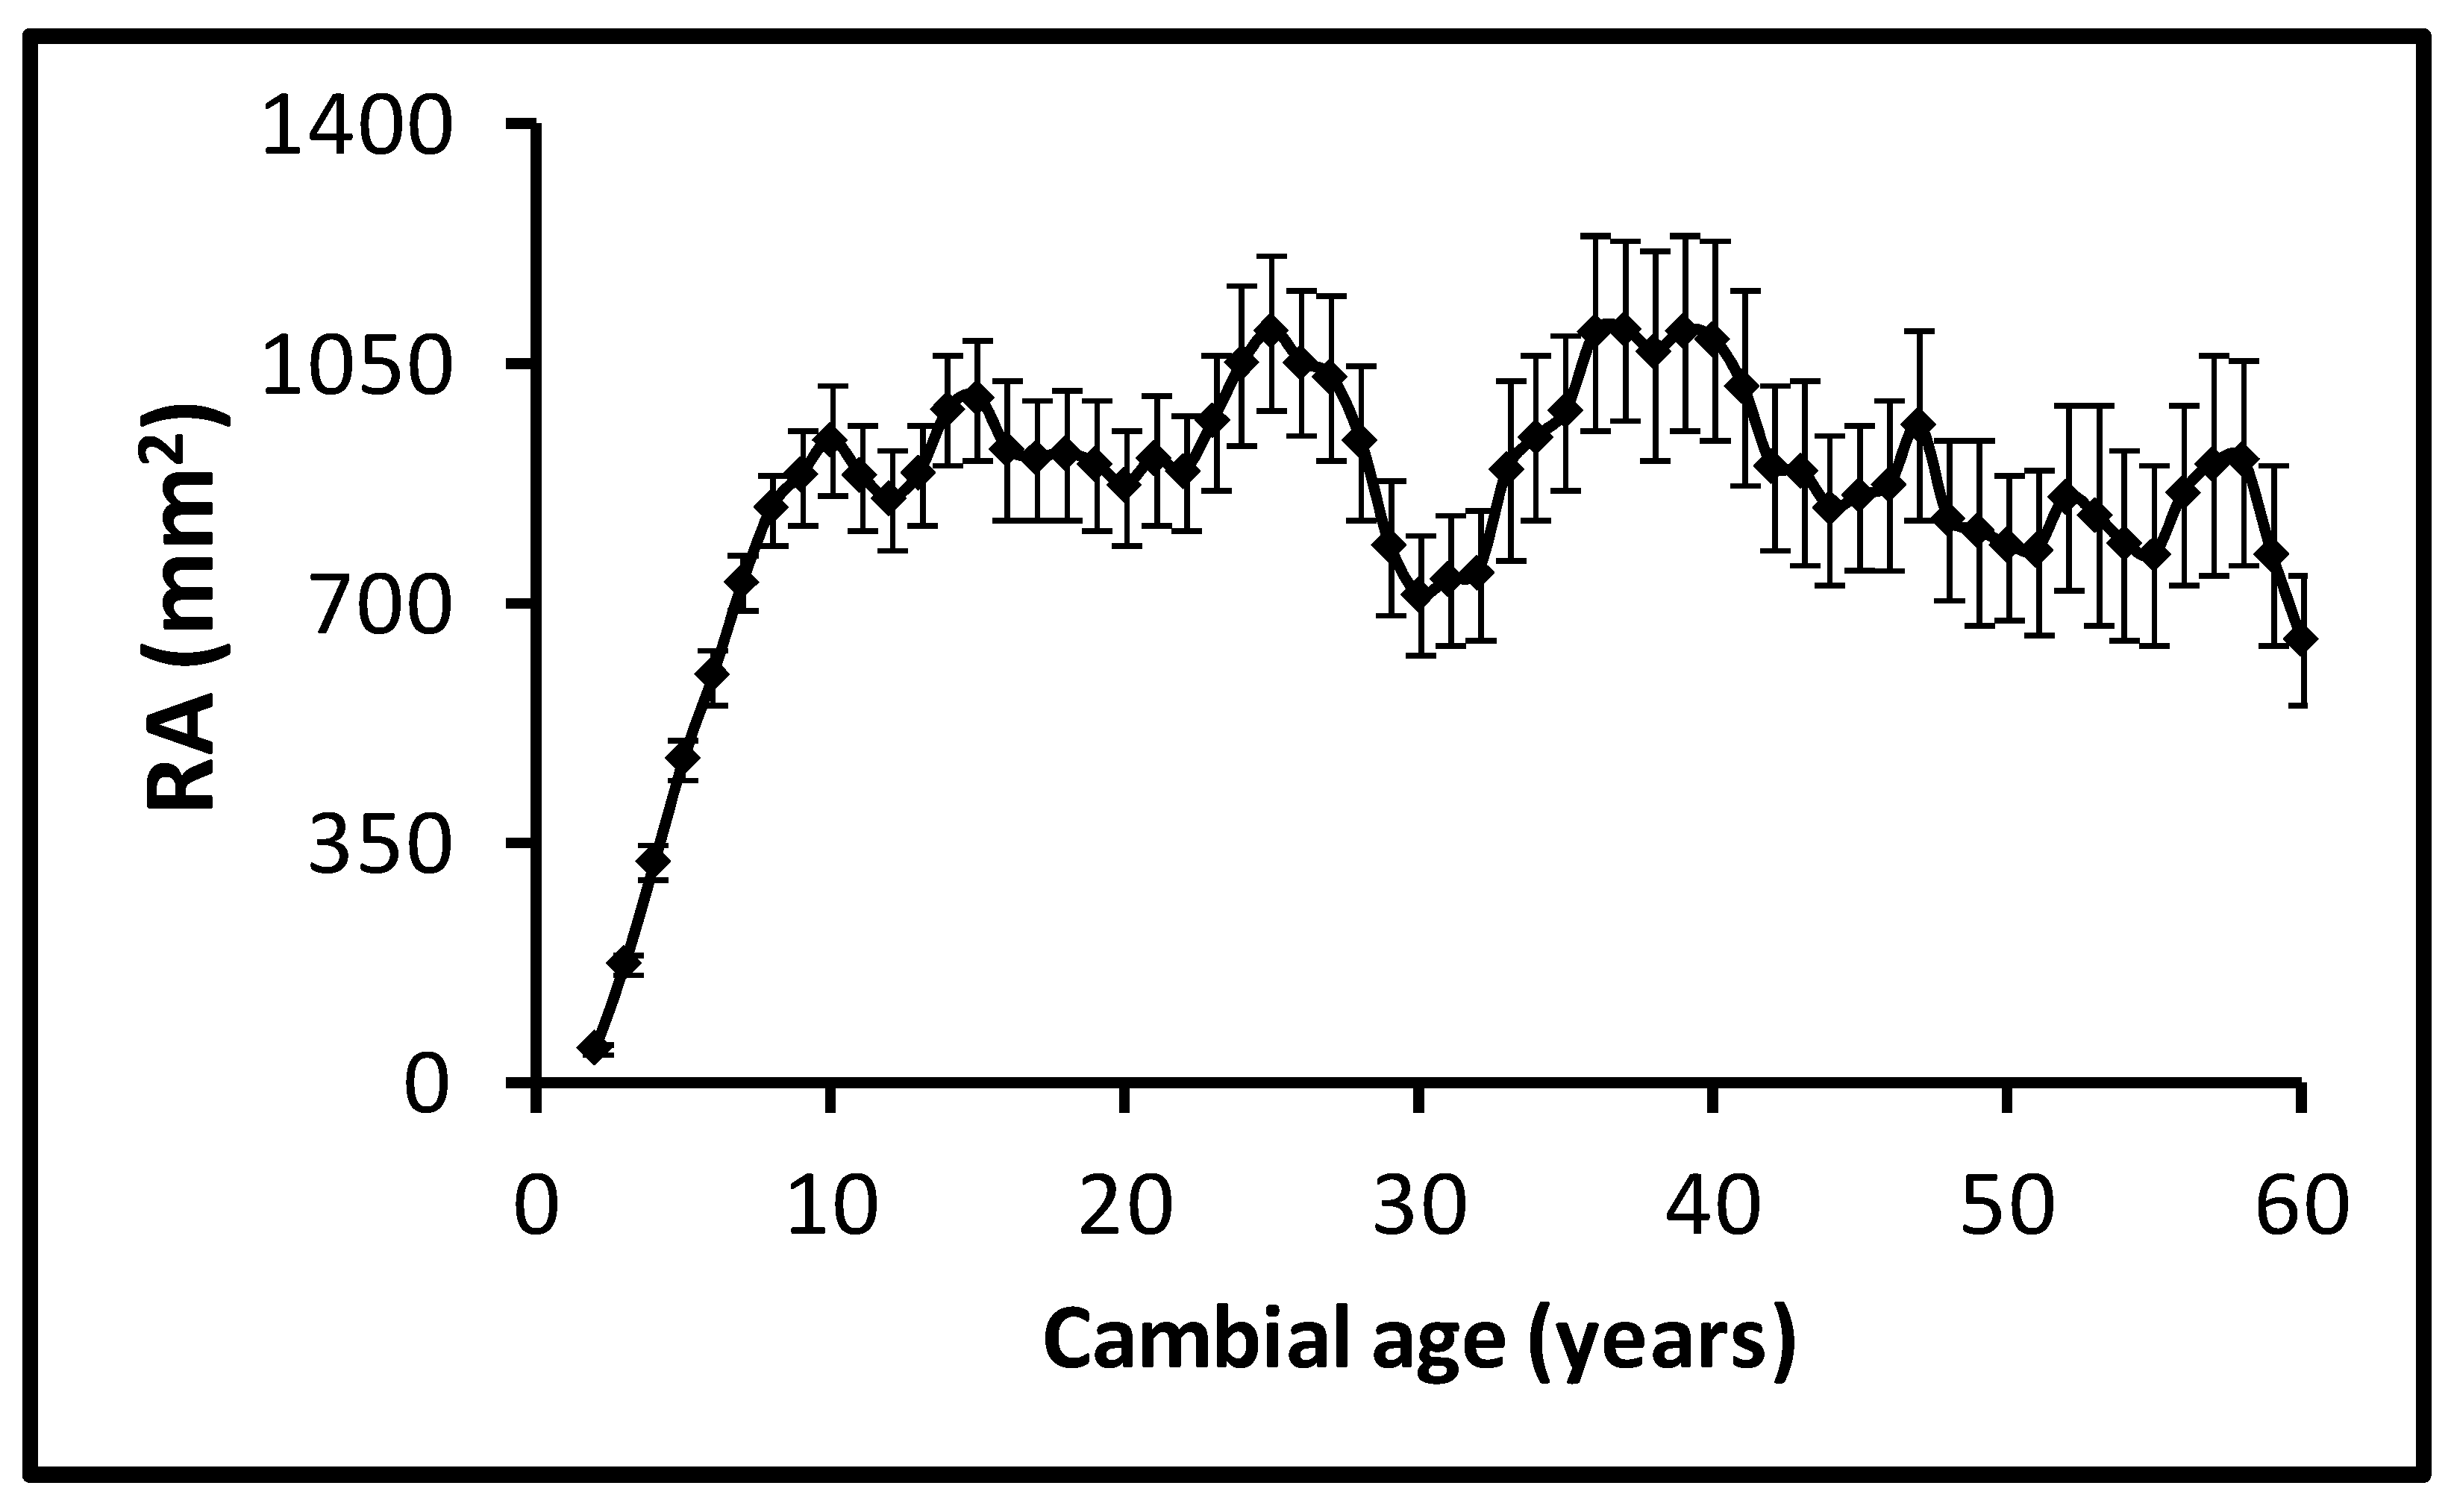
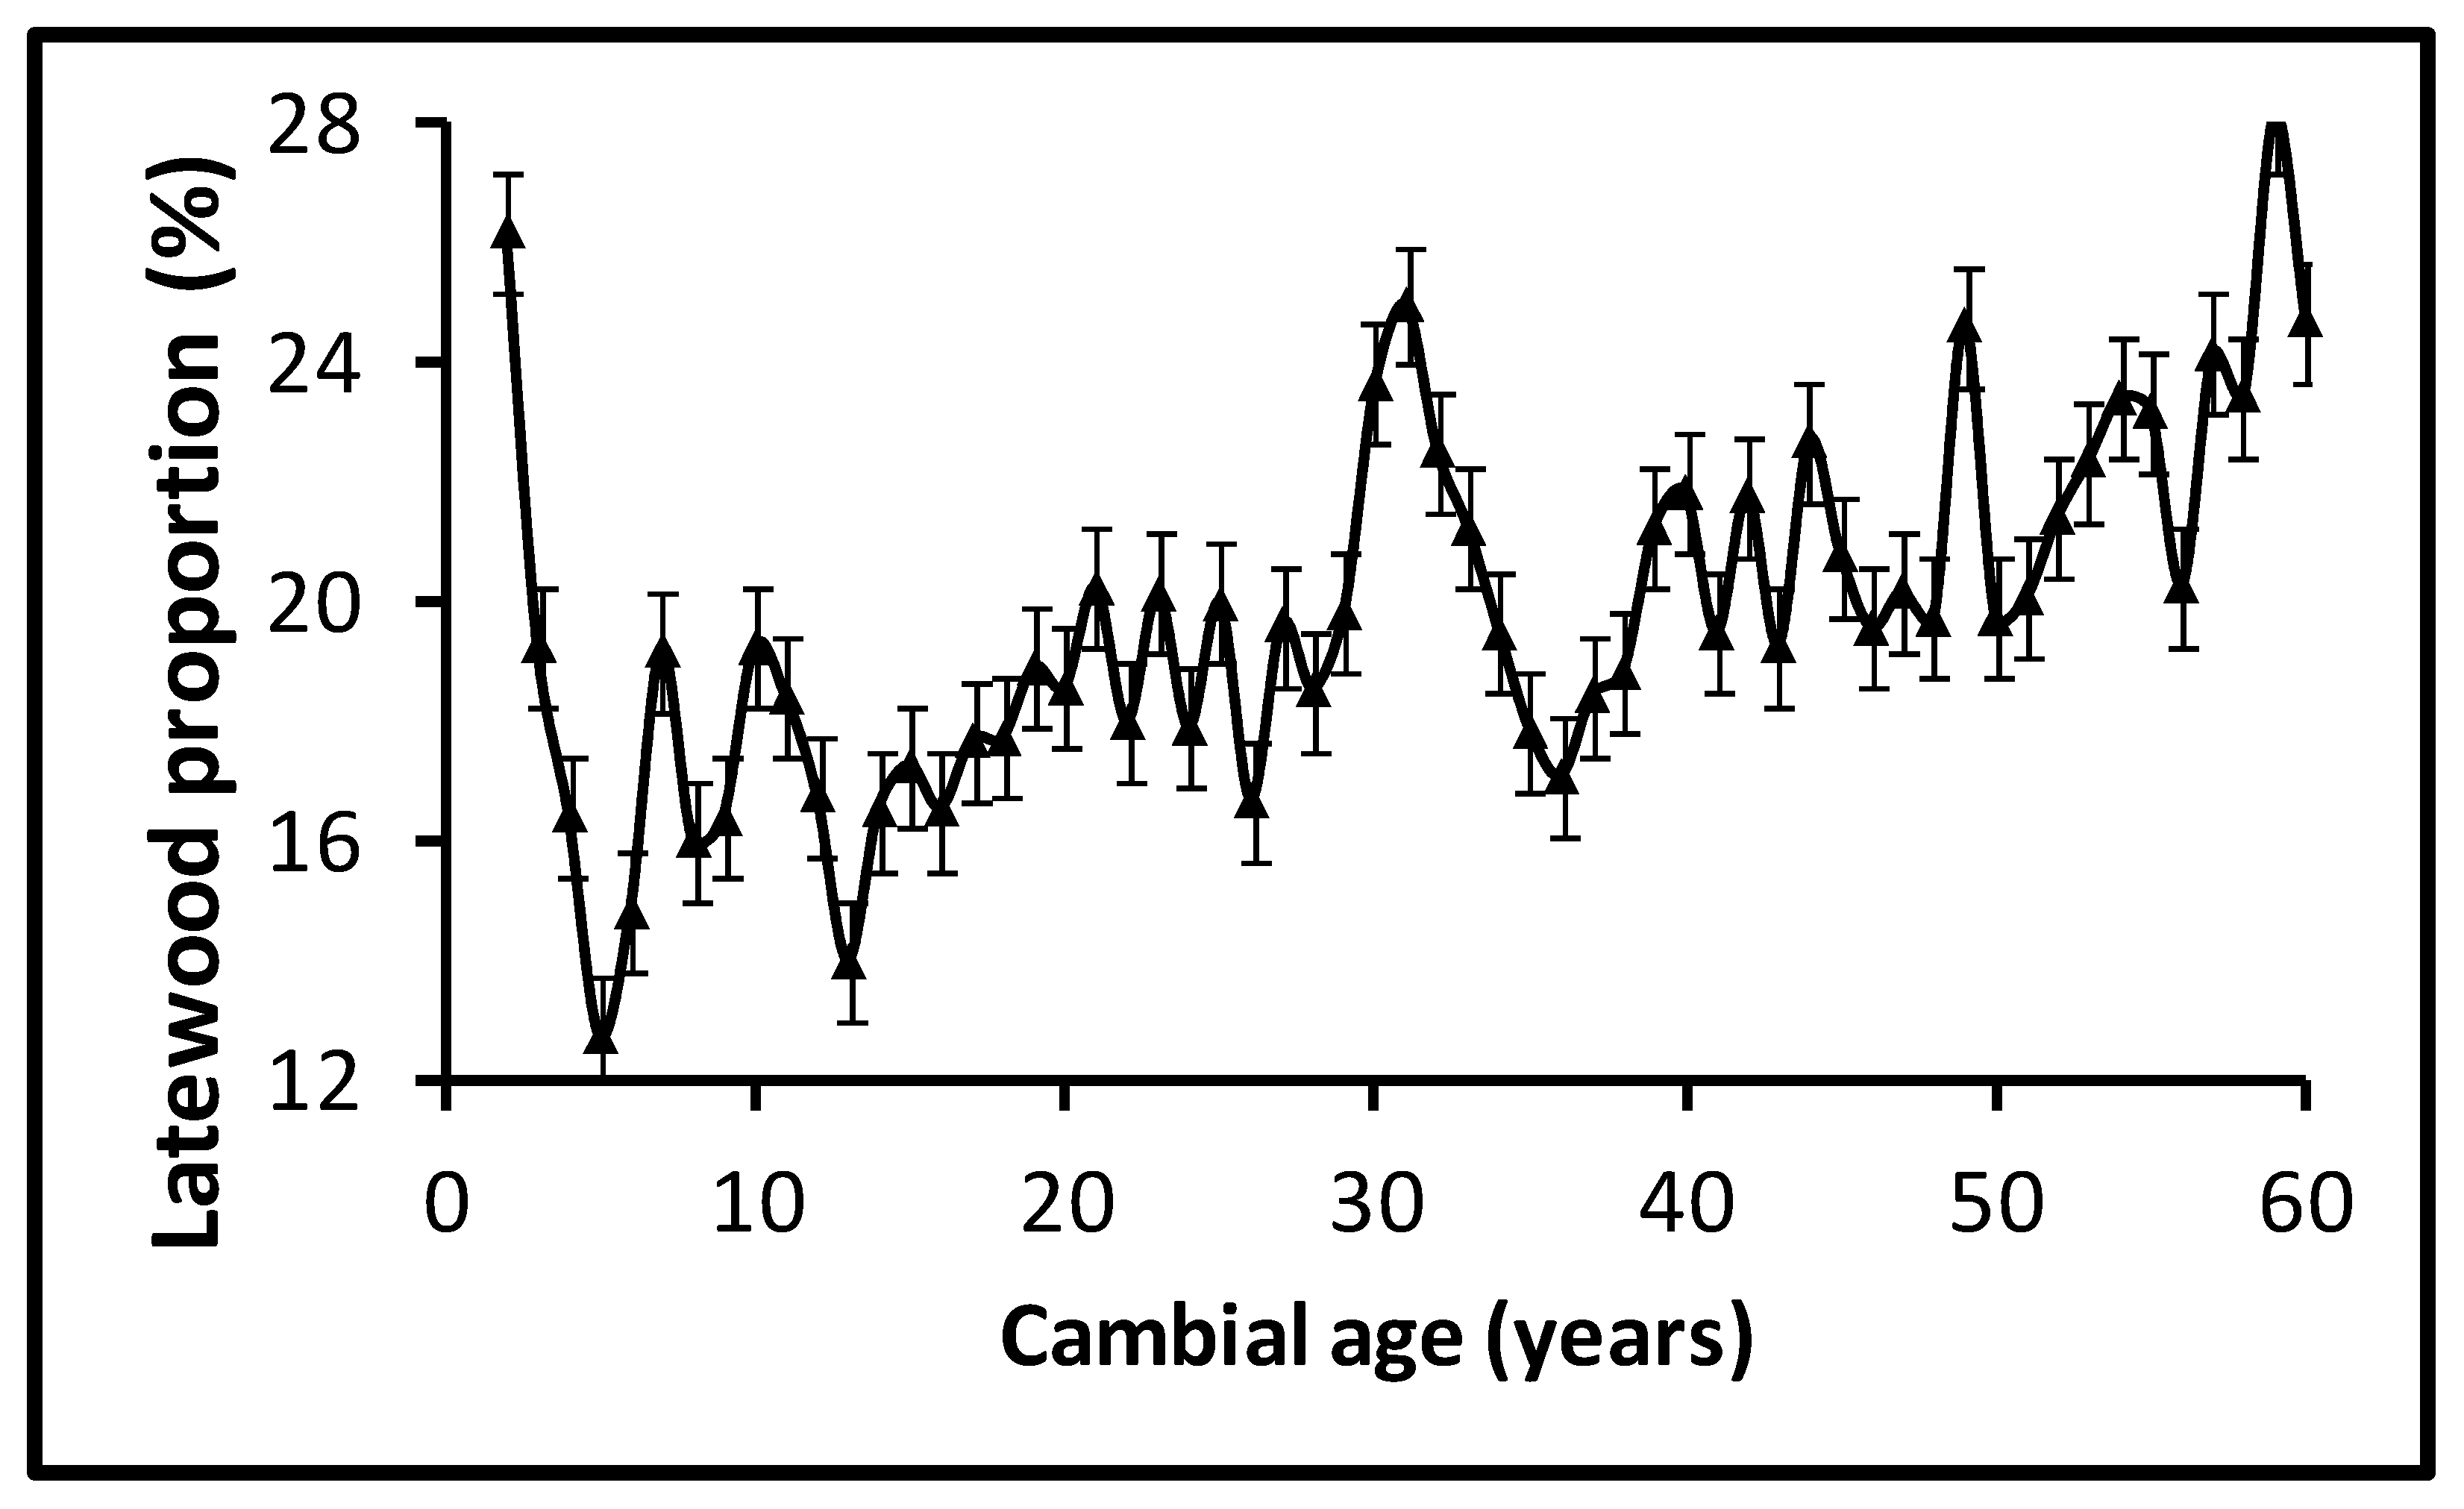
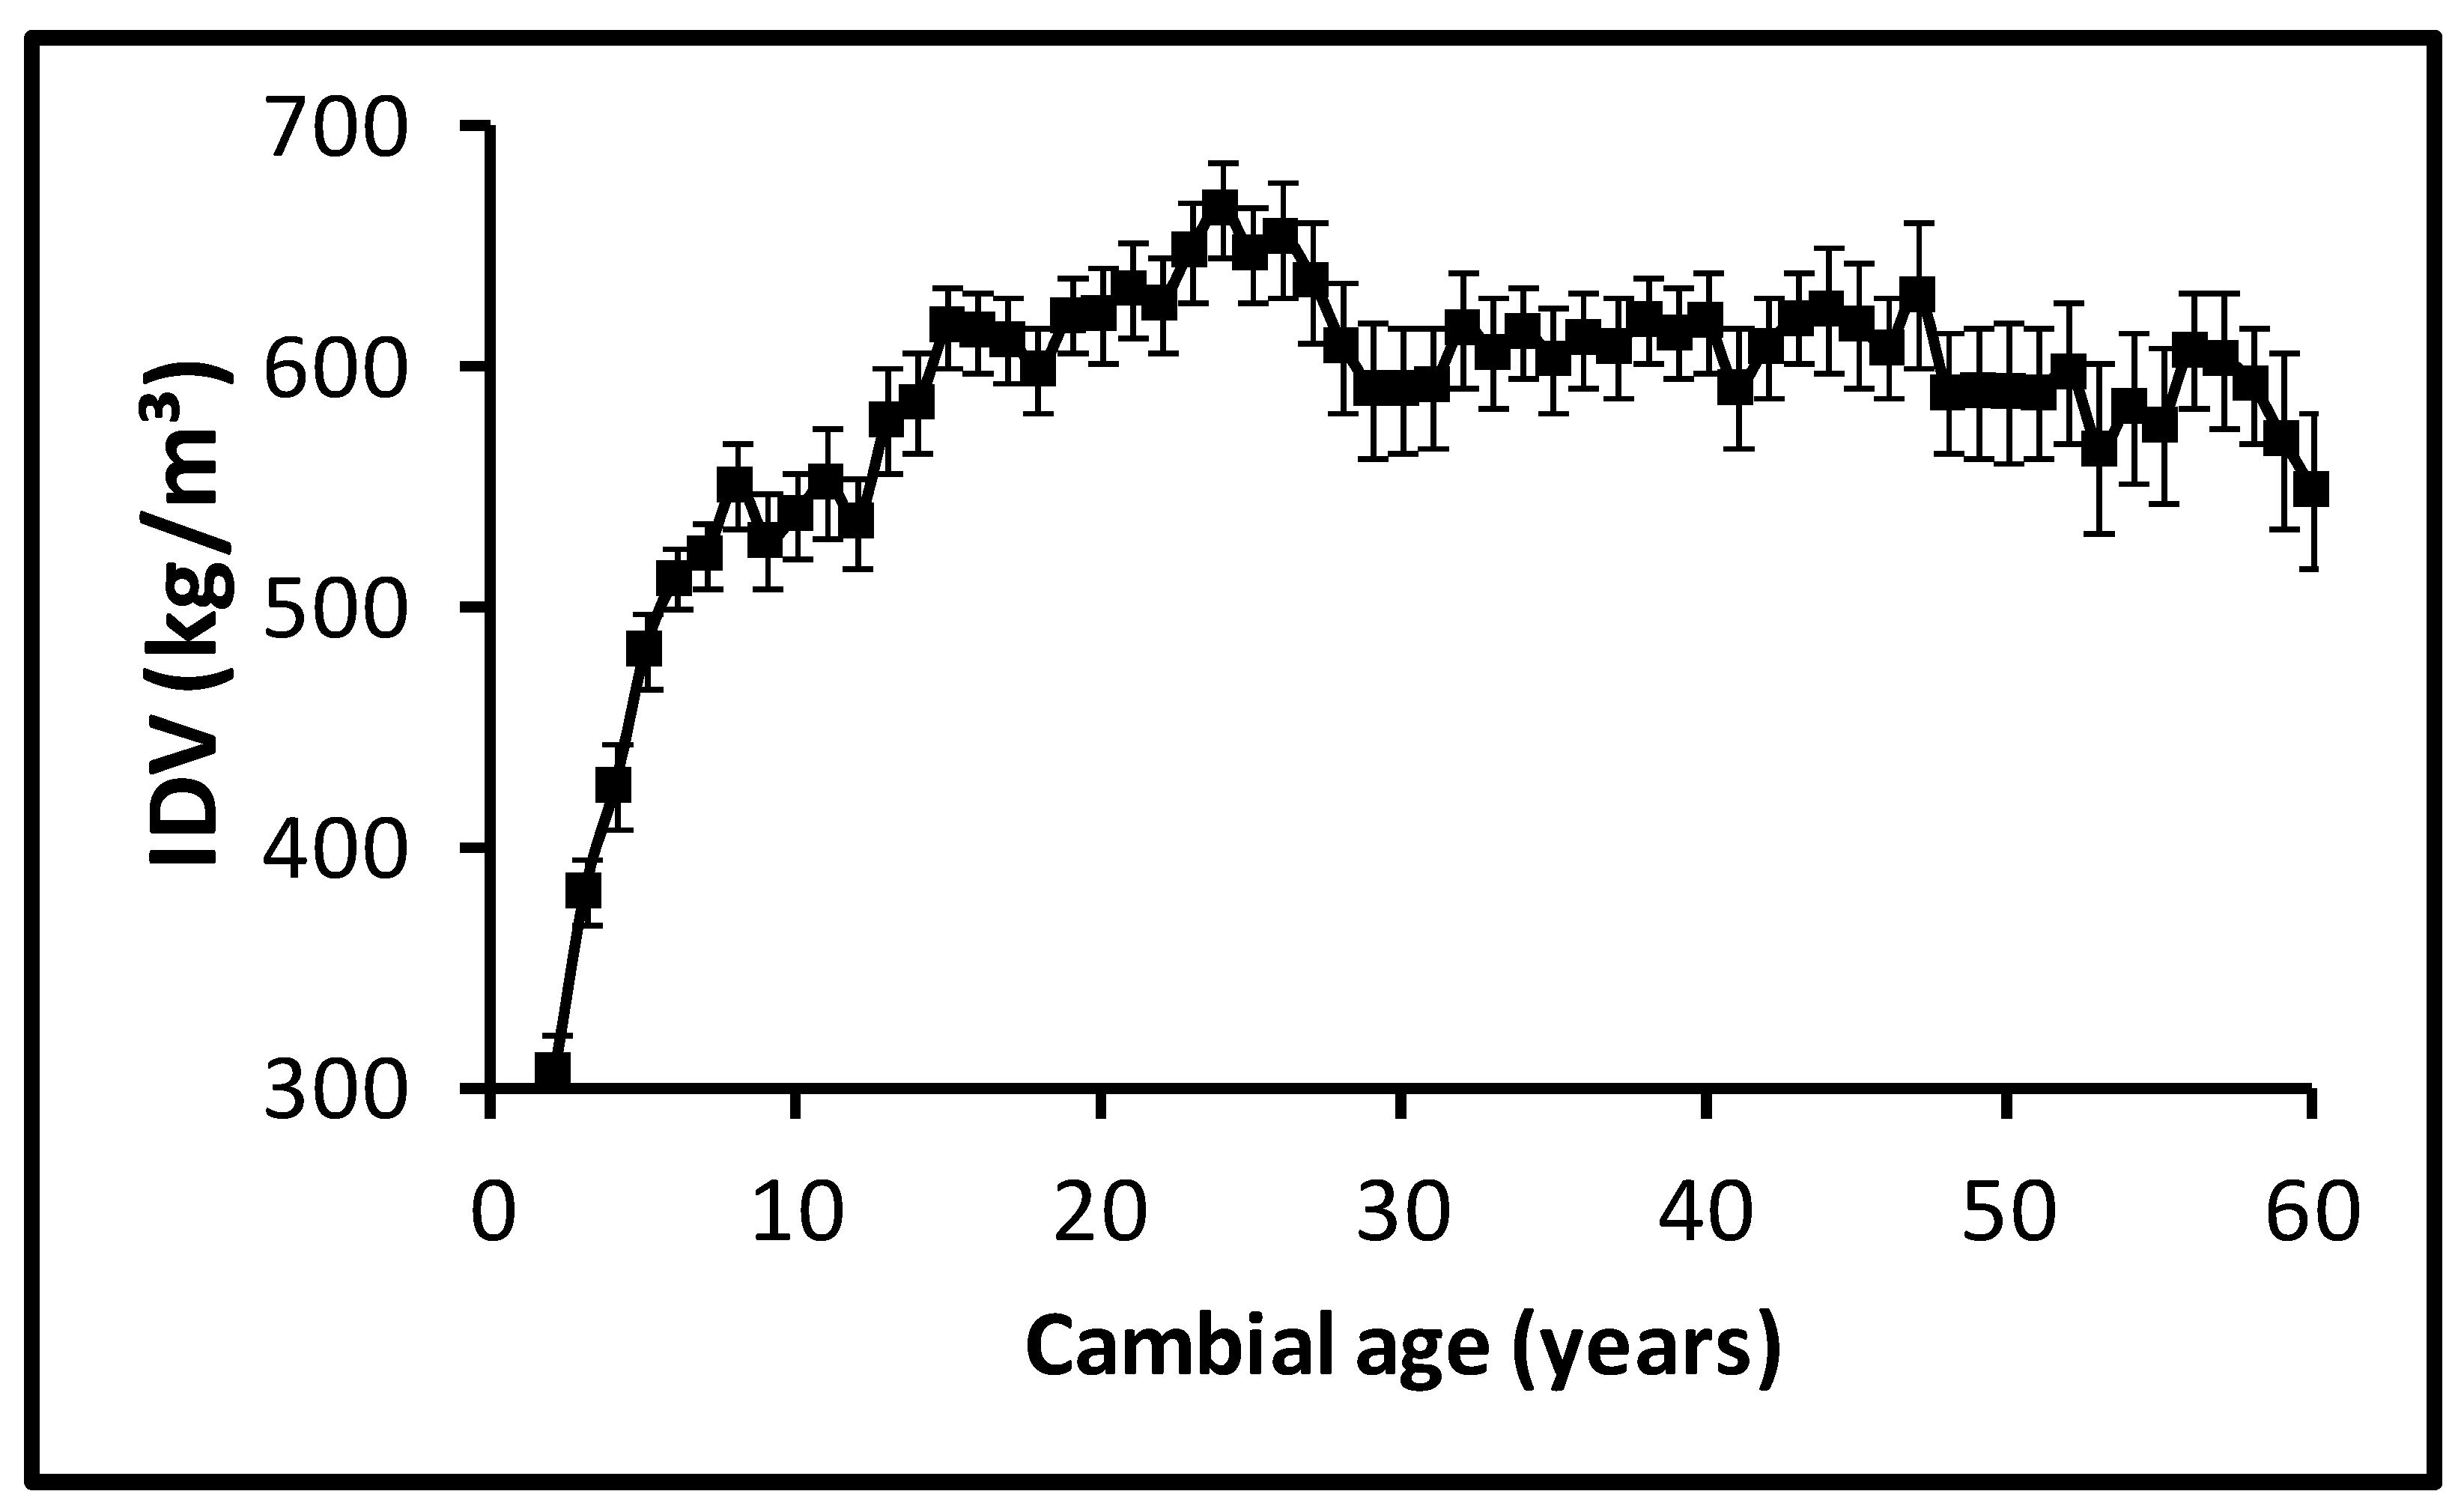
3.1. Intra-Ring and Inter-Ring Variations of Selected Wood Properties

Values of all radial growth-related properties investigated in the JW, defined as the first 15 growth rings, were higher than the values in the MW (Table 2). The large RA of the MW zone compared to the JW zone was the reverse of the pattern observed with RW (Table 2).
Variation of the radial growth-related properties is shown in Figure 1a. RW and EWW increase sharply during the first five growth ring (Figure 1a), while LWW presented a reverse pattern. All radial growth-related properties decreased steadily from the 5th to the 30th growth ring (around 2.5 mm for RW, 2.9 mm for EWW, and 0.4 mm for LWW), and showed a leveling tendency toward the bark (Figure 1a), but the decrease was sharper for EWW compared to LWW. LWP initially decreased during the first five growths rings, before continually increasing toward the bark, with yearly fluctuations (Figure 2). There was an acute increase of RA during the first 10 growth rings, where it was around 940 mm2, followed by a somewhat leveling off, with yearly fluctuations (Figure 3).
EWD is higher in the JW compared to the MW, while the reverse is true for RD, LWD, and intra-ring density variation (Table 2). Intra-ring density variation showed a rapid increase from pith to the 25th growth ring, where it was around 647 kg/m3, and gently decreased thereafter (Figure 4). RD and EWD show similar patterns, decreasing slowly from a maximum near the pith to a minimum (around 433 kg/m3 for RD and 380 kg/m3 for EWD) around the 15th growth ring, and EWD decreased gently toward the bark while RD remained relatively constant (Figure 1b). Latewood density (LWD) was almost constant during the first 10 growths rings (around 674 kg/m3 at the 10th growth ring), increased steadily to a maximum around the 25th growth ring, and slowly decreased toward the bark (Figure 1b).
Tracheid length and diameter were shorter and smaller in juvenile than in mature wood (Table 2) and displayed a curvilinear pattern in the radial direction (Figure 1c,d). Overall, wood properties in the whole ring followed similar patterns to those of earlywood (Figure 1a–d).

3.2. Intra-Ring and Inter-Ring Pearson’s Correlations of Selected Wood Properties

As a rule, anatomical properties were significantly correlated (Table 2). Few exceptions were found when mature TD was involved. All these correlations were positive. All correlations of anatomical properties were stronger in JW than in MW.
Overall, radial growth properties were significantly correlated (Table 2). Except for a few cases involving LWP, these correlations were positive and stronger in MW compared to JW. RA and RW followed this rule, with a strong Pearson’s correlation only in the mature wood. EWW correlations with both RW and RA was stronger than LWW ones. As one can expect, LWP was negatively correlated to EWW and positively correlated to LWW. LWP was negatively correlated to both RW and RA.
Physical properties were significantly and positively correlated in both JW and MW (Table 2). Intra-ring density variation increased with LWD and RD, while decreasing with EWD. However, LWD was more strongly correlated to intra-ring density variation than both EWD and RD. EWD was highly correlated with LWD, especially in the MW. We found EWD to be more strongly correlated to RD than LWD. However, the EWD correlation with RD decreased with age while that of LWD increased.

3.3. Inter-Ring Pearson’s Correlations of Selected Wood Properties

Anatomical properties significantly increased with intra-ring density variation (Table 2). TL was not significantly correlated with RD for the whole pith-to-bark section, while TD was only weakly and negatively correlated to RD. Higher correlation between both TL and TD with RD was found in the juvenile wood. These correlations were not significant in the mature wood. TL and TD decreased with RW (Table 2), but the effect was more pronounced for TL. As one may expect, average TL tended to increase with LWP. However, TL–LWP correlations were not significant in both juvenile and mature wood. The weakly decreasing trend of TD with LWP was not significant (Table 2). RD significantly decreased with RW, and increased with LWP, but the magnitude was weak in both cases (Table 2). Intra-ring density variation significantly decreased with both RW and LWP. However, the decrease of intra-ring density variation with both RW and LWP was limited (Table 2).

3.4. Principal Component Analysis of Selected Wood Properties

The first two dimensions of PCA explained 60.0% of the variables cloud total variability for the whole pith-to-bark section. This percentage was 57.7% and 52.9% for the mature wood section and the juvenile wood section, respectively. All these values were greater than the 32.9% threshold for 31 individuals and 15 variables. Overall, the average pith-to-bark section and the mature wood shared a similar quality of the representation, contribution to the axis, and correlation with the axis (Table 3). In all wood zones, the first dimension represented radial and circumferential growth (Table 3). The second dimension was associated with the tracheid length in the whole pith-to-bark section and the mature wood zone, while it represented ring density in the juvenile wood zone (Table 3). The three clusters that appeared in the whole pith-to-bark radial section, the juvenile wood zone, and the mature wood zone were RW-EWW-RA, TL-ETL-LTL, and RD-EWD-LWP (Table 3).

4. Discussion

4.1. Intra-Ring and Inter-Ring Variations of Selected Wood Properties

The large radial growth near the pith is typical of the first growing year, where the competition between crowns is limited and tree growth is vigorous [18]. Larson, Kretschmann, Clark III, and Isebrands [18] explained the reverse pattern of RA compared to RW by the fact that tree circumference invariably grows with age. Therefore, a stable RW or slightly decreasing RW along the tree radius will invariably increase the RA and tree volume. Both RA and RW are an expression of tree growth [57]. However, RA provides information about the radial and tangential growth, and its radial pattern is not as misleading as that of RW [25].
The radial patterns of RW, EWW, and LWW are similar to those reported by Zhang and Koubaa [32] and Lenz et al. [15] for white spruce. The initial decrease of LWP followed by a continual increase was expected because LWW decreased during the first five growths rings and the reverse was observed for EWW. After the fifth growth ring, both LWW and EWW decreased toward the bark, with a sharper decrease for EWW. This trend can be explained by the growth regulation of the active living crown. At a given height, the distance from the active living crown increases with growth ring. As a consequence of auxin influence, the earlywood proportion lowers, resulting in a higher LWP as the tree ages [18].
The radial patterns of TL [58] and TD [15] agree with previous reports on white spruce. Longer latewood than earlywood tracheids [58], as well as smaller latewood than earlywood tracheids [18] were found, consistent with previous reports. These intra-ring variations are related to the division of labor, with earlywood tracheids devoted to conduction, and latewood tracheids serving for mechanical strength [59,60].

4.2. Intra-Ring and Inter-Ring Pearson’s Correlations of Selected Wood Properties

TD changed at a slower rate than TL in the radial direction [11]. TD radial pattern also stabilized much earlier and was very flat in the MW compared to that of TL [29]. Coupling these facts explains why the correlations were generally weaker when involving mature TD. It was surprising to have stronger correlations in JW than in MW, since JW is known to be the zone of rapid changes in wood properties [39]. This result suggests that one must consider all pith to bark sections when establishing phenotypic correlations. The positive relationship between TL and TD at the intra-ring level agrees with findings at tree level [11]. Altogether, relationships among anatomical properties at the intra-ring level in this study suggest that factors that favor increasing an anatomical dimension will also favor increasing all dimensions of this category. This agrees with a related study that aimed to predict the white spruce average ring TL and TD [29]. In that study, we found TD to be a significant predictor of TL at the whole tree level. We also found single juvenile ring TL to be significant predictors of the whole pith-to-bark TL at breast height. However, cambium ageing in the case of TL and the distance from the apex in the case of TD remained the most important predictors [29]. Indeed, cambial initials are the precursors of xylem cells, and their dimensions are known to increase with tree age, even at the intra-ring level [18,34] and for long-living trees [61].
The correlations between RW and RA found in this study suggest that RA must be used as a surrogate for RW only in the MW zone. Correlations between EWW and LWW suggest that EWW can be used to predict LWW in the MW, but not in the JW, in agreement with a previous study [41]. The stronger correlations of EWW to both RW and RA compared to LWW agree with previous studies in black spruce [37] and balsam fir (Abies balsamea) [41]. EWW was also better correlated to LWP than RW, in agreement with a previous study in Douglas fir (Pseudotsuga menziesii) [51]. The LWP–RW relationship agrees with previous studies in Norway spruce [7] and black spruce [37,62].
Our results suggest that a higher EWD coupled with a lower LWD will favor wood uniformity in white spruce. This result is in agreement with findings on juvenile black spruce [62], but in disagreement with Balsam fir results [41], where reducing both EWD and LWD was seen as the way to improve wood uniformity. In the present study, and both Koga and Zhang [41] and Zhang [62] studies, changing LWD seems to be the most efficient way to control wood uniformity. This property is relevant for veneers and appearance products manufacturers [21]. The EWD–LWD correlations found in this study agrees with the finding in the JW [37,41,63], but conflicts with correlations in MW [37,41]. We found EWD to be more strongly correlated to RD than LWD, in agreement with previous studies [37,41]. However, the strength of the EWD correlation with RD decreased with age while that of LWD increased, demonstrating the growing impact of LWD as the tree ages [37].

4.3. Inter-Ring Pearson’s Correlations of Selected Wood Properties

Longer and smaller tracheids are likely to be found in latewood, compared to earlywood. Therefore, when considering that both TL and TD increase with intra-ring density variation, one can hypothesize that the latewood section plays a major role in increasing intra-ring density variation compared to the earlywood section. This hypothesis is supported by the LWP increasing trend from pith to bark. When TL and TD correlations with RD were taken separately, they suggested that anatomical properties were not sensitive to density variation after maturity. These relationships with tree ageing contrast with the finding of Dutilleul, Herman, and Avella-Shaw [12], where TL-RD was uncorrelated during early growth (6–21 years) but positively correlated thereafter (22–40 years). The decreasing pattern among anatomical properties and radial growth-related properties concurs with previous studies [11,12,51]. A contrasting result, an increase of TD with RW, was reported by Brändström [33] in Norway spruce. Many studies found no correlations between TL and RW [7,16], and between TD and RW [46]. Although an increased RW could be associated with reduced TL, the impact is limited and without practical implications [45]. Tracheids are known to be longer [16] and smaller [18] in latewood compared to earlywood. This general tendency explains why TL increased with LWP, while TD decreased with LWP.
The decrease of RD with RW agrees with the RD–RW relationship previously found in Norway spruce [12,55], black spruce [37,62,64], and white spruce [16,17]. However, it contrasts with the RD–RW relationship described by Koga and Zhang [41] for balsam fir. RD is closely related to solid wood physical and mechanical properties and to fiber product yield. Therefore, a large RD decrease will be detrimental for these industries. The week negative correlation between RD and RW found in this study concurs with previous studies [18,48], which suggest that the impact of the reduction in ring density due to the RW increase is limited and without practical implications. Consequently, it is often advised to put the emphasis on volume production in selection processes and thereafter, consider anatomical and physical properties [17,27,52,65]. The increase of RD with LWP found in this study agrees with the LWP–RD relationship previously reported [7,51,62,63]. LWP is a good predictor of overall RD [37,41,42]. Its higher correlation with RD in MW compared to JW is likely due to the growing influence of LWD as the tree ages. Intra-ring density variation slightly decreases with an increase in LWP, contrasting with Koga and Zhang’s [41] results. Practically, this means that a higher LWP favor wood homogeneity.

4.4. Principal Component Analysis of Selected Wood Properties

As expected, the PCA percentages found for the first two dimensions in all wood sections suggest that the studied variables are not independent. Overall, the three clusters observed in this study are in agreement with their radial pattern and their Pearson’s correlations. Based on this finding, one can only measure the most relevant wood properties on these clusters (RW, TL, and RD) and use them as proxies for the other variables in the cluster. The similarity of the whole pith-to-bark section and the mature wood in the PCA could be explained by the fact that mature wood represented a larger proportion of the whole pith-to-bark section than juvenile wood.

4.5. Practical Implications

The many Pearson’s correlations established could be used to select wood properties to be used for prediction models, as we did in a related study [29]. However, when the assessment of many wood properties is not mandatory, the PCA established that some properties could be used as proxies for variables belonging to the same cluster. Our material was collected from the same managed plantation, and all wood properties were measured at breast height only, using the Fiber Quality Analyzer for anatomical properties and the X-ray densitometer for radial growth-related properties and physical properties. Therefore, although the sampled trees represent a wide range of tree sizes, and the results are indicative of the relationships one could find in such material, care must be taken when generalizing the results to white spruce plantations or natural forest. In addition, phenotypic and genetic correlations may differ [66], so caution is advised when comparing the reported results with those from genetically improved trees.

5. Conclusions

This study investigated the variation of white spruce wood properties, and established intra-ring correlations among radial growth, anatomical dimensions, and physical wood properties. Variations largely differed after maturity for radial growth-related properties and tracheid length, but were more limited for physical properties and tracheid diameter. Except for a few cases, intra-ring values of anatomical, radial growth-related, and physical properties were significantly and positively correlated. Earlywood values were better indicators of ring values than latewood ones. One of the most striking aspects when several wood properties are considered is to know the real impact of fast growth on these properties, and therefore on wood quality. The negative correlation between ring width (RW) and tracheid length (TL) mainly occurred in the juvenile wood (JW). Although significant, the negative correlations between the RW and physical properties were weak. When anatomical properties and physical properties were considered, the larger and significant impacts were found only in the JW, while these correlations were generally not significant in the mature wood (MW). Based on the three clusters established with the PCA, RW, TL, and ring density could be used as proxies for variables belonging to the same cluster. Our samples came from plantation grown trees. Managing plantations to suppress tree growth during JW formation, and enhancing radial growth when MW formation starts will favor overall wood quality.

Author Contributions

Conceptualization, A.K. and C.S.M., methodology, A.K. and C.S.M.; formal analysis, C.S.M., M.-C.Y., M.D., and A.K.; investigation, C.S.M., A.K., AC. and J.B.; resources, A.K.; data curation, C.S.M., A.K., A.C.; M.-C.Y., and M.D.; writing—original draft preparation, C.S.M. writing—review and editing, A.K., J.B., A.C., M.-C.Y. and M.D.; supervision, A.K., A.C. and J.B.; project administration, A.K. and A.C.; funding acquisition, A.C. and A.K.

Funding

This research was funded by the Canada Research Chair Program, Grant number: 557752; ForValueNet, NSERC Strategic Network, Grant number: 504736; FRQNT, BMP Grant number: 136847.

Conflicts of Interest

The authors declare no conflict of interest. The funders had no role in the design of the study; analyses, interpretation of data; in the writing of the manuscript, or in the decision to publish the results.

References

  1. Little, E.L., Jr. (Ed.) Checklist of United States Trees (Native and Naturalized); Volume (Agriculture Handbook, 541); United States, Department of Agriculture, Forest Service: Washington, DC, USA, 1979; p. 375.
  2. Fu, S.; Bell, F.W.; Chen, H.Y.H. Long-term effects of intensive silvicultural practices on productivity, composition, and structure of northern temperate and boreal plantations in Ontario, Canada. For. Ecol. Manag. 2007, 241, 115–126. [Google Scholar] [CrossRef]
  3. Fu, S.; Chen, H.Y.H.; Bell, F.W.; Sharma, M.; Delaney, J.R.; Peterson, G. Effects of timing of glyphosate application on jack pine, black spruce, and white spruce plantations in northern Manitoba. For. Chron. 2008, 84, 37–45. [Google Scholar] [CrossRef] [Green Version]
  4. Pelletier, G.; Pitt, D.G. Silvicultural responses of two spruce plantations to midrotation commercial thinning in New Brunswick. Can. J. For. Res. 2008, 38, 851–867. [Google Scholar] [CrossRef]
  5. Yang, K.C. Impact of spacing on width and basal area of juvenile and mature wood in Picea mariana and Picea glauca. Wood Fiber Sci. 1994, 26, 479–488. [Google Scholar]
  6. Jozsa, L.A.; Middleton, G.R. A Discussion of Wood Quality Attributes and Their Practical Implications; Special Publication SP-34; Forintek Canada Corp.: Vancouver, BC, Canada, 1994; p. 42. [Google Scholar]
  7. Mergen, F.; Burley, J.; Yeatman, C.W. Variation in growth characteristics and wood properties of Norway spruce. Tappi 1964, 47, 499–504. [Google Scholar]
  8. Vargas-Hernandez, J.; Adams, W.T. Genetic variation of wood density components in young coastal Douglas-fir: Implications for tree breeding. Can. J. For. Res. 1991, 21, 1801–1807. [Google Scholar] [CrossRef]
  9. Lenz, P.; MacKay, J.; Rainville, A.; Cloutier, A.; Beaulieu, J. The influence of cambial age on breeding for wood properties in Picea glauca. Tree Genet. Genomes 2011, 7, 641–653. [Google Scholar] [CrossRef]
  10. Bendtsen, B.A.; Senft, J. Mechanical and anatomical properties in individual growth rings of plantation-grown eastern cottonwood and loblolly pine. Wood Fiber Sci. 1986, 18, 23–38. [Google Scholar]
  11. Bannan, M.W. The length, tangential diameter, and length/width ratio of conifer tracheids. Can. J. Bot. 1965, 43, 967–984. [Google Scholar] [CrossRef]
  12. Dutilleul, P.; Herman, M.; Avella-Shaw, T. Growth rate effects on correlations among ring width, wood density, and mean tracheid length in Norway spruce (Picea abies). Can. J. For. Res. 1998, 28, 56–68. [Google Scholar] [CrossRef]
  13. Duff, G.H.; Nolan, N.J. Growth and morphogenesis in the canadian forest species: I The controls of cambial and apical activity in Pinus resinosa ait. Can. J. Bot. 1953, 31, 471–513. [Google Scholar] [CrossRef]
  14. Duff, G.H.; Nolan, N.J. Growth and morphogenesis in the canadian forest species: III The time scale of morpeiogenesis at the stem apex of Pinus resinosa ait. Can. J. Bot. 1958, 36, 687–710. [Google Scholar] [CrossRef]
  15. Lenz, P.; Cloutier, A.; MacKay, J.; Beaulieu, J. Genetic control of wood properties in Picea glauca—An analysis of trends with cambial age. Can. J. For. Res. 2010, 40, 703–715. [Google Scholar] [CrossRef]
  16. Yang, K.C. Impact of spacing on juvenile wood and mature wood properties of white spruce (Picea glauca). Taiwan J. For. Sci. 2002, 17, 13–29. [Google Scholar]
  17. Corriveau, A.; Beaulieu, J.; Mothe, F. Wood density of natural white spruce populations in Quebec. Can. J. For. Res. 1987, 17, 675–682. [Google Scholar] [CrossRef]
  18. Larson, P.R.; Kretschmann, D.E.; Clark, A., III; Isebrands, J.G. Formation and Properties of Juvenile Wood in Southern Pines: A Synopsis; General Technical Report, FPL-GTR-129; United States, Department of Agriculture, Forest Service, Forest Products Laboratory: Madison, WI, USA, 2001; p. 42.
  19. Cown, D.J. Corewood (juvenile wood) in Pinus radiata—Should we be concerned? N. Z. J. For. Sci. 1992, 22, 87–95. [Google Scholar]
  20. Evans, R.; Ilic, J. Rapid prediction of wood stiffness from microfibril angle and density. For. Prod. J. 2001, 51, 53–57. [Google Scholar]
  21. Koubaa, A.; Zhang, S.Y.; Makni, S. Defining the transition from earlywood to latewood in black spruce based on intra-ring wood density profiles from X-ray densitometry. Ann. For. Sci. 2002, 59, 511–518. [Google Scholar] [CrossRef]
  22. Molteberg, D.; Hoibo, O. Modelling of wood density and fibre dimensions in mature Norway spruce. Can. J. For. Res. 2007, 37, 1373–1389. [Google Scholar] [CrossRef]
  23. Obernberger, I.; Thek, G. Physical characterisation and chemical composition of densified biomass fuels with regard to their combustion behaviour. Biomass Bioenergy 2004, 27, 653–669. [Google Scholar] [CrossRef]
  24. Bowyer, J.L.; Shmulsky, R.; Haygreen, J.G. (Eds.) Forest Products and Wood Science. An Introduction; Blackwell Publishing: Ames, IA, USA, 2007; p. 558. [Google Scholar]
  25. Alteyrac, J.; Cloutier, A.; Zhang, S.Y. Characterization of juvenile wood to mature wood transition age in black spruce (Picea mariana (Mill.) B.S.P.) at different stand densities and sampling heights. Wood Sci. Technol. 2006, 40, 124–138. [Google Scholar] [CrossRef]
  26. Mvolo, C.S.; Koubaa, A.; Beaulieu, J.; Cloutier, A.; Mazerolle, M.J. Variation in Wood Quality in White Spruce (Picea glauca (Moench) Voss). Part I. Defining the Juvenile—Mature Wood Transition Based on Tracheid Length. Forests 2015, 6, 183–202. [Google Scholar] [CrossRef]
  27. Beaulieu, J. Genetic variation in tracheid length and relationships with growth and wood traits in eastern white spruce (Picea glauca). Wood Fiber Sci. 2003, 35, 609–616. [Google Scholar]
  28. Olson, M.E.; Anfodillo, T.; Rosell, J.A.; Petit, G.; Crivellaro, A.; Isnard, S.; León-Gómez, C.; Alvarado-Cárdenas, L.O.; Castorena, M. Universal hydraulics of the flowering plants: Vessel diameter scales with stem length across angiosperm lineages, habits and climates. Ecol. Lett. 2014, 17, 988–997. [Google Scholar] [CrossRef] [PubMed]
  29. Mvolo, C.S.; Koubaa, A.; Defo, M.; Beaulieu, J.; Yemele, M.-C.; Cloutier, A. Prediction of tracheid length and diameter in white spruce (Picea glauca (Moench) Voss). IAWA J. 2015, 36, 186–207. [Google Scholar] [CrossRef]
  30. Fries, A.; Ericsson, T.; Morling, T. Measuring relative fibre length in Scots pine by non-destructive wood sampling. Holzforschung 2003, 57, 400–406. [Google Scholar] [CrossRef]
  31. Anfodillo, T.; Petit, G.; Crivellaro, A. Axial conduit widening in woody species: A still neglected anatomical pattern. IAWA J. 2013, 34, 352–364. [Google Scholar] [CrossRef]
  32. Zhang, S.Y.; Koubaa, A. Les Résineux de l’est du Canada: Écologie Forestière, Caractéristiques, Transformation et Usages; Publication spéciale SP-526F; FPInnovations: Québec, QC, Canada, 2009; p. 400. [Google Scholar]
  33. Brändström, J. Micro and ultrastructural aspects of Norway spruce tracheids: A review. IAWA J. 2001, 22, 333–353. [Google Scholar] [CrossRef]
  34. Larson, P.R. (Ed.) The Vascular Cambium: Development and Structure; Springer Series in Wood Science; Springer: Berlin, Germany, 1994; p. 725. [Google Scholar]
  35. Rossi, S.; Deslauriers, A.; Griçar, J.; Seo, J.W.; Rathgeber, C.B.K.; Anfodillo, T.; Morin, H.; Levanic, T.; Oven, P.; Jalkanen, R. Critical temperatures for xylogenesis in conifers of cold climates. Glob. Ecol. Biogeogr. 2008, 17, 696–707. [Google Scholar] [CrossRef]
  36. Larson, P.R. Contribution of different-aged needles to growth and wood formation of young red pine. For. Sci. 1964, 10, 224–238. [Google Scholar]
  37. Koubaa, A.; Zhang, S.Y.; Isabel, N.; Beaulieu, J.; Bousquet, J. Phenotypic correlations between juvenile-mature wood density and growth in black spruce. Wood Fiber Sci. 2000, 32, 61–71. [Google Scholar]
  38. Anfodillo, T.; Deslauriers, A.; Menardi, R.; Tedoldi, L.; Petit, G.; Rossi, S. Widening of xylem conduits in a conifer tree depends on the longer time of cell expansion downwards along the stem. J. Exp. Bot. 2012, 63, 837–845. [Google Scholar] [CrossRef] [PubMed]
  39. Zobel, B.J.; Sprague, J.R. (Eds.) Juvenile Wood in Forest Trees; Springer: Berlin, Germany, 1998; p. 300. [Google Scholar]
  40. Panshin, A.J.; de Zeuuw, C. Textbook of Wood Technology: Structure, Identification, Properties, and Uses of the Commercial Woods of the United States and Canada, 4th ed.; McGraw-Hill Book Co.: New York, NY, USA, 1980; p. 722. [Google Scholar]
  41. Koga, S.; Zhang, S.Y. Relationships between wood density and annual growth rate components in balsam fir (Abies balsamea). Wood Fiber Sci. 2002, 34, 146–157. [Google Scholar]
  42. Lindström, H. Fiber length, tracheid diameter, and latewood percentage in Norway spruce: Development from pith outwards. Wood Fiber Sci. 1997, 29, 21–34. [Google Scholar]
  43. Dinwoodie, J.M. Variation in Tracheid Length in Picea sitchensis Carr.; Department of Scientific and Industrial Research, Forest Products Research: London, UK, 1963; p. 60.
  44. Herman, M.; Dutilleul, P.; Avella-Shaw, T. Growth rate effects on temporal trajectories of ring width, wood density, and mean tracheid length in Norway spruce (Picea abies (L.) Karst.). Wood Fiber Sci. 1998, 30, 6–17. [Google Scholar]
  45. Jaakkola, T.; Makinen, H.; Saren, M.P.; Saranpaa, P. Does thinning intensity affect the tracheid dimensions of Norway spruce? Can. J. For. Res. 2005, 35, 2685–2697. [Google Scholar] [CrossRef]
  46. Lasserre, J.P.; Mason, E.G.; Watt, M.S.; Moore, J.R. Influence of initial planting spacing and genotype on microfibril angle, wood density, fibre properties and modulus of elasticity in Pinus radiata D. Don corewood. For. Ecol. Manag. 2009, 258, 1924–1931. [Google Scholar] [CrossRef]
  47. Herman, M.; Dutilleul, P.; Avella-Shaw, T. Intra-ring and inter-ring variations of tracheid length in fast-grown versus slow-grown Norway spruces (Picea abies). IAWA J. 1998, 19, 3–23. [Google Scholar] [CrossRef]
  48. Jaakkola, T.; Makinen, H.; Saranpaa, P. Wood density in Norway spruce: Changes with thinning intensity and tree age. Can. J. For. Res. 2005, 35, 1767–1778. [Google Scholar] [CrossRef]
  49. Pape, R. Influence of thinning and tree diameter class on the development of basic density and annual ring width in Picea abies. Scand. J. For. Res. 1999, 14, 27–37. [Google Scholar] [CrossRef]
  50. Pape, R. Effects of thinning regime on the wood properties and stem quality of Picea abies. Scand. J. For. Res. 1999, 14, 38–50. [Google Scholar] [CrossRef]
  51. Erickson, H.D.; Harrison, A.T. Douglas-fir wood quality studies part I: Effects of age and stimulated growth on wood density and anatomy. Wood Sci. Technol. 1974, 8, 207–226. [Google Scholar] [CrossRef]
  52. Vincent, M.; Krause, C.; Koubaa, A. Variation in black spruce (Picea mariana (Mill.) BSP) wood quality after thinning. Ann. For. Sci. 2011, 68, 1115–1125. [Google Scholar] [CrossRef]
  53. Franklin, G.L. Preparation of thin sections of synthetic resins and wood-resin composites, and a new macerating method for wood. Nature 1945, 155, 51. [Google Scholar] [CrossRef]
  54. R Core Team. R: A Language and Environment for Statistical Computing; R Foundation for Statistical Computing: Vienna, Austria, 2018. [Google Scholar]
  55. Blouin, D.; Beaulieu, J.; Daoust, G.; Poliquin, J. Wood quality of Norway spruce grown in plantations in Quebec. Wood Fiber Sci. 1994, 26, 342–353. [Google Scholar]
  56. Le, S.; Josse, J.; Husson, F. FactoMineR: An R Package for Multivariate Analysis. J. Stat. Softw. 2008, 25, 1–18. [Google Scholar] [CrossRef]
  57. Clark, A., III; Saucier, J.R. Influence of initial planting density, geographic location, and species on juvenile wood formation in southern pine. For. Prod. J. 1989, 39, 42–48. [Google Scholar]
  58. Fujiwara, S.; Yang, K.C. The relationship between cell length and ring width and circumferential growth rate in five Canadian species. IAWA J. 2000, 21, 335–345. [Google Scholar] [CrossRef]
  59. Carlquist, S. (Ed.) Ecological Strategies of Xylem Evolution; University of California Press: Berkeley, CA, USA, 1975; p. 259. [Google Scholar]
  60. Domec, J.C.; Gartner, B.L. How do water transport and water storage differ in coniferous earlywood and latewood? J. Exp. Bot. 2002, 53, 2369–2379. [Google Scholar] [CrossRef] [Green Version]
  61. Baas, P.; Schmid, R.; van Heuven, B.J. Wood anatomy of Pinus longaeva (Bristlecone pine) and the sustained length-on-age increase of its tracheids. IAWA J. 1986, 7, 221–228. [Google Scholar] [CrossRef]
  62. Zhang, S.Y. Effect of age on the variation, correlations and inheritance of selected wood characteristics in black spruce (Picea mariana). Wood Sci. Technol. 1998, 32, 197–204. [Google Scholar]
  63. Zhang, S.Y.; Morgenstern, E.K. Genetic variation and inheritance of wood density in black spruce (Picea mariana) and its relationship with growth: Implications for tree breeding. Wood Sci. Technol. 1996, 30, 63–75. [Google Scholar] [CrossRef]
  64. Koubaa, A.; Isabel, N.; Zhang, S.Y.; Beaulieu, J.; Bousquet, J. Transition from juvenile to mature wood in black spruce (Picea mariana (Mill.) B.S.P.). Wood Fiber Sci. 2005, 37, 445–455. [Google Scholar]
  65. Beaulieu, J.; Corriveau, A. Variabilité de la densité du bois et de la production des provenances d’épinette blanche, 20 ans après plantation. Can. J. Res. 1985, 15, 833–838. [Google Scholar] [CrossRef]
  66. Huda, A.S.M.; Koubaa, A.; Cloutier, A.; Hernández, R.E.; Périnet, P.; Fortin, Y. Phenotypic and Genotypic Correlations for Wood Properties of Hybrid Poplar Clones of Southern Quebec. Forests 2018, 9, 140. [Google Scholar] [CrossRef]
Figure 1. Intra-ring and inter-ring radial variations of growth-related, density-related, and anatomical wood properties: (a) Ring width (RW), earlywood width (EWW), and latewood width (LWW). (b) Ring density (RD), earlywood density (EWD), and latewood density (LWD). (c) Average ring tracheid length (TL), earlywood tracheid length (ETL), and latewood tracheid length (LTL). (d) Average ring tracheid diameter (TD), earlywood tracheid diameter (ETD), and latewood tracheid diameter (LTD). Bars indicate standard errors of the mean.
Forests 10 00589 g001
Figure 2. Inter-ring radial variations of latewood proportion (LWP). Bars indicate standard errors of the mean.
Forests 10 00589 g002
Figure 3. Inter-ring radial variations of the ring area (RA). Bars indicate standard errors of the mean.
Forests 10 00589 g003
Figure 4. Inter-ring radial variations of the intra-ring density variation (IDV). Bars indicate standard errors of the mean.
Forests 10 00589 g004
Table 1. Acronyms used in the text and their descriptions.
AcronymDescription
BABasal area
BHBreast height
ETDEarlywood tracheid diameter
ETLEarlywood tracheid length
EWWEarlywood width
EWDEarlywood density
JWJuvenile wood
LTDLatewood tracheid diameter
LTLLatewood tracheid length
LWWLatewood width
LWDLatewood density
LWPLatewood proportion
MWMature wood
RARing area
RDRing density
RWRing width
TDTracheid diameter
TLTracheid length
Table 2. On the diagonal, in bold and italic, the mean and standard deviation (between parentheses) of the 15 wood properties measured at breast height. Above the diagonal, intra-ring Pearson’s correlations between radial growth-related properties, anatomical properties, and density-related properties for the whole ring, earlywood zone, latewood zone, whole pith-to-bark radial section, juvenile wood zone, and mature wood zone. Below the diagonal, standard errors of the Pearson’s correlations.
WPZoneLTD
(µm)
LTL
(mm)
LWW
(mm)
LWP
(%)
LWD
(kg/m3)
ETD
(µm)
ETL
(mm)
EWW
(mm)
EWD
(kg/m3)
TD
(µm)
TL
(mm)
RW
(mm)
RA
(mm2)
RD
(kg/m3)
IDV
(kg/m3)
LTD
(µm)
Juv.27.2 (3.6)0.45 ***−0.07 ns−0.02 ns0.08 ns0.55 ***0.45 ***−0.11 ns−0.35 ***0.63 ***0.46 ***−0.12 ns0.46 ***−0.29 **0.39 ***
Ave.28.4 (3.4)0.35 ***−0.09 ns0.11 *0.04 ns0.41 ***0.41 ***−0.20 **−0.29 ***0.53 ***0.41 ***−0.20 **0.27 ***−0.16 *0.28 ***
Mat.27.8 (3.6)0.19 *0.03 ns0.19 *−0.11 ns0.16 *0.36 ***−0.1 ns−0.19 *0.35 ***0.35 ****−0.07 ns0.04 ns−0.1 ns0.05 ns
LTL
(mm)
Juv.0.0732.5 (0.6)−0.2 *−0.04 ns0.18 *0.58 ***0.92 ***−0.41 ***−0.41 ***0.57 ***0.95 ***−0.43 ***0.53 ***−0.33 ***0.45 ***
Ave.0.0543.4 (0.4)−0.35 ***0.13 *0.33 ***0.39 ***0.91 ***−0.65 ***−0.27 ***0.39 ***0.94 ***−0.66 ***0.34 ***0 ns0.46 ***
Mat.0.0822.9 (0.7)−0.16 *0.05 ns0.03 ns0.02 ns0.65 ***−0.24 *−0.09 ns0.09 ns0.75 ***−0.26 *−0.08 ns−0.01 ns−0.02 ns
LWW
(mm)
Juv.0.0810.080.7 (0.5)0.84 ***−0.64 ***0.03 ns−0.23 *0.07 ns−0.15 *−0.15 ns−0.2 *0.43 ***0.11 *−0.02 ns−0.11 *
Ave.0.0580.0550.3 (0.3)0.48 ***−0.52 ***0.08 ns−0.34 ***0.47 ***−0.07 *−0.11 *−0.33 ***0.65 ***0.28 ***−0.09 **−0.05 *
Mat.0.0830.0820.4 (0.4)0.49 ***−0.44 ***0.4 ***−0.09 ns0.43 ***−0.21 ***0.13 ns−0.11 ns0.65 ***0.58 ***−0.08 *0.27 ***
LWP
(%)
Juv.0.0820.0820.02617.4 (10)−0.65 ***0.09 ns−0.08 ns−0.4 ***−0.14 *−0.12 ns−0.05 ns−0.04 ns−0.07 ns0.07 ns−0.13 *
Ave.0.0580.0580.02120.4 (9.6)−0.56 ***0.13 *0.13 *−0.37 ***−0.21 ***−0.08 ns0.15 *−0.19 ***−0.10 ***0.14 ***−0.17***
Mat.0.0810.0830.02419.7 (9.8)−0.65 ***0.11 ns0.10 ns−0.39 ***−0.21 ***−0.13 ns0.12 ns−0.19 ***−0.14 ***0.14 ***−0.27 ***
LWD
(kg/m3)
Juv.0.0810.080.0370.037688 (96)0.12 ns0.17 *0.04 ns0.31 ***0.25 *0.14 ns−0.2 ***0.03 ns0.33 ***0.55 ***
Ave.0.0580.0550.0210.020780 (120)0.11 *0.31 ***−0.13 ***0.34 ***0.24 ***0.30 ***−0.24 ***0.11 ***0.43 ***0.67 ***
Mat.0.0830.0830.0260.021757 (121)−0.04 ns−0.02 ns0.2 ***0.48 ***0.12 ns−0.03 ns0.05 ns0.07 *0.46 ***0.65 ***
ETD
(µm)
Juv.0.0680.0670.0820.0810.08134.6 (5.1)0.57 ***−0.19 *−0.39 ***0.95 ***0.58 ***−0.16 *0.59 ***−0.28 **0.53 ***
Ave.0.0530.0540.0580.0580.05836.8 (3.9)0.39 ***−0.17 *−0.31 ***0.94 ***0.39 ***−0.12 *0.53 ***−0.15 *0.46 ***
Mat.0.0820.0840.0760.0830.08335.7 (4.7)0.03 ns0.32 ***−0.17 *0.92 ***0.03 ns0.41 ***0.43 ***−0.1 ns0.27 **
ETL
(mm)
Juv.0.0730.0310.0800.0820.0810.0682.3 (0.6)−0.39 ***−0.38 ***0.58 ***0.99 ***−0.43 ***0.49 ***−0.33 ***0.40 ***
Ave.0.0530.0250.0550.0580.0560.0543.3 (0.4)−0.64 ***−0.23 ***0.40 ***0.99 ***−0.65 ***0.36 ***0.03 ns0.45 ***
Mat.0.0780.0640.0840.0830.0840.0842.8 (0.7)−0.19 *0.01 ns0.11 ns0.98 ***−0.19 *−0.03 ns0.07 ns0.00 ns
EWW
(mm)
Juv.0.0810.0750.0480.0440.0480.080.0763.2 (1.2)0.07 ns−0.13 ns−0.41 ***0.93 ***0.28 ***−0.11 *−0.05 ns
Ave.0.0570.0440.0210.0220.0240.0570.0451.2 (0.8)0.18 ***−0.12 *−0.65 ***0.97 ***0.34 ***−0.14 ***−0.05 *
Mat.0.0830.0810.0250.0260.0270.0790.0821.7 (1.2)0.07 *0.34 ***−0.23 *0.97 ***0.8 ***−0.13 ***0.43 ***
EWD
(kg/m3)
Juv.0.0770.0750.0480.0480.0460.0750.0760.048402 (44)−0.33***−0.41 ***0 ns−0.51 ***0.94 ***−0.34 ***
Ave.0.0550.0560.0240.0240.0230.0550.0570.024383 (40)−0.25 ***−0.25 ***0.14 ***−0.21 ***0.82 ***−0.07 *
Mat.0.0810.0830.0270.0270.0250.0820.0840.028388 (42)−0.09 ns−0.03 ns0 ns−0.1 **0.84 ***0.12 ***
TD
(µm)
Juv.0.0630.0670.0810.0810.0790.0250.0670.0810.07733.3 (4.6)0.58 ***−0.17 *0.57 ***−0.27 **0.5 ***
Ave.0.0490.0540.0580.0580.0560.0200.0540.0580.05635.1 (3.2)0.40 ***−0.13 *0.48 ***−0.15 *0.44***
Mat.0.0780.0830.0830.0830.0830.0330.0830.0780.08334.2 (4.1)0.12 ns0.32 ***0.38 ***−0.1 ns0.28 **
TL
(mm)
Juv.0.0730.0260.0810.0820.0810.0670.0080.0750.0750.0672.3 (0.6)−0.43 ***0.51 ***−0.34 ***0.42 ***
Ave.0.0530.0210.0550.0580.0560.0540.0050.0440.0570.0543.3 (0.4)−0.66 ***0.35 ***0.02 ns0.45 ***
Mat.0.0780.0550.0830.0830.0840.0840.0150.0820.0840.0832.8 (0.7)−0.22 *−0.05 ns0.05 ns−0.02 ns
RW
(mm)
Juv.0.0810.0740.0430.0480.0470.0810.0740.0180.0480.080.0743.9 (1.3)0.29 ***−0.1 *−0.09 ns
Ave.0.0570.0430.0180.0240.0240.0580.0440.0050.0240.0580.0441.5 (0.9)0.36 ***−0.14 ***−0.06 *
Mat.0.0830.0810.0210.0280.0280.0760.0820.0070.0280.0790.0822.1 (1.5)0.84 ***−0.13 ***0.44 ***
RA
(mm2)
Juv.0.0720.0690.0480.0480.0480.0660.0720.0460.0420.0670.0710.046688 (442)−0.49 ***0.50 ***
Ave.0.0560.0550.0230.0240.0240.0490.0550.0230.0240.0510.0550.023905 (625)−0.21 ***0.50***
Mat.0.0830.0830.0230.0280.0280.0750.0840.0170.0280.0770.0840.015850 (592)−0.17 ***0.48 ***
RD
(kg/m3)
Juv.0.0780.0770.0480.0480.0460.0780.0780.0480.0170.0790.0770.0480.042445 (42)−0.18 **
Ave.0.0570.0580.0240.0240.0220.0570.0580.0240.0140.0570.0590.0240.024453 (46)0.15 ***
Mat.0.0830.0830.0280.0280.0250.0830.0840.0280.0150.0830.0840.0280.028451 (45)0.22 ***
IDV
(kg/m3)
Juv.0.0750.0720.0480.0480.040.0690.0750.0480.0450.0710.0750.0480.0420.048509 (126)
Ave.0.0560.0520.0240.0240.0180.0520.0520.0240.0240.0520.0520.0240.0210.024609 (124)
Mat.0.0830.0830.0270.0270.0210.080.0840.0250.0280.080.0840.0250.0250.027584 (132)
WP (wood properties), Juv. (juvenile wood), Mat. (mature wood), Ave. (average pith-to-bark value), TL (tracheid length), TD (tracheid diameter), ETL (earlywood TL), ETD (earlywood TD), LTL (latewood TL), LTD (latewood TD), RW (ring width), RA (ring area), EWW (earlywood width), LWW (latewood width), LWP (latewood proportion), RD (ring density), IDV (intra-ring density variation), EWD (earlywood density), and LWD (latewood density). *, **, and ***, indicate significance at p < 0.05, p < 0.001, and p < 0.0001, respectively. ns indicates not significant at p ≤ 0.05.
Table 3. Quality of the representation, contribution to the axis, and correlation with the axis of the radial growth-related properties, anatomical properties, and density-related properties for the whole ring, earlywood zone, latewood zone, whole pith-to-bark radial section, juvenile wood zone, and mature wood zone.
WPAverageMatureJuvenile
Rep.Cont.Corr.Rep.Cont.Corr.Rep.Cont.Corr.
Dim1Dim2Dim1Dim2Dim1Dim2
TL0.9227.75-0.880.9330.29-0.960.3710.83--
TD0.5910.000.77-0.5810.750.74-0.5011.130.70-
ETL0.9127.72-0.880.9229.98-0.950.308.79--
ETD0.599.990.77-0.5910.570.76-0.5011.140.69-
LTL0.8525.36-0.830.7223.14-0.830.349.99--
LTD0.325.47--0.287.66--0.337.24--
RW0.8113.720.89-0.8415.030.91-0.8017.890.88-
RA0.7713.080.87-0.8314.920.90-0.8017.880.88-
EWW0.8013.590.89-0.8515.250.91-0.7716.990.87-
LWW0.599.840.76-0.6411.400.80-0.6014.440.66-
LWP0.195.19--0.132.32--0.164.78--
RD0.3510.60--0.296.90--0.7521.05-−0.80
IDV0.6711.840.79-0.5910.740.76-0.338.33--
EWD0.4111.25--0.358.00--0.6818.93-−0.74
LWD0.244.60--0.123.04--0.7220.59-−0.82
WP (wood properties), TL (tracheid length), TD (tracheid diameter), ETL (earlywood TL), ETD (earlywood TD), LTL (latewood TL), LTD (latewood TD), RW (ring width), RA (ring area), EWW (earlywood width), LWW (latewood width), LWP (latewood proportion), RD (ring density), IDV (intra-ring density variation), EWD (earlywood density) and LWD (latewood density), Rep. (Quality of the representation), Cont. (contribution to the axis), Corr. (correlation with the axis), Dim1 (dimension 1), and Dim2 (dimension 2). Only correlations significant at p < 0.0001 are presented.

