Article

Important Insect and Disease Threats to United States Tree Species and Geographic Patterns of Their Potential Impacts

1
Department of Forestry and Environmental Resources, North Carolina State University, 3041 Cornwallis Road, Research Triangle Park, NC 27709, USA
2
Department of Forestry and Environmental Resources, North Carolina State University, Campus Box 8008, Raleigh, NC 27695, USA
3
Camcore, Department of Forestry and Environmental Resources, North Carolina State University, Campus Box 8008, Raleigh, NC 27695, USA
4
Forest Health Protection, USDA Forest Service, Washington, DC 20024, USA
*
Author to whom correspondence should be addressed.
Retired.
Forests 2019, 10(4), 304; https://doi.org/10.3390/f10040304
Submission received: 7 March 2019 / Revised: 26 March 2019 / Accepted: 28 March 2019 / Published: 2 April 2019

Abstract

:
Diseases and insects, particularly those that are non-native and invasive, arguably pose the most destructive threat to North American forests. Currently, both exotic and native insects and diseases are producing extensive ecological damage and economic impacts. As part of an effort to identify United States tree species and forests most vulnerable to these epidemics, we compiled a list of the most serious insect and disease threats for 419 native tree species and assigned a severity rating for each of the 1378 combinations between mature tree hosts and 339 distinct insect and disease agents. We then joined this list with data from a spatially unbiased and nationally consistent forest inventory to assess the potential ecological impacts of insect and disease infestations. Specifically, potential host species mortality for each host/agent combination was used to weight species importance values on approximately 132,000 Forest Inventory and Analysis (FIA) plots across the conterminous 48 United States. When summed on each plot, these weighted importance values represent an estimate of the proportion of the plot’s existing importance value at risk of being lost. These plot estimates were then used to identify statistically significant geographic hotspots and coldspots and of potential forest impacts associated with insects and diseases in total, and for different agent types. In general, the potential impacts of insects and diseases were greater in the West, where there are both fewer agents and less diverse forests. The impact of non-native invasive agents, however, was potentially greater in the East. Indeed, the impacts of current exotic pests could be greatly magnified across much of the Eastern United States if these agents are able to reach the entirety of their hosts’ ranges. Both the list of agent/host severities and the spatially explicit results can inform species-level vulnerability assessments and broad-scale forest sustainability reporting efforts, and should provide valuable information for decision-makers who need to determine which tree species and locations to target for monitoring efforts and pro-active management activities.

1. Introduction

Forest insects and diseases, particularly those introduced from overseas through international trade, are having widespread and substantial impacts on the ecological function and economic value of North American forest ecosystems [1,2]. They may, in fact, pose the most pervasive and important threat to forests in the region [3]. Nearly two-thirds of the forestland in the United States (334 million hectares) is at risk of experiencing mortality from insects and diseases through 2027, with nearly 25 million hectares expected to lose more than 20 percent of host tree basal area [4].
When considered within its full ecological context, some amount of disturbance by insects and diseases can play a role in sustaining a healthy forest structure by culling weaker competitors and releasing resources necessary for the growth of surviving trees [5,6]. Such a perspective is limited to the effects of native insect and disease agents, however, while noting that the effects of at least some insect and disease agents on forest structure and composition may have been magnified by long-term forest management practices (or the lack thereof) [7,8,9] and could become stronger and more widespread with projected climate conditions [3,10,11]. At least some non-native insects and diseases, meanwhile, cause undeniably devastating impacts to forests, including wholesale alterations to the structure and functioning of forest ecosystems [12]. The most serious of these agents in fact have the potential to functionally eliminate their tree host species [13]. The longest-term example of this in North America has been chestnut blight (Cryphonectria parasitica (Murrill) Barr), which resulted in the functional loss of American chestnut (Castanea dentata (Marsh.) Borkh.) and its relatives across large areas of eastern North America [14]. More recently, hemlock woolly adelgid (Adelges tsugae Annand) is decimating eastern hemlock (Tsuga canadensis (L.) Carriere) across the same area [15]; emerald ash borer (Agrilus planipennis Fairmaire) is effectively eradicating several ash (Fraxinus) species in the north-central United States and southern Canada [16], and laurel wilt disease, involving an introduced insect vector (Xyleborus glabratus Eichhoff) and a pathogen symbiont (Raffaelea lauricola T.C. Harr., Fraedrich & Aghayeva), has killed hundreds of millions of redbays (Persea borbonia (L.) Spreng.) in the southeastern United States [17]. The loss of host species as a result of these and other agents has repercussions for the ecological functions of forests, including nutrient cycling, productivity and habitat for fauna, as well as diminishing the services trees provide within urban settings, such as shade and enhanced property value [1,2].
To monitor the health of forested ecosystems and to understand the impacts of forest insect and disease infestations on forest structure, composition, and biodiversity, it is important to analyze patterns of insect and disease occurrences [18,19]. Examining pest impacts from a landscape-scale perspective is useful, given the regional extent of many infestations and the large-scale complexity of interactions between host distribution, stress factors, and the development of pest outbreaks [20,21]. Similarly, a necessary step in assessing risks from insects and diseases, and in particular from those that are invasive, is to map their potential impacts on biodiversity, economic systems and human health [22].
Numerous studies have predicted the risk of establishment and spread of specific forest insect and disease agents across broad scales, for example [23,24,25], and fewer have estimated the impacts of those pests on the forests they infest [17,26,27]. Alongside the valuable information generated by these studies, it is also important to understand the potential impacts of multiple pests—and, ideally, of the most significant ones—on forests at regional to national scales. The resulting information can then be applied to assist in the geographic allocation of limited resources for prevention, monitoring and management activities. To quantify the spatial extent and patterns of forest disease and insect activities across the United States, we combined information about the severity of the most significant agents affecting each tree species native to the continental United States with a nationally standardized forest inventory system. This work is part of a broader effort to categorize and prioritize United States tree species for conservation actions based on the threats that face them, as well as on their sensitivity and adaptive capacity relative to those threats [28]. For the current assessment, we first compiled a list of as many as five of the most serious insect and disease agents for each of 419 native tree species, and rated the severity associated with each of the resulting 1378 tree host/insect or disease agent combinations. We summarized this information across agent taxonomic groups, invasive/native status, and feeding guilds (for insects), as well as across host tree taxonomic groups. We next combined these severity ratings, overall and for different agent groups, with the importance value of each tree species on approximately 132,000 plots within the U.S. Forest Inventory and Analysis (FIA) program of the United States Forest Service [29]. This allowed us to calculate plot-level indicators of potential impacts by insects and diseases, which were then summarized at scales relevant for conservation assessments. Additionally, we were able to detect geographic patterns of potential impacts [30] by forest insects and diseases in total, and within different agent groups, including those that are exotic and invasive.
The overall objective of this set of analyses was to identify regions at greater risk of significant ecological and economic impacts from forest diseases and insects, particularly for those that are exotic and invasive within the continental United States. This will allow for the selection of areas for finer-scale monitoring and analysis efforts relating to the impacts of forest pests, and potentially for management activities geared toward minimizing these impacts.

2. Materials and Methods

2.1. Insect and Disease Agents and Severity Ratings

Following a thorough literature review of more than 200 sources, we identified and documented as many as five of the most serious insect, disease and parasitic plant threats facing each of 419 tree species native to the conterminous United States and Alaska. Since our focus was on identifying the most important causes of mortality of mature trees, we excluded agents that primarily affect reproductive structures (e.g., fruits and flowers) or seedlings. The resulting list (Table S1) includes impactful agents regardless of whether they are exotic or native, as long as they are documented as potential threats to host tree species in North America, because both exotic and native insects and diseases are known to have important impacts on native trees. Insect and disease agents not yet in North America could seriously impact native tree species following long-distance transport through international trade [31], but we are unable to predict exactly which may threaten any particular tree species, so we did not include the possibility of future infestation by as-yet unestablished insect and disease agents in this study. We assigned a severity rating for each host/agent combination, with a rating of 10 given to those resulting in near complete mortality of all mature host trees (generally more than ~95 percent), or an inability to reproduce sexually as a result of the infestation; 9 to those resulting in near complete mortality in a congeneric host species [32]; 8 to those resulting in significant mortality of mature host trees (generally more than ~25 percent and less than ~95 percent); 5 to those causing moderate mortality of mature host trees (generally more than ~10 percent and less than ~25 percent); 3 to those resulting in more moderate mortality in association with other threats (such as drought stress) (generally more than ~1 percent and less than ~10 percent); and 1 to those causing minor mortality, generally to host trees that are already stressed (generally less than ~1 percent). In some cases, taxonomically related groups of tree species, such as genera or sub-generic sections, were considered hosts to an agent when the literature indicated this was the case, such as Armillaria root disease (Armillaria spp.) in Larix and Pinus; tent caterpillars (Malacosoma spp.) in Prunus; and oak wilt in oaks, with different severity levels for white oaks (section Quercus) and red oaks (section Lobatae). Twenty-two forest entomologists and pathologists, from across the geographic regions of the continental United States, reviewed the list of threats and the associated severity ratings. The severity data were adjusted as necessary following the review.
Taxonomy and nomenclature were sometimes challenging while assembling this list, especially for disease agents. When possible, we followed the nomenclature of Westcott’s Plant Disease Handbook [33] and a list of forest insect and disease agents maintained by the United States Forest Service’s Forest Health Protection program [34]. For host tree species for which we identified more than five serious agents, we ranked the agents by severity and then dropped those beyond the fifth with lower severity ratings. In only one case was a dropped agent rated as more severe than a 3; this single exception was Douglas-fir dwarf mistletoe (Arceuthobium douglasi Engelm.) for Douglas-fir, which had a severity of 5. When there were agents with severity rating ties, we tried to retain the agents affecting a broader geographic area.
When possible, we characterized each of the agents as non-native, native or of unknown/unresolved nativity, based on existing literature. We also divided the agents by taxon (insects, pathogens, or parasitic higher plants), and further divided the insects into three feeding guilds (foliage-feeders, phloem- or wood-borers, and sap-feeders) based on designations from Liebhold and others [20].
The foundation for the set of 419 host tree species in this assessment was the list of 362 native tree species inventoried by the national Forest Inventory and Analysis (FIA) program of the U.S. Forest Service [35] within the conterminous 48 United States and Alaska, excluding any of hybrid origin. FIA omits from its inventory list some tree species that are rare or highly limited in their distribution, so we expanded the list with an additional 57 species that are included in a series of U.S. Forest Service publications that outline the distributions of U.S. woody plants [36,37,38,39]. The additional species consistently meet the FIA definition of a tree as a woody perennial plant that generally has a single well-defined, self-supporting upright stem (not a vine) with a crown of foliage, and that has a height of at least 4.75 m at maturity and a stem diameter of at least 7.62 cm. Nomenclature and taxonomy for all 419 host tree species were based on the USDA PLANTS database [40].
We analyzed the composition of the list in several ways. We counted the number of individual agents and host/agent combinations, and determined the number of each within agent taxonomic group (insect, disease or parasitic plant), insect guild, and native or non-native status. We calculated the number of tree species that are hosts for each of the agent taxonomic groups and guilds, and for non-native insect and disease agents. We determined the number of host/agent combinations that involve, respectively, diseases, insects, and parasitic plants, and analyzed the severity of these combinations by taxonomic group, insect guild, and by whether the hosts are angiosperms or gymnosperms. We compared the severity of insect agents and disease agents, and the severity of agents affecting angiosperms and gymnosperms, using an exact two-sample Wilcoxon rank-sum test [41] conducted with the NPAR1WAY procedure in SAS 9.4 [42], with p-values generated by 10,000 Monte Carlo runs. We further calculated the number and mean severity of the combinations by host species family.

2.2. Geographic Patterns of Potential Forest Importance Value Loss

We assessed the potential ecological impact of important forest insects and diseases within a geospatial context by combining our list of agent severities with a spatially unbiased and relatively high intensity national inventory of forest plots. Specifically, we used tree occurrence data from 132,421 Forest Inventory and Analysis plots across the conterminous 48 States to calculate importance value at risk (IVAR) across the species located on each plot. (Because comparable FIA data are available for only a small part of Alaska, we were not able to include that State in this set of analyses.) This dataset encompassed approximately 3.5 million trees. The FIA program, which is administered by the U.S. Forest Service and is the principal source of information about the extent, condition, status and trends in United States forest resources across all ownerships [43], provides the most comprehensive forest database currently available [44]. It maintains a national network of permanent fixed-area forested plots (each approximately 0.067 hectares) on which inventory crews collect a wide variety of data using standardized protocols [35]. With a national sample intensity of approximately one plot per 2428 ha [29], it is an unparalleled source of forest information across the United States.
To determine the IVAR for each plot, we first calculated the importance value (IV) [45] for each species present on each FIA plot as the mean of the species’ abundance and basal area relative to the abundance and basal area of all the species on the plot (both therefore on a scale of 0 to 100). We then multiplied these IVs by each host species’ potential survivability associated with its set of insect and disease agents to generate a species-level survivability-weighted IV for the plot. These were summed across all the component species on the plot, with this number then subtracted from 100 to calculate the plot-level IVAR, as IVAR is the opposite of survivability.
Determining the potential survivability for each host species required assigning potential survivability to each of its insect and disease agents, as follows: near complete mortality of mature trees, 0.01; near complete mortality in a congeneric species, 0.1; significant mortality of mature trees, 0.25; moderate mortality of mature trees, 0.9; moderate mortality in association with other threats, 0.95; and minor mortality, usually of already-stressed trees, 0.99. These survivability values, one for each agent affecting the host, were then multiplied across the agents for each host species to generate the species’ overall predicted survivability that accounts for the potential for impacts from multiple pest agents. Where possible, we accounted for the geographic extent of exotic insect and disease agents by limiting their impacts to plots within the counties in which they have been confirmed to exist. This information was available from the Alien Forest Pest Explorer database [46] for 39 exotic insects and diseases included in our assessment, encompassing all of the most severe of these affecting native tree species. No comparable source was available for agents native to North America.
To assess the potential impacts of different agent groups, we separately calculated host tree survivability values associated with all agents, with the three main taxonomic groups (insects, diseases, and parasitic plants), with exotic insects only and with native insects only, and with insect feeding guilds (foliage-feeders, wood-borers, and sap-feeders). This information was then used to determine separate plot-level IVARs for each agent group, as explained above. To test the worst-case impact scenario relating to the 39 exotic agents with county-level occurrence data, we separately calculated plot-level IVAR under the assumption that these agents will be able to spread to the entirety of all the plots containing their host species, not just to the plots within the counties where the agents have been detected thus far. All plot-level results were aggregated to 834 km2 hexagonal cells (n = 6420) across the conterminous 48 states. These hexagons, which were derived from the North American hexagon coordinates of the Environmental Monitoring and Assessment Program (EMAP) [47], are of an area helpful for making management and monitoring decisions across broad scales [48]. Hexagons containing fewer than four FIA plots were not included in any analysis.
To identify areas with higher and lower than expected IVAR, we applied the spatial association of scalable hexagons (SASH) approach [48] separately across all agents, for exotic insects (two scenarios) and native insects only, for the three main taxonomic groups (insects, diseases, and parasitic plants), and for insect feeding guilds (foliage-feeders, wood-borers, and sap-feeders). The two exotic species scenarios were (1) limited to the counties in which the 39 species have currently been detected and (2) inclusive of all occurrences of the host species they infest (under the assumption, described above, that the agents will be able to spread throughout the distributions of their hosts). The SASH method uses equal-area hexagonal cells across a region of interest and a Getis-Ord (Gi*) hotspot analysis [49] in ArcMap® 10.3 [50] to identify locations with higher- or lower-than-expected values of an indicator. For this set of analyses, we determined the mean IVAR across the FIA plots in each of the 834 km2 hexagonal cells described above. The Gi* statistic is a standardized z-score with a mean of 0 and a standard deviation of 1, with values < −1.96 representing significant spatial clustering (p < 0.025) of lower mean plot-level survivability (and therefore higher IVAR scores, as these are the opposite of survivability) and values > 1.96 representing significant spatial clustering (p < 0.025) of higher survivability (and therefore lower plot-level IVAR scores). Gi* sums the differences between the mean values in a local sample, determined here by a moving window of each hexagon with its six immediate neighbors and 12 second-order neighbors, and the mean of all the forested hexagonal cells across the conterminous United States.

3. Results

3.1. Insect and Disease Agent Summary

We tallied 339 insect and disease agents (Table S2) affecting the 419 host tree species from the continental United States and Alaska, with a total of 1378 unique host-agent combinations (Table S1). The agents encompass 168 diseases, 151 insects, and 20 parasitic higher plants. Among the insect agents, 77 are phloem or wood-borers, 51 are foliage-feeders, and 23 are sap-feeders. Of the agents, 142 are confirmed as native and 55 as exotic, and 142 are either of unknown or disputed nativity. European gypsy moth (Lymantria dispar dispar L.) was the insect that had the most tree hosts (65), followed by Asian longhorned beetle (Anoplophora glabripennis Motschulsky) with 43, and twolined chestnut borer (Agrilus bilineatus Webster) with 31 (Table S2). All three are exotic invasives; forest tent caterpillar (Malacosoma disstria Hübner) was the native insect with the most hosts (28). Oak wilt (Bretziella fagacearum (Bretz) Z.W. de Beer, Marinc., T.A. Duong and M.J. Wingf.), another exotic agent, was the disease with the most tree hosts, having 61, followed by Hypoxylon canker of oak (Biscogniauxia atropunctata var. atropunctata (Schwein.) Pouzar) with 55, and Armillaria root disease (Armillaria spp.) with 35.
Fifteen host tree species had a maximum insect or disease agent severity of 10, six had a maximum severity of 9, 81 had a maximum severity of 8, 83 had a maximum severity of 5, 86 had a maximum severity of 3, and 104 species had a maximum severity of 1. Forty-four of the host species did not have any identified insect or disease agents. Approximately half of the host tree species (228 or 54 percent) were infested by at least one exotic insect or disease agent. Of these, 134 tree species were infested by two or more agents, 29 by three or more, and four by four agents (river birch [Betula nigra L.], Ozark and Allegheny chinquipin [Castanea ozarkensis Ashe and C. pumila Mill.], and black willow [Salix nigra Marshall]). The mean number of exotic agents per host species was just under 1 (0.95). Nearly as many of the host tree species, 317, were affected by at least one insect agent as were affected by one or more disease agent, 337. Sixty-eight, meanwhile, had a parasitic plant agent. More than half of host species, 224, were impacted by a phloem or wood-borer. Meanwhile, 178 had foliage-feeding and 83 had sap-feeding insect agents.
Of the 1378 host/agent combinations, 709 (51.5 percent) involved diseases, 601 (43.6 percent) involved insects, and 68 (4.9 percent) involved parasitic plants. The diseases were the most severe on average (2.65 on a scale of 1 to 10), compared to 2.44 for insects and 2.12 for parasitic plants. Of the 15 host/agent combinations with the highest severity (10), seven each involved an insect or a disease, and one was an interacting complex of an insect and a disease (laurel wilt/redbay ambrosia beetle). Among the 601 host/insect combinations, the 295 phloem- and wood-borers were the most severe (3.27), compared to the 2.26 for the 93 sap-feeders and 1.96 for the 213 foliage-feeders. Only 396 of the host/agent combinations involved agents known to be exotic; these had an average severity of 4.02, while the 544 combinations involving known native agents had an average severity of 2.19. Approximately two-thirds (261) of the 396 host/exotic agent combinations included insects, but the severity of the 135 disease agents was significantly higher (mean of 5.68 vs. 3.16) when compared using an exact two-sample Wilcoxon rank-sum test. Among the host/agent combinations that included exotic insects, the most severe on average were the 85 involving phloem- or wood borers (4.72), followed by the 71 involving sap-feeders (2.54), and the 105 involving foliage-feeders (2.31).
More than two-thirds (962) of the host/agent combinations involved angiosperm species, with therefore less than one-third (416) involving gymnosperms. The severity of the gymnosperm/agent combinations, however, was significantly higher (mean 2.75 vs. 2.41) according to an exact two-sample Wilcoxon rank-sum test. At the same time, approximately 84 percent of the 396 exotic host/agent combinations involved an angiosperm species, with a significantly higher mean severity than for gymnosperms (4.14 vs. 3.39).
Among host families, Pinaceae encompassed the most species affected by any insect or disease agent (68), followed by Fagaceae (65), Cupressaceae (33), and Rosaceae (30) (Table 1). For exotic agents, however, Fagaceae had the most affected hosts (65), with Pinaceae second (30), Sapindaceae third (19), and Salicaceae fourth (18). The same families had the most host/agent combinations, though in a different order, both for all agents (Pinaceae (307), Fagaceae (281), Rosaceae (111), and Cupressaceae (103)) and for exotic agents (Fagaceae (124), Salicaceae (41), Pinaceae (40), and Sapindaceae (35)). Not surprisingly, these are the families encompassing the most tree species in North America, all of which are geographically widespread. The mean severity of host/agent combinations by family followed a different pattern, however. The families with the highest mean severity across all agents (and having more than five total combinations) were Ulmaceae (4.77), Oleaceae (4.23), Pinaceae (3.12), and Fagaceae (3.11). For exotics, these families were Oleaceae (5.97), Fagaceae (5.13), Ulmaceae (4.93), and Sapindaceae (4.51).

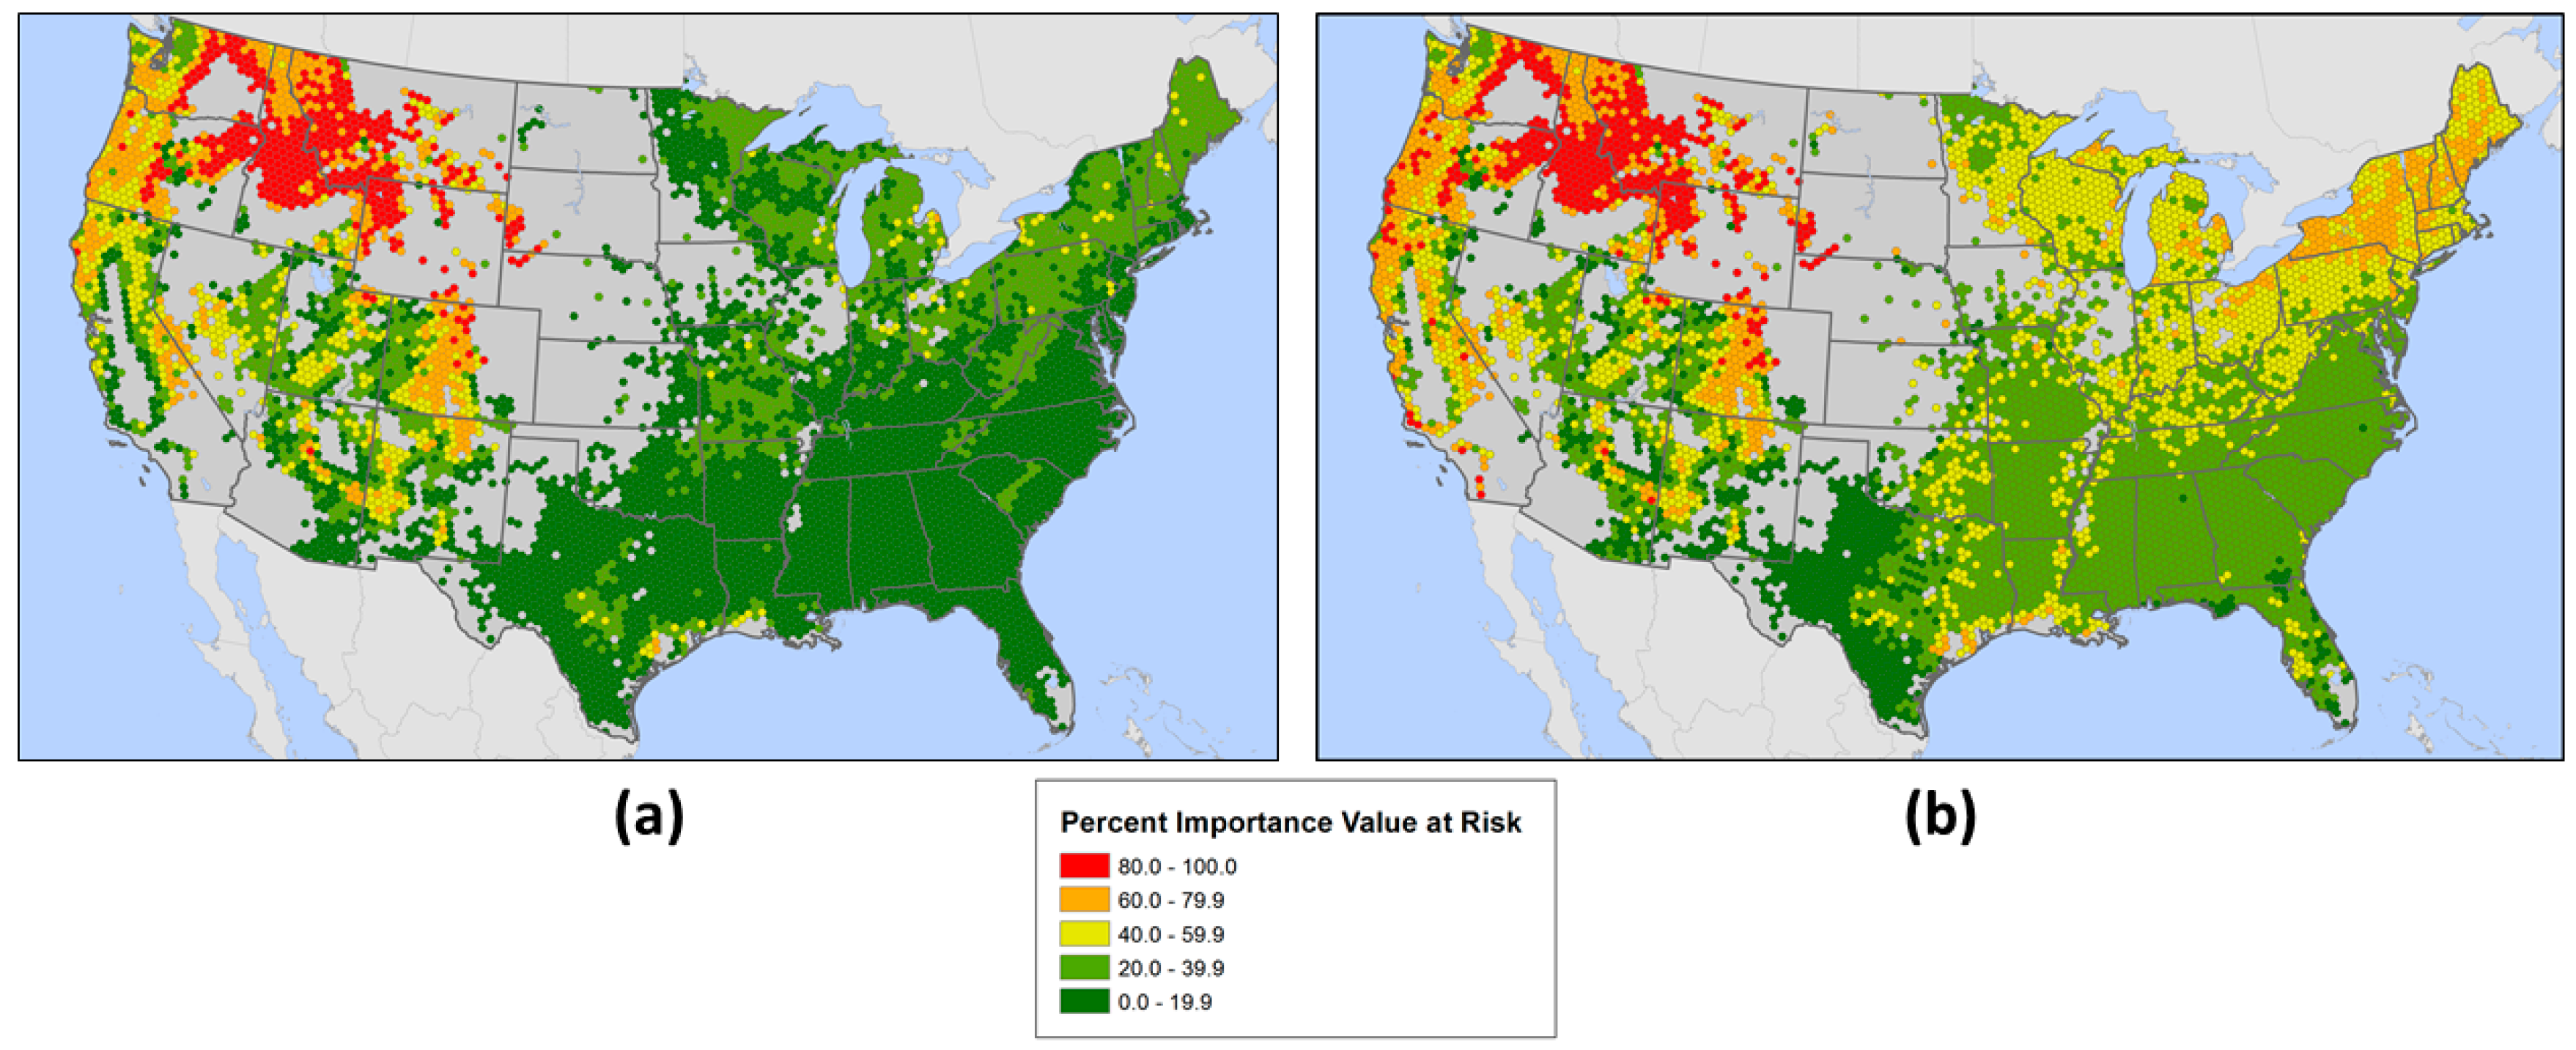
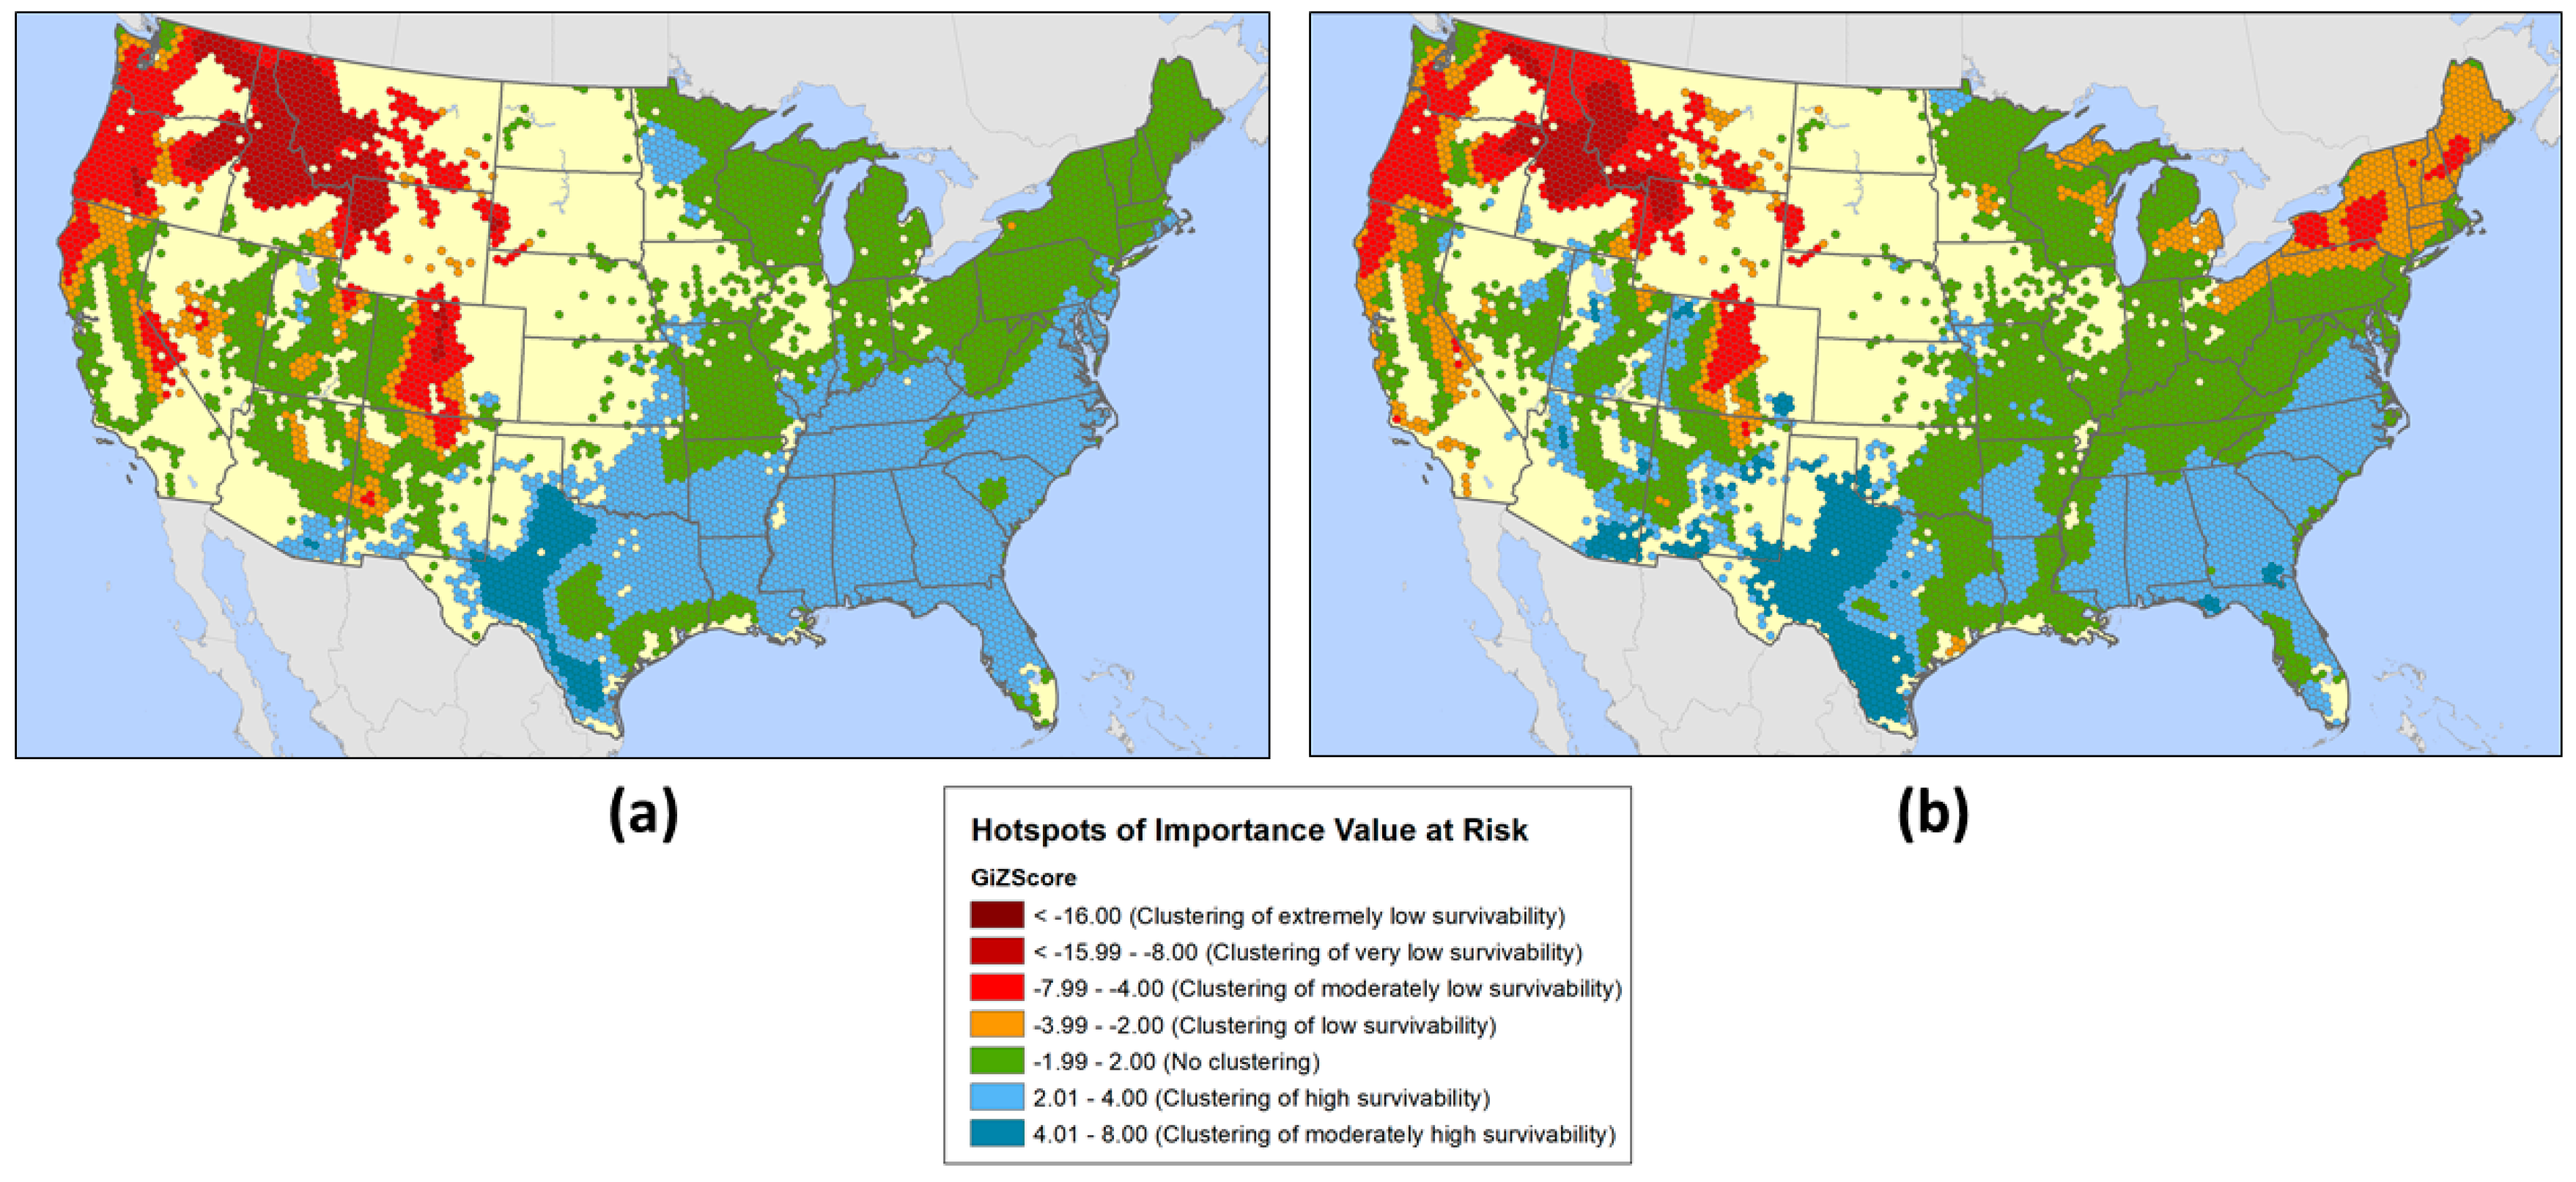
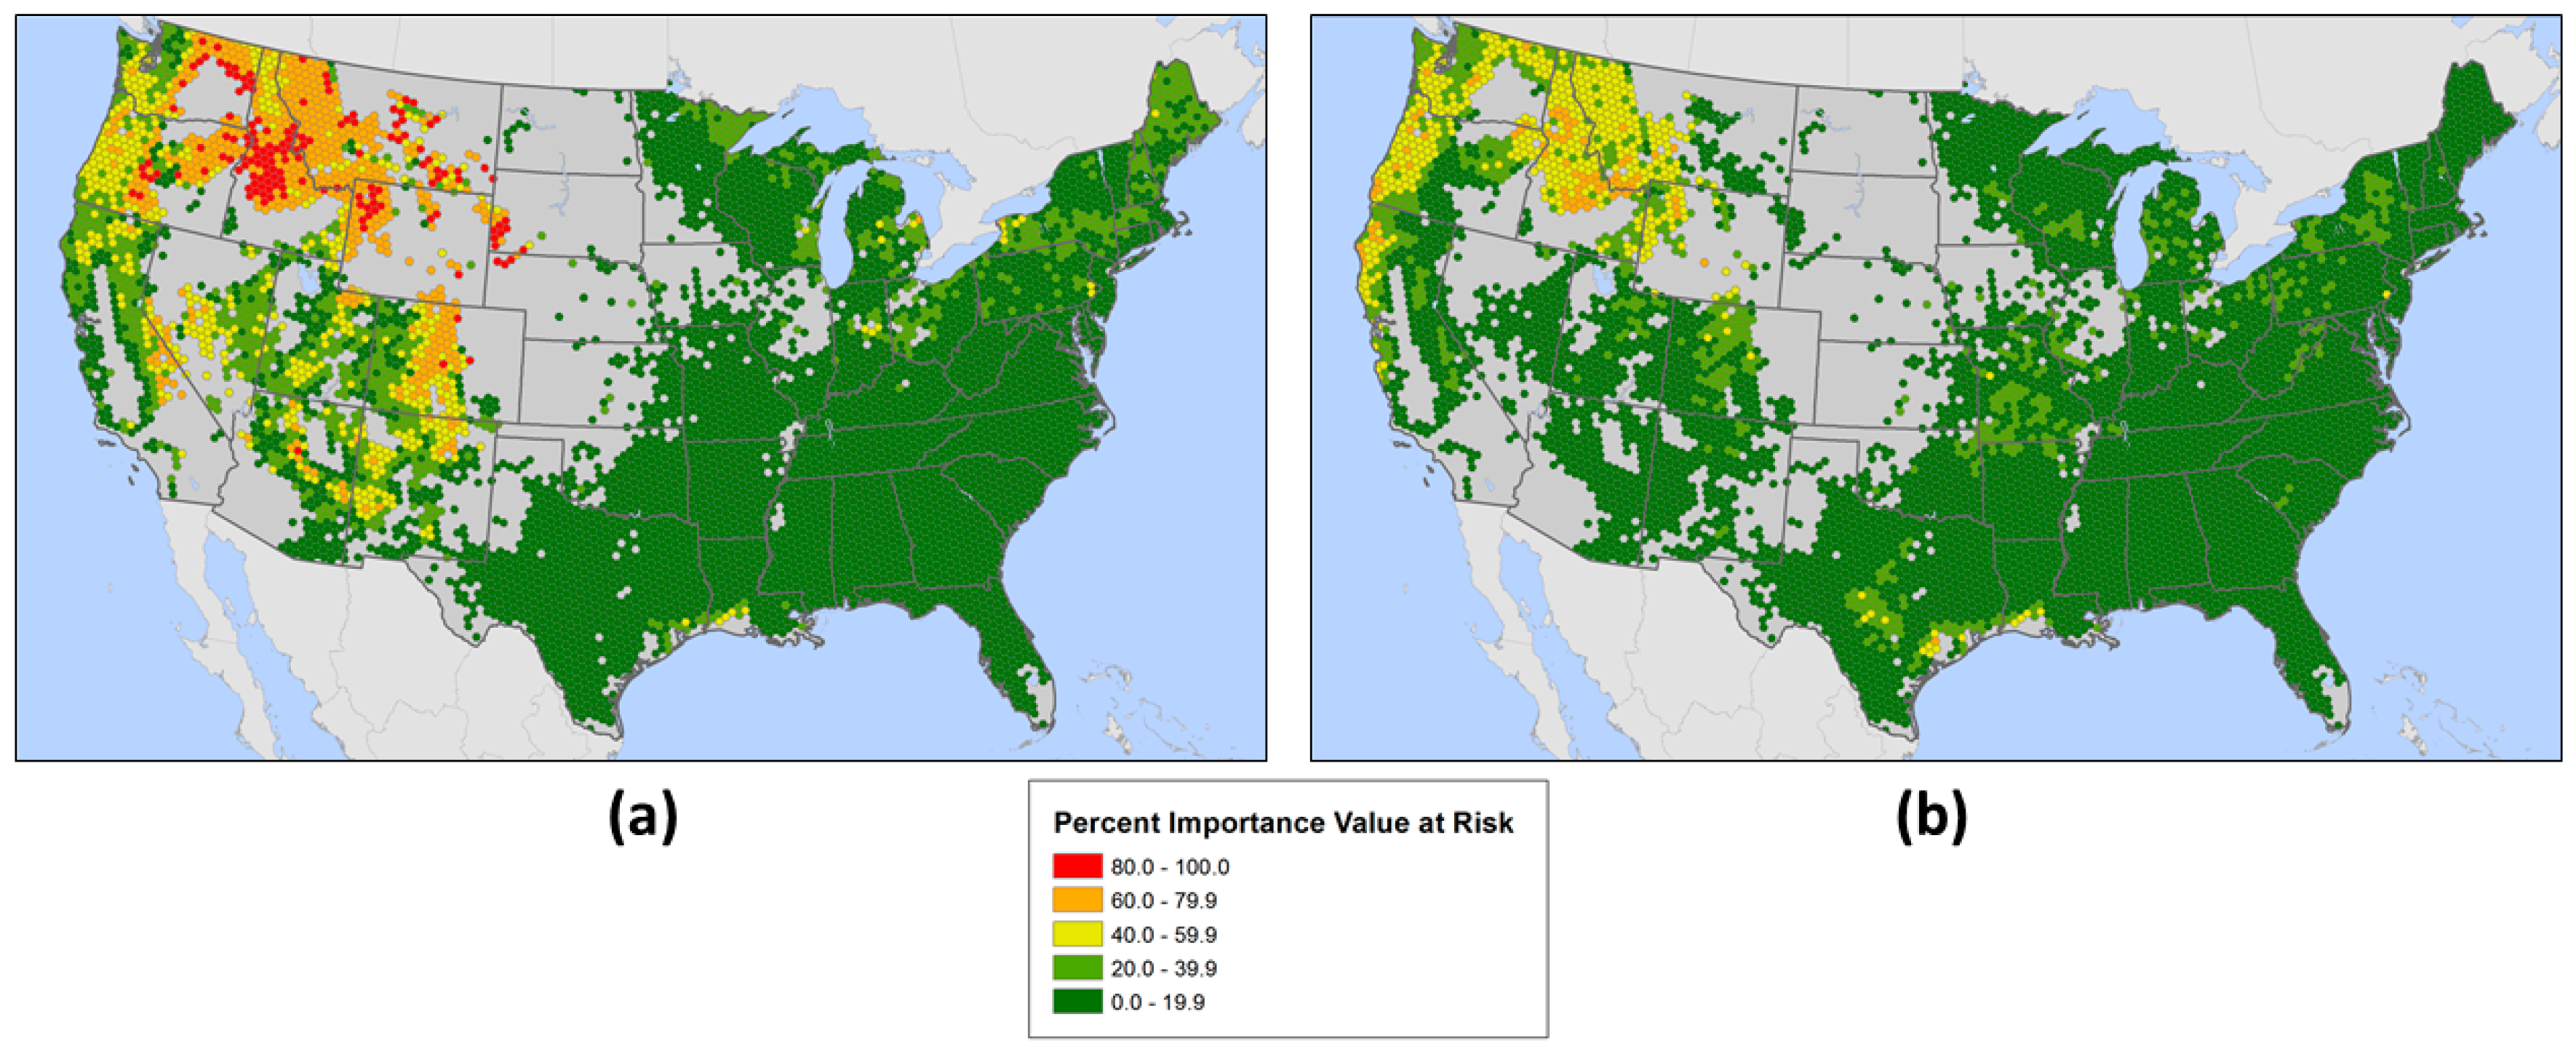
3.2. Geographic Patterns of Potential Insect and Disease Impacts

We conducted a series of geographic analyses of the potential impacts of insect and disease agents across the conterminous 48 States (excluding Alaska because of data limitations). When assessing the potential impacts of all insect and disease agents together, and exotic agents limited to their current extent, plot-level percent IVAR tended to be the highest in the northern Rocky Mountain region, with moderate values widespread throughout the West and in scattered locations in the East (Figure 1a). When assuming exotic agents will be able to reach the entirety of their host tree species ranges, the potential impacts in the eastern United States increased, particularly in the Northeast (Figure 1b). Correspondingly, geographic hotspots of high IVAR were limited entirely to the West in the first scenario (Figure 2a), while hotspots of high IVAR also appeared in the Northeast and Great Lakes States in the second scenario (Figure 2b). IVAR coldspots were found consistently throughout the Southeastern part of the United States in both scenarios, and in parts of the interior West in the second scenario.
The potential impacts of insects (Figure 3a) were somewhat greater and more widespread than for diseases (Figure 3b), though both tended to be higher in the West than in the East. The greatest potential impacts of insects were located in the northern Rocky Mountain region, with scattered additional locations throughout the West. The greatest potential impacts of diseases were mostly limited to the Northwest and Texas. Geographic hotspots of high IVAR values were consistent with these results, while hotspots of low IVAR values were widespread across the Southeast and scattered in the North for both insects and diseases, with additional areas in the southern Rocky Mountains for diseases (Figure S1).
The potential impacts of native insects were considerably higher and more widespread than for exotic insects, with native insects having the greatest potential impact throughout much of the West and exotic insects limited mostly to the Northeast, the Gulf Coast of Texas and Louisiana, and locations in the northern Rocky Mountains (Figure S2). The hotspot analyses highlight these geographic differences (Figure 4). Among insect guilds, wood-borers were associated with the highest potential impact, located throughout much of the West, while the potential impacts from sap-feeders and foliage-feeders were much lower (Figure S3). Hotspots of high potential impacts from wood-borers were detected throughout much of the Northwest and Rocky Mountains; sap-feeder hotspots were isolated to the Northeast, northern Rocky Mountains and Gulf Coast; and foliage-feeder hotspots were detected around the Great Lakes, parts of the Northeast, along the Gulf Coast, and in the Northwest (Figure S4).

4. Discussion

Insect and disease agents have significant and extensive impacts on the ecological and economic services provided by North American forests. Invasive insects and diseases, in particular, extensively damage the biodiversity, ecology and economy of affected areas [51,52,53]. In an effort to characterize the impacts of pests on the forests of the continental United States, we identified the most important insect and disease agents affecting 419 native North American tree species and then mapped their potential impacts on forest ecosystems. We found that slightly more than half of the host tree species (228) are infested by an exotic pest, and that the average severity of host tree interactions with these invasive species was considerably greater than for native pests. About 80 percent of tree species are affected by at least one disease agent and 75 percent by an insect, with diseases having more severe impacts on average. Among insects, phloem- or wood-borers have the most widespread and severe impacts across host species, impacting more than half. Within a geospatial context, we detected markedly different patterns of potential impacts for exotic versus native insects, and for insects compared to diseases. We also identified notable regional differences, with high potential impacts on the less-diverse forests of the West, mainly by native insect and disease agents. Meanwhile, non-native agents are likely to have a greater impact in the East, where their potential impacts could expand dramatically if they are able to infest the entirety of their hosts’ ranges in this part of the country.
Assembling information about the severity of insect and disease agents with the greatest impacts on native host tree species is an important step in conservation decision-making relating to those tree species. Specifically, these data represent essential inputs in analyses to characterize and prioritize the vulnerability of native tree species to one of the principal threats to their long-term persistence on the landscape. Such an assessment, which accounts for the sensitivity and adaptive capacity of the host species as well as their exposure to the threat [54], was recently completed to categorize the vulnerability of 339 native United States tree species to climate change [28]. An assessment focused on the insect and disease threats to tree species in the region could identify and prioritize the species facing the most dramatic reductions in population size as a result of their sensitivity and lack of adaptive capacity to an insect or disease epidemic. These native tree species are likely candidates for intra and inter-specific resistance breeding efforts, and for efforts to identify resistance genes for introduction into the most highly threatened host tree species [55]. These are likely to include species in families with the highest mean severities to exotic insects and diseases: Oleaceae (particularly ashes [Fraxinus]), Fagaceae (including chestnuts [Castanea], oaks [Quercus] and beech [Fagus]), and Ulmaceae (especially elms [Ulmus]).
When combined with forest inventory datasets, as in this set of analyses, the host tree/agent severity information additionally can provide the foundation for regional assessments of the potential impacts associated with insect and disease agents. We have done this in a relatively straightforward fashion, but more complex analyses could intersect both the insect and disease severity data and the FIA data with aerially collected spatial locations of forest insect and disease damage [56] to estimate the recent loss of plot-level importance value or tree basal area. Such snapshots, as well as projections of future conditions, may be useful for regular national renewable forest resources reporting efforts including the Resources Planning Act (RPA) Assessment [57,58] and the National Report on Sustainable Forests [59,60]. A central objective of these reports is to assess the degree to which the 304 million hectares of forest in the United States [61] are able to continue to meet their capacity to provide a broad range of goods and services to current and future generations, to safeguard biological diversity, and to contribute to the resilience of ecosystems and economies [59].
The results of the current spatial assessment of potential forest impacts strongly delineates U.S. regional differences in the types and extent of impacts from insect and disease agents. The forests of the eastern United States, particularly the Northeast, host the highest diversity of pests [62], but the forests of the West appear to be more impacted by their relatively smaller suite of insect and disease agents because of the lower diversity of forests in this region (Figure 1 and Figure 3). In recent years, for example, a mountain pine beetle (Dendroctonus ponderosae Hopkins) epidemic has resulted in between 0.5 and 5.4 million ha of mortality in the western conterminous United States, which will have long-term ecological effects on these forests [63]. This native bark beetle generally persists in low levels until favorable weather conditions increase larval survival and allow populations to escape local regulation, attain very high densities and spread to nearby areas; local increases in population and migration act together to create widespread epidemic populations [64,65] that can affect most pine species in the region [66]. Given the native status of many of the most severe insect and disease agents affecting western U.S. forests, managers, pathologists and entomologists face the challenge of distinguishing between natural and excessive levels of mortality, a task often informed by ecologically-based or commodity-based management objectives [67]. In fact, the changes in forest structure and function, species succession and biodiversity caused by insects and diseases may be considered either negative or positive depending on management goals [68]. As an additional complicating factor for making decisions about the management of forests, changing climate conditions are expected to affect the ways in which native disease and insect agents disturb North American forests by altering the spatial distribution and abundance of these pests, as well as the ability of trees to protect themselves [69,70].
The forests of the East, meanwhile, have greater exposure to non-native pest species, particularly insects, than do the forests of the West (Figure S2, Figure 4). The impact of the existing exotic insects and diseases could intensify markedly across much of the East in coming decades as these agents spread to infest susceptible hosts that they have yet to reach. While these existing exotic insects and diseases are already seriously imperiling the integrity of natural, urban and plantation forest ecosystems and the services they provide [71], it is essential to underscore that newly introduced diseases and insects are almost certain to add to the existing impacts on native trees and forests. The historical establishment rate of approximately 2.5 non-native forest insect or disease agents per year into the United States, with about 14 percent of agents causing apparent damage to trees [72], may continue more or less unabated [73]. Policies are in place to prevent the accidental importation of non-native forest pests, but extensive international trade is likely to result in many additional establishments, including some causing negative ecological and economic impacts [1]. In fact, Aukema et al. [74] in 2011 estimated a 32 percent chance that another highly destructive borer species would invade the United States by 2022, joining emerald ash borer and Asian longhorned beetle, among others. Thus, the predicted forest impacts we report here may represent only a base level of potential future effects as new insect and disease agents are established in and spread across the United States. It would be prudent, therefore, to regularly update information on both the identity and severity of the most important insect and disease agents affecting U.S. tree species, and to reassess the potential forest impacts of these pests.
Additional future work should move beyond this single snapshot in time to project potential future impacts to forests by incorporating tree mortality from pest agents, along with regeneration, growth and succession, into simulations of forest composition structure [75]. Such models could also integrate changing climate conditions and forest management options [76,77] and could account for the arrival, spread and survival of invasive pest species into uninvaded areas [78]. At broad scales, the results could be particularly informative to future species-level conservation assessments of species most vulnerable to a variety of threats to their persistence. At finer scales, they could help guide specific management strategies needed to achieve particular objectives, such as carbon sequestration or biodiversity maintenance or harvest for dimension-wood or pulp.

5. Conclusions

We identified the most serious insect and disease threats to each of 419 tree species native to the conterminous 48 United States. This list encompasses 339 distinct agents and 1378 tree host and insect/disease combinations. The numbers of disease and insect agents were similar (170 and 150, respectively, along with 20 parasitic plants), with at least 55 of these being exotic species introduced to North America. On average, diseases were more severe than insect pests, and exotic agents were more severe than native ones. Phloem- and wood-borers were the most severe exotic insects.
By combining the information from this list with a national-scale, spatially unbiased forest inventory, we were able to assess the potential ecological impacts of important forest insects and diseases within a geospatial context. Specifically, we calculated estimates of importance value at risk (IVAR) separately across all agents, for the three taxonomic groups (insects, diseases, and parasitic plants), for exotic versus native insects, and for insect feeding guilds. We found that, in general, the potential impacts of insects and diseases were greater in the West, which has both fewer pest agents and fewer native tree species. At the same time, the potential impact of exotic invasive agents was greater in the East and, in fact, could intensify across the region if these agents are able to infest the entire ranges of their susceptible hosts. Such broad-scale assessments, which include results relevant to finer-scale decision-making, offer a useful approach for identifying geographic areas where monitoring and management activities are most needed and potentially most effective. These findings, however, are not able to account for the introduction of future damaging insect and disease agents via international trade, and only encompass the most serious pests affecting mature trees of the forest tree species native to North America. The results therefore may represent an underestimate of the potential impacts of forest pests, particularly in the future. Comprehensive assessments of ecological risk impacts to the forests of the United States should incorporate predictions of possible insect and disease effects, similar to those described here, along with the predicted impacts of other important threats including climate change, wildfire, and competition by non-native invasive plants.

Supplementary Materials

The following are available online at https://www.mdpi.com/1999-4907/10/4/304/s1, Figure S1: Hotspots of Importance Value at Risk (IVAR) for plots within 834 km2 hexagons, encompassing both native and exotic insect and disease agents, for (a) insect agents and (b) disease agents, Figure S2: Mean percent host tree Importance Value at Risk (IVAR) for plots within 834 km2 hexagons, encompassing insect agents, for (a) native insects and (b) exotic insects, Figure S3: Mean percent host tree Importance Value at Risk (IVAR) for plots within 834 km2 hexagons, encompassing insect agents, for (a) phloem- or wood-borers, (b) sap-feeders, and (c) foliage-feeders, Figure S4: Hotspots of Importance Value at Risk (IVAR) for plots within 834 km2 hexagons, encompassing insect agents, for (a) phloem- or wood-borers, (b) sap-feeders, and (c) foliage-feeders. Table S1: The most serious insect, disease, and parasitic plant agents for each of 419 tree species native to the conterminous United States, up to five per species, Table S2: The 339 insect, disease, and parasitic higher plant agents identified as among the most important threats to each of 419 North American tree species.

Author Contributions

K.M.P. conceived of the research, assisted in data collection, performed data analyses and drafted the manuscript. M.E.E. identified pest agents and determined severity ratings for each pest/host combination, and assisted in drafting the manuscript. R.M.J. assisted in data analyses and in drafting the manuscript. G.M. coordinated the review of the host/agent list by forest entomologists and pathologists, and assisted in drafting the manuscript.

Funding

This work was supported by in part through Research Joint Venture Agreement 13-JV-11330110-072 and Cost Share Agreement 18-CS-11330110-026 between the U.S. Department of Agriculture, Forest Service, Southern Research Station, and North Carolina State University, and by NSF Macrosystems Biology grant DEB-1638702.

Acknowledgments

We are grateful for the time and effort by 21 entomologists and pathologists who reviewed the host-agent list and severity ratings: Chris Asaro, Darren Blackford, Robert Cain, Philip Cannon, Tom Coleman, David Coyle, Blakey Lockman, Gregg DeNitto, Andrew Graves, John Guyon, Marcus Jackson, Jennifer Koch, James Meeker, Bruce Moltzan, John Nowak, Robert Rabaglia, Iral Ragenovich, Karen Ripley, Lia Spiegel, Brytten Steed, and James Worrall. (Robert Jetton, a coauthor of this paper, was the 22nd list reviewer.) We also appreciate the constructive criticism of three anonymous reviewers.

Conflicts of Interest

The authors declare no conflict of interest.

References

  1. Lovett, G.M.; Weiss, M.; Liebhold, A.M.; Holmes, T.P.; Leung, B.; Lambert, K.F.; Orwig, D.A.; Campbell, F.T.; Rosenthal, J.; McCullough, D.G.; et al. Nonnative forest insects and pathogens in the United States: Impacts and policy options. Ecol. Appl. 2016, 26, 1437–1455. [Google Scholar] [CrossRef] [PubMed] [Green Version]
  2. Tobin, P.C. Ecological Consequences of Pathogen and Insect Invasions. Curr. For. Rep. 2015, 1, 25–32. [Google Scholar] [CrossRef]
  3. Logan, J.A.; Regniere, J.; Powell, J.A. Assessing the impacts of global warming on forest pest dynamics. Front. Ecol. Environ. 2003, 1, 130–137. [Google Scholar] [CrossRef]
  4. Krist, F.J.; Ellenwood, J.R.; Woods, M.H.; McMahan, A.J.; Cowardin, J.P.; Ryerson, D.E.; Sapio, F.J.; Zweifler, M.O.; Romero, S.A. 2013–2027 National Insect and Disease Forest Risk Assessment; United States Department of Agriculture, Forest Service, Forest Health Technology Enterprise Team: Washington, DC, USA, 2014; p. 199.
  5. Teale, S.A.; Castello, J.D. The past as key to the future: A new perspective on forest health. In Forest Health: An Integrated Perspective; Castello, J.D., Teale, S.A., Eds.; Cambridge University Press: New York, NY, USA, 2011; pp. 3–16. [Google Scholar]
  6. Zhang, L.; Rubin, B.D.; Manion, P.D. Mortality: The essence of a healthy forest. In Forest Health: An Integrated Perspective; Castello, J.D., Teale, S.A., Eds.; Cambridge University Press: New York, NY, USA, 2011; pp. 17–49. [Google Scholar]
  7. Vorster, A.G.; Evangelista, P.H.; Stohlgren, T.J.; Kumar, S.; Rhoades, C.C.; Hubbard, R.M.; Cheng, A.S.; Elder, K. Severity of a mountain pine beetle outbreak across a range of stand conditions in Fraser Experimental Forest, Colorado, United States. For. Ecol. Manag. 2017, 389, 116–126. [Google Scholar] [CrossRef]
  8. Johnson, T.N.; Buskirk, S.W.; Hayward, G.D.; Raphael, M.G. Tree mortality after synchronized forest insect outbreaks: Effects of tree species, bole diameter, and cutting history. For. Ecol. Manag. 2014, 319, 10–17. [Google Scholar] [CrossRef]
  9. Windmuller-Campione, M.A.; Page, D.H.; Long, J.N. Does the practice of silviculture build resilience to the spruce beetle? A case study of treated and untreated spruce-fir stands in Northern Utah. J. For. 2017, 115, 559–567. [Google Scholar] [CrossRef]
  10. Dukes, J.S.; Pontius, J.; Orwig, D.; Garnas, J.R.; Rodgers, V.L.; Brazee, N.; Cooke, B.; Theoharides, K.A.; Stange, E.E.; Harrington, R.; et al. Responses of insect pests, pathogens, and invasive plant species to climate change in the forests of northeastern North America: What can we predict? Can. J. For. Res. 2009, 39, 231–248. [Google Scholar] [CrossRef]
  11. Sturrock, R.N.; Frankel, S.J.; Brown, A.V.; Hennon, P.E.; Kliejunas, J.T.; Lewis, K.J.; Worrall, J.J.; Woods, A.J. Climate change and forest diseases. Plant Pathol. 2011, 60, 133–149. [Google Scholar] [CrossRef] [Green Version]
  12. Parry, D.; Teale, S.A. Alien invasions: The effects of introduced species on forest structure and function. In Forest Health: An Integrated Perspective; Castello, J.D., Teale, S.A., Eds.; Cambridge University Press: New York, NY, USA, 2011; pp. 115–162. [Google Scholar]
  13. Gandhi, K.J.K.; Herms, D.A. Direct and indirect effects of alien insect herbivores on ecological processes and interactions in forests of eastern North America. Biol. Invasions 2010, 12, 389–405. [Google Scholar] [CrossRef]
  14. Loo, J. Ecological impacts of non-indigenous invasive fungi as forest pathogens. Biol. Invasions 2009, 11, 81–96. [Google Scholar] [CrossRef]
  15. Havill, N.P.; Montgomery, M.E.; Keena, M.A. Hemlock woolly adelgid and its hemlock hosts: A global perspective. In Implementation and Status of Biological Control of the Hemlock Woolly Adelgid; Onken, B., Reardon, R., Eds.; U.S. Forest Service, Forest Health Technology Enterprise Team: Morgantown, WV, USA, 2011; Volume FHTET-2011-04, pp. 3–14. [Google Scholar]
  16. Klooster, W.S.; Gandhi, K.J.K.; Long, L.C.; Perry, K.I.; Rice, K.B.; Herms, D.A. Ecological impacts of emerald ash borer in forests at the epicenter of the invasion in North America. Forests 2018, 9, 250. [Google Scholar] [CrossRef]
  17. Hughes, M.A.; Riggins, J.J.; Koch, F.H.; Cognato, A.I.; Anderson, C.; Formby, J.P.; Dreaden, T.J.; Ploetz, R.C.; Smith, J.A. No rest for the laurels: symbiotic invaders cause unprecedented damage to southern USA forests. Biol. Invasions 2017, 19, 2143–2157. [Google Scholar] [CrossRef]
  18. Castello, J.D.; Leopold, D.J.; Smallidge, P.J. Pathogens, patterns, and processes in forest ecosystems. Bioscience 1995, 45, 16–24. [Google Scholar] [CrossRef]
  19. Potter, K.M.; Paschke, J.L. Large-scale patterns of insect and disease activity in the conterminous United States, Alaska, and Hawaii from the national insect and disease survey, 2015. In Forest Health Monitoring: National Status, Trends and Analysis, 2016; Potter, K.M., Conkling, B.L., Eds.; General Technical Report SRS-222; United States Department of Agriculture, Forest Service, Southern Research Station: Asheville, NC, USA, 2017; pp. 21–42. [Google Scholar]
  20. Liebhold, A.M.; McCullough, D.G.; Blackburn, L.M.; Frankel, S.J.; Von Holle, B.; Aukema, J.E. A highly aggregated geographical distribution of forest pest invasions in the USA. Divers. Distrib. 2013, 19, 1208–1216. [Google Scholar] [CrossRef]
  21. Holdenrieder, O.; Pautasso, M.; Weisberg, P.J.; Lonsdale, D. Tree diseases and landscape processes: The challenge of landscape pathology. Trends Ecol. Evol. 2004, 19, 446–452. [Google Scholar] [CrossRef] [PubMed]
  22. Early, R.; Bradley, B.A.; Dukes, J.S.; Lawler, J.J.; Olden, J.D.; Blumenthal, D.M.; Gonzalez, P.; Grosholz, E.D.; Ibanez, I.; Miller, L.P.; et al. Global threats from invasive alien species in the twenty-first century and national response capacities. Nat. Commun. 2016, 7, 9. [Google Scholar] [CrossRef] [PubMed]
  23. Yemshanov, D.; Koch, F.H.; McKenney, D.W.; Downing, M.C.; Sapio, F. Mapping Invasive Species Risks with Stochastic Models: A Cross-Border United States-Canada Application for Sirex noctilio Fabricius. Risk Anal. 2009, 29, 868–884. [Google Scholar] [CrossRef] [PubMed]
  24. Shatz, A.J.; Rogan, J.; Sangermano, F.; Miller, J.; Elmes, A. Modeling the risk of spread and establishment for Asian longhorned beetle (Anoplophora glabripennis) in Massachusetts from 2008–2009. Geocarto Int. 2016, 31, 813–831. [Google Scholar] [CrossRef]
  25. Vaclavik, T.; Kanaskie, A.; Hansen, E.M.; Ohmann, J.L.; Meentemeyer, R.K. Predicting potential and actual distribution of sudden oak death in Oregon: Prioritizing landscape contexts for early detection and eradication of disease outbreaks. For. Ecol. Manag. 2010, 260, 1026–1035. [Google Scholar] [CrossRef]
  26. Trotter, R.T.; Morin, R.S.; Oswalt, S.N.; Liebhold, A. Changes in the regional abundance of hemlock associated with the invasion of hemlock woolly adelgid (Adelges tsugae Annand). Biol. Invasions 2013, 15, 2667–2679. [Google Scholar] [CrossRef]
  27. Morin, R.S.; Liebhold, A.M.; Pugh, S.A.; Crocker, S.J. Regional assessment of emerald ash borer, Agrilus planipennis, impacts in forests of the Eastern United States. Biol. Invasions 2017, 19, 703–711. [Google Scholar] [CrossRef]
  28. Potter, K.M.; Crane, B.S.; Hargrove, W.W. A United States national prioritization framework for tree species vulnerability to climate change. New For. 2017, 48, 275–300. [Google Scholar] [CrossRef]
  29. Bechtold, W.A.; Patterson, P.L. The Enhanced Forest Inventory and Analysis Program: National Sampling Design and Estimation Procedures; Gen. Tech. Rep. SRS-80; USDA Forest Service, Southern Research Station: Asheville, NC, USA, 2005; 85p.
  30. Potter, K.M. Do United States protected areas effectively conserve forest tree rarity and evolutionary distinctiveness? Biol. Conserv. 2018, 224, 34–46. [Google Scholar] [CrossRef]
  31. Leung, B.; Springborn, M.R.; Turner, J.A.; Brockerhoff, E.G. Pathway-level risk analysis: The net present value of an invasive species policy in the US. Front. Ecol. Environ. 2014, 12, 273–279. [Google Scholar] [CrossRef]
  32. Gilbert, G.S.; Webb, C.O. Phylogenetic signal in plant pathogen-host range. Proc. Natl. Acad. Sci. USA 2007, 104, 4979–4983. [Google Scholar] [CrossRef]
  33. Horst, R.K. Westcott’s Plant Disease Handbook, 8th ed.; Springer: Dordrecht, The Netherlands, 2013; 826p. [Google Scholar]
  34. United States Department of Agriculture Forest Health Protection. Damage Causing Agent (DCA) List. Available online: https://www.fs.fed.us/foresthealth/applied-sciences/mapping-reporting/gis-spatial-analysis/digital-mobile-sketch-mapping.shtml (accessed on 13 November 2018).
  35. Woudenberg, S.W.; Conkling, B.L.; O’Connell, B.M.; LaPoint, E.B.; Turner, J.A.; Waddell, K.L. The Forest Inventory and Analysis Database: Database Description and Users Manual Version 4.0 for Phase 2; USDA Forest Service, Rocky Mountain Research Station: Fort Collins, CO, USA, 2010; 336p.
  36. Little, E.L. Atlas of United States Trees. Volume 1. Conifers and Important Hardwoods; United States Department of Agriculture Forest Service: Washington, DC, USA, 1971; 9p, 200 maps.
  37. Viereck, L.A.; Little, E.L. Atlas of United States Trees. Volume 2. Alaska Trees and Common Shrubs; United States Department of Agriculture Forest Service: Washington, DC, USA, 1975; 19p, 105 maps.
  38. Little, E.L. Atlas of United States Trees. Volume 3. Minor Western Hardwoods; United States Department of Agriculture Forest Service: Washington, DC, USA, 1976; 13p, 290 maps.
  39. Little, E.L. Atlas of United States Trees. Volume 4. Minor Eastern Hardwoods; United States Department of Agriculture Forest Service: Washington, DC, USA, 1976; 17p, 230 maps.
  40. U.S. Department of Agriculture Natural Resource Conservation Service. The PLANTS Database. Available online: http://plants.usda.gov (accessed on 1 March 2019).
  41. Conover, W.J. Practical Nonparametric Stastics; John Wiley & Sons, Inc.: New York, NY, USA, 1971; 462p. [Google Scholar]
  42. SAS Institute Inc. The SAS System for Windows, Version 9.4; SAS Institute Inc.: Cary, NC, USA, 2013. [Google Scholar]
  43. Smith, W.B. Forest inventory and analysis: a national inventory and monitoring program. Environ. Pollut. 2002, 116, S233–S242. [Google Scholar] [CrossRef]
  44. Tinkham, W.T.; Mahoney, P.R.; Hudak, A.T.; Domke, G.M.; Falkowski, M.J.; Woodall, C.W.; Smith, A.M.S. Applications of the United States Forest Inventory and Analysis dataset: A review and future directions. Can. J. For. Res. 2018, 48, 1251–1268. [Google Scholar] [CrossRef]
  45. Smith, R.L.; Smith, T.M. Ecology and Field Biology, 6th ed.; Addison Wesley Longman: San Francisco, CA, USA, 2001; 771p. [Google Scholar]
  46. United States Department of Agriculture Forest Service. Alien Forest Pest Explorer Database. Available online: https://www.nrs.fs.fed.us/tools/afpe (accessed on 25 June 2018).
  47. White, D.; Kimerling, A.J.; Overton, W.S. Cartographic and geometric components of a global sampling design for environmental monitoring. Cartog. Geogr. Inf. 1992, 19, 5–22. [Google Scholar] [CrossRef]
  48. Potter, K.M.; Koch, F.H.; Oswalt, C.M.; Iannone, B.V. Data, data everywhere: Detecting spatial patterns in fine-scale ecological information collected across a continent. Landsc. Ecol. 2016, 31, 67–84. [Google Scholar] [CrossRef]
  49. Getis, A.; Ord, J.K. The analysis of spatial association by use of distance statistics. Geogr. Anal. 1992, 24, 189–206. [Google Scholar] [CrossRef]
  50. ESRI. ArcMap 10.3.1; Environmental Systems Research Institute Inc.: Redlands, CA, USA, 2015. [Google Scholar]
  51. Brockerhoff, E.G.; Liebhold, A.M. Ecology of forest insect invasions. Biol. Invasions 2017, 19, 3141–3159. [Google Scholar] [CrossRef]
  52. Mack, R.N.; Simberloff, D.; Lonsdale, W.M.; Evans, H.; Clout, M.; Bazzaz, F.A. Biotic invasions: Causes, epidemiology, global consequences, and control. Ecol. Appl. 2000, 10, 689–710. [Google Scholar] [CrossRef]
  53. Ajchler, M.; Lobocka, M.; Oszako, T. Pathogenic oomycetes of Phytophthora genus: A new threat to forests in Europe. Sylwan 2017, 161, 870–880. [Google Scholar]
  54. Foden, W.B.; Butchart, S.H.M.; Stuart, S.N.; Vie, J.C.; Akcakaya, H.R.; Angulo, A.; DeVantier, L.M.; Gutsche, A.; Turak, E.; Cao, L.; et al. Identifying the world’s most climate change vulnerable species: A systematic trait-based assessment of all birds, amphibians and corals. PLoS ONE 2013, 8. [Google Scholar] [CrossRef]
  55. Dumroese, R.K.; Williams, M.I.; Stanturf, J.A.; St. Clair, J.B. Considerations for restoring temperate forests of tomorrow: forest restoration, assisted migration, and bioengineering. New For. 2015, 46, 947–964. [Google Scholar] [CrossRef]
  56. United States Department of Agriculture Forest Health Protection. Insect and Disease Detection Survey Database (IDS). Available online: https://www.fs.fed.us/foresthealth/applied-sciences/mapping-reporting/gis-spatial-analysis/detection-surveys.shtml (accessed on 24 October 2018).
  57. United States Department of Agriculture Forest Service. Future of America’s Forest and Rangelands: Forest Service 2010 Resources Planning Act Assessment; U.S. Department of Agriculture Forest Service: Washington, DC, USA, 2012; 198p.
  58. United States Department of Agriculture Forest Service. Future of America’s Forests and Rangelands: Update to the 2010 Resources Planning Act Assessment; U.S. Department of Agriculture Forest Service: Washington, DC, USA, 2016; 250p.
  59. United States Department of Agriculture Forest Service. National Report on Sustainable Forests—2010; U.S. Department of Agriculture Forest Service: Washington, DC, USA, 2011; 134p.
  60. United States Department of Agriculture Forest Service. National Report on Sustainable Forests—2003; U.S. Department of Agriculture Forest Service: Washington, DC, USA, 2004; 139p.
  61. Smith, W.B.; Miles, P.D.; Perry, C.H.; Pugh, S.A. Forest resources of the United States, 2007; GTR-WO-78; U.S. Department of Agriculture Forest Service, Washington Office: Washington, DC, USA, 2009; 336p.
  62. Hudgins, E.J.; Liebhold, A.M.; Leung, B. Predicting the spread of all invasive forest pests in the United States. Ecol. Lett. 2017, 20, 426–435. [Google Scholar] [CrossRef] [PubMed]
  63. Meddens, A.J.H.; Hicke, J.A.; Ferguson, C.A. Spatiotemporal patterns of observed bark beetle-caused tree mortality in British Columbia and the western United States. Ecol. Appl. 2012, 22, 1876–1891. [Google Scholar] [CrossRef] [PubMed]
  64. Royama, T. Analytical Population Dynamics; Chapman and Hall: London, UK, 1992. [Google Scholar]
  65. Chapman, T.B.; Veblen, T.T.; Schoennagel, T. Spatiotemporal patterns of mountain pine beetle activity in the southern Rocky Mountains. Ecology 2012, 93, 2175–2185. [Google Scholar] [CrossRef]
  66. Rocky Mountain Region Forest Health Protection. A Field Guide to Insects and Diseases of the Rocky Mountain Region; U.S. Department of Agriculture Forest Service, Rocky Mountain Research Station: Fort Collins, CO, USA, 2010; 336p.
  67. Teale, S.A.; Castello, J.D. Regulators and terminators: The importance of biotic factors to a healthy forest. In Forest Health: An Integrated Perspective; Castello, J.D., Teale, S.A., Eds.; Cambridge University Press: New York, NY, USA, 2011; pp. 81–114. [Google Scholar]
  68. Edmonds, R.L.; Agee, J.K.; Gara, R.I. Forest Health and Protection, 2nd ed.; Waveland Press, Inc.: Long Grove, IL, USA, 2011; 667p. [Google Scholar]
  69. Weed, A.S.; Ayres, M.P.; Hicke, J.A. Consequences of climate change for biotic disturbances in North American forests. Ecol. Monogr. 2013, 83, 441–470. [Google Scholar] [CrossRef]
  70. Kolb, T.E.; Fettig, C.J.; Ayres, M.P.; Bentz, B.J.; Hicke, J.A.; Mathiasen, R.; Stewart, J.E.; Weed, A.S. Observed and anticipated impacts of drought on forest insects and diseases in the United States. For. Ecol. Manag. 2016, 380, 321–334. [Google Scholar] [CrossRef]
  71. Sniezko, R.A.; Koch, J. Breeding trees resistant to insects and diseases: Putting theory into application. Biol. Invasions 2017, 19, 3377–3400. [Google Scholar] [CrossRef]
  72. Aukema, J.E.; McCullough, D.G.; Von Holle, B.; Liebhold, A.M.; Britton, K.; Frankel, S.J. Historical accumulation of nonindigenous forest pests in the continental United States. Bioscience 2010, 60, 886–897. [Google Scholar] [CrossRef]
  73. Koch, F.H.; Yemshanov, D.; Colunga-Garcia, M.; Magarey, R.D.; Smith, W.D. Potential establishment of alien-invasive forest insect species in the United States: where and how many? Biol. Invasions 2011, 13, 969–985. [Google Scholar] [CrossRef]
  74. Aukema, J.E.; Leung, B.; Kovacs, K.; Chivers, C.; Britton, K.O.; Englin, J.; Frankel, S.J.; Haight, R.G.; Holmes, T.P.; Liebhold, A.M.; et al. Economic impacts of non-native forest insects in the continental United States. PLoS ONE 2011, 6, 7. [Google Scholar] [CrossRef] [PubMed]
  75. Tonini, F.; Jones, C.; Miranda, B.R.; Cobb, R.C.; Sturtevant, B.R.; Meentemeyer, R.K. Modeling epidemiological disturbances in LANDIS-II. Ecography 2018, 41, 2038–2044. [Google Scholar] [CrossRef] [Green Version]
  76. Scheller, R.M.; Kretchun, A.M.; Loudermilk, E.L.; Hurteau, M.D.; Weisberg, P.J.; Skinner, C. Interactions Among Fuel Management, Species Composition, Bark Beetles, and Climate Change and the Potential Effects on Forests of the Lake Tahoe Basin. Ecosystems 2018, 21, 643–656. [Google Scholar] [CrossRef]
  77. Rogers, B.M.; Jantz, P.; Goetz, S.J. Vulnerability of eastern US tree species to climate change. Glob. Chang. Biol. 2017, 23, 3302–3320. [Google Scholar] [CrossRef]
  78. Tuomola, J.; Yemshanov, D.; Huitu, H.; Hannunen, S. Mapping risks of pest invasions based on the spatio-temporal distribution of hosts. Manag. Biol. Invasion 2018, 9, 115–126. [Google Scholar] [CrossRef] [Green Version]
Figure 1. Mean percent host tree Importance Value at Risk (IVAR) for plots within 834 km2 hexagons, encompassing both native and exotic insect and disease agents. (a) IVAR given the current county-level distribution of 39 highly damaging exotic insects and diseases. (b) IVAR given the possible future distribution extent of these exotics.
Forests 10 00304 g001
Figure 2. Hotspots and coldspots of Importance Value at Risk (IVAR) for plots within 834 km2 hexagons, encompassing both native and exotic insect and disease agents. Gi* scores ≤ −2 (red) are significant clusters of low survivability scores (and therefore hotspots of IVAR, the opposite of survivability); scores > 2 (blue) are significant clusters of high survivability values (coldspots of IVAR). (a) Hotspots and coldspots of IVAR given the current county-level distribution of 39 highly damaging exotic insects and diseases. (b) Hotspots and coldspots of IVAR given the possible future distribution extent of these exotics.
Forests 10 00304 g002
Figure 3. Mean percent host tree Importance Value at Risk (IVAR) for plots within 834 km2 hexagons, encompassing both native and exotic agents. (a) IVAR for insect agents. (b) IVAR for disease agents.
Forests 10 00304 g003
Figure 4. Hotspots and coldspots of Importance Value at Risk (IVAR) for plots within 834 km2 hexagons, for insect agents. Gi* scores ≤ −2 (red) are significant clusters of low survivability scores (and therefore hotspots of IVAR, the opposite of survivability); scores > 2 (blue) are significant clusters of high survivability values (coldspots of IVAR). (a) Hotspots and coldspots of IVAR for native insects. (b) Hotspots and coldspots of IVAR for exotic insects.
Forests 10 00304 g004
Table 1. Number of hosts, number of host/species combinations, and mean severity of those combinations, by host species family, for all insect and disease agents and for exotic insect and disease agents.
FamilySpp.All Insect and Disease AgentsExotic Insect and Disease Agents
HostsHost/Agent Combs.Mean Severity, Combs.HostsHost/Agent Combs.Mean Severity, Combs.
Acanthaceae1113.00000.00
Agavaceae2111.00000.00
Anacardiace4222.00000.00
Annonaceae2121.00111.00
Aquifoliace4232.33000.00
Arecaceae88182.22000.00
Betulaceae1613512.3712222.91
Bignoniaceae3281.50000.00
Boraginaceae3121.00000.00
Burseraceae1121.00111.00
Cactaceae1121.00000.00
Cannabaceae44131.00111.00
Combretaceae2131.00121.00
Cornaceae77221.77336.00
Cupressaceae33331031.6917211.81
Ebenaceae2233.67000.00
Ericaceae44151.93222.00
Euphorbiaceae1000.00000.00
Fabaceae2217491.08231.00
Fagaceae65652813.11651245.13
Hamamelidaceae1151.00121.00
Juglandaceae1919561.55225.50
Lauraceae33122.92374.29
Magnoliaceae94111.00000.00
Meliaceae1121.00000.00
Moraceae55152.20463.33
Myrtaceae1000.00000.00
Nyctaginaceae1000.00000.00
Oleaceae1615624.2315295.97
Pinaceae68683073.1230404.40
Platanaceae33102.10118.00
Polygonaceae1121.00000.00
Rhamnaceae3121.00111.00
Rhizophoraceae1132.33123.00
Rosaceae31301111.4713232.30
Rutaceae4000.00000.00
Salicaceae2222841.7918412.27
Sapindaceae2019732.7419354.51
Sapotaceae4231.00221.00
Simaroubaceae1000.00000.00
Styracaceae3000.00000.00
Taxaceae4362.50231.00
Theaceae2000.00000.00
Tiliaceae3391.67362.00
Ulmaceae77224.777154.93
Verbenaceae1121.00111.00

