Article

Genetic Diversity of the Endangered Dalbergia odorifera Revealed by SSR Markers

1
State Key Laboratory of Tree Genetics and Breeding, Research Institute of Tropical Forestry, Chinese Academy of Forestry, Longdong, Guangzhou 510520, China
2
The Experimental Centre of Tropical Forestry, Chinese Academy of Forestry, Pingxiang 532600, China
3
State Key Laboratory of Tree Genetics and Breeding, Research Institute of Forestry, Chinese Academy of Forestry, Beijing 100091, China
*
Author to whom correspondence should be addressed.
Forests 2019, 10(3), 225; https://doi.org/10.3390/f10030225
Submission received: 1 February 2019 / Revised: 20 February 2019 / Accepted: 25 February 2019 / Published: 3 March 2019

Abstract

:
Dalbergia odorifera T. Chen (Fabaceae) is a semi-deciduous tree species indigenous to Hainan Island in China. Due to its precious heartwood “Hualimu (Chinese)” and Chinese medicinal components “Jiangxiang”, D. odorifera is seriously threatened of long-term overexploitation and has been listed on the IUCN (International Union for Conservation of Nature’s) red list since 1998. Therefore, the elucidation of its genetic diversity is imperative for conservation and breeding purposes. In this study, we evaluated the genetic diversity of 42 wild D. odorifera trees from seven populations covering its whole native distribution. In total, 19 SSR (simple sequence repeat) markers harbored 54 alleles across the 42 samples, and the medium genetic diversity level was inferred by Nei’s gene diversity (0.36), observed (0.28) and expected heterozygosity (0.37). Among the seven wild populations, the expected heterozygosity (He) varied from 0.31 (HNQS) to 0.40 (HNCJ). The analysis of molecular variance (AMOVA) showed that only 3% genetic variation existed among populations. Moderate population differentiations among the investigated populations were indicated by pairwise Fst (0.042–0.115). Structure analysis suggested two clusters for the 42 samples. Moreover, the seven populations were clearly distinguished into two clusters from both the principal coordinate analysis (PCoA) and neighbor-joining (NJ) analysis. Populations from Haikou city (HNHK), Baisha autonomous county (HNBS), Ledong autonomous county (HNLD), and Dongfang city (HNDF) comprised cluster I, while cluster II comprised the populations from Wenchang city and Sansha city (HNQS), Changjiang autonomous county (HNCJ), and Wuzhisan city (HNWZS). The findings of this study provide a preliminary genetic basis for the conservation, management, and restoration of this endemic species.

1. Introduction

Dalbergia odorifera T. Chen, formerly named Dalbergia hainanensis Merr. et Chun, is endemic to Hainan province, southern China. It is a semi-deciduous perennial tree species (diploid) of predominant outcrossing in the Fabaceae family and one of the most valuable timber species in China. Dalbergia odorifera is restricted to relatively narrow tropical geographic areas in Hainan Island at altitudes below 600 m. Obviously, the development of D. odorifera plantations is required to alleviate the demand for this valuable wood, but so far no breeding systems have been established. In the 1950s, it was introduced to the subtropical areas of Guangdong, Guangxi, and Fujian provinces in China [1]. Following several decades, the introduced trees now exhibit a satisfactory growth performance, and have even formed valuable heartwood at most sites [1].
The heartwood of this species, locally known as “Hualimu” or “Huanghuli” (Chinese name), takes more than 50 years to mature. It is one of the most precious fragrant rosewoods with a high value on the furniture and craft markets (especially for luxury furniture and crafts) in China. As a source of traditional Chinese medicine, it is also known as “Jiangxiang”, and contains a series of chemical components, such as flavonoid [2], phenolic [3], and sesquiterpene derivatives [4,5,6], which play important roles in the pharmaceutical industry for treatment of cardiovascular diseases [7], cancer, diabetes [8], blood disorders, ischemia, swelling, and rheumatic pain [9,10]. Due to its high medicinal and commercial value, D. odorifera has been overexploited for a long time and has been listed on the IUCN (International Union for Conservation of Nature’s) red list by World Conservation Monitoring Centre (WCMC) since 1998 [11]. As a result, the species became rare, only limited numbers of individuals are found in parts of their original habitat, which was highly fragmented in the remaining forests in Hainan Island [12]. Therefore, a comprehensive survey is urgently needed to obtain information on the levels and patterns of genetic variation for D. odorifera. Such information is imperative for establishing an effective strategy for conservation and breeding purposes.
Molecular markers are often used to elucidate genetic variation in tree species [13]. However, in D. odorifera there are very few studies conducted using DNA molecular markers [12,14]. Compared to other molecular markers, microsatellite (simple sequence repeat, SSR) markers are the ideal choices for studying the genetic composition of wild populations because of their co-dominant character and high variability [15,16]. The use of microsatellite markers to analyze the genetic diversity of D. odorifera can provide an invaluable means for conservation and protection of this endangered species. Moreover, the developments of SSR markers have been innovated by next-generation sequencing based on transcriptomes (RNA-seq), especially for species without a reference genome [17,18,19]. This approach has been applied for SSR identification, development, and association studies in many tree species [20,21,22]. In the present study, we applied this approach and developed 19 polymorphic SSR markers specific for D. odorifera. The main objectives of this study were to use these developed SSR markers to evaluate the genetic diversity of wild D. odorifera populations, and find out the causes for the endangered and fragmented status of this species. The findings of this study will provide useful genetic information for conservation and breeding strategies in D. odorifera.

2. Materials and Methods

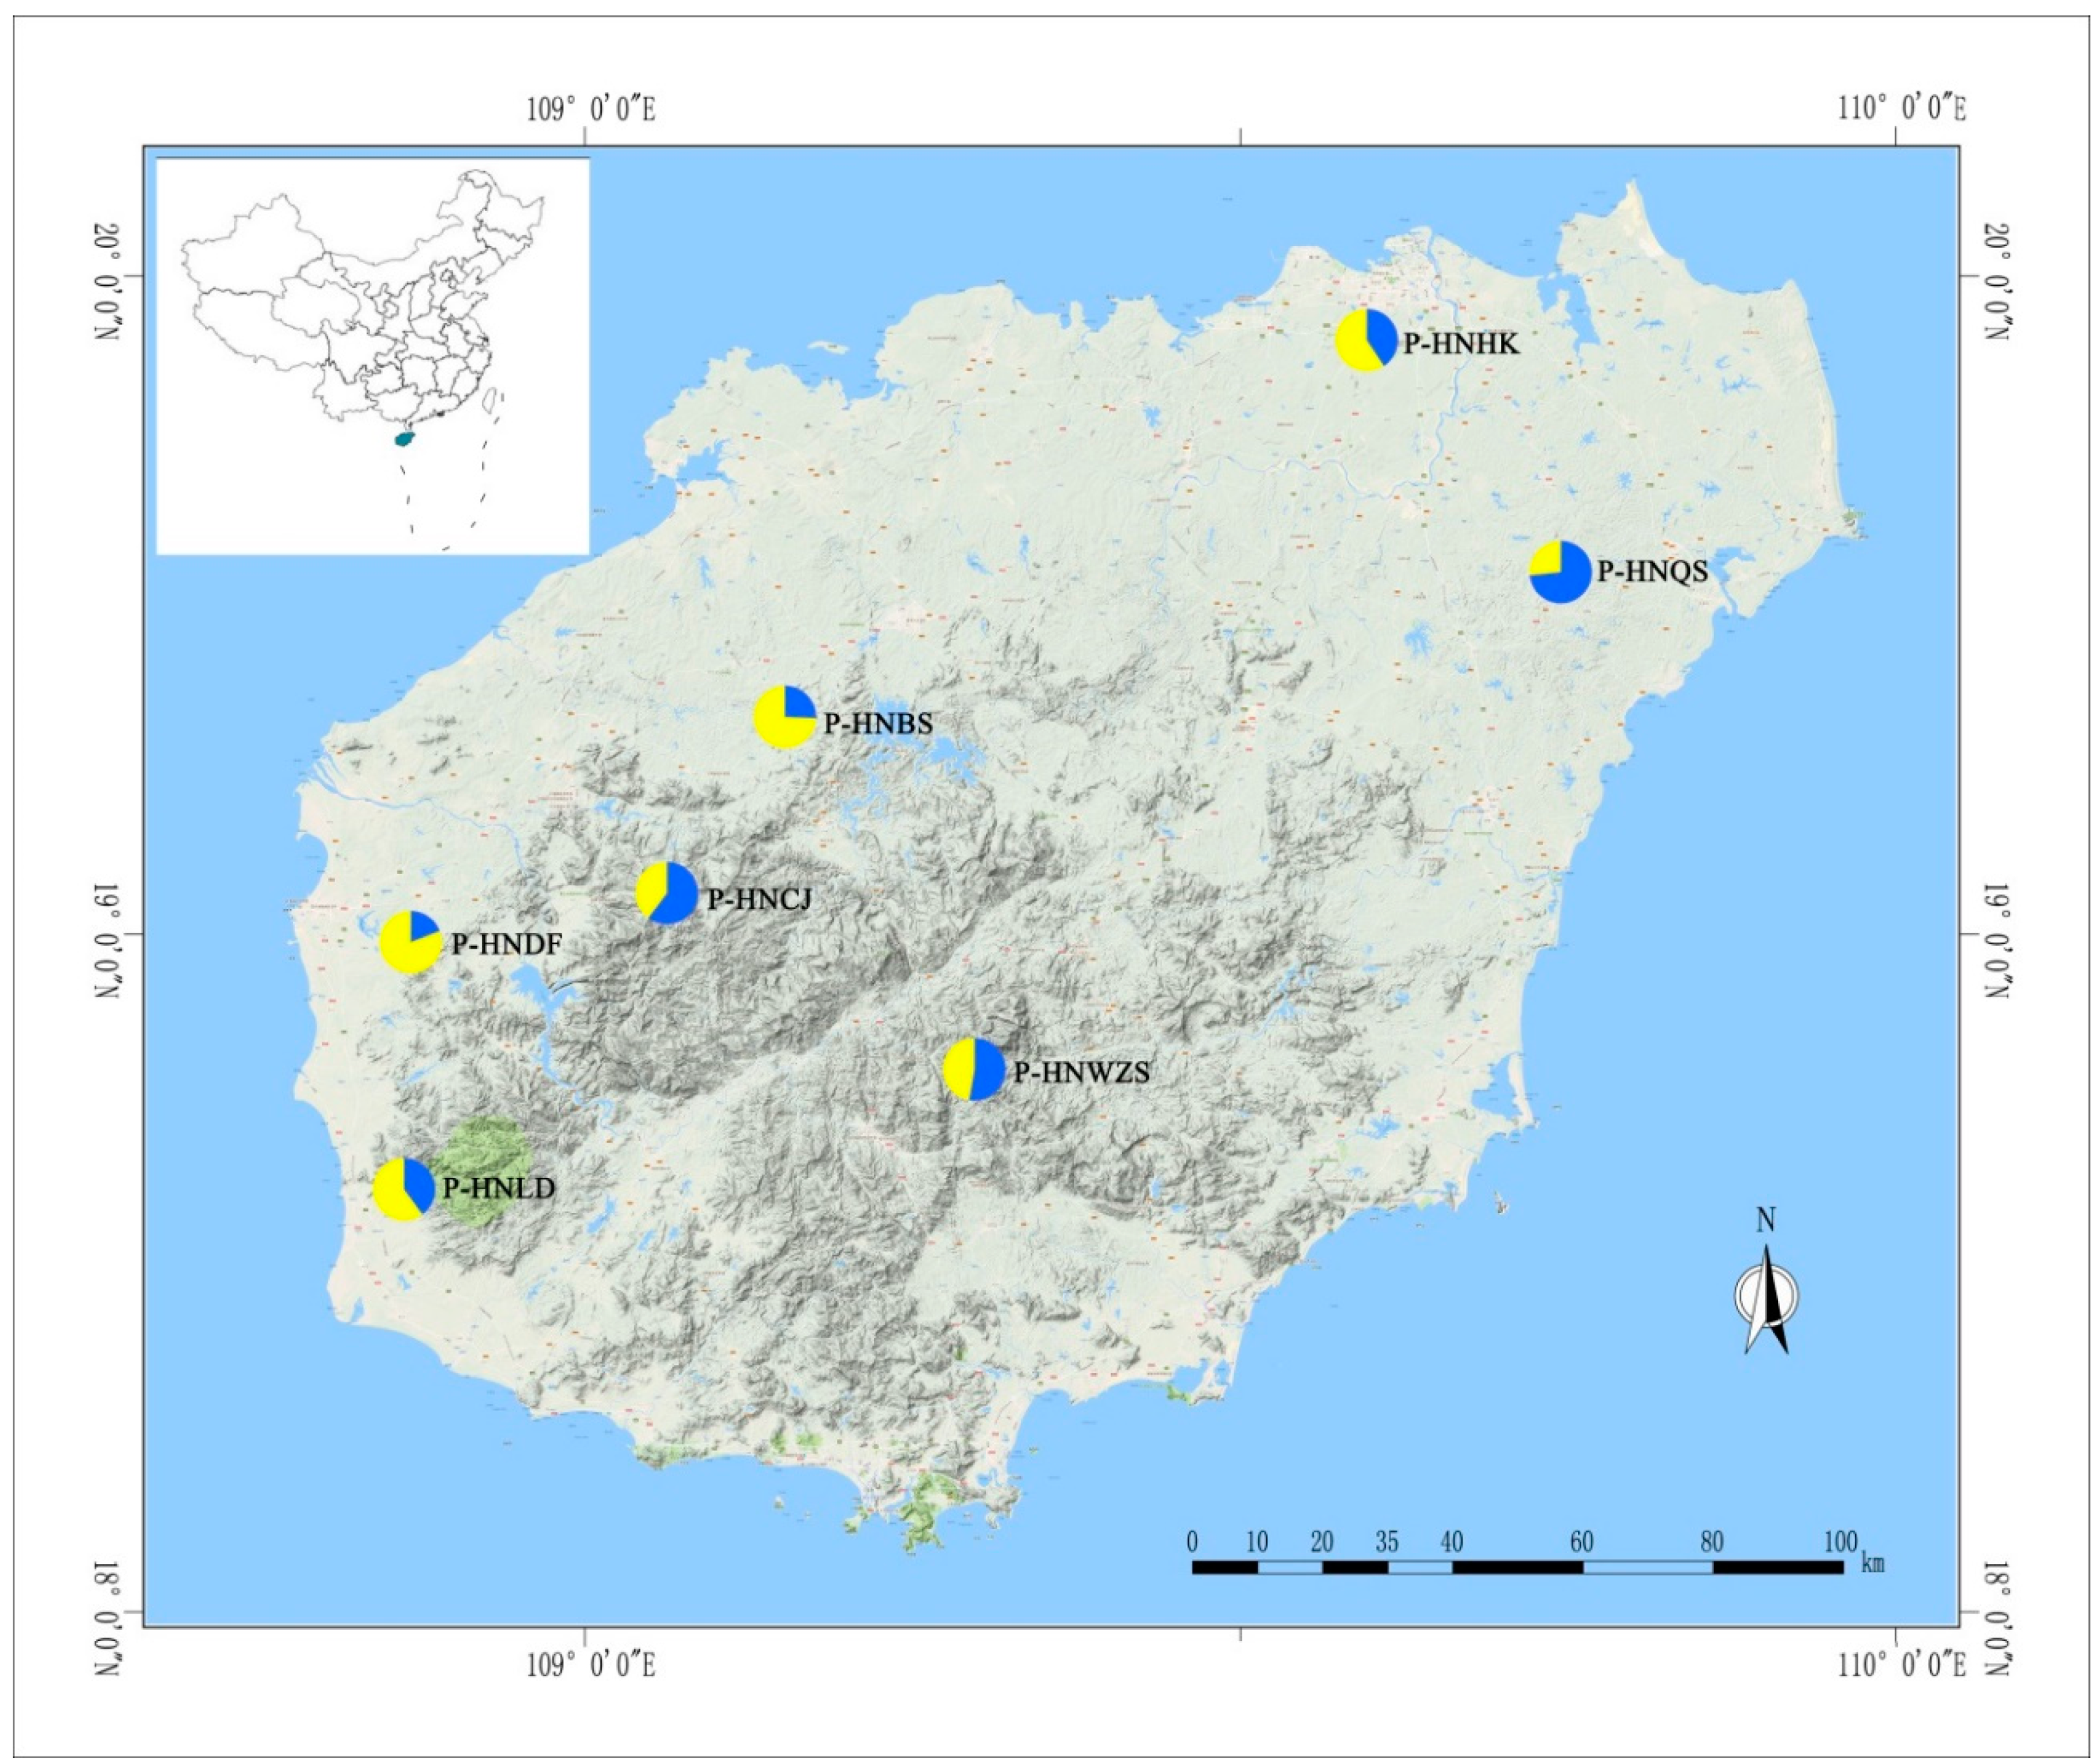
2.1. Plant Materials and DNA Extraction Materials and Methods

In total, 42 wild individuals representing seven D. odorifera populations were sampled from the whole Hainan Island of China (Figure 1, Table 1). We sampled all the trees with a diameter at breast height (DBH) larger than eight cm, and the 42 individuals were the last remaining resources. Ten leaves were collected from each individual and sealed in plastic bags with desiccants. Total genomic DNA was extracted for each sample using the Hi-DNAsecure Plant Kit (Tiangen, Beijing, China) according to the manufacturer’s instructions. The quality and quantity of DNAs were determined by NanoDrop 2000 (Thermo Scientific, Wilmington, DE, USA).

2.2. RNA Sequencing and Data Deposition

To develop protocols, three leaves from three trees (H27, H98, and H100) were collected from three different populations of Haikou city (HNHK), Dongfang city (HNDF), and Changjiang autonomous county (HNCJ), respectively, and immediately put into liquid nitrogen. RNA extraction and sequencing were done by Beijing Novogene Biological Information Technology Co., Ltd., Beijing, China (http://www.novogene.com/). The sequence data were deposited in the database of SRA (Sequence Read Archive) at the National Center for Biotechnology Information (NCBI, https://www.ncbi.nlm.nih.gov/), under accession number SRP175426, and SRR8398210, SRR8398212, and SRR8398211 were the three biosample accession numbers for H27, H98, and H100, respectively [23].

2.3. SSR Identification and Marker Development

The software of MISA (MIcro SAtellite; http://pgrc.ipk-gatersleben.de/misa) was employed to detect, locate, and identify SSR loci. The minimum number of motifs used to select the SSR was ten for mono-nucleotide repeats, and six for di-nucleotide motifs, five for tri-, tetra-, penta-, and hexa-nucleotide repeats. Primers were designed using Primer 3.0 software [24] using default settings with the following criteria: Predicted primer lengths of 18–24 bases, GC content of 40%–60%, annealing temperature of 56–62 °C, and predicted product sizes of 150–300 bp.

2.4. Validation of SSR Marker by PCR and Capillary Electrophoresis

Subsequently, DNAs from three samples (randomly selected from 42 individuals) were used to validate the 192 randomly selected SSR loci (exclude mononucleotide repeats) with the designed primers. PCR reactions were performed in 15 μL final volume, containing 10.25 µL water, 1.5 µL 10 x DNA polymerase buffer, 1.5 µL MgCl2 (25 mM), 0.3 µL dNTPs (10 mM each), 0.15 µL of each primer at 10 µM, 0.3 µL Taq polymerase at 5 units/µL (TaqUBA), and 1 µL of genomic DNA (40–50 ng). Totally 35 cycles of 94 °C for 15 s, appropriate annealing temperature for 15 s, and 72 °C for 30 s were performed, following the pre-denaturation at 94 °C for 3 min. PCR products of clear, stable, and specific bands with an expected length (100–350 bp) were considered as successful PCR amplifications. All the PCR reactions were repeated at least once. Finally, 22 SSR markers were randomly selected from the successful ones and used to analyze 42 samples. Their diluted PCR products mixed with 12.5 Hi-Di formamide and 0.25 µL size standard (Shanghai Generay Biotech Co., Ltd., Shanghai, China) were separated by capillary electrophoresis, and genotyped with an ABI 3730 Genetic Analyzer (Applied Biosystem, Foster, CA, USA) at Shanghai Generay Biotech Co., Ltd., Shanghai, China (http://www.generay.com.cn). Peak identification and fragment sizing were done using Gene Mapper v4.0 (Applied Biosystems, Foster, CA, USA) with default settings.

2.5. Statistical Analysis

The frequency of null alleles (FNA) and scoring errors were estimated using the Micro-checker software 2.2.3 [25]. POPGENE v1.3.1 software [26] was used to estimate the following genetic diversity parameters: Allele frequency, observed number of alleles (Na), effective number of alleles (Ne), expected and observed heterozygosities (He and Ho, respectively), Nei’s gene diversity (GD), the percentage of polymorphic loci (PPB), and Wright’s fixation index (F) and gene flow (Nm). The polymorphism information content (PIC) was calculated for each locus using the online program PICcalc [27]. F-statistics, including inbreeding coefficient within individuals (FIS), genetic differentiation among populations (FST), were computed using GenAlEx version 6.5, so were the pairwise Fst, pairwise G’ST (Hedrick’s standardized genetic differentiation index, adjusted for bias) [28]. Hardy-Weinberg equilibrium (HWE) was evaluated using chi-squared tests for each population at individual loci [26]. The Ewens-Watterson test for neutrality at each locus was performed using POPGENE v1.3.1 [26]. Hierarchical analyses of molecular variance (AMOVA) were conducted using GenAlEx version 6.5 [28].
The genetic structure of the investigated populations was analyzed using STRUCTURE 2.0 [29]. The number of discontinuous K was estimated from one to seven with 20 replicates, both length of burn-in period and value of MCMC (Markov chain Monte Carlo) were set to 100,000 times [30]. The true value of clusters (K) were harvested online (http:taylor0.biology.ucla.edu/struct_harvest/) according to the highest mean of estimated lnP(D) (log probability of data) and lnP(D)-derived delta K value [31]. Repeated sampling analysis and the genetic structural plot were performed by CLUMPAK [32]. To summarize the patterns of variation in the multi-locus dataset, principal coordinate analysis (PCoA) was performed using GenAlEx version 6.5 software based on pairwise G’ST matrix. Next, Mantel tests were carried out between matrixes of pairwise G’ST and geographic and genetic distance (Nei’s unbiased genetic distance) using GenAlEx version 6.5 software, respectively. Additionally, a Neighbor-Joining (NJ) tree based on Nei’s unbiased genetic distance was drawn in MEGAX [33].

3. Results

3.1. Distribution of SSR Loci in D. odorifera

In total, 35,774 potential SSR loci were identified and distributed in 26,880 unigenes, of which 6629 (24.7%) contained more than one SSR locus (Table S1). The SSR loci distributed in the leaf transcriptome were of a frequency of 1/2.18 kb. According to the unevenly distributed prediction (Figure S1), mono-nucleotide repeat motifs were the most frequent (21,623, 60.44%), followed by di- (7612, 21.28%) and tri-nucleotide (6112 or 17.09%) repeat motifs. These three motifs represented 98.81% in all, whereas only 40 and 14 penta- and hexa-nucleotide repeat motifs were found, respectively.

3.2. Development of Polymorphic SSR Markers

We randomly selected 192 SSR loci and designed primers to test the specificity of amplification for three samples and the informative nature of these SSR markers. Of these, 104 pairs of primers (54.2%) either did not give any amplification products or gave unexpected products, while 88 (45.8%) produced clear amplicons with the expected size of 100–350 bp. Next, 22 of the 88 primers were randomly selected for polymorphism detection and 19 (86.4%) showed polymorphism (Table 2). Further information on these validated 88 SSR markers, including ID of cDNA sequence, SSR type, repeat motif, position in template sequence, primer sequence, annealing temperature, and expected amplicon length (for developing alternative primers if desired) is available in Table S2. Among the polymorphic SSR loci, three (15.79%) were confirmed to locate in coding sequences (CDSs), six (31.58%) in 5′-untranslated regions (5′UTRs), and three (15.79%) in 3′-untranslated regions (3′UTRs).

3.3. Polymorphism of 19 SSR Loci

In total, 19 SSR loci harbored 54 alleles across the 42 D. odorifera samples (File S1), the number of alleles detected per locus was in a range of two to five, with an allele frequency range of 0.01–0.99 (Table 3, Table S3). The largest number of alleles (five) was detected at locus S21, which also harbored the largest effective number of alleles (Ne, 2.79), expected heterozygosity (He, 0.65), Nei’s gene diversity (GD, 0.64), and polymorphic information contents (PIC, 0.60). In terms of the overall PIC, both S09 and S21 were highly informative with PIC values higher than 0.50, while S02, S12, S23, S26, and S27 were less informative with PIC values smaller than 0.25, and the remaining 12 loci were moderately informative with PIC values between 0.25 and 0.50. The average of Wright’s fixation index (F) was 0.16, ranging from −0.19 (S22) to 0.44 (S24). Furthermore, null alleles were found at loci S04, S09, S21, S24, and S29. Six loci (S04, S08, S09, S24, S27, and S29) showed significant deviations from the Hardy-Weinberg equilibrium across the 42 D. odorifera individuals. Additionally, all the 19 SSR loci were selectively neutral according to the Ewens-Watterson test for neutrality (Table S4).

3.4. Genetic Diversity in D. odorifera

Among the seven populations investigated, the number of polymorphic loci varied from 13 to 17, along with the percentage of polymorphic loci (PPB) from 68.42% to 89.47% (Table 4). Presenting the largest PPB, population HNLD also had the largest alleles number of 46 (Alleles), whereas HNHK, with the smallest PPB, had the smallest number of 35 (Alleles). In total, eight private alleles appeared among the investigated populations, of which, three appeared in HNDF, two in HNLD, and one in HNQS, HNBS and HNWZS, respectively. The observed heterozygosity (Ho) ranged from 0.24 (HNWZS) to 0.38 (HNDF) and expected heterozygosity (He) from 0.31 (HNQS) to 0.40 (HNCJ), with an average of 0.28 and 0.37, respectively. At the population and species level, the expected (He) heterozygosity was 0.36 and 0.37, respectively. Additionally, population HNCJ possessing the highest genetic diversity level (He, 0.40) also showed the largest value of Nei’s gene diversity (0.36).
Both AMOVA and pairwise Fst analysis were performed to investigate the genetic variations among these populations. The AMOVA analysis was conducted without grouping the investigated populations (population HNHK was not in this analysis for individuals below five). The result showed that only 3% of the total genetic variation occurred among populations, and 20% of the within population variation was due to the heterozygosity of the individuals within each population (Table 5). The overall FST was very small (0.03, Table 5), the overall gene flow was 2.58 (Nm) estimated among all these populations (Table 3). Furthermore, the pairwise Fst ranged from 0.042 to 0.115 (Table 6). The highest level appeared between populations HNQS and HNDF (0.115), whereas the lowest appeared between HNLD and HNCJ (0.042).

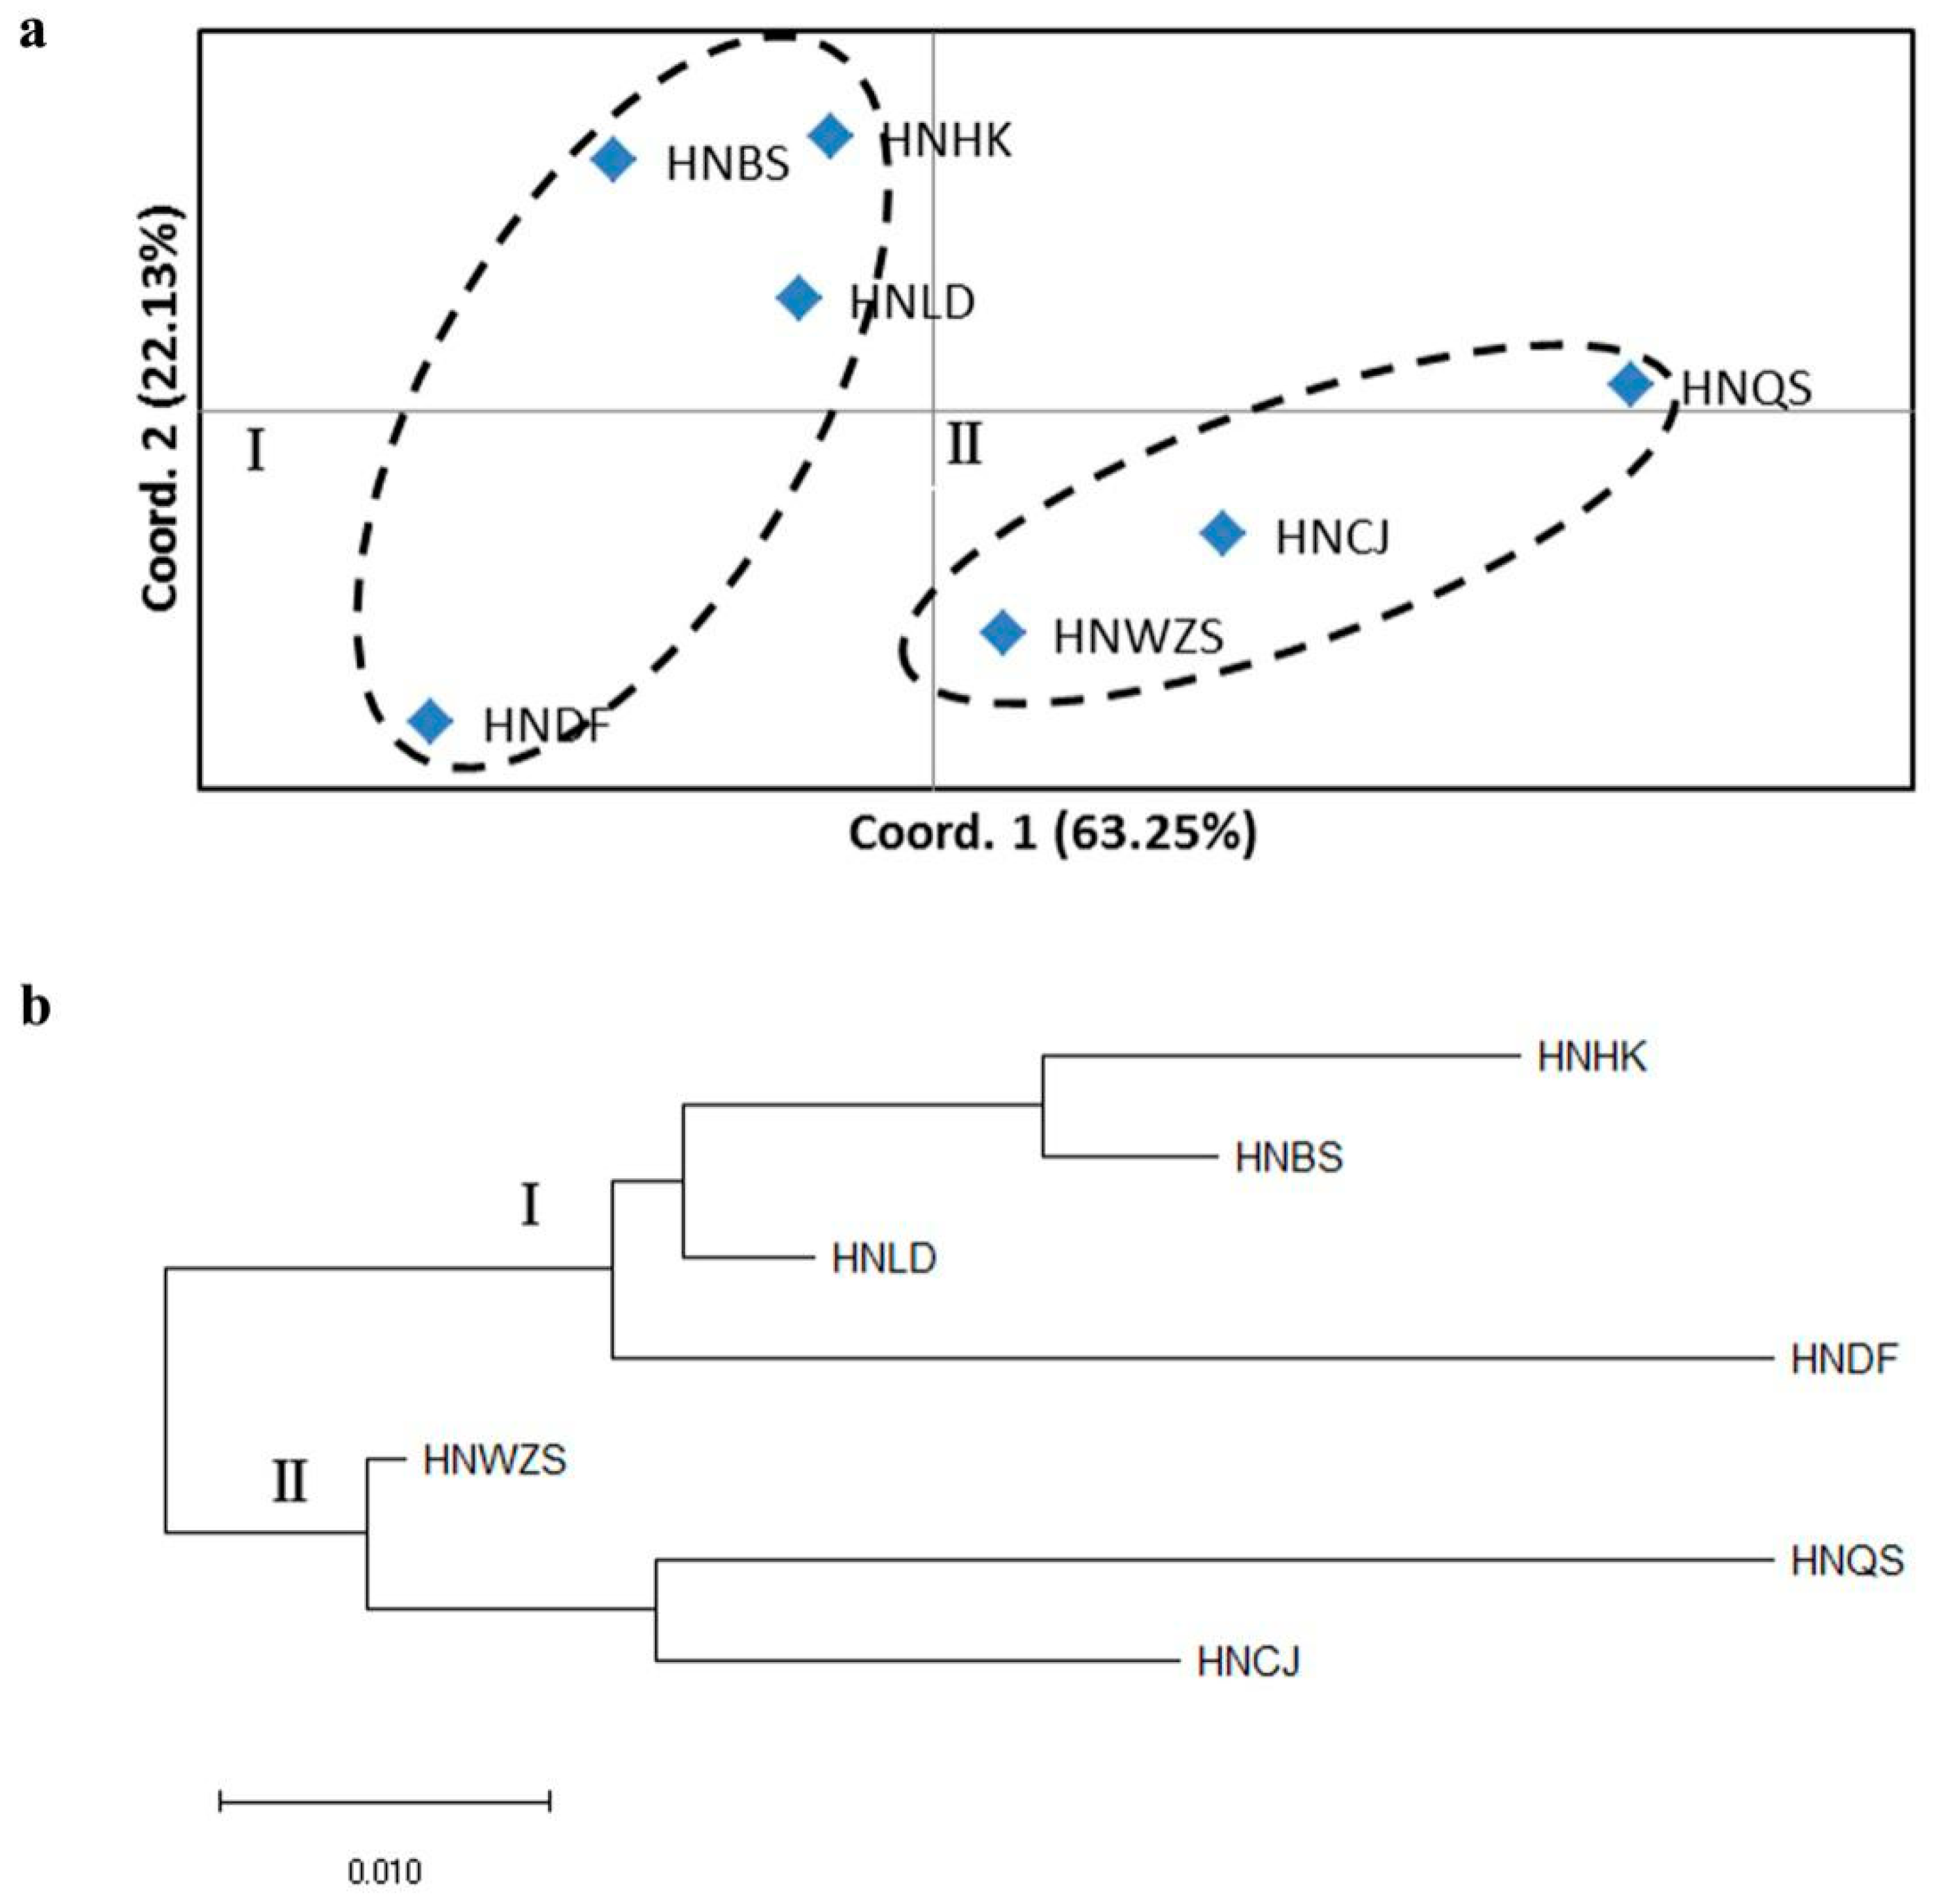
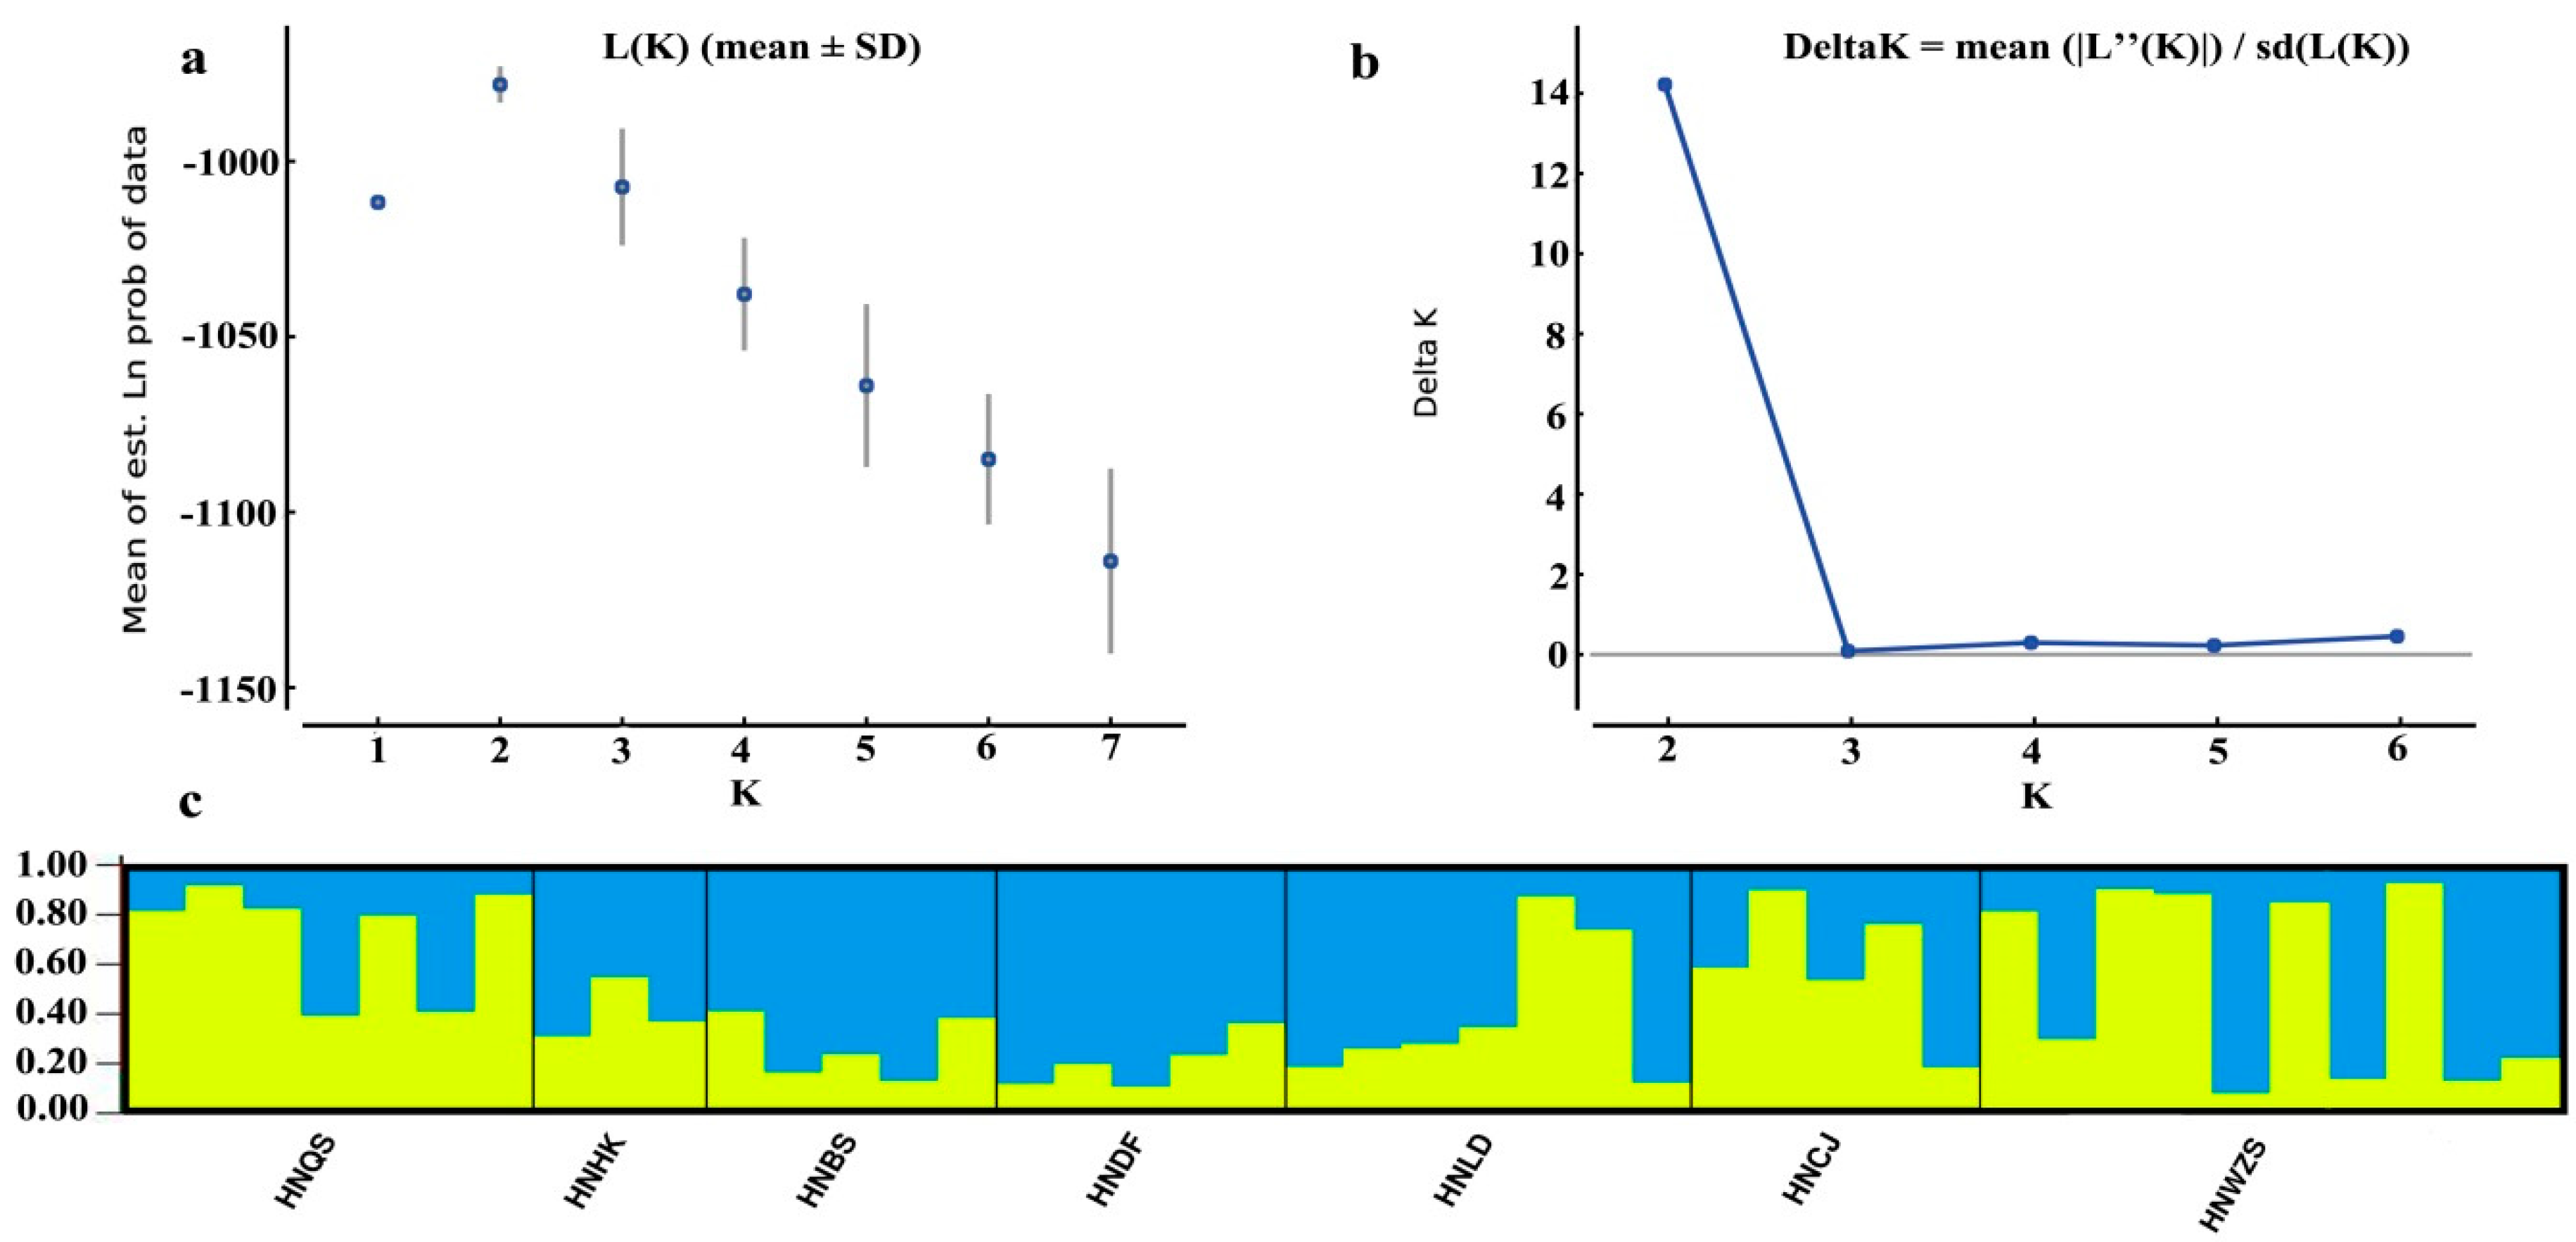
3.5. Population Structure of D. odorifera

An admixture model-based approach was implemented to evaluate the population structure of the 42 D. odorifera individuals. The optimum cluster number (K) of the investigated populations was two, with the largest values of both ln P(D) (log probability of data, −978) and delta K (15) harvested from the STRUCTURE HARVESTER website (Figure 2a,b). Based on K of two, a graphic representation of estimated membership coefficients of each individual was exhibited in Figure 2c. Each color showed the proportion of membership of each individual, represented by a vertical line, to the two clusters. The individual with the probability higher than a score of 0.75 was considered a pure one, and lower than 0.75 an admixture one. In this analysis, the yellow cluster included 17 individuals with 14 pure and 3 admixture ones, while the blue cluster included 25 individuals with 14 pure and 11 admixture ones. However, only HNBS and HNDF entirely consisted of individuals from the blue cluster, other populations consisted of individuals from both clusters.
The pairwise G’ST matrix was used for the principal coordinate analysis (PCoA). The first and second axis explained 63.25% and 22.13% of the variance within the molecular data, respectively (Figure 3a). Two clusters were clearly distinguished by PCoA analysis: Populations from HNHK, HNBS, HNLD and HNDF were grouped as cluster I, the other three populations (HNQS, HNCJ and HNWZS) grouped as cluster II. Moreover, the NJ (Neighbor-joining) dendrogram tree showed similar results based on Nei’s unbiased genetic distance among the investigated populations (Figure 3b).
Subsequently, Mantel tests between the matrixes of pairwise G’ST and geographic distance (Figure 4a) and genetic distance (Figure 4b) were carried out, respectively. The results showed that genetic differentiations among the investigated populations were more attributed to the genetic distance (91.2%, Figure 4b) rather than to the geographic distance (27.7%, Figure 4a). Hence, there was no clear geographic origin-based structuring, or predominate isolation by distance among the investigated populations.

4. Discussion

4.1. Development of SSR Marker for D. odorifera

Measuring levels of genetic diversity within and among populations is essential to understand the adaptability to environments of a species, in particular for conservation studies to explore the causes of rare and/or endangered plant species [34]. However, reports on the genetic diversity of D. odorifera is scarce, as a shortage of molecular markers restricted to six RAPD (random amplified polymorphic DNA) [12] and 25 SRAP (sequence-related amplified polymorphism) [14] loci. The use of such dominant markers could give a biased estimation of genetic variation when populations are not in the Hardy-Weinberg equilibrium [35], which may be true for the D. odorifera fragmented populations. In the present study, six loci showed significant deviations from the Hardy-Weinberg equilibrium. Therefore, the development of co-dominant SSR markers for D. odorifera is of great use for genetic studies. In this study, we have identified 35,774 putative SSR loci from the leaf transcriptome dataset, substantially more than those reported for other legume species such as 5956 in Prosopis alba Griseb. [36], 5710 in Millettia pinnata (L.) Panigrahi [18], and 7493 in Mucuna pruriens (L.) DC. [37]. In addition, the dominant repeats and motif types of SSR also vary among the transcriptomes from different species. These differences may be attributable to different genome structure and composition in these species.
The effectiveness and success of SSR development rely considerably on the quality and the accuracy of the sequence data [38]. Therefore, the identified SSR loci need to be further validated. Of the 192 primer pairs selected, 45.8% (88) yielded the expected amplicons for each locus, indicating that no introns presented within the amplified regions. From those validated SSR markers, 22 were randomly selected for polymorphism detection, of which 86.4% (19) exhibited polymorphism among the 42 wild D. odorifera trees. The PIC content provides an estimation of the information content of locus. The average PIC value of these newly developed SSR markers is 0.31, which is comparable to or lower than that in other legumes, such as Vigna umbellata (Thunb.) Ohwi & Ohashi (0.2898) [39], Mucuna pruriens (L.) DC. (0.24) [37], and Melilotus species (0.79) [40], but relatively higher than that based on ISSR (inter simple sequence repeat) and RAPD markers in other Dalbergia species, such as Dalbergia cochinchinensis Pierre ex Laness (ISSR 0.101; RAPD 0.088) [41] and Dalbergia oliveri Prain (ISSR 0.147; RAPD 0.116) [42]. Both high and low allelic PIC value markers are useful for genetic diversity to avoid a biased estimation [43,44]. Therefore, these SSR markers developed in our present study appear to be useful for genetic studies of D. odorifera populations.

4.2. Genetic Diversity of D. odorifera

Genetic diversity is essential to the long-term survival of species and plays an important role in the genetic improvement through breeding programs. However, limited information on genetic diversity of D. odorifera is available. Prior to the present study, only one report has been conducted using six RAPD markers, indicating medium genetic diversity level (six populations) inferred by the percentage of polymorphic loci (PPB) of 54.55% and Nei’s gene diversity (GD) of 0.21 [12]. Compared to which, our results exhibited a higher genetic diversity level with the higher values of 100% (PPB) and 0.36 (GD) using the 19 newly developed SSR markers. These differences may be due to the different numbers [45] and types of molecular markers [16] used in the studies, or alternatively, due to the different population sizes in the two studies.
Genetic diversity in wild plant species is often related to the geographic range, population size, longevity, mating system, migration, and balancing selection [34,45,46]. Higher genetic diversity is expected to reflect a better adaption to the environments of a species [47]. However, the medium genetic diversity level of D. odorifera was indicated by the observed and expected heterozygosity of 0.28 and 0.37, respectively. Most of studies have been concordant with the general trend or prediction that species with narrow or endemic distributions maintain significantly lower levels of genetic diversity than species with widespread distributions [48,49,50,51]. Notably, the native habitat of D. odorifera is restricted to small regions in Hainan Island. It is no wonder then that the genetic diversity values in the present study are much smaller than those in wide spread tropical tree species such as Olea europaea Linn. (12 SSR markers, Ho = 0.75, He = 0.6) [20], Prunus africana (Hook.f.) Kalkman (6 SSR markers, Ho = 0.68, He = 0.73) [52], and Eugenia dysenterica DC. (9 SSR markers, Ho = 0.545, He = 0.62) [53]. However, the diversity of D. odorifera is even lower than in some rare and endemic tree species like Boswellia papyrifera (Del. ex Caill.) Hochst (He = 0.69) [54], D. cochinchinenesis (He = 0.55), and D. oliveri (He = 0.75) [55]. Similar observations were reported for Ottelia acuminate (He = 0.35, endemic to southwestern China) [56] and Dipterocarpus alatus Roxb. ex G.Don (He = 0.22, endemic to southeastern Vietnam) [57], resulting from the extensive reduction in population sizes caused by human disturbance. Similarly, due to the long-time over-logging for the valuable fragrant heartwood, the distributions of D. odorifera populations in Hainan Island have been dramatically reduced in the past thirty years. The present populations were highly fragmented into subpopulations, each composed of only a few individuals and large trees are seldom [12]. This is consistent with the suggestion that the distribution-restricted plant species are associated with a relatively low genetic diversity primarily from over-exploitation of their resources.
In the present study, the mean observed heterozygosity (0.28) was much lower than the mean expected heterozygosity (0.37), and the Wright’s (1978) fixation index (F) was up to 0.16 across the 42 wild trees (Table 3), indicating a modest heterozygote deficiency existed within the entire wild distribution range for D. odorifera. This result may be attributed to the botanical characteristics of D. odorifera, more specifically, to its complicated reproduction system which causes a relatively high inbreeding coefficient (Table 5) [58]. Dalbergia odorifera is a predominantly outcrossing species [12]. Its flowers are entomophilous pollinated by small insects and fruits with flattened seedpods are dispersed by wind [59,60], which limits longer distance dispersal. Moreover, D. odorifera has the ability of coppice regeneration especially stimulated by trunk injuries [12]. These characters are consistent with a predominantly outcrossing mating system that includes at least some extent of inbreeding. Alternatively, it is due to the small populations in which mating between relatives occurred more frequently than in large populations [61].

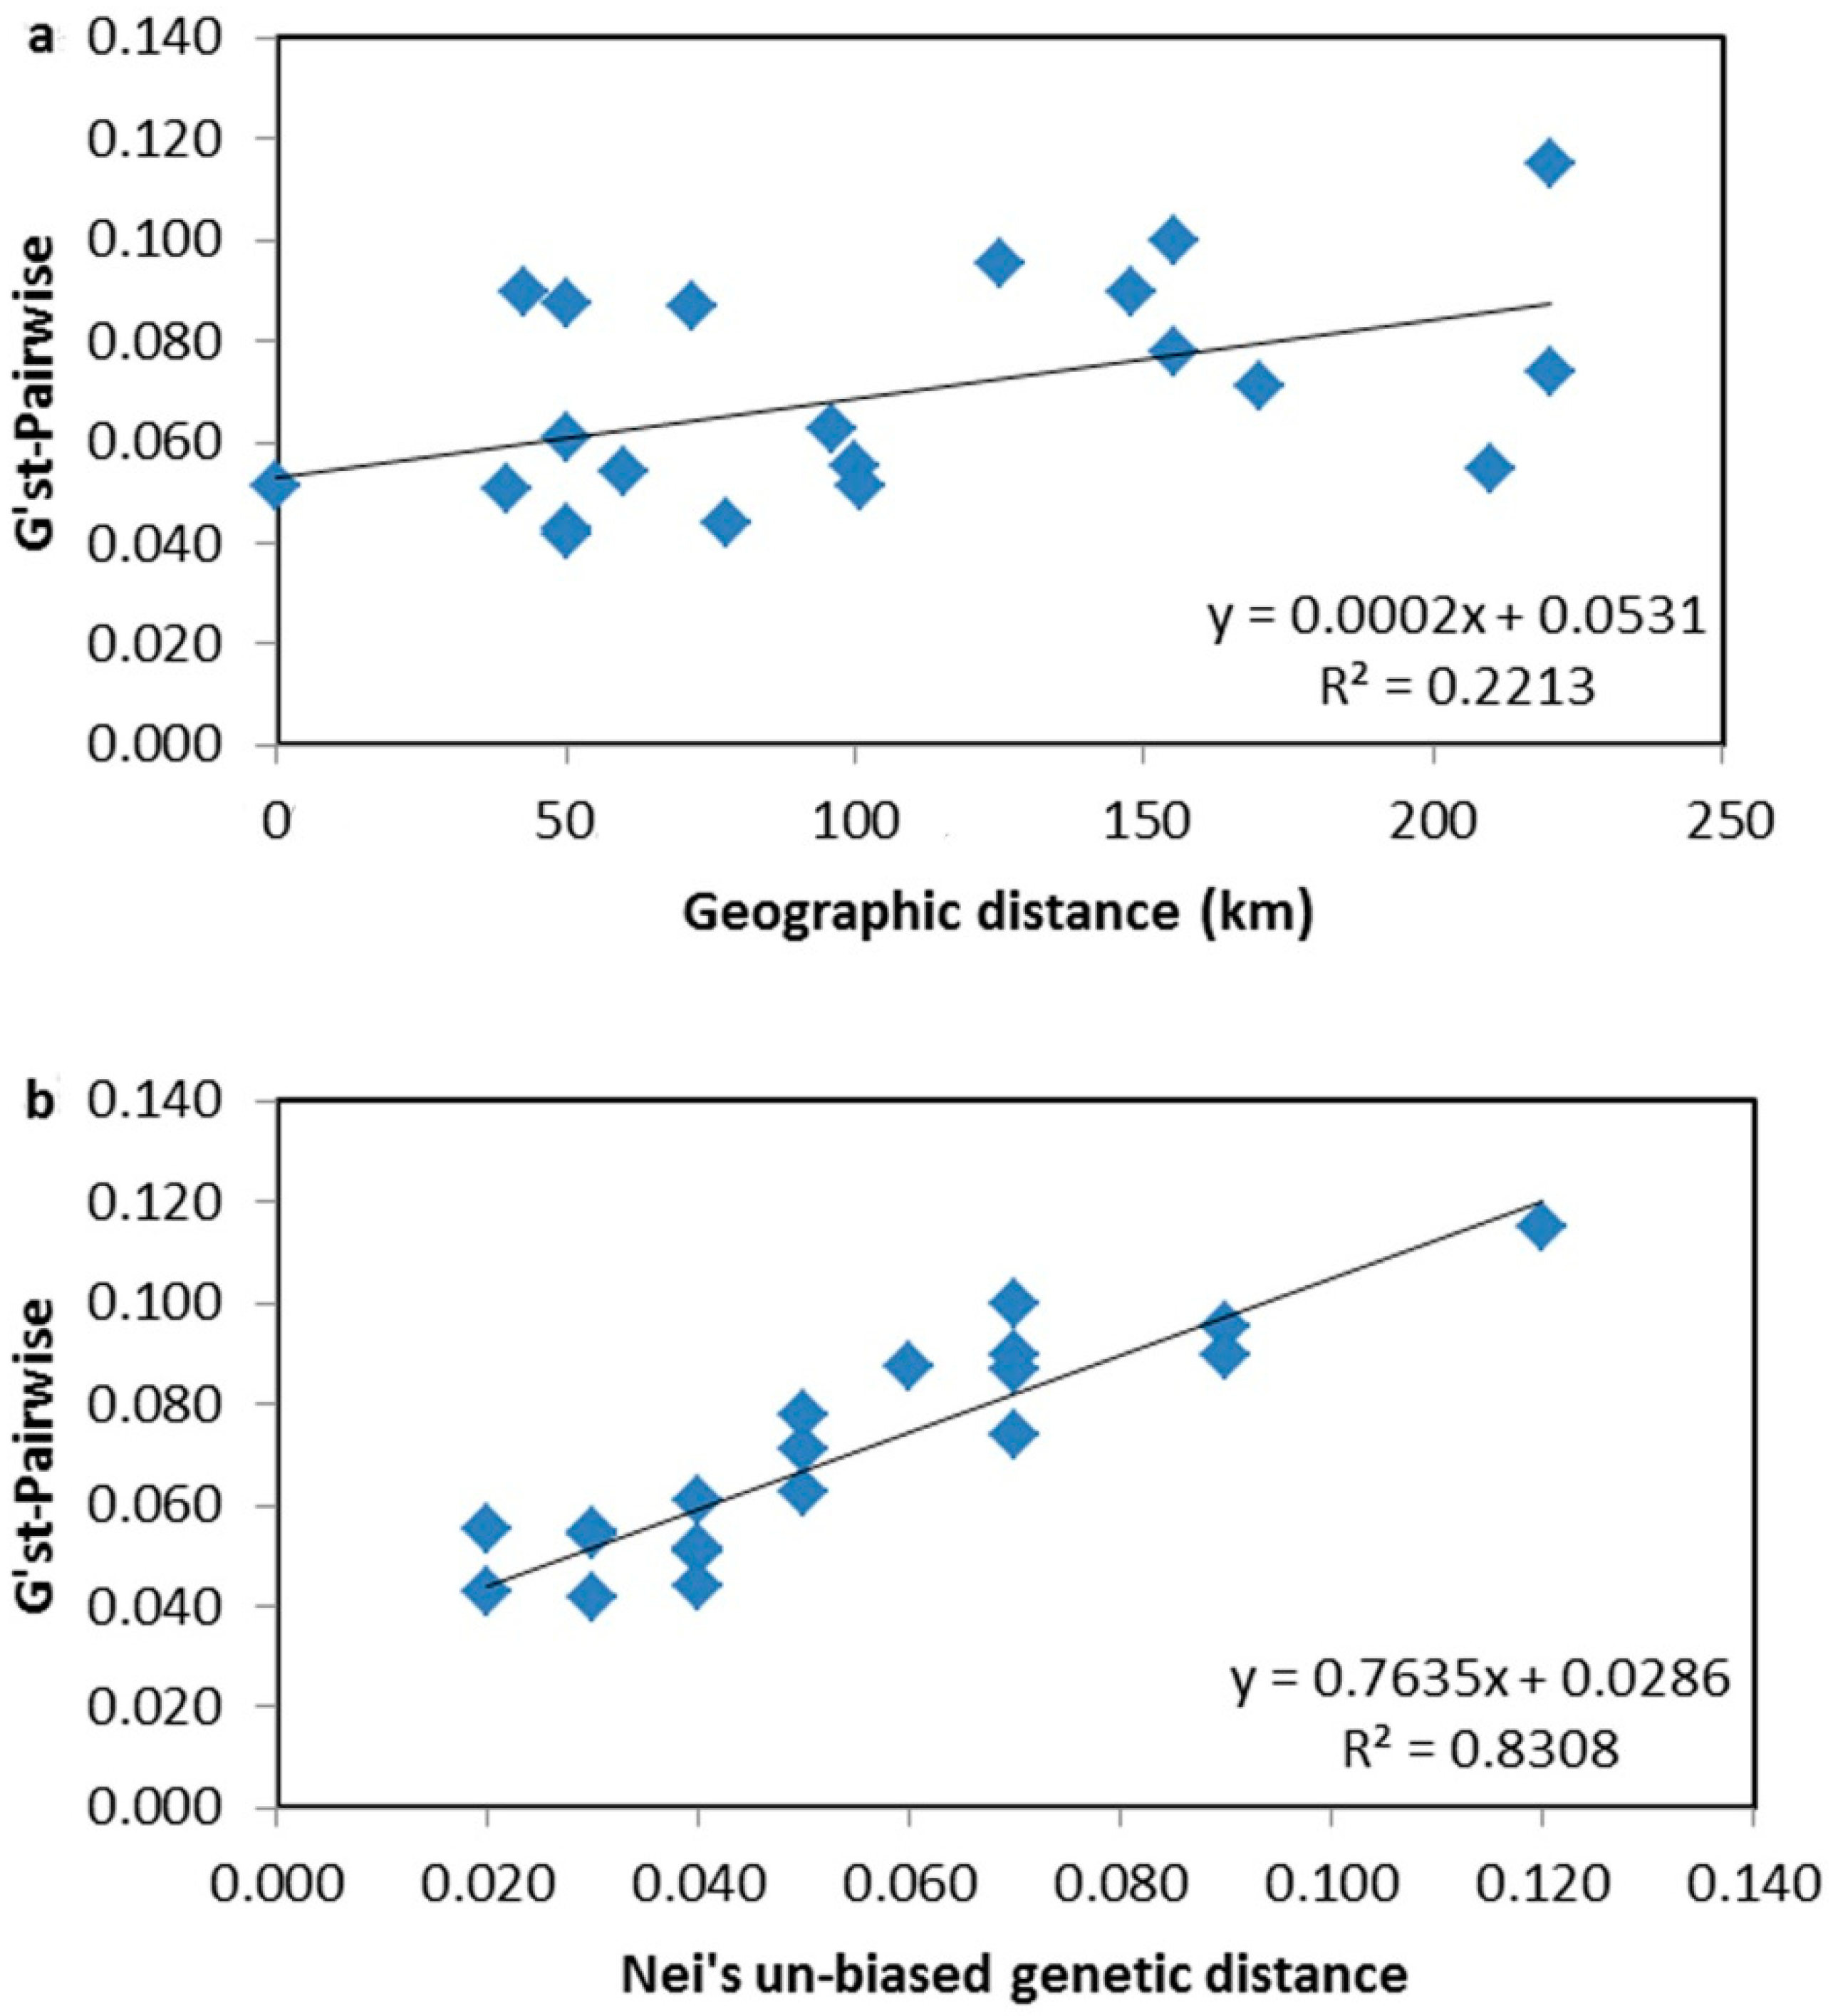
4.3. Genetic Differentiation and Population Structure

Woody species with predominately outcrossing tend to have less differentiation among populations and high variation within populations [34]. Similarly, our AMOVA analysis showed that most of the genetic variation was within the investigated populations of D. odorifera, while only 3% genetic variation components existed among populations, which is much lower compared to other Dalbergia species (0.236, D. cochinchinensis; 0.126, D. oliveri) [55]. Genetic differentiation among different populations is strongly influenced by gene flow (Nm) and genetic drift [62]. For neutral genes, the value of Nm below one indicates that genetic drift is a predominant factor affecting population structure, whereas the value above four indicates that gene flow can replace a genetic drift [48,63]. In the present study, the 19 SSR markers, which were selectively neutral according to the results of the Ewens-Watterson test (Table S4), are excellent for investing the effects of gene flow and genetic drift, showing overall gene flow of 2.58 (Table 3). This relatively high gene flow could curtail parts of the dispersive effects caused by genetic drift, reducing the genetic variation among populations while increasing the diversity within populations. However, the frequent migration indicated by the relatively high gene flow was opposite to the fragmented distributions of the investigated populations, for which, the putative explanation may be that of frequent human actions, primarily due to overexploitation and illegal logging [12]. Similar observations were also found for Acer miaotaiense (P. C. Tsoong) [34] and Plectranthus edulis (Vatke) Agnew [47]. Additionally, a genetic drift could not be ignored, since the population sizes are so small that any reduction in size could result in genetic drift.
Pairwise Fst was in a range of 0.042–0.115 (Table 6), suggested that moderate population differentiation were found among these wild populations. The highest level of genetic differentiation (0.115) was found between populations HNDF and HNQS, and the distance between them was about 220 km, which was matching with the indication that long-term isolation may limit the level of gene flow between two populations [34]. However, the genetic differentiation level between HNLD and HNHK was only 0.055, the distance between them was also 220 km, which was opposite to the indication. An admixture model-based approach was implemented to evaluate the population structure, and suggested two clusters were the best for the 42 D. odorifera trees. Similar results were generated from both neighbor-joining and PCoA analysis. They all distinguished the investigated populations into two clusters—cluster I consisted of populations from Haikou city (HNHK), Baisha autonomous county (HNBS), Ledong autonomous county (HNLD), and Dongfang city (HNDF); while cluster II consisted of populations from Wenchang city and Sansha city (HNQS), Changjiang autonomous county (HNCJ), and Wuzhisan city (HNWZS). Moreover, genetic differentiation among the investigated populations showed positive relationships with both geographic distance (27.7%, Figure 4a) and genetic distance (91.2%, Figure 4b) distinguished by the Mantel tests, which was attributed more to the genetic distance rather than the geographic distance. Across all these analyses, no clear geographic origin-based structuring or predominant signs of “isolation by distance” were found, the present population structure of D. odorifera was more likely to be inferred by human activities.

4.4. Conservation

The main goal of conservation is to establish a suitable strategy for maintaining current genetic diversity and ensuring the long-term evolution of an endangered species [64]. The current state of D. odorifera is: Medium genetic diversity level along with modest heterozygosity deficiency, low genetic differentiation, and really small population size. This pattern mainly results from extensive human activities, primarily due to the over-logging. Many necessary approaches have been implemented by the Chinese government: (1) Dalbergia odorifera has been promoted to a second-grade state-protected species and it is forbidden to exploit natural resources; (2) national parks and sanctuaries have been established for in situ conservation covering almost every habitat in Hainan Island, such as Hainan Jianfengling national reservation, Bawangling national park, and Wangning Botany Park, etc. However, the population size of D. odorifera is still decreasing due to illegal-logging. Therefore, impactful ex situ conservation strategies should be the best choice, to avoid the loss of genetic diversity due to illegal logging and increase the variability of progenies by “outcrossing” the trees available.

5. Conclusions

The present study provides an initial assessment on genetic diversity and structure of D. odorifera conducted using 19 SSR markers. Medium genetic diversity at the species level and low genetic differentiations among populations were found in this endangered endemic tree species. This pattern of genetic variation may be primarily caused by extensive human activities, and this information could be used in the establishment of conservation strategies of this endangered species. In addition, the large number of SSR loci may serve as tools for assisting breeding programs in future studies.

Supplementary Materials

The following are available online at https://www.mdpi.com/1999-4907/10/3/225/s1, Figure S1: SSR motifs distribution, Table S1: Summary of SSR identified from the transcriptome. Table S2: Details of 88 validate SSR markers. Table S3: Allele frequency distribution across 42 Dalbergia odorifera. Table S4: The Ewens-Watterson test for neutrality across 19 microsatellite loci in Dalbergia odorifera. File S1: Raw data. Zip, contains three files: file a: 1-Allele-PDF, Allele reports, captured all the peaks in **.pdf. (** locus code, S01-S30); file b: 2-Raw and Statistical data-Excel, the 42 samples are identified to the “SAMPLE” labeled in the Allele reports. Scored raw data in “Raw-S01-S30. xlsx”, then corrected the wrong captures and defined the allele series as integers to generate “S01-S30.xlsx” for statistics; file c: 3-Status of 42 wild D. odorifera trees.

Author Contributions

Data curation, Z.H. and N.Z.; formal analysis, F.L., H.J.; funding acquisition, Z.H., D.X. and N.Z.; investigation, N.Z. and Z.Y.; methodology, Z.H., D.X., X.L., Z.Y. and M.L.; project administration, Z.H. and D.X.; resources, X.L., H.J.; supervision, D.X.; writing—original draft, F.L.; writing—review & editing, F.L. and M.L.

Funding

This research was funded by Research Funds for the Central Non-profit Research Institution of Chinese Academy of Forestry (CAFYBB2017ZX001-4), National Natural Science Foundation of China (31500537), and Science Innovation Projects of Guangdong Province (2016KJCX009).

Acknowledgments

The authors are very grateful to Szmidt, A.E. (Department of Biology, Kyushu University) for the helpful comments on this manuscript.

Conflicts of Interest

The authors declare no conflict of interest.

References

  1. Liu, X.; Xu, D.; Yang, Z.; Zhang, N. Geographic variations in seed germination of Dalbergia odorifera T. Chen in response to temperature. Ind. Crop. Prod. 2017, 102, 45–50. [Google Scholar] [CrossRef]
  2. Lee, D.S.; Kim, K.S.; Ko, W.; Li, B.; Keo, S.; Jeong, G.S.; Oh, H.; Kim, Y.C. The neoflavonoid latifolin isolated from MeOH extract of Dalbergia odorifera attenuates inflammatory responses by inhibiting NF-kappaB activation via Nrf2-mediated heme oxygenase-1 expression. Phytother. Res. 2014, 28, 1216–1223. [Google Scholar] [CrossRef] [PubMed]
  3. Wang, H.; Dong, W.H.; Zuo, W.J.; Wang, H.; Zhong, H.M.; Mei, W.L.; Dai, H.F. Three new phenolic compounds from Dalbergia odorifera. J. Asian Nat. Prod. Res. 2014, 16, 1109–1118. [Google Scholar] [CrossRef] [PubMed]
  4. Meng, H.; Chen, D.L.; Yang, Y.; Liu, Y.Y.; Wei, J.H. Sesquiterpenoids with cytotoxicity from heartwood of Dalbergia odorifera. J. Asian Nat. Prod. Res. 2018. [Google Scholar] [CrossRef] [PubMed]
  5. Tao, Y.; Wang, Y. Bioactive sesquiterpenes isolated from the essential oil of Dalbergia odorifera T. Chen. Fitoterapia 2010, 81, 393–396. [Google Scholar] [CrossRef] [PubMed]
  6. Wang, H.; Dong, W.H.; Zuo, W.J.; Liu, S.; Zhong, H.M.; Mei, W.L.; Dai, H.F. Five new sesquiterpenoids from Dalbergia odorifera. Fitoterapia 2014, 95, 16–21. [Google Scholar] [CrossRef] [PubMed]
  7. Fan, Z.M.; Wang, D.Y.; Yang, J.M.; Lin, Z.X.; Lin, Y.X.; Yang, A.L.; Fan, H.; Cao, M.; Yuan, S.Y.; Liu, Z.J.; et al. Dalbergia odorifera extract promotes angiogenesis through upregulation of VEGFRs and PI3K/MAPK signaling pathways. J. Ethnopharmacol. 2017, 204, 132–141. [Google Scholar] [CrossRef] [PubMed]
  8. Lee, D.S.; Li, B.; Keo, S.; Kim, K.S.; Jeong, G.S.; Oh, H.; Kim, Y.C. Inhibitory effect of 9-hydroxy-6,7-dimethoxydalbergiquinol from Dalbergia odorifera on the NF-kappaB-related neuroinflammatory response in lipopolysaccharide-stimulated mouse BV2 microglial cells is mediated by heme oxygenase-1. Int. Immunopharmacol. 2013, 17, 828–835. [Google Scholar] [CrossRef] [PubMed]
  9. Choi, H.S.; Park, J.A.; Hwang, J.S.; Ham, S.A.; Yoo, T.; Lee, W.J.; Paek, K.S.; Shin, H.C.; Lee, C.H.; Seo, H.G. A Dalbergia odorifera extract improves the survival of endotoxemia model mice by inhibiting HMGB1 release. BMC Complement. Altern. Med. 2017, 17, 212. [Google Scholar] [CrossRef] [PubMed]
  10. Wang, W.; Weng, X.C.; Cheng, D.L. Antioxidant activities of natural phenolic components from Dalbergia odorifera T. Chen. Food Chem. 2000, 71, 45–49. [Google Scholar] [CrossRef]
  11. Dalbergia Cochinchinensis. The IUCN Red List of Threatened Species. Available online: http://www.iucnredlist.org/details/32398/0 (accessed on 18 July 2018).
  12. Yang, Q.X.; Feng, J.D.; Wei, J.H.; Li, R.T.; He, M.J. Genetic diversity of China’s endangered medicinal plant Dalbergia odorifera. World Sci. Technol. Mod. Tradit. Chin. Med. Mater. Med. 2007, 9, 73–79. Available online: http://kns.cnki.net/KCMS/detail/detail.aspx?dbcode=CJFQ&dbname=CJFD2007&filename=SJKX200702016&v=MTgxNzJGeUhuVmJ2TE5pZkFkckc0SHRiTXJZOUVZb1I4ZVgxTHV4WVM3RGgxVDNxVHJXTTFGckNVUkxLZVplZHE= (accessed on 20 June 2018).
  13. Nybom, H. Comparison of different nuclear DNA markers for estimating intraspecific genetic diversity in plants. Mol. Ecol. 2004, 13, 1143–1155. [Google Scholar] [CrossRef] [PubMed]
  14. Yang, Y.; Meng, H.; Wu, Y.; Chen, B.; Gan, B.C. Primer screening of SRAP molecular marker in Dalbergia odorifera. Acta Agric. Jiangxi. 2011, 23, 29–31. [Google Scholar]
  15. Fregene, M.A.; Suarez, M.; Mkumbira, J.; Kulembeka, H.; Ndedya, E.; Kulaya, A.; Mitchel, S.; Gullberg, U.; Rosling, H.; Dixon, A.G.O.; et al. Simple sequence repeat marker diversity in cassava landraces: Genetic diversity and differentiation in an asexually propagated crop. Theor. Appl. Genet. 2003, 107, 1083–1093. [Google Scholar] [CrossRef] [PubMed]
  16. Powell, W.; Morgante, M.; Andre, C.; Hanafey, M.; Vogel, J.; Tingey, S.; Rafalski, A. The comparison of RFLP, RAPD, AFLP and SSR (microsatellite) markers for germplasm analysis. Mol. Breed. 1996, 2, 225–238. [Google Scholar] [CrossRef]
  17. Dai, F.; Tang, C.; Wang, Z.; Luo, G.; He, L.; Yao, L. De novo assembly, gene annotation, and marker development of mulberry (Morus atropurpurea) transcriptome. Tree. Genet. Genomes. 2015, 11, 26. [Google Scholar] [CrossRef]
  18. Huang, J.; Guo, X.; Hao, X.; Zhang, W.; Chen, S.; Huang, R.; Gresshoff, P.M.; Zheng, Y. De novo sequencing and characterization of seed transcriptome of the tree legume Millettia pinnata for gene discovery and SSR marker development. Mol. Breed. 2016, 36, 75. [Google Scholar] [CrossRef]
  19. Taheri, S.; Lee Abdullah, T.; Yusop, M.; Hanafi, M.; Sahebi, M.; Azizi, P.; Shamshiri, R. Mining and development of novel SSR markers using next generation sequencing (NGS) data in plants. Molecules 2018, 23, 399. Available online: https://www.mdpi.com/1420-3049/23/2/399 (accessed on 2 January 2019). [CrossRef] [PubMed]
  20. Dervishi, A.; Jakše, J.; Ismaili, H.; Javornik, B.; Štajner, N. Comparative assessment of genetic diversity in Albanian olive (Olea europaea L.) using SSRs from anonymous and transcribed genomic regions. Tree Genet. Genomes 2018, 14. [Google Scholar] [CrossRef]
  21. Dong, M.; Wang, Z.; He, Q.; Zhao, J.; Fan, Z.; Zhang, J. Development of EST-SSR markers in Larix principis-rupprechtii Mayr and evaluation of their polymorphism and cross-species amplification. Trees 2018. [Google Scholar] [CrossRef]
  22. Li, N.; Zheng, Y.; Ding, H.; Li, H.; Peng, H.; Jiang, B.; Li, H. Development and validation of SSR markers based on transcriptome sequencing of Casuarina equisetifolia. Trees-Struct. Funct. 2018, 32, 41–49. [Google Scholar] [CrossRef]
  23. Liu, F.-M.; Hong, Z.; Yang, Z.-J.; Zhang, N.-N.; Liu, X.-J.; Xu, D.-P. De novo transcriptome analysis of Dalbergia odorifera and transferability of SSR markers developed from the transcriptome. Forests 2019, 10, 98. Available online: https://www.mdpi.com/1999-4907/10/2/98 (accessed on 28 January 2019). [CrossRef]
  24. Untergasser, A.; Cutcutache, I.; Koressaar, T.; Ye, J.; Faircloth, B.C.; Remm, M.; Rozen, S.G. Primer3--new capabilities and interfaces. Nucleic Acids Res. 2012, 40, e115. [Google Scholar] [CrossRef] [PubMed]
  25. Van Oosterhout, C.; Hutchinson, W.F.; Wills, D.P.M.; Shipley, P. Micro-checker: Software for identifying and correcting genotyping errors in microsatellite data. Mol. Ecol. Notes 2004, 4, 535–538. [Google Scholar] [CrossRef]
  26. Popgene, Version 1.32; The User-Friendly Shareware for Population Genetic Analysis Molecular Biology and Biotechnology Center. University of Alberta Edmonton. Available online: http://www.ualberta.ca/~fyeh (accessed on 23 November 2017).
  27. Nagy, S.; Poczai, P.; Cernák, I.; Gorji, A.M.; Hegedűs, G.; Taller, J. PICcalc: An online program to calculate polymorphic information content for molecular genetic studies. Biochem. Genet. 2012, 50, 670–672. [Google Scholar] [CrossRef] [PubMed]
  28. Peakall, R.; Smouse, P.E. GenAlEx 6.5: Genetic analysis in Excel. Population genetic software for teaching and research—An update. Bioinformatics 2012, 28, 2537–2539. [Google Scholar] [CrossRef] [PubMed]
  29. Evanno, G.; Regnaut, S.; Goudet, J. Detecting the number of clusters of individuals using the software structure: A simulation study. Mol. Ecol. 2010, 14, 2611–2620. [Google Scholar] [CrossRef] [PubMed]
  30. Porras-Hurtado, L.; Ruiz, Y.; Santos, C.; Phillips, C.; Carracedo, A.; Lareu, M.V. An overview of STRUCTURE: Applications, parameter settings, and supporting software. Front. Genet. 2013, 4, 98. [Google Scholar] [CrossRef] [PubMed]
  31. Earl, D.A.; Vonholdt, B.M. STRUCTURE HARVESTER: A website and program for visualizing STRUCTURE output and implementing the Evanno method. Conserv. Genet. Resour. 2012, 4, 359–361. [Google Scholar] [CrossRef]
  32. Kopelman, N.M.; Jonathan, M.; Mattias, J.; Rosenberg, N.A.; Itay, M. Clumpak: A program for identifying clustering modes and packaging population structure inferences across K. Mol. Ecol. Resour. 2015, 15, 1179–1191. [Google Scholar] [CrossRef] [PubMed]
  33. Kumar, S.; Stecher, G.; Li, M.; Knyaz, C.; Tamura, K. MEGA X: Molecular evolutionary genetics analysis across computing platforms. Mol. Biol. Evol. 2018, 35, 1547–1549. [Google Scholar] [CrossRef] [PubMed]
  34. Li, X.; Li, M.; Hou, L.; Zhang, Z.; Pang, X.; Li, Y. De novo transcriptome assembly and population genetic analyses for an endangered Chinese endemic Acer miaotaiense (Aceraceae). Genes 2018, 9, 378. [Google Scholar] [CrossRef] [PubMed]
  35. Szmidt, A.E.; Wang, X.R.; Lu, M.Z. Empirical assessment of allozyme and RAPD variation in Pinus sylvestris (L.) using haploid tissue analysis. Heredity 1996, 76, 412–420. [Google Scholar] [CrossRef]
  36. Torales, S.L.; Rivarola, M.; Pomponio, M.F.; Gonzalez, S.; Acuña, C.V.; Fernández, P.; Lauenstein, D.L.; Verga, A.R.; Hopp, H.E.; Paniego, N.B.; et al. De novo assembly and characterization of leaf transcriptome for the development of functional molecular markers of the extremophile multipurpose tree species Prosopis alba. BMC. Genom. 2013, 14, 705. [Google Scholar] [CrossRef] [PubMed]
  37. Sathyanarayana, N.; Pittala, R.K.; Tripathi, P.K.; Chopra, R.; Singh, H.R.; Belamkar, V.; Bhardwaj, P.K.; Doyle, J.J.; Egan, A.N. Transcriptomic resources for the medicinal legume Mucuna pruriens: De novo transcriptome assembly, annotation, identification and validation of EST-SSR markers. BMC Genom. 2017, 18, 409. [Google Scholar] [CrossRef] [PubMed]
  38. Liu, S.; Liu, H.; Wu, A.; Hou, Y.; An, Y.; Wei, C. Construction of fingerprinting for tea plant (Camellia sinensis) accessions using new genomic SSR markers. Mol. Breed. 2017, 37, 93. [Google Scholar] [CrossRef]
  39. Chen, H.; Chen, X.; Tian, J.; Yang, Y.; Liu, Z.; Hao, X.; Wang, L.; Wang, S.; Liang, J.; Zhang, L.; et al. Development of gene-based SSR markers in rice bean (Vigna umbellata L.) based on transcriptome data. PLoS ONE 2016, 11, e0151040. [Google Scholar] [CrossRef] [PubMed]
  40. Yan, Z.; Wu, F.; Luo, K.; Zhao, Y.; Yan, Q.; Zhang, Y.; Wang, Y.; Zhang, J. Cross-species transferability of EST-SSR markers developed from the transcriptome of Melilotus and their application to population genetics research. Sci. Rep.-UK 2017, 7, 17959. [Google Scholar] [CrossRef] [PubMed]
  41. Vu Thi Thu, H. Genetic diversity among endangered rare Dalbergia cochinchinensis (Fabaceae) genotypes in Vietnam revealed by random amplified polymorphic DNA (RAPD) and inter simple sequence repeats (ISSR) markers. Afr. J. Biotechnol. 2012, 11. [Google Scholar] [CrossRef]
  42. Phong, D.T.; Hien, V.T.; Thanh, T.T.; Tang, D.V. Comparison of RAPD and ISSR markers for assessment of genetic diversity among endangered rare Dalbergia oliveri (Fabaceae) genotypes in Vietnam. Genet. Mol. Resh. 2011, 10, 2382–2393. [Google Scholar] [CrossRef] [PubMed]
  43. Liu, S.; An, Y.; Li, F.; Li, S.; Liu, L.; Zhou, Q.; Zhao, S.; Wei, C. Genome-wide identification of simple sequence repeats and development of polymorphic SSR markers for genetic studies in tea plant (Camellia sinensis). Mol. Breed. 2018, 38, 59. [Google Scholar] [CrossRef]
  44. Väli, Ü.; Einarsson, A.; Waits, L.; Ellegren, H. To what extent do microsatellite markers reflect genome-wide genetic diversity in natural populations? Mol. Ecol. 2008, 17, 3808–3817. [Google Scholar] [CrossRef] [PubMed]
  45. Ferrer, M.M.; Eguiarte, L.E.; Montana, C. Genetic structure and outcrossing rates in Flourensia cernua (Asteraceae) growing at different densities in the South-western Chihuahuan Desert. Ann. Bot. 2004, 94, 419–426. [Google Scholar] [CrossRef] [PubMed]
  46. White, T.L.; Adams, W.T.; Neale, D.B. Forest Genetics; CABI Publishing: Boston, MA, USA, 2007; pp. 149–186. [Google Scholar]
  47. Gadissa, F.; Tesfaye, K.; Dagne, K.; Geleta, M. Genetic diversity and population structure analyses of Plectranthus edulis (Vatke) Agnew collections from diverse agro-ecologies in Ethiopia using newly developed EST-SSRs marker system. BMC Genet. 2018, 19, 92. [Google Scholar] [CrossRef] [PubMed]
  48. Kang, S.S.; Chung, M.G. Genetic variation and population structure in Korean endemic species: IV. Hemerocallis hakuunensis (Liliaceae). J. Plant. Res. 1997, 110, 209–217. [Google Scholar] [CrossRef]
  49. Zhong, T.; Zhao, G.; Lou, Y.; Lin, X.; Guo, X. Genetic diversity analysis of Sinojackia microcarpa, a rare tree species endemic in China, based on simple sequence repeat markers. J. For. Res. 2018. [Google Scholar] [CrossRef]
  50. Gichira, A.W.; Li, Z.-Z.; Saina, J.K.; Hu, G.-W.; Gituru, R.W.; Wang, Q.-F.; Chen, J.-M. Demographic history and population genetic structure of Hagenia abyssinica (Rosaceae), a tropical tree endemic to the Ethiopian highlands and eastern African mountains. Tree Genet. Genomes 2017, 13. [Google Scholar] [CrossRef]
  51. Hamrick, J.L.; Godt, M.J.W.; Sherman-Broyles, S.L. Factors influencing levels of genetic diversity in woody plant species. New For. 1992, 6, 95–124. [Google Scholar] [CrossRef]
  52. Mihretie, Z.; Schueler, S.; Konrad, H.; Bekele, E.; Geburek, T. Patterns of genetic diversity of Prunus africana in Ethiopia: Hot spot but not point of origin for range-wide diversity. Tree Genet. Genomes 2015, 11, 118. [Google Scholar] [CrossRef]
  53. Boaventura-Novaes, C.R.D.; Novaes, E.; Mota, E.E.S.; Telles, M.P.C.; Coelho, A.S.G.; Chaves, L.J. Genetic drift and uniform selection shape evolution of most traits in Eugenia dysenterica DC. (Myrtaceae). Tree Genet. Genomes 2018, 14, 76. [Google Scholar] [CrossRef]
  54. Addisalem, A.B.; Duminil, J.; Wouters, D.; Bongers, F.; Smulders, M.J.M. Fine-scale spatial genetic structure in the frankincense tree Boswellia papyrifera (Del.) Hochst. and implications for conservation. Tree Genet. Genomes 2016, 12, 86. [Google Scholar] [CrossRef]
  55. Hartvig, I.; So, T.; Changtragoon, S.; Tran, H.T.; Bouamanivong, S.; Theilade, I.; Kjær, E.D.; Nielsen, L.R. Population genetic structure of the endemic rosewoods Dalbergia cochinchinensis and D. oliveri at a regional scale reflects the Indochinese landscape and life-history traits. Ecol. Evol. 2018, 8, 530–545. [Google Scholar] [CrossRef] [PubMed]
  56. Zhai, S.H.; Yin, G.S.; Yang, X.H. Population genetics of the endangered and wild edible plant Ottelia acuminata in southwestern China using novel SSR markers. Biochem. Genet. 2018, 56, 235–254. [Google Scholar] [CrossRef] [PubMed]
  57. Vu, D.-D.; Bui, T.T.-X.; Nguyen, M.-D.; Shah, S.N.M.; Vu, D.-G.; Zhang, Y.; Nguyen, M.-T.; Huang, X.-H. Genetic diversity and conservation of two threatened dipterocarps (Dipterocarpaceae) in southeast Vietnam. J. For. Res. 2018. [Google Scholar] [CrossRef]
  58. Mutegi, E.; Snow, A.A.; Rajkumar, M.; Pasquet, R.; Ponniah, H.; Daunay, M.-C.; Davidar, P. Genetic diversity and population structure of wild/weedy eggplant (Solanum insanum, Solanaceae) in southern India: Implications for conservation. Am. J. Bot. 2015, 102, 140–148. [Google Scholar] [CrossRef] [PubMed]
  59. Institute of Botany, the Chinese Academy of Sciences. Flora Reipublicae Popularis Sinicae; Science Press: Beijing, China, 1994; Volume 40, p. 114. [Google Scholar]
  60. The, S.N. A review on the medicinal plant Dalbergia odorifera species: Phytochemistry and biological activity. Evid-Based. Complement. Altern. 2017. [Google Scholar] [CrossRef]
  61. Moritsuka, E.; Chhang, P.; Tagane, S.; Toyama, H.; Sokh, H.; Yahara, T.; Tachida, H. Genetic variation and population structure of a threatened timber tree Dalbergia cochinchinensis in Cambodia. Tree Genet. Genomes 2017, 13, 115. [Google Scholar] [CrossRef]
  62. Schaal, B.A.; Hayworth, D.A.; Olsen, K.M.; Rauscher, J.T.; Smith, W.A. Phylogeographic studies in plants: Problems and prospects. Mol. Ecol. 1998, 7, 465–474. [Google Scholar] [CrossRef]
  63. Slatkin, M. Gene flow and the geographic structure of natural populations. Science 1987, 236, 787–792. [Google Scholar] [CrossRef] [PubMed]
  64. Forest, F.; Grenyer, R.; Rouget, M.; Davies, T.J.; Cowling, R.M.; Faith, D.P.; Balmford, A.; Manning, J.C.; Proches, S.; van der Bank, M.; et al. Preserving the evolutionary potential of floras in biodiversity hotspots. Nature 2007, 445, 757–760. [Google Scholar] [CrossRef] [PubMed]
Figure 1. Geographic location of seven investigated D. odorifera populations collected from Hainan Island in China. P-HNQS—population of Wenchang city and Sansha city in Hainan province, P-HNHK—population of Haikou city, P-HNBS—population of Baisha city, P-HNDF—population of Dongfang city, P-HNLD—population of Ledong autonomous county, P-HNCJ—population of Changjiang autonomous county, P-HNWZS—population of Wuzhisan city. The pie charts estimated genetic structure of the seven populations based on STRUCTURE analysis with cluster number of two, in each chart, different color represents a different cluster accounted in each population.
Forests 10 00225 g001
Figure 2. Results of STRUCTURE analysis for 42 D. odorifera individuals based on microsatellite data. (a) Estimation of population using mean of estimated lnP(D) (log probability of data) with cluster number (K) ranged from one to seven. (b) Estimation of population using lnP(D)-derived delta K with cluster number (K) ranged from one to seven. (c) Estimated genetic structure of the seven populations based on STRUCTURE analysis with cluster number (K) of two. In each plot, different color represents a different cluster and black segments separate the populations.
Forests 10 00225 g002
Figure 3. Relationships among the seven wild D. odorifera populations in Hainan Island. (a) Principal coordinate analysis (PCoA) based on pairwise G’ST (Hedrick’s standardized Gst, analog of Fst, adjusted for bias), Coord.1 (63.25%): The first principal coordinate, explained 63.25% of variation; Coord.2 (22.13%): The second principal coordinate, explained 22.13% of variation. (b) Neighbour-joining (NJ) tree based on Nei’s unbiased genetic distance among seven populations of D. odorifera in Hainan Island.
Forests 10 00225 g003
Figure 4. Mantel tests for pairwise G’ST matrix correspondence on relationships between geographic and genetic distance for D. odorifera populations in Hainan Island. (a) Relationships between pairwise G’ST and geographic distance. There is a positive relationship between the two elements (Rxy: 27.7%, p < 0.05). (b) Relationships between pairwise G’ST and Nei’s unbiased genetic distance. There is a positive relationship between the two elements (Rxy: 91.2%, p < 0.05).
Forests 10 00225 g004
Table 1. Geographical location of seven investigated D. odorifera populations in Hainan Island of China.
PopulationSizeOriginStatusAltitude (m)Latitude (N)Longitude (E)
HNQS7Wenchang city and Sansha cityWild, Qiong mountain20–8019°37′–19°53′110°19′–110°23′
HNHK3Haikou cityWild, strand plain10–8020°04′–20°32′110°21′–109°21′
HNBS5Baisha autonomous countyWild, Li mu mountain150–25019°12′–19°23′109°7′–109°24′
HNDF5Dongfang cityWild, strand plain5–10019°6′–19°17′108°37′–108°39′
HNLD7Ledong autonomous countyWild, Jianfeng mountain35–8018°34′–18°42′108°49′–109°08′
HNCJ5Changjiang autonomous countyWild, Bawang mountains125–18519°4′–19°08′109°03′–109°12′
HNWZS10Wuzhisan cityWild, Wuzhisan mountain60–15018°48′–18°53′109°30′–109°67′
Table 2. Characteristics of 19 SSR (simple sequence repeat) markers developed for D. odorifera.
LocusIDRepeat MotifForward Primer (5′-3′)Reverse Primer (3′-5′)Product Size (bp)SSR PositionTm (°C)
S01c102105_g1(ATA)6AGTCCCGCCCACAAAATCATCTGGTCAGTCATTCCCCCAC252–258Unknown60
S02c11754_g1(AAG)6GGTCCCTGACTCACTGAAGCCAACCTCTCTCTGCAGAACCA269–2755′UTR60
S03c1204_g1(ATA)6GCACGTGGTCAAAGCAATCAATGAGCCCCTTCTGCACTTC263–266Unknown60
S04c25868_g1(GAT)6GCTGTGGAGTCACGTTCTCATCCCCACAGAATCACAAGCC278–2873′UTR60
S07c29390_g1(CCT)6GCCAATGACATAATGGGCGGTGCAGAGAGTCAGGAGCTCT226–229CDS60
S08c31361_g1(TGT)6GGAAGAGAAATGGAGGGTAGCTTGCCAGACAACCAGAATGCT305–320Unknown60
S09c33497_g1(CAT)6ACCCTCCTCCTCCACCTTTTACCGGCTTCAGTGATTGGTT230–2395′UTR60
S10c40172_g1(TGC)7CACGTACCCAACCGTCAAGATCCGACGACCACCTAATCCT261–2735′UTR60
S11c40452_g1(ATC)6AAAAAGCGAGGACTACGGCATGGAGAAGCAGTGCTCGTTT224–227Unknown60
S12c34672_g2(GAT)7GGTGAACAAGCTGGAGTGGAAAGCCCAGCATCTAAACCCC259–271CDS60
S21c56000_g1(TCCC)6GAGCCTTGAGTTCACCTCCCTTGGGTGTGAGATTGAGGGC238–2505′UTR60
S22c53146_g1(TC)10CCACCGATCTTAACCTCCGGACTACAAGTGCGTGTGACCC254–260Unknown60
S23c56684_g2(TC)10TGGCGTTGACTTCCAGCATTGAGCAGTGTCAGCATGATGC278–2803′UTR60
S24c59001_g1(CTA)7GCTGCAAATGCCAGTGCTTACGCTGTTGTCAGTGCATTGG232–241Unknown60
S26c60831_g5(GTT)7CCAATCCCACCAGTGAGGAGGCAGCACCTCTGAGACAAGT241–247CDS60
S27c49315_g1(TAC)7GAACCTTTCCTTCTGCGCCTCCTATGAAGCGTGTGCATGC266–2723′UTR60
S28c63495_g1(TAC)7ACAGCATTTGTGTTTGTGCACAGCTGCGCTCTCATTCCTA246–249Unknown60
S29c57231_g1(TAT)7TCCCCGTTCCTCTCTCTCAGGGACTGTCACATGGCACTCA150–1685′UTR60
S30c48304_g3(TGT)7TGCCTTGATCCGCTGAGATCTCCCAAAATCGATGCAAAGCA246–2585′UTR59
Table 3. Diversity statistics of the 19 SSR loci across 42 D. odorifera samples.
LocusNaNeHoHeGDPICFSTNmFFNAPHWE a
S0131.990.380.500.500.410.082.790.230.080.108 ns
S0221.050.050.050.050.050.073.58−0.020.000.874 ns
S0321.800.380.450.440.350.161.300.140.040.355 ns
S0431.710.290.420.420.370.112.080.310.09 *0.002 **
S0721.830.360.460.450.350.121.850.210.070.173 ns
S0841.380.240.280.270.260.054.680.130.030.001 **
S0932.570.360.620.610.540.171.220.420.16 *0.001 ***
S1031.970.480.500.490.440.092.650.030.010.412 ns
S1121.750.380.430.430.340.141.480.110.030.481 ns
S1221.210.140.170.170.160.131.700.170.030.268 ns
S2152.790.450.650.640.600.102.200.300.12 *0.067 ns
S2241.560.430.360.360.330.111.96−0.19−0.050.793 ns
S2321.020.020.020.020.020.063.79−0.010.000.938 ns
S2432.050.290.520.510.460.220.870.440.15 *0.002 **
S2621.020.020.020.020.020.092.63−0.010.000.938 ns
S2731.270.210.210.210.190.092.42−0.010.000.032 *
S2821.800.260.420.440.350.102.190.250.080.105 ns
S2941.710.260.420.420.350.121.750.370.11 *0.000 ***
S3031.810.330.450.450.370.037.770.250.080.135 ns
Mean2.841.700.280.370.360.310.112.580.160.03
Na—observed number of alleles, Ne—effective number of alleles, Ho—observed heterozygosity, He—expected heterozygosity, GD—Nei’s gene diversity, PIC—polymorphic information content, FST—genetic differentiation coefficient, Nm—Gene flow, estimated from Fst, Nm = [(1/Fst) − 1]/4, F Wright’s (1978) fixation index, FNA—frequency of null alleles, * p < 0.05, likely contained null alleles, PHWE a p-value for deviation from Hardy-Weinberg equilibrium: ns not significant, * p < 0.05, ** p < 0.01, *** p < 0.001.
Table 4. Summary of different D. odorifera population diversity statistics averaged over the 19 SSR loci.
PopulationSizeAllelesNaNeNpHoHeGDFISPPB %
HNQS7402.111.5210.250.310.280.0973.68
HNHK3351.841.5400.260.340.280.0068.42
HNBS5402.111.6910.310.360.320.0278.95
HNDF5412.161.5930.380.370.33−0.1189.47
HNLD7462.421.6420.260.380.350.2089.47
HNCJ5402.111.7700.360.400.36−0.0378.95
HNWZS10442.321.6310.240.340.330.2278.95
Mean5.25402.151.63-0.290.360.320.0679.70
Total a42 b562.841.70-0.280.370.360.21100.00
Population see Table 1, Size—number of sampled individuals, Alleles—total number of detected alleles, Na—observed mean number of alleles, Ne—mean effective number of alleles, Np—number of private alleles, Ho—observed heterozygosity, He—expected heterozygosity, GD—Nei’s gene diversity, FIS—inbreeding coefficient, PPB %—the percentage of polymorphic loci, a diversity indices averaged over the 19 loci across all D. odorifera populations, b total number of sampled individuals.
Table 5. Analysis of molecular variance (AMOVA) for six populations of D. odorifera.
Sourced.f.Sum of SquareMean of SquareVariance ComponentsPercentage of VariationFSTFIS
Among populations527.8645.5730.1113%
Within populations
Among Individuals33136.8934.1480.71520%
Within Individuals39106.0002.7182.71877%
Total77270.756 3.544100%0.03 *0.21 ***
d.f. degrees of freedom, population HNHK was not in this analysis for individuals below five, FST and FIS is based on standard permutation across the full data set, * p < 0.05, *** p < 0.001.
Table 6. Pairwise Genetic Differentiation Index (Fst) between the seven populations.
PopulationHNQSHNHKHNBSHNDFHNLDHNCJHNWZS
HNQS
HNHK0.088
HNBS0.0950.055
HNDF0.1150.0900.062
HNLD0.0740.0550.0430.051
HNCJ0.0710.1000.0870.0900.042
HNWZS0.0610.0780.0510.0510.0440.054
Population see Table 1.

