Article

Soil Nematode Fauna and Microbial Characteristics in an Early-Successional Forest Ecosystem

by
Marek Renčo
1,*,
Andrea Čerevková
1 and
Erika Gömöryová
2
1
Institute of Parasitology SAS, Hlinkova 3, 040 01 Košice, Slovakia
2
Faculty of Forestry, Technical University in Zvolen, TG Masaryka 24, 960 53 Zvolen, Slovakia
*
Author to whom correspondence should be addressed.
Forests 2019, 10(10), 888; https://doi.org/10.3390/f10100888
Submission received: 12 August 2019 / Revised: 1 October 2019 / Accepted: 2 October 2019 / Published: 8 October 2019
(This article belongs to the Special Issue Biodiversity Conservation in Managed Forests)

Abstract

:
Windstorms can often decrease the diversity of native local biota in European forests. The effects of windstorms on the species richness of flora and fauna in coniferous forests of natural reserves are well established, but the effects on biotas in productive deciduous forests have been less well studied. We analyzed the impact of windstorms on the diversity and abundance of soil nematode communities and microbial activity and their relationships with the succession of plant species and basic soil physicochemical properties 12 and 36 months after a windstorm in Fagus sylvatica forests. The relationships were investigated in cleared early-successional forest ecosystems and at undamaged forest sites as a control. The windstorm significantly affected total nematode abundance, number of nematode species, and the diversity and abundance of all nematode functional guilds, but no functional guilds disappeared after the disturbance. The abundance of several nematode taxa but not total nematode abundance was positively correlated with soil-moisture content. Indices of the nematode communities were inconsistent between sites due to their variable ability to identify ecosystem disturbance 12 months after the storm. In contrast, the metabolic activity of various functional groups identified ecosystem disturbance well throughout the study. Positive correlations were identified between the number of plant parasites and soil-moisture content and between carnivore abundance and soil pH. Positive mutual links of some nematode genera (mainly plant parasites) with the distribution of dominant grasses and herbs depended on the habitat. In contrast, microbial activity differed significantly between disturbed and undisturbed sites up to 36 months after the storm, especially soil basal respiration, N mineralization, and microbial biomass. Our results indicated different temporal responses for two groups of soil organisms to the destruction of the tree canopy. Soil nematodes reacted immediately, but changes in the microbial communities were visible much later after the disturbance.

1. Introduction

The loss of biodiversity continues on both regional and global scales across a wide range of ecosystems, due to the increasing intensity of disturbances and despite conservation efforts [1]. Windstorms, wildfires, floods, drought, and insect epidemics are the main natural disturbances in forests [2], creating so-called “early-successional forest ecosystems” (ESFEs) [3]. The relevance of these disturbances has tended to increase in recent decades because of their increasing occurrence, severity, frequency, and intensity worldwide associated with changes in climate, which are becoming increasingly obvious [4].
Successional changes begin immediately after a disturbance, due to the activities of the surviving organisms (e.g., animals, plants, and fungi), including plant growth and seed production. Initial conditions, however, generally vary, depending on the type of disturbance. Forest sites after severe disturbances are characterized by open environments not dominated by trees, which dramatically alter the site microclimate, including light conditions [3]. These changes lead to increased exposure to sunlight, more extreme temperatures (ground and air), higher air velocities, and lower levels of relative humidity and moisture in the litter and surface soil. Shifts in these environmental metrics favor some species but create suboptimal or intolerable conditions for others [3].
Windstorms in Europe were responsible for 53% of the total damage in forests from 1950–2000 [5]. Most European forests are intensively managed, so windstorm damage decreases the yield of recoverable timber, increases the cost of unscheduled cuttings, creates problems in forestry planning, and releases considerable amounts of carbon (C), as recently demonstrated [1,6]. Ecological studies after such disturbances have therefore focused primarily on plant-community development, tree regeneration, and the re-establishment of closed forest canopies [7,8,9]. Windstorms, however, have also destroyed forests in national parks and reserves across Europe that were developed to conserve the biodiversity of rare habitats, e.g., primeval forests or wetlands, and to encourage tourism and economic and social development in rural areas [5,10,11,12,13]. Two strong windstorms in 2004 and 2014 destroyed thousands of hectares of spruce forest in the Tatra National Park, Slovakia, both leading to extensive outbreaks of bark beetles [14,15]. Extensive research in ESFEs with various management strategies has identified considerable changes to the microclimate, hydrology, stream morphology, slope erosion, plant communities, soil properties, and epigeic and edaphic macrofauna [9,16,17,18,19] including the characteristics of soil microbial and nematode communities [20,21]. The soil microbial and nematode communities at a site vary with the tree species [22,23,24], with the largest differences being between broadleaved and coniferous species [22,25,26]. Information on the general response of these closely related groups of soil biota to such disturbances in a managed deciduous forest is nevertheless lacking, and the successional patterns and relationships of these groups of soil microfauna after a disturbance have not recently been surveyed.
We studied the nematode communities and microbial characteristics at disturbed and undisturbed sites in deciduous beech forests 12 and 36 months after a windstorm to evaluate (1) whether soil nematode communities and microbial activity were affected by changes in the aboveground ecosystem, (2) relationships between biotic and abiotic soil features, (3) possible mutual links between specific nematode genera and plant species associated with secondary succession of understory vegetation, and (4) selection amongst various parameters that could serve as indicators of changes in soil state throughout forest development.
Our previous study of acidic soils at windstorm-disturbed sites in natural montane Lariceto-Piceetum forests of the High Tatra National Park provided evidence that the windstorm strongly negatively influenced the activity and functional diversity of microbial communities [16], but had little effect on the community structure, diversity, and abundance of nematodes [21]. We tested the hypothesis that nematode communities and microbial activity would have the same pattern of change because the kind of natural disturbance was the same (windstorm), except for the neutral soils of the devastated deciduous productive Fagus sylvatica L. forests.

2. Materials and Methods

2.1. Site Selection

The study was carried out in the productive deciduous forests in the Volovské Mountains, Slovak Republic (620 m a.s.l.) affected by a severe windstorm in May 2014. A selective management system has been implemented in these forests to ensure the continuous natural renewal of the tree canopies. The entire area is characterized by a moderately warm climate with a mean annual temperature of 6.2 °C and mean annual precipitation of about 900 mm/y. The dominant soil type is a Cambisol with pH 6.5–6.8. Ten undisturbed forest sites (UNDSs) contained 70–80-year-old stands of 80% F. sylvatica, 15% Carpinus betulus L., and 5% Acer pseudoplatanus L., and the ground cover was dominated by common native species (Table 1) grown on beech litter accumulated around the trunks. The soil under the litter mats was strongly dominated by tree roots intermingled by roots of the understory plants. The composition of the tree species at ten windstorm-disturbed open sites (ESFEs) with the fallen trees removed was similar to that for the UNDSs (personal communication with forester). Traditional forestry activities were performed after the windstorm, i.e., removing fallen trees and planting new trees but not removing naturally grown seedlings.

2.2. Sampling Design

Soil samples for determining the characteristics of the nematodes and microbes were collected from the ten UNDS and ten ESFE sites, lying on the plane using a systematic design due to the spatial heterogeneity of the soil abiotic and biotic characteristics. The sites were within an area approximately 50 ha and were separated by a mean distance of 2 km. One sampling plot (10 × 10 m) was selected at each ESFE site where all trees were felled and removed, and one plot of the same size that was not destroyed by the storm was selected at each UNDS site near the corresponding ESFE site. Five subsamples were collected along each of two independent diagonal transects in each plot with a garden trowel to a depth of 20 cm, 12 and 36 months after the storm (May 2015 and 2017). The five subsamples from each transect were pooled to form two composite samples, so within-plot and within-sample variance could be quantified for each characteristic measured [27]. Elevation at the ten sites ranged from 570 to 620 m a.s.l.
The understory plant community was analyzed using the fixed “Phytosociological Relevé” method [28]. Five quadrats (1 × 1 m) were randomly selected in each sampling plot. Each of the five quadrats represented one frequency square. The vegetation was identified in situ. A small portion of each soil sample was used to analyse the physicochemical properties of the soil. Organic C and total nitrogen (N) contents were determined using a Vario MACRO Elemental Analyzer (CNS Version; Elementar, Hanau, Germany). Organic C content was determined based on the difference between total C and C bound in carbonates. SM content was estimated gravimetrically by oven-drying fresh soil at 105 °C overnight, and pH was measured potentiometrically in H2O suspension by a digital pH meter separately for each composite sample.

2.3. Nematodes

Each soil sample was gently homogenized by hand mixing, and stones were manually removed. The nematodes were extracted from 100 g of fresh soil by a combination of Cobb sieving and decanting [29] and a modified Baermann technique [30]. One hundred grams of soil from each representative sample were soaked in 1 L of tap water for 60 min to disrupt soil aggregates and promote nematode movement. The soaked sample was carefully passed through a 1-mm sieve (16 mesh) to remove plant parts and debris, and this suspension was passed through a 50-µm sieve (300 mesh) 2 min later to remove water and very fine soil particles. The nematodes were then extracted from the soil/water suspension by a set of two cotton-propylene filters in the Baermann funnels. Two filter trays were used per sample to limit material thickness to <0.5 cm. Suspensions containing the nematodes were collected after extraction for 24 h at room temperature. All nematodes were counted using a Leica S8APO stereomicroscope (Leica Microsystems, Singapore) (40 and 60 × magnification), and a total of 100 nematodes were randomly selected and identified to species (juveniles to genus) microscopically (100, 200, 400, 600, and 1000× magnification) using an Eclipse 90i Nikon light microscope (Nikon Instruments Europe BV, Amsterdam, The Netherlands). Total nematode abundance was expressed as number of individuals/100 g dry soil.
The nematodes were assigned to functional guilds integrating nematode feeding strategies: trophic groups [31] and the nematode colonizer-persister (c–p) scale [32]. Five nematode trophic groups were: bacterivores (Ba), fungivores (Fu), carnivores (Ca), omnivores (Om), and plant parasites (Pp). The Pp group included both obligatory and facultative plant parasites that may attack plants or feed on fungal mycelia. Colonizers-persisters characterizing nematode life strategies are classified on a scale of 1 to 5 [33]. C–p1 represents “r–strategists” (colonizers) with short life cycles, small eggs, high fecundity, high colonization ability, and high tolerance to disturbance, eutrophication, and anoxybiosis. Colonizers generally live in ephemeral habitats. At the other end of the scale, c–p5 nematodes represent “k–strategists” (persisters) with the longest generation times, largest bodies, lowest fecundities, and highest sensitivities to disturbance. Persisters are never dominant in a sample and generally live in stable habitats where they can become very abundant [33].
C–p scaling allows the calculation of the basal maturity index (MI) for cp–1 to cp–5 non-parasitic nematodes, the plant parasitic index (PPI) for plant parasites only [33], and the total maturity index (ΣMI) [34] for cp–1 to cp–5 combined free-living and plant-parasitic nematodes. The functional guilds allow the calculation of the enrichment index (EI), the basal index (BI), the structure index (SI), and the channel index (CI) proposed by Reference [35]. Species diversity was estimated using the Shannon-Weaver diversity index, H’spp [36], and the diversity of the trophic groups was estimated using the trophic diversity index TD [37]. The nematode channel ratio (NCR) was defined by Reference [38]. Total nematode biomass and functional metabolic footprints [39] were also calculated. The indices (except H´spp, TD, and NCR), biomass, and metabolic footprints were calculated using the online programme NINJA [40] https://sieriebriennikov.shinyapps.io/ninja/).

2.4. Microbial Biomass, Basal Respiration, N Mineralisation, Catalase Activity

Microbial biomass C (Cmic) content was determined following the procedure described by Reference [41]. Ten grammes of oven-dried equivalent (ODE) field-moist soil adjusted to 80% water-filled porosity was irradiated twice by microwaves at 400 J/g ODE soil to kill the microorganisms. Cooled samples were extracted with 0.5 M K2SO4, and the C content of the extract was quantified by oxidation with K2Cr2O7/H2SO4. The same procedure was performed with a non-irradiated sample. Cmic content was determined as (Cirradiated content − Cnonirradiated content)/KME, where KME represents the extraction efficiency (0.213) recommended by Reference [41]. Basal soil respiration was measured by estimating the amount of CO2 released from 50 g of fresh soil after a 24 h incubation at 22 °C and absorbed in 25 ml 0.05 N NaOH. The amount of carbonate was determined by the titration with 0.05 N HCl after the precipitation of carbonates by 5 ml BaCl2. N mineralisation was determined using the laboratory anaerobic incubation procedure described by [42]. Soil samples (5 g) under waterlogged conditions were incubated at 40 °C for 7 days to prevent nitrification, and NH4-N was measured by a colorimetric procedure. Catalase activity was measured 10 min after 20 ml 3% H2O2 was added to 10 g fresh soil sample based on the volume of discharged oxygen according to the method of [43].

2.5. Physiological Profiles of the Microbial Communities

The physiological profiles of the soil microbiota were determined using the methods described by Reference [44]. Each well in a BIOLOG EcoPlate received 150 μL of an extract prepared by suspending fresh soil in 0.85% NaCl and diluted 1:10, 000. The plates with the extracts were then incubated at 27 °C for 6 d, and absorbance at 590 nm was recorded every 24 h using a Sunrise Microplate reader (Tecan, Salzburg, Austria). The data were corrected against the initial readings at time zero and were expressed as optical densities of individual wells. The richness of the soil microbial community was determined as the number of substrates used by the microbial community, i.e., the number of wells with a positive response after background correction. Hill’s diversity index (Diver) [45] based on Equation (1) was calculated for estimating the diversities of the microbial functional groups:
Diver = 1/∑pi2
where pi is the ratio of the activity on a substrate to the sum of activities on all substrates.

2.6. Statistical Analysis

Nematode communities and microbial activity can be influenced by the understory vegetation, the identity and diversity of plant species, and soil characteristics, all of which can be influenced by severe disturbance of the forest floor. We consequently first identified differences in biotic and abiotic parameters between the ESFE and UNDS forests early (12 months) and later (36 months) after the storm. All nematological data, including the ecological and functional indices, and the metabolic footprints, soil properties, covers of understory plant species, and characteristics of microbial activity were calculated as means for the individual plots and sampling areas, and the means were compared using Tukey’s honestly significant difference post hoc test (p < 0.05 and <0.01) in PlotIt Ver. 3.2 (Scientific Programming Enterprises, Haslett, MI, USA). The data were log-transformed before the analysis to improve normality. Not all data were normally distributed, so the nonparametric Spearman’s correlation coefficient (rs) was calculated to test the relationships between the nematode-community and microbial indicators and the values of the soil properties at the study sites using STATISTICA v9.0 (StatSoft, Inc., Tulsa, OK, USA). Correlations at p < 0.05 were considered significant.
We then used multivariate analyses to evaluate the effect of disturbance on nematode-community composition, microbial characteristics, and the understory plant communities. A principal component analysis (PCA) was used to ordinate the sites by the abundance of nematode genera (pooled UNDS and ESFE records from two sampling dates) or the characteristics of microbial activity. Soil properties were used as supplementary variables to identify relationships with the abundances of the main nematode genera. A redundancy analysis (RDA) was performed to explore the distribution of plant species relative to the values of the soil properties.
Co-correspondence analysis (CoCA) of nematode genera and plant communities was performed as a single-step, to identify how nematode community composition was affected by plant community changes [46]. The single-step approach makes CoCA superior to canonical correspondence analysis (CCA) in this situation because the number of variables exceeds the number of cases by an order of magnitude [46]. CoCA maximizes the weighted covariance between weighted averaged species scores of one community and weighted averaged species scores of another community, focusing on their mutual links. With symmetric CoCA, we can test the hypothesis that the compositional variation is independent between the two communities, using a permutation test. Significant correlations were identified using a Monte Carlo permutation test between the two resemblance matrices. Our approach was modelled after the application of the CoCA to identify associations between the plant communities and the soil microbial communities [47] and between the plant communities and the soil nematode communities [48]. All multivariate analyses were performed using CANOCO (version 5.04) [49].

3. Results

3.1. Soil Physicochemical Properties

The soils at both sets of sites were neutral (pH/H2O 6.52–6.80). pH/H2O varied little both amongst and within sites and sampling dates. pH/H2O was lower in the ESFEs than the UNDSs, but the differences amongst sites and sampling dates were not significant (Table 2). SM content varied more than pH, both amongst and within sites and sampling dates. SM content was significantly lower in the UNDSs 12 months after the storm but higher in the ESFEs 36 months after the storm (p ˂ 0.05, p ˂ 0.01). The soil N and C contents fluctuated between 0.615–0.819 and 8.07–14.45%, respectively. C and N contents and the C/N ratio were higher in the UNDSs than the ESFEs 12 months after the storm, but not significantly. In contrast, the C and N contents and C/N ratio were significantly lower in the UNDSs than the ESFEs 36 months after the storm (p ˂ 0.05). RDA indicated a positive correlation between organic C and N contents, and soil pH was negatively correlated with SM, C, and N contents and the C/N ratio (Figure 1).

3.2. Analysis of the Plant Communities

The understory plant communities in the UNDSs mainly contained species of the original forest floor, and vegetation succession was not observed. The shade-tolerant grass Melica uniflora preferred dense canopies. The grasses Calamagrostis epigejos and Agrostis capillaris, which can grow in forests and in the open, and the herbs Galium odoratum and Chelipodium majus were most abundant at the UNDS sites (Table 1). The windstorm and removal of fallen trees, however, considerably affected the composition and succession of the plant species at the ESFE sites. G. odoratum, C. majus, and the shade-preferring Impatiens parviflora were suppressed in the ESFEs in the secondary succession. In contrast, the open tree canopies in the ESFEs provided ideal conditions for C. epigejos, A. capillaris, Potentilla reptans, and Euphorbia amygdaloides (Table 2, Figure 1). RDA indicated that the distributions of Luzula campestris and Urtica dioica were likely affected by the high C/N ratio and were negatively correlated with soil pH and the distributions of several other plant species. The abundances of G. odoratum, I. parviflora, and C. majus in the ESFEs were negatively correlated with C and N contents and the C/N ratio, and the abundances of other plant species were positively correlated with C and N contents (Figure 1).

3.3. Analysis of the Nematode and Microbial Communities

A total of 89 nematode species belonging to 64 genera were identified at the study sites (Table 3). A bacterivore, Amphidelus bryophilus, an omnivore, Aporcelaimus pachydermus, and a plant parasite, Paralongidorus rex, were new to the list of Slovak nematode fauna. The mean number of species at the sites ranged from 40 to 59 and was significantly higher in the UNDSs than the ESFEs for both sampling dates (p < 0.05 and ˂0.01) (Table 4). The total number of species and total mean nematode abundance were also higher in the UNDSs than the ESFEs (Table 3) for both sampling dates (p < 0.01) (Table 4). Overall nematode abundance in both habitats, however, was higher 36 months after the windstorm.
The nematode communities had typical dominance-diversity relationships in which few taxa were common and most were rare. Acrobeloides nanus, Alaimus primitivus, Tylencholaimus mirabilis, T. stecki, Helicotylenchus digonicus, Aglenchus agricola, Filenchus vulgaris, Malenchus bryophilus, and juveniles of Mesorhabditis, Rhabditis, and Dorylaimus were more abundant in the UNDSs. Cephalobus persegnis, A. nanus, H. digonicus, F. vulgaris, M. bryophilus, Mesodorylaimus bastiani, and juveniles of Rhabditis and Paratylenchus were more abundant in the ESFEs (Table 3). PCA indicated that the abundance of most nematode taxa tended to be higher at the UNDS sites and was positively affected by SM content (Figure 2). The composition of the nematode communities differed between the ESFE and UNDS sites, with large differences 12 months after the storm and smaller differences 36 months after the storm (Figure 3a). PCA axes 1 and 2 explained 29.1 and 26.6% of the variation in composition, respectively. Nematodes of the genera Cephalobus and Tripylina tended to be more abundant at high C contents, and Paratylenchus tended to be more abundant at high N contents. The genera Bunonema, Mononchus, and Prionchulus preferred soils with a higher pH (Figure 2).
Bacterial feeders (34 species) were the most abundant and diverse trophic group at the study sites, followed by plant parasites (16 species), omnivores (17 species), carnivores (12 species), and fungivores (10 species) in both ecosystems. The abundances of most of the nematode functional guilds (except Ba1,2, Ca3, and Pp4,5) differed significantly between the ESFE and UNDS sites (p < 0.05 and <0.01). The abundances of all functional guilds were significantly lower in the ESFEs than the UNDSs for both sampling dates, except for Ba3 and Om4 nematodes 36 months after the storm (Table 4).
Soil properties were significantly correlated with the nematode functional guilds (Table 5). The guilds could be divided into four groups depending on the effects of the soil properties. Pp2,3,4 and Ca3,4 were positively correlated with SM content and soil pH, respectively (p < 0.05 and <0.01). In contrast, Ba1,2 and Fu4 were negatively correlated with C and N contents and the C/N ratio (p < 0.05 and <0.01). Fu2 and Ba2 nematodes were correlated positively with SM content but negatively with C and N contents (p < 0.05). The Ba3,4, Om4,5, and Pp5 nematode guilds belonged to the fourth group, with neutral responses to the soil properties.
An analysis of the soil microbial characteristics as indicators found no significant differences between the ESFE and UNDS sites 12 months after the storm (Table 6). In contrast, basal respiration, N mineralization, and Cmic content were significantly lower in the ESFEs than the UNDSs 36 months after the windstorm (p < 0.05 and <0.01), confirming the PCA ordination of the samples (Figure 3b). PCA axes 1 and 2 explained 74.1 and 13.2% of the variation in composition, respectively. The soil properties were significantly correlated with the microbial indicators. Microbial biomass was positively correlated with soil pH, N mineralization was positively correlated with N content, and the richness and functional diversity of the microbial community were correlated positively with C and N contents and the C/N ratio and negatively with SM content (p < 0.05 and <0.01, Table 5).

3.4. Indices of the Nematode Communities

The indices of the nematode communities were generally inconsistent between sites due to their ability to identify ecosystem disturbance (Table 7). MI, H´spp, and TD (all p < 0.05) were the only indices that identified ecosystem disturbance 12 months after the storm. Total nematode biomass (p < 0.01) was lower in the ESFEs than the UNDSs, but increased over time, with no significant differences between sites 36 months after the windstorm. In contrast, the metabolic activities (metabolic footprints) of various nematode guilds (herbivores, bacterivores, fungivores, predators, and omnivores) identified ecosystem disturbance well throughout the study; activities were lower in the ESFEs than the UNDSs (p < 0.05), except for the omnivore footprints 36 months after the storm. EI, SI, BI, and the composite and structure footprints did not distinguish between the disturbed and undisturbed sites in the deciduous forests throughout the study.
The soil properties were significantly correlated with the nematode-community indices. MI for free-living nematodes was correlated positively with the C/N ratio, and PPI for plant parasites was correlated positively with SM content but negatively with the C/N ratio (Table 5). NCR and CI were positively correlated with N and C contents and the C/N ratio, and EI was negatively correlated with C and N contents (p < 0.05 and <0.01).

3.5. Relationships between Nematode Genera and Plant Species

Individual nematode genera were correlated with plant species in the succession depending on sampling date and habitat (Figure 4). The genera Miconchus, Aporcelaimellus, Acrobeloides, and Coslenchus were associated with some herb species, including C. majus, G. odoratum, and I. parviflora, and the genera Alaimus, Filenchus, Boleodorus, Mylonchulus, and Ditylenchus were associated with the shade-tolerant grass M. uniflora in the UNDSs. The ESFEs were populated by the heliophilous grasses C. epigeios and A. capillaris, which can grow in open vegetation and forests (von Oheimb et al., 2007). Some nematode plant parasites such as Paratylenchus, Helicotylenchus, and Malenchus, fungivores such as Aphelenchus, and bacterivores such as Plectus were associated with heliophilous grasses. The open ESFE sites were also relatively well covered by herbs such as E. amygdaloides, P. reptans, and U. dioica, with associated bacterivores Rhabditis, Cervidellus, Cephalobus, Aulolaimus, Wilsonema, and Prismatolaimus and many omnivorous nematode genera. In contrast, the predacious nematode Tripylina was most abundant in the UNDSs associated with the herb I. parviflora.

4. Discussion

Change is a characteristic of all natural systems, usually beginning with disturbances to the existing community. Disturbances in forests such as windstorms, wildfires, or insect epidemics create open environments not dominated by trees, commonly known as early successional ecosystems. Areas damaged by windstorms are usually cleared; disturbed stands are harvested for economic (recouping financial losses before wood quality deteriorates) and sanitary (damaged trees can attract insects that can attack undisturbed trees in their neighborhood) reasons. Removal of the forest canopy dramatically alters the site microclimate, mainly light and water conditions [3], that lead to changes in the composition, diversity, and habitat structure of understory plant species, which have potential implications for the soil biota [48]. Any disturbance of the soil will lead to a succession in bacteria and fungi and the associated food web, with an initial decrease and then an increase in biodiversity [50], in agreement with the authors of Reference [16] who found that the characteristics of microbial activity (basal respiration, microbial biomass, N mineralization, and catalase activity) were significantly lower in the acidic soil of a cleared site of a Lariceto-Piceetum coniferous forest immediately after a windstorm. In contrast, total nematode abundance, species diversity, and number of species were not altered soon after [21] and nine years after the windstorm [51]. The abundance of some trophic groups (bacterivores and herbivores) even slightly increased at cleared sites [21]. We thus tested the hypothesis that the responses of soil nematode communities and microbial activity to windstorm disturbance in the neutral soil of a deciduous F. sylvatica forest and secondary succession would have the same pattern as detected in the acidic soil of a coniferous Lariceto-Piceetum forest.
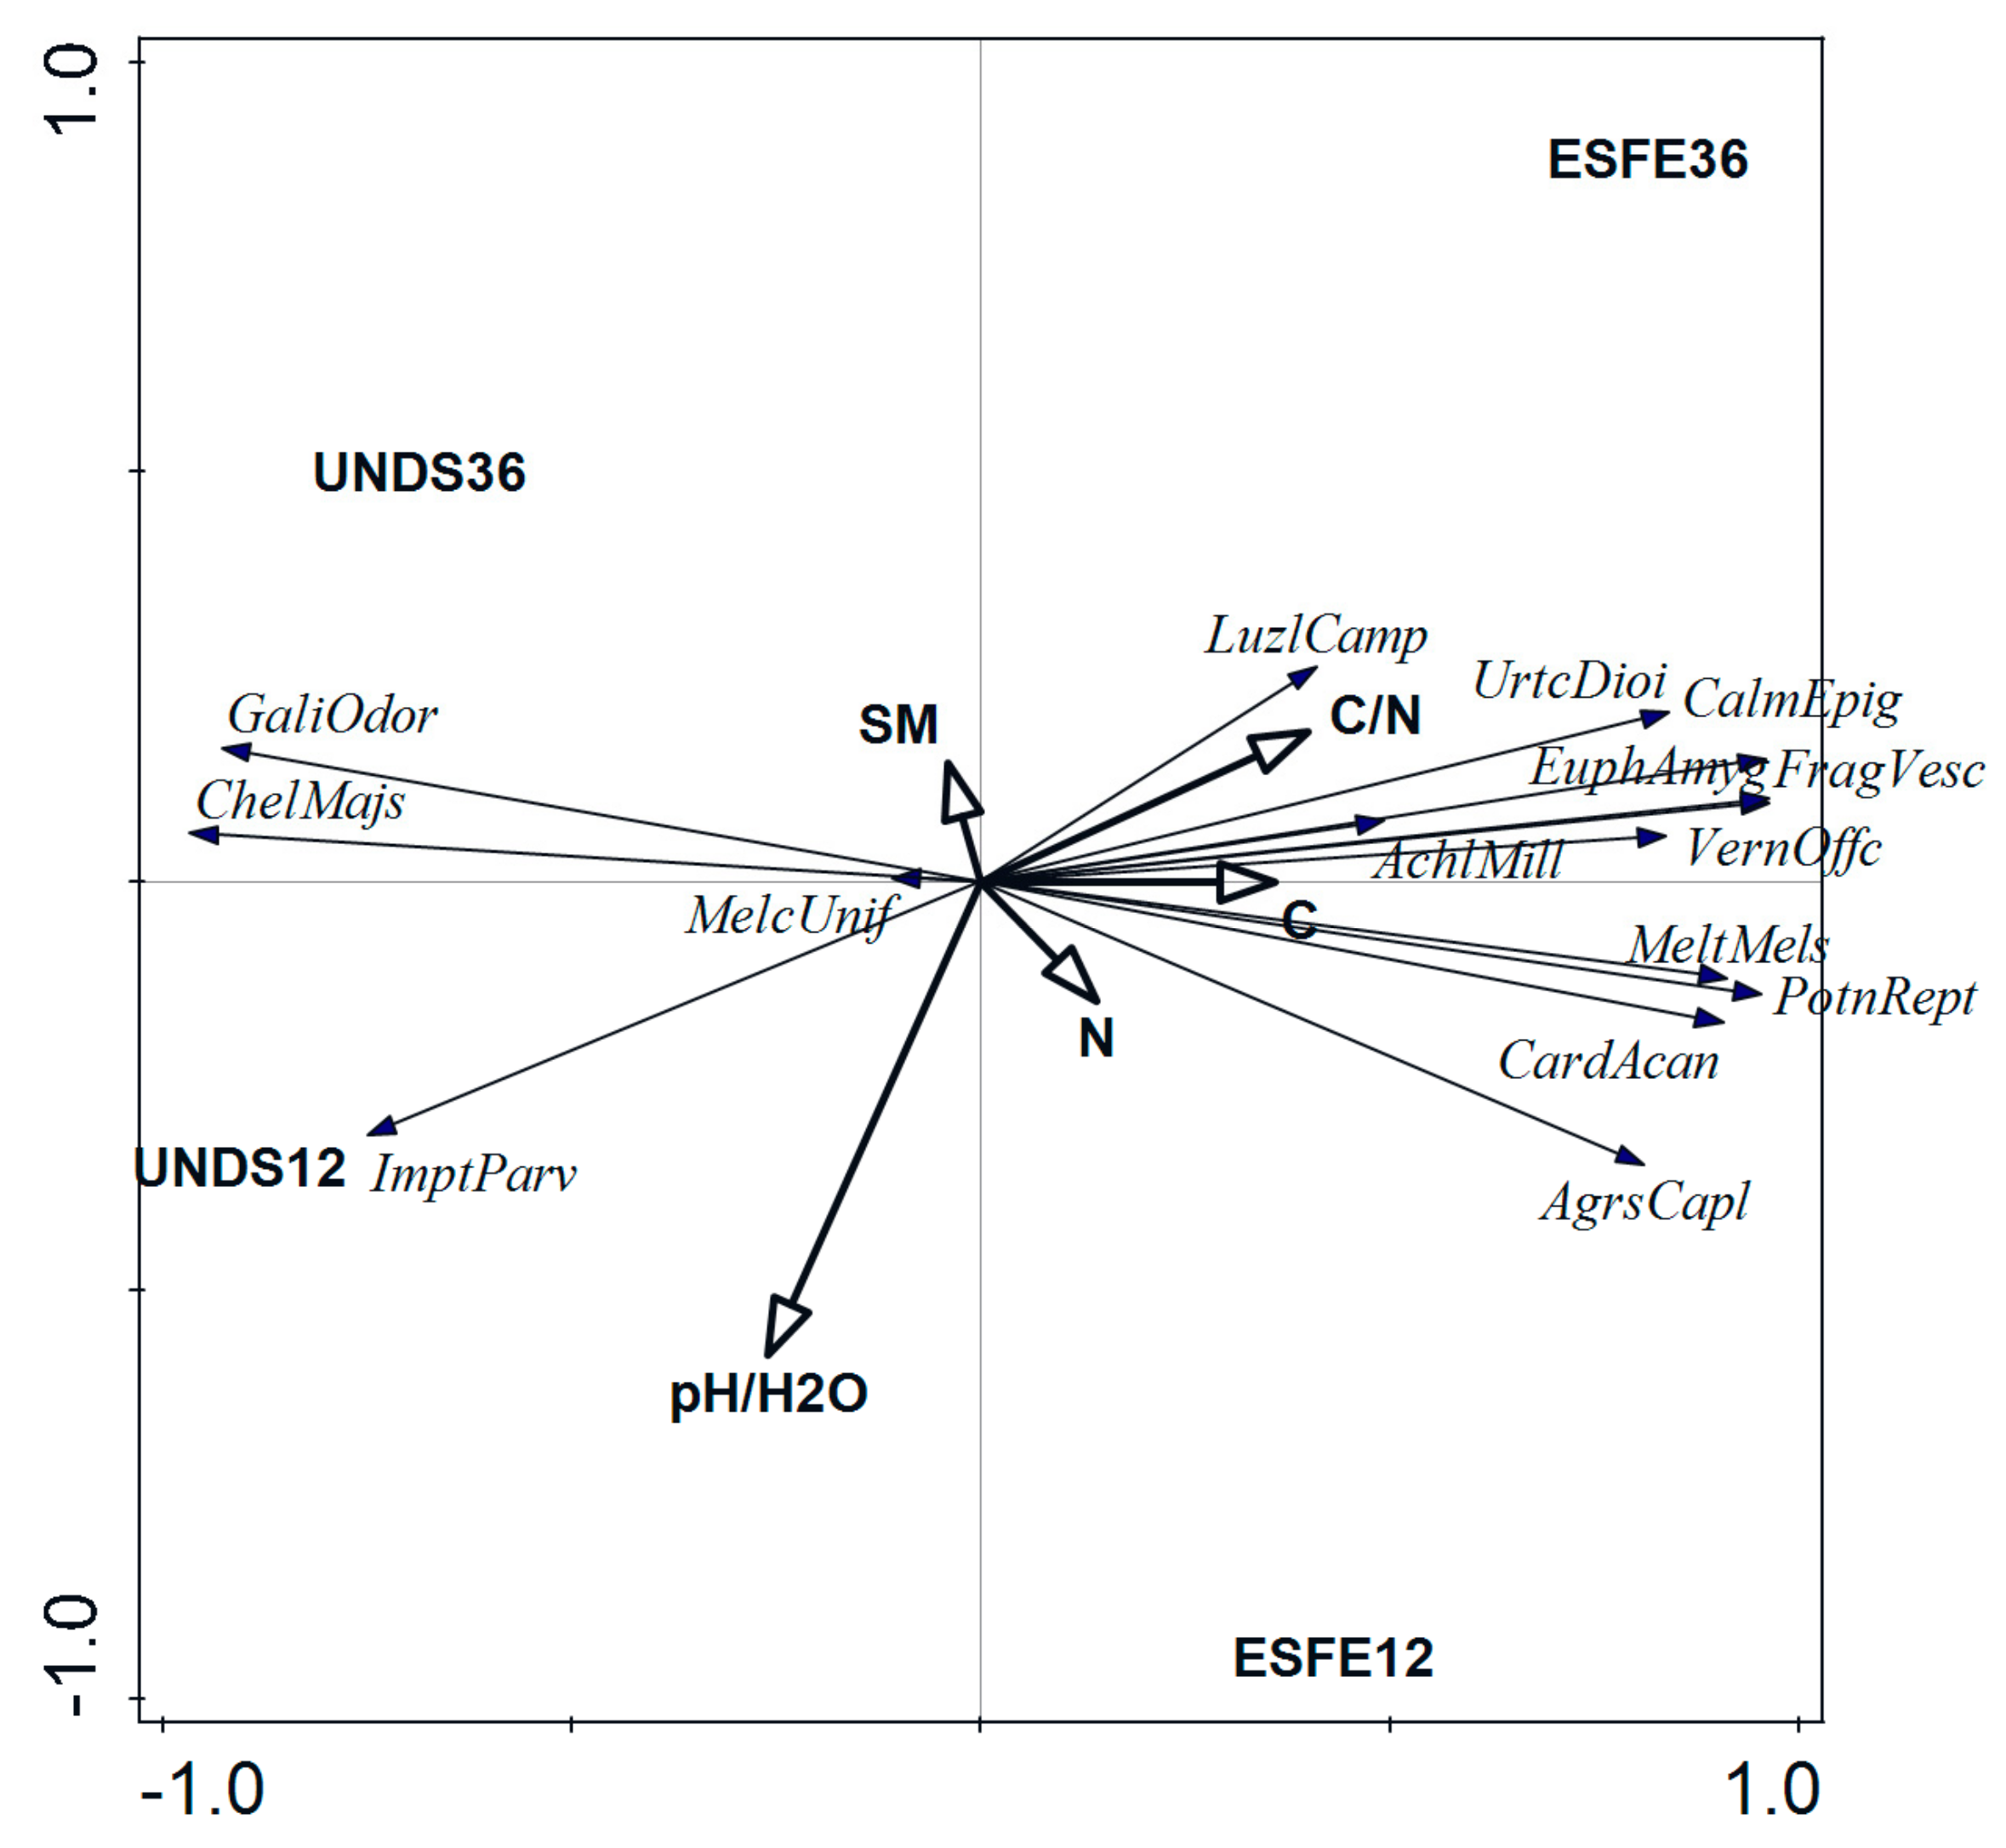
Secondary succession of the understory vegetation was visible at the ESFE sites 12 months after the windstorm, with progression over time, as expected. In contrast, plant composition did not change at the UNDS sites between the two sampling dates. Some herbs such as G. odoratum, C. majus, and I. parviflora were suppressed at the ESFE sites, and two heliophilous grasses, C. epigejos and A. capillaris, benefited from the increase in light exposure caused by the removal of fallen trees. Communities dominated by C. epigejos or A. capillaris, which develop at forest sites after tree cutting or windstorm clearance, are common and widely distributed in European beech forests [8,52]. Sites disturbed by windstorms [9] were rapidly colonized by the heliophilous species Calamagrostis villosa and Avenella flexuosa 18 months after the devastation of spruce forests in High Tatra National Park, and the abundance of the nitrophilous herb Chamaerion angustifolium increased considerably one year later due to high N inputs. This vegetation succession was attributed to changes in light and moisture conditions, and the high N content was attributed to the absence of uptake by vegetation [9]. C. villosa and A. flexuosa also remained dominant at the disturbed sites nine years after the windstorm, but C. angustifolium disappeared due to the succession of the forest floor [51]. The succession of the understory plant species was positively correlated with the C and N contents at the ESFE sites, mainly for grasses.
F. sylvatica, however, has a very high competitive capacity against other tree species, and the understory vegetation is very species poor [53], in agreement with our findings and those reported by [8]. Such conditions, however, are favorable to soil nematodes, indicated by our records at the UNDS sites (relatively high abundance and high total biomass and number of nematode species), supporting the results of several previous studies of European deciduous forests [54,55,
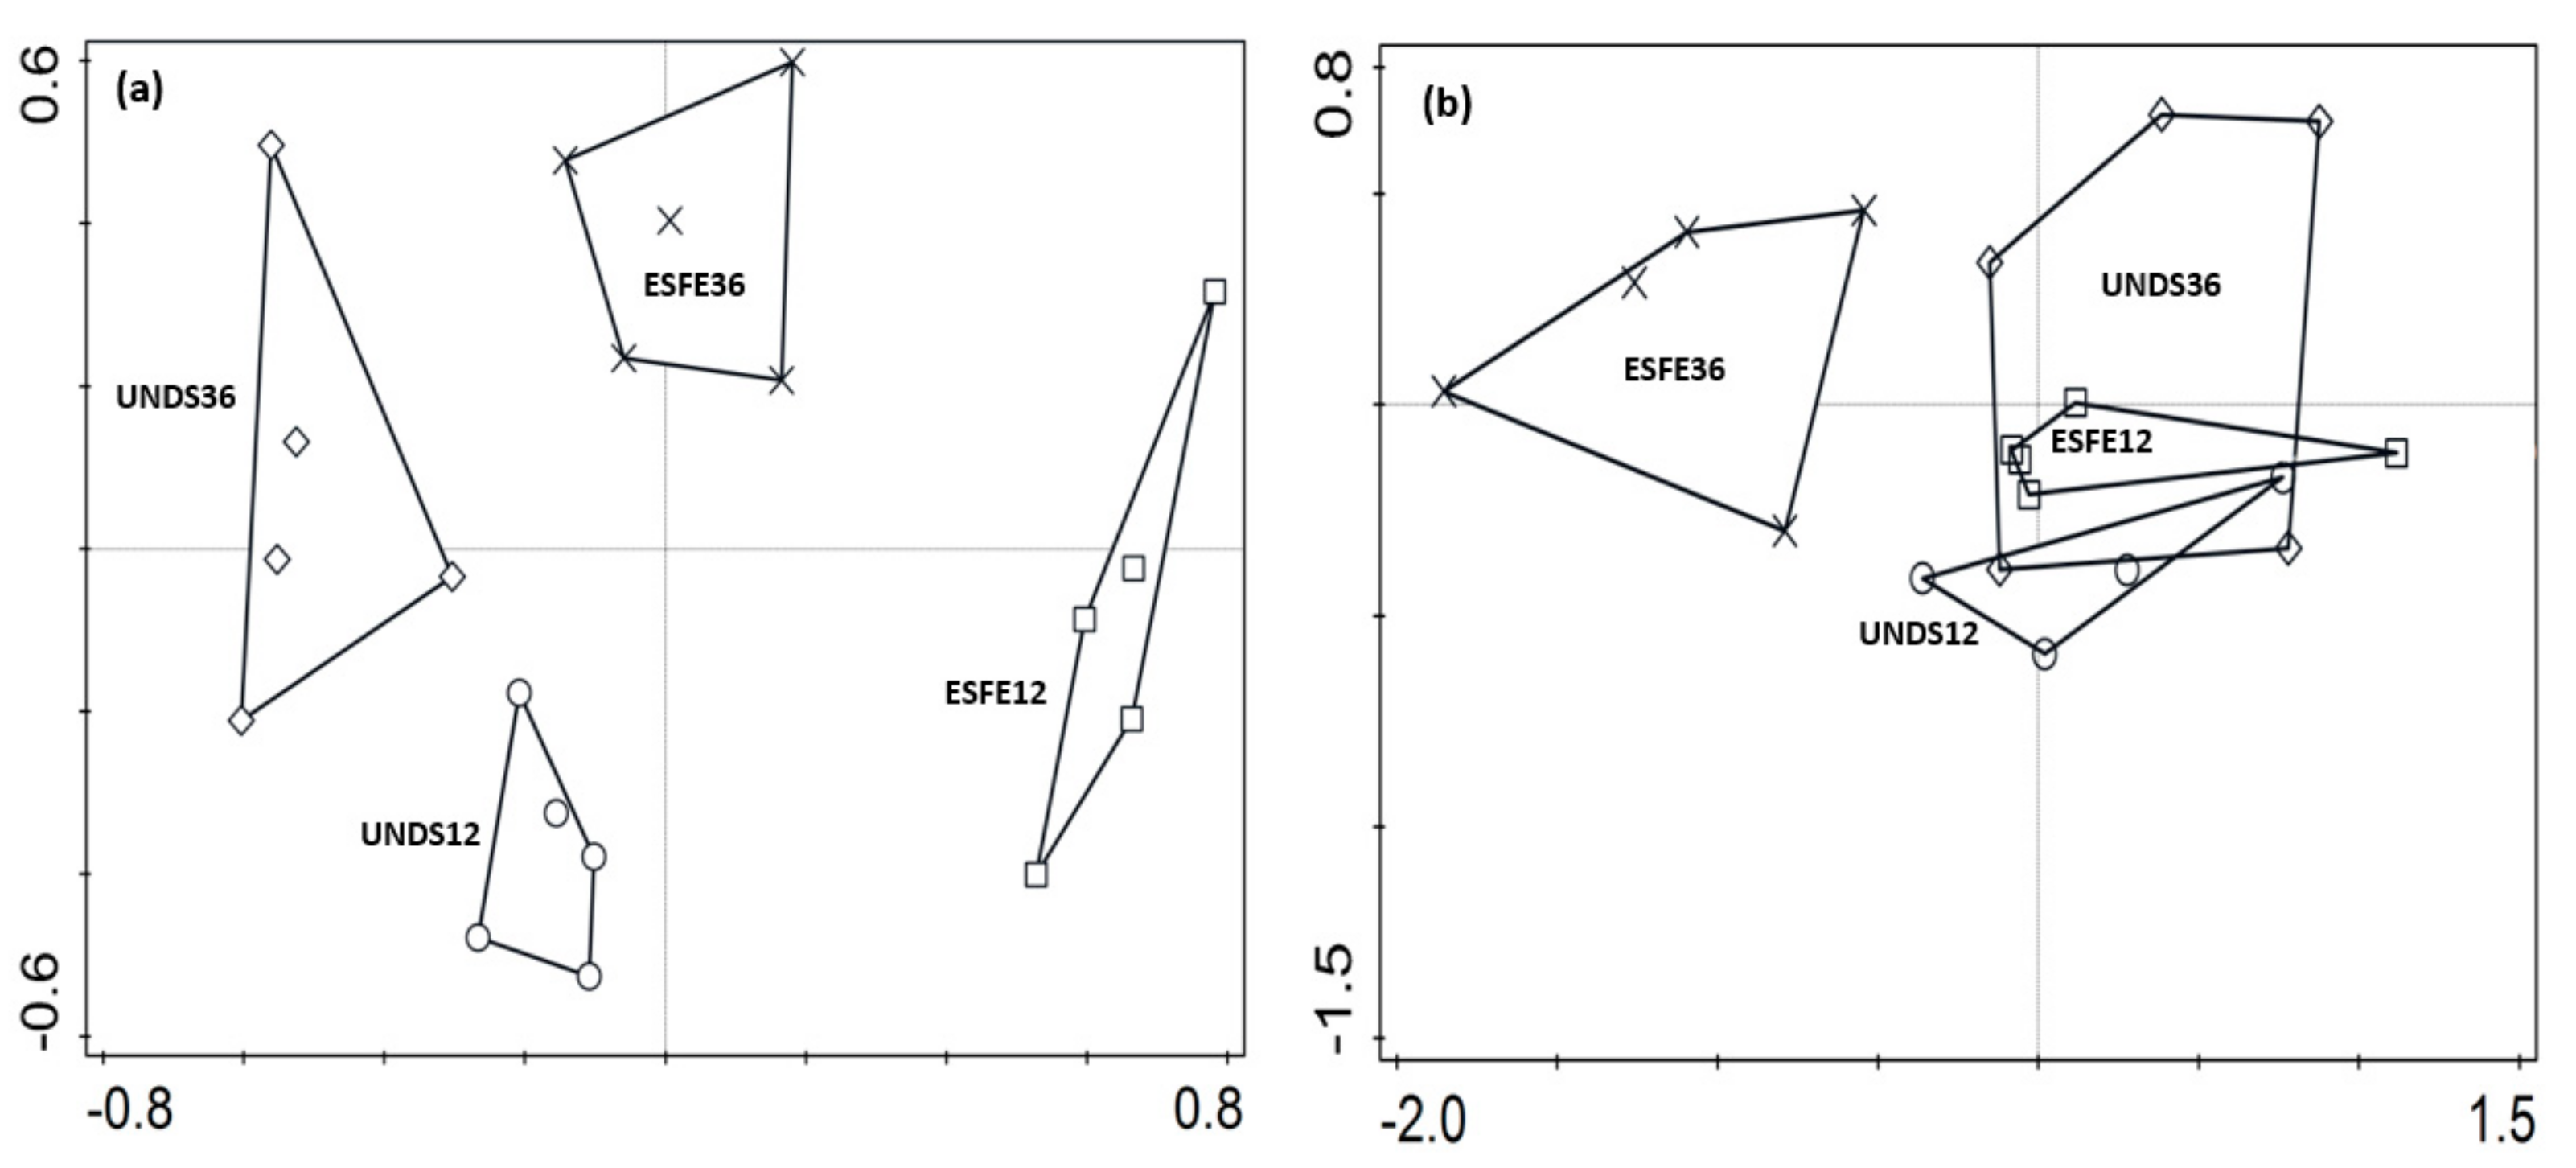
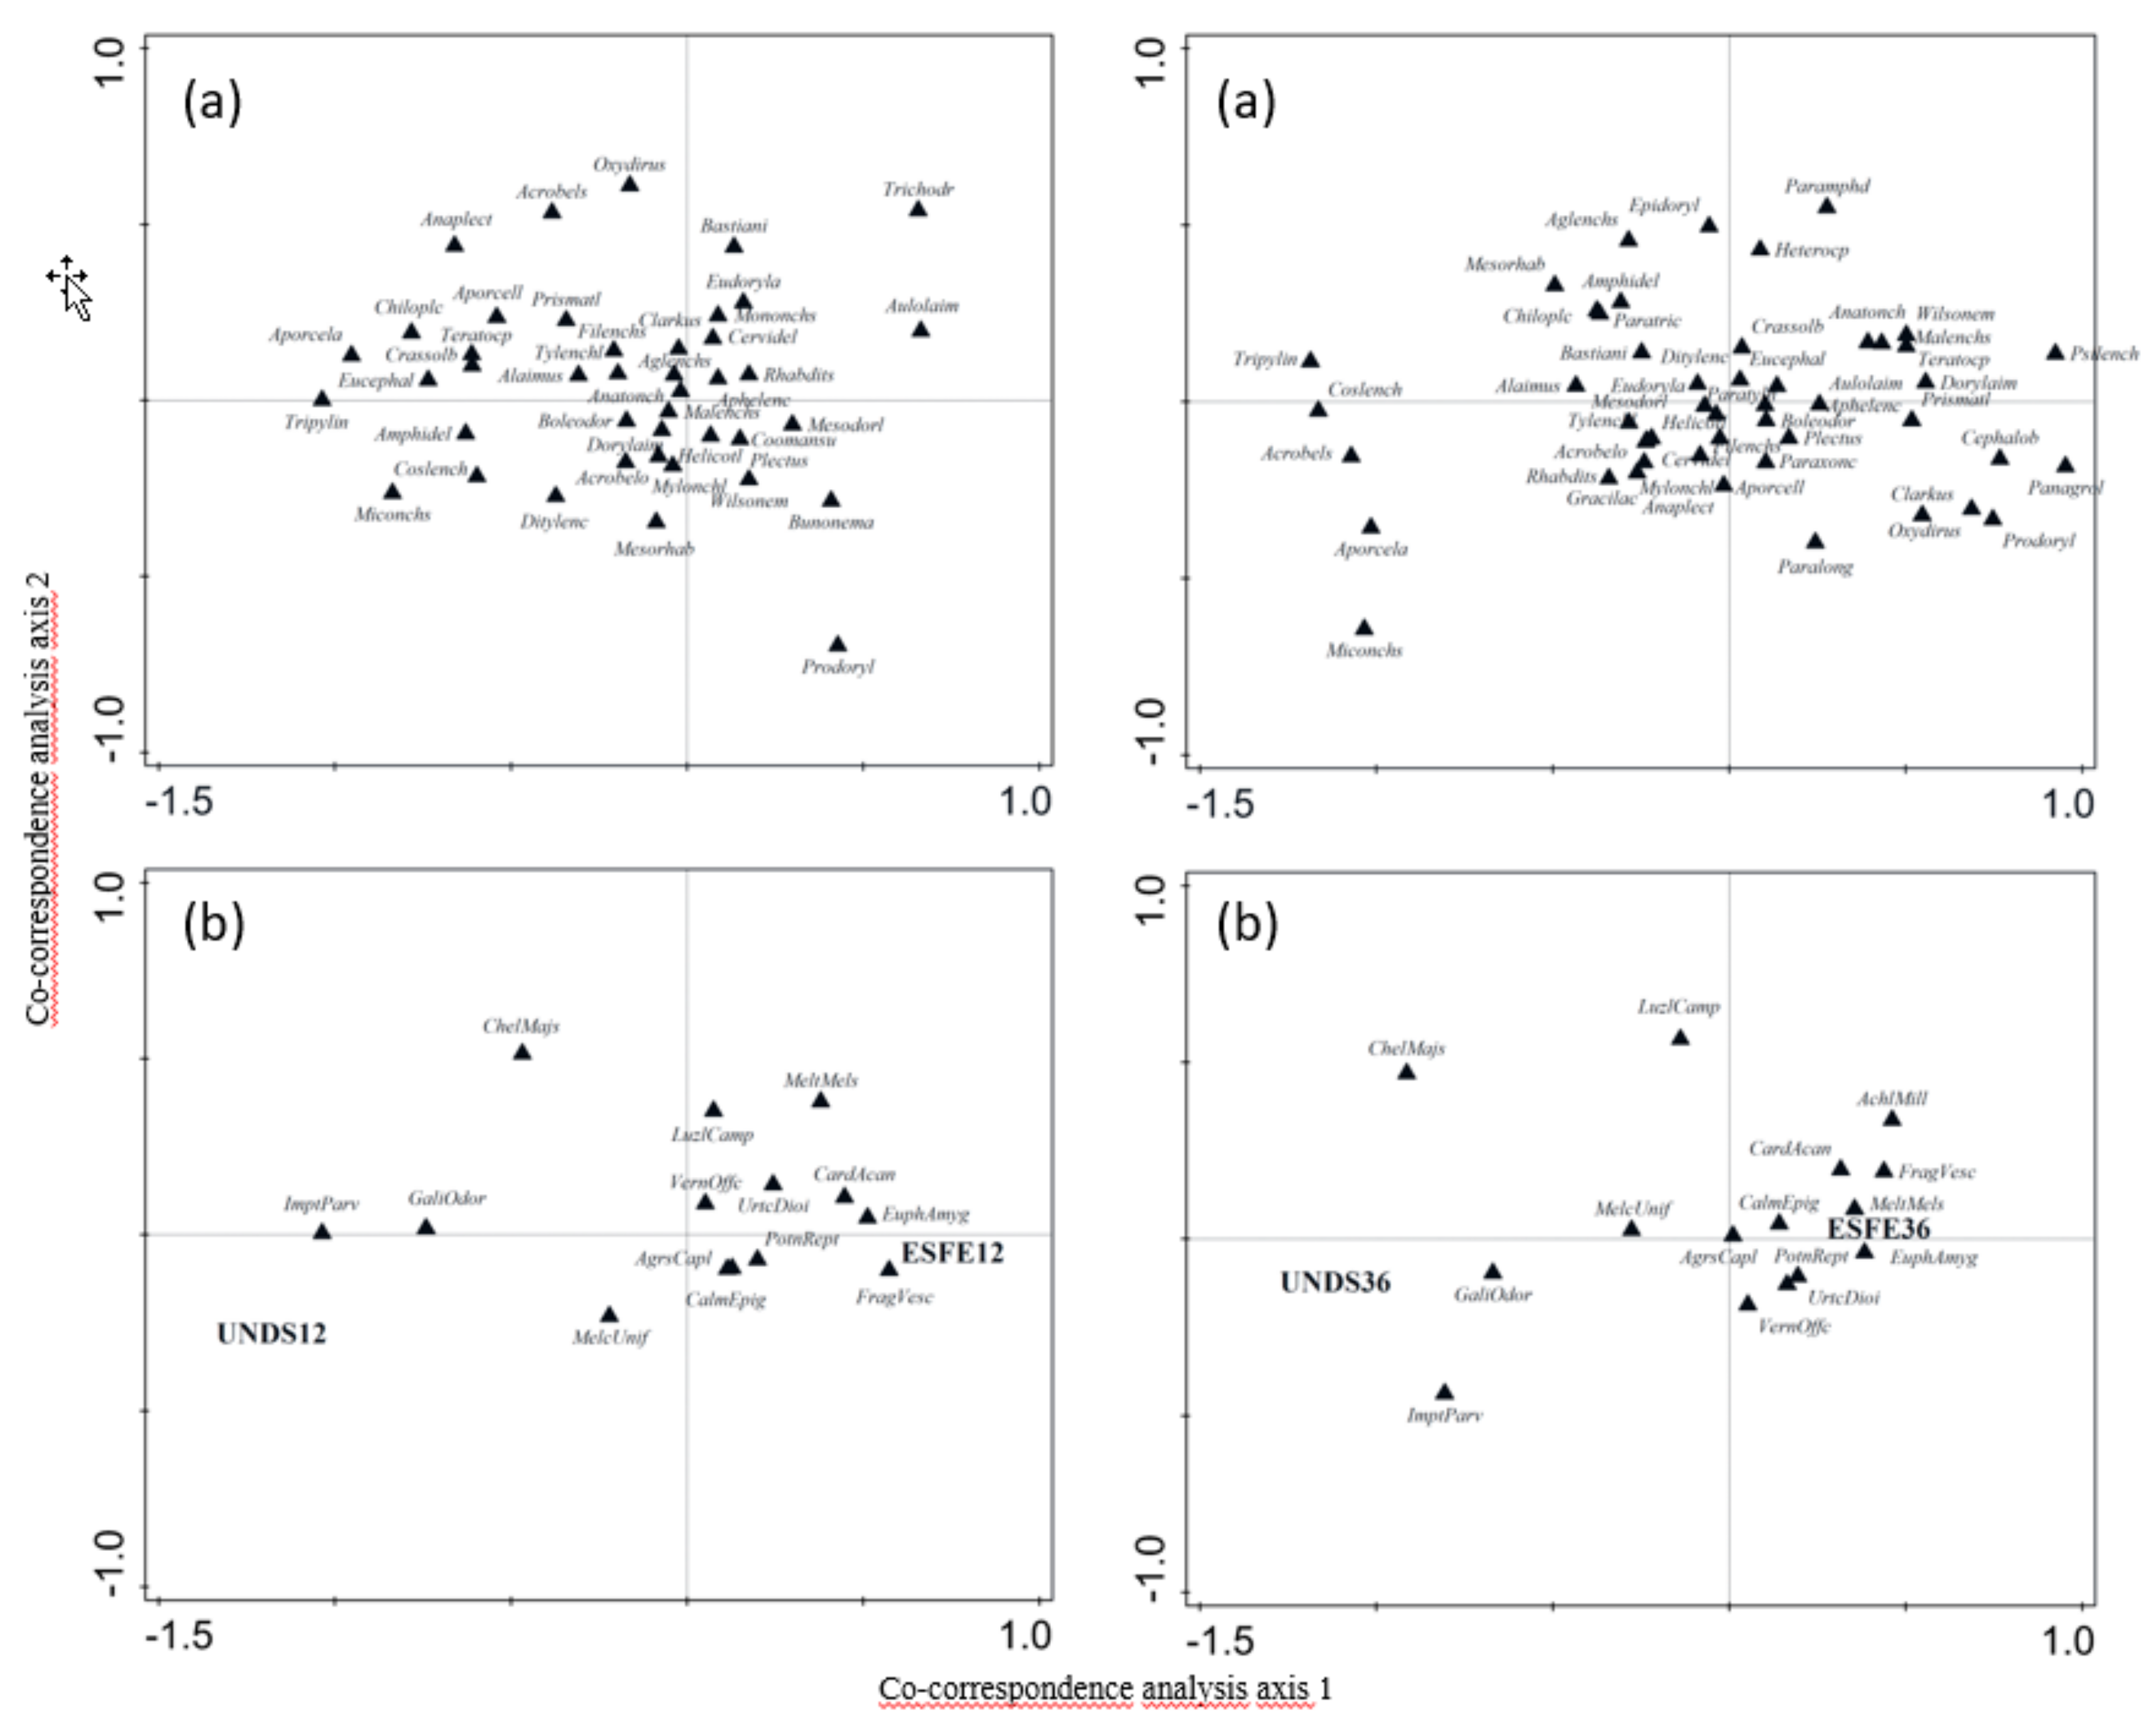
56]. The overall changes at the ESFE sites caused by the windstorm therefore negatively altered the naturally rich nematode communities, i.e., nematode abundance of most species decreased, mainly the most abundant species and those from higher c–p groups (3–5). These changes led to a decrease in total nematode abundance and biomass, despite ongoing understory secondary succession 12 months after the storm (ESFE12). A PCA found a slight restoration of the nematode communities 24 months later (ESFE36).
Undisturbed sites in a montane Lariceto-Piceetum forest with acidic soils [51] naturally had ten-fold lower nematode biomass, five-fold fewer nematode individuals, and half the number of nematode species as the neutral soils of our F. sylvatica forests, supporting the findings by [57], who reported total numbers of nematodes about two- to three-fold higher at higher than lower pHs. The disturbance of the ecosystem by the windstorm thus did not have a detrimental impact on the nematode communities and even positively affected nematode abundance, attributed to an improvement of microclimatic conditions, mainly due to secondary plant succession and changes in the herbaceous cover, which can directly or indirectly affect food sources for different nematode trophic groups [21,51]. This contradiction may have been due to the identity of the tree species, differing in physiology, leaf-litter quality, or type of mycorrhiza, as a natural factor affecting the overall ecosystem environment and thus faunal biodiversity [58] including soil nematodes [23,59] For example, native deciduous forests (mainly beech) have been replaced by coniferous forests (mainly spruce) in most parts of Europe, a common consequence of former European afforestation policies [53]. Such conversions, however, have been problematic for ecosystem health by acidifying the soil [58] stimulating pest abundance [60] but also strongly negatively affecting the biomass of all nematode trophic groups, but also enchytraeids, earthworms, isopods, and mycetophilid or cecidomyiid Diptera [58]. The re-establishment of pure coniferous and mixed forests, however, has had a positive impact on the soil food web, including nematode communities [61,62,63].
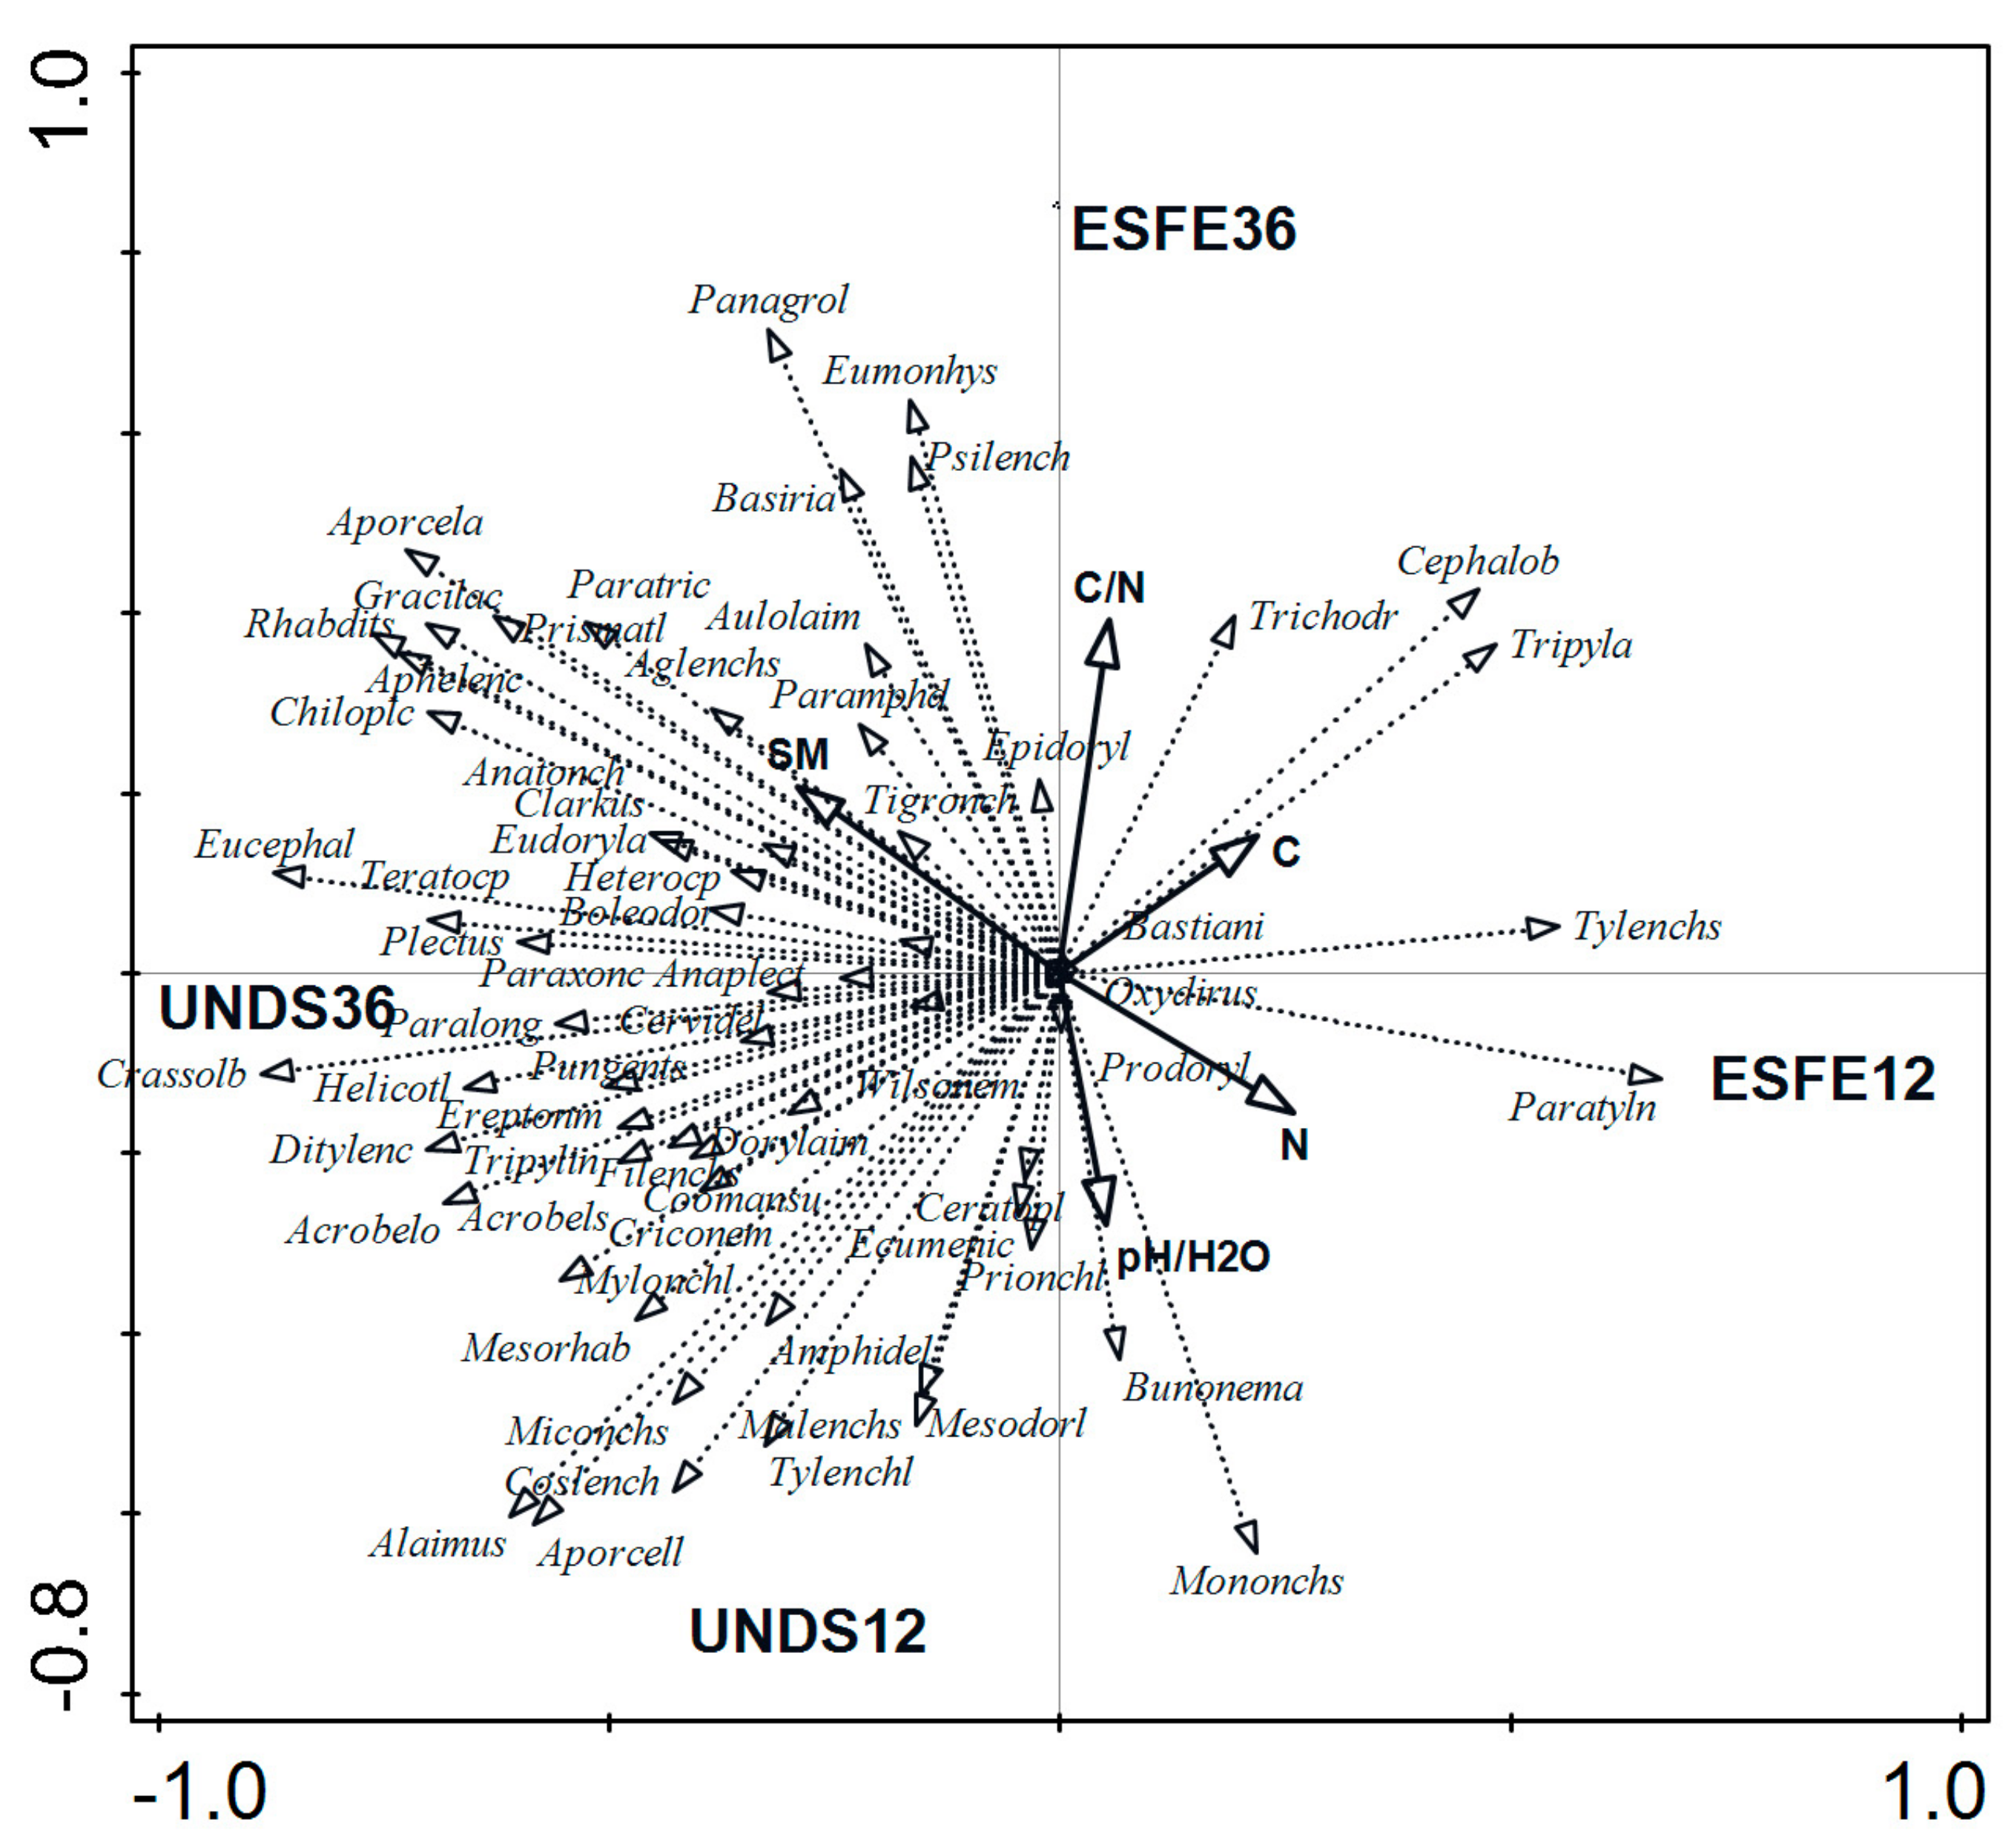
The composition of the nematode trophic groups in our study was typical for deciduous-forest ecosystems, supporting the results of several previous studies of deciduous forests in Europe [23,56,64]. The forest disturbance, however, significantly negatively affected the abundance of most nematode functional guilds in the trophic groups. None of the functional guilds, however, disappeared at the ESFE sites. The effect of the windstorm was thus quantitative rather than qualitative, partially supporting our findings from a Lariceto-Piceetum forest [21]. Bacterivore abundance decreased in the ESFEs, supporting the results by [25,65] who reported higher abundances of bacterivores in healthy than disturbed forests, but contradicting the results in Reference [21]. Similarly, fungivores, plant parasites, and omnivores were less abundant at the disturbed sites of the F. sylvatica forests in the present study. In contrast, disturbed sites in the Lariceto-Piceetum forest had higher abundances of plant parasitic nematodes but similar abundances of fungivores and omnivores than at undisturbed sites [21]. These contradictory results may have been due to the overall characteristics of the ecosystems, such as identity of the tree species, climatic conditions, soil physicochemical properties, and the diversity and composition of the plant species in the secondary succession [25,58].
We expected a positive relationship between SM content and nematode abundance, because nematodes depend on the film of water surrounding soil particles for movement and to prevent desiccation [66]. Total nematode abundance in our study, however, was not correlated with SM content, supporting our previous records from spruce forest [51], indicating a more likely important role of secondary succession. Several nematode functional guilds were nevertheless positively correlated with SM content (Pp2,3,4, Fu2 and Ba2) and soil pH (Ca3,4). These findings agree with those by [67]. It was found, that soil organic C and total N contents were relatively important factors influencing soil nematode communities in forest habitats, partially supporting our findings, especially for bacterivorous and fungivorous guilds, those negatively correlated with C and N contents [68]. EI, SI, CI, and BI (except CI in ESFE36) could not distinguish between disturbed and undisturbed ESFE sites, contradicting the findings from the Lariceto-Piceetum forest [21]. These results partially agree with those by [25] who found that forest disturbance did not affect CI or SI but that EI was significantly higher in the soil of a disturbed forest.
Soil microorganisms tend to respond quickly to environmental stress, because they have a higher surface-to-volume ratio than higher organisms, so the exchange of matter and energy with their environment is much more intense [69]. The size, composition, and activity of microbial communities can frequently change before changes in soil physical and chemical properties become detectable, supporting the results found in Reference [16] for soils at disturbed sites of the Lariceto-Piceetum forest shortly after a windstorm. The large impact of the windstorm on soil microbial activity, biomass, and community composition in our study, however, was not apparent 12 months after the storm, in agreement with the results in Reference [70] who reported no differences in fungal or bacterial biomass after the removal of forest residues from harvesting cleared sites.
Basal respiration, N mineralization, and microbial biomass, however, had decreased significantly in the ESFEs 36 months after the storm, supporting the findings in Reference [71] but contradicting the statement by the authors of Reference [72] that changes in microbial activity due to environmental changes can be independent of possible changes in microbial biomass. Soil pH may influence the biomass of soil microorganisms but not their activity [20,57], in agreement with our finding that soil pH was positively correlated with microbial biomass but not with microbial activity. Surprisingly, the functional diversity of the microbial community was negatively correlated with SM content, supporting the results in Reference [20] but was positively correlated with C and N contents or the C/N ratio, contradicting the findings in Reference [20].

5. Conclusions

Communities of microorganisms, especially those of forest soils with well-developed litter and humus layers, are characterized by a large diversity of species. Such communities are particularly sensitive to disturbance, because the long lifespan of the trees does not allow rapid adaptation to environmental changes. Our study found considerably different responses of soil nematode communities and microbial activity to the same type of disturbance in productive deciduous forests than in our previous studies in a natural coniferous forest shortly after a windstorm.
The structures of the soil nematode communities were significantly negatively altered by the windstorm in the beech forests, and the total abundance and numbers of plant parasites, bacterivores, and omnivores increased after a similar disturbance in spruce forest. In contrast, changes in microbial activity and functional diversity of the microbial communities appeared long after the disturbance in the beech forests but immediately after the disturbance in spruce forest.
These differences could be attributed to a set of environmental factors determining the natural degree of species diversity or abundance. For example, the identity of the tree species, differing in physiology, leaf-litter quality, or type of mycorrhiza may alter the physicochemical environment inhabited by nematodes and microbes. Climatic conditions or altitude differentiates the growth of tree species, forest types, and early-successional plant communities that have been injured by windstorms. Spruce forests under natural conditions are generally restricted to upper montane regions and wet acidic habitats, but natural beech forests grow optimally at lower altitudes with a wide range of soil physicochemical conditions and types.
The duration of our investigation was too short to expect significant changes in soil chemical properties between sites, but we nevertheless recorded significant increases in the C and N contents and a higher C/N ratio in the ESFEs in the third year after the storm. We conclude that the nematodes of the neutral beech forest soils are more sensitive to initial environmental changes from harvesting timber after a disturbance than nematodes from acidic spruce soils, contradicting the responses of microbial activity to such disturbances in these different forest types.

Author Contributions

M.R. conceived and designed the research, performed the nematode analysis, wrote manuscript; A.Č. performed statistical analysis; E.G. performed soil and microbial analysis.

Funding

M Renco’s research on forests was supported by the project “FORSOIL” Vegetation, soil microorganisms and carbon sequestration in forest soils: links and interactions; no. APVV-15–0176.

Conflicts of Interest

The authors declare no conflict of interest.

References

  1. Mouillot, D.; Graham, N.A.; Villéger, S.; Mason, N.W.; Bellwood, D.R. A functional approach reveals community responses to disturbances. Trends Ecol. Evol. 2013, 28, 167–177. [Google Scholar] [CrossRef] [PubMed]
  2. Lindner, M.; Maroschek, M.; Netherer, S.; Kremer, A.; Barbati, A.; Garcia-Gonzalo, J.; Lexer, M.J. Climate change impacts, adaptive capacity, and vulnerability of European forest ecosystems. For. Ecol. Manag. 2010, 259, 698–709. [Google Scholar] [CrossRef]
  3. Swanson, M.E.; Franklin, J.F.; Beschta, R.L.; Crisafulli, C.M.; DellaSala, D.A.; Hutto, R.L.; Lindemaver, D.B.; Swanson, F.J. The forgotten stage of forest succession: Early-successional ecosystems on forest sites. Front. Ecol. Environ. 2011, 9, 117–125. [Google Scholar] [CrossRef]
  4. Schlyter, P.; Stjernquist, I.; Bärring, L.; Jönsson, A.M.; Nilsson, C. Assessment of the impacts of climate change and weather extremes on boreal forests in northern Europe, focusing on Norway spruce. Clim. Res. 2006, 31, 75–84. [Google Scholar] [CrossRef]
  5. Schelhaas, J.M.; Nabuurs, G.J.; Schuck, A. Natural disturbances in the European forests in the 19th and 20th centuries. Glob. Chang. Biol. 2003, 9, 1620–1633. [Google Scholar] [CrossRef]
  6. Lindroth, A.; Lagergren, F.; Grelle, A.; Klemedtsson, L.; Langvall, O.; Weslien, P.; Tuulik, J. Storms can cause Europe-wide reduction in forest carbon sink. Glob. Chang. Biol. 2009, 15, 346–355. [Google Scholar] [CrossRef]
  7. Franklin, J.F.; Spies, T.A.; van Pelt, R.; Carey, A.B.; Thornburgh, D.A.; Berg, D.R.; Bible, K. Disturbances and structural development of natural forest ecosystems with silvicultural implications, using Douglas-fir forests as an example. For. Ecol. Manag. 2002, 155, 399–423. [Google Scholar] [CrossRef]
  8. Von Oheimb, G.; Friedel, A.; Bertsch, A.; Härdtle, W. The effects of windthrow on plant species richness in a Central European beech forest. Plant Ecol. 2007, 191, 47–65. [Google Scholar] [CrossRef]
  9. Šoltés, R.; Školek, J.; Homolová, Z.; Kyselová, Z. Early successional pathways in the Tatra Mountains (Slovakia) forest ecosystems following natural disturbances. Biologia 2010, 65, 958–964. [Google Scholar] [CrossRef]
  10. Grandpré, L.; Waldron, K.; Bouchard, M.; Gauthier, S.; Beaudet, M.; Ruel, J.C.; Kneeshaw, D. Incorporating insect and wind disturbances in a natural disturbance-based management framework for the boreal forest. Forests 2018, 9, 471. [Google Scholar] [CrossRef]
  11. Nilsson, C.; Stjernquist, I.; Bärring, L.; Schlyter, P.; Jönsson, A.M.; Samuelsson, H. Recorded storm damage in Swedish forests 1901–2000. For. Ecol. Manag. 2004, 199, 165–173. [Google Scholar] [CrossRef]
  12. Svoboda, M.; Fraver, S.; Janda, P.; Bače, R.; Zenáhlíková, J. Natural development and regeneration of a Central European montane spruce forest. For. Ecol. Manag. 2010, 260, 707–714. [Google Scholar] [CrossRef]
  13. Lundmark, L.J.; Fredman, P.; Sandell, K. National parks and protected areas and the role for employment in tourism and forest sectors: A Swedish case. Ecol. Soc. 2010, 15, 19. [Google Scholar] [CrossRef]
  14. Fleischer, P. Windfall research and monitoring in the High Tatra Mts., objectives, principles, methods, and current status. Contrib. Geophys. Geod. 2008, 38, 233–248. [Google Scholar]
  15. Gubka, A.; Kunca, A.; Longauerová, V.; Maľová, M.; Vakula, J.; Galko, J.; Nikolov, C.; Rell, S.; Zúbrik, M.; Leontovyč, R. Vetrová kalamita Žofia z 15.5.2014. Usmernenie Lesníckej Ochranárskej Služby 2014, 8, 1–8. (In Slovak) [Google Scholar]
  16. Gömöryová, E.; Střelcová, K.; Škvarenina, J.; Bebej, J.; Gömöry, D. Responses of soil microbial activity and functional diversity to disturbance events in the Tatra National Park (Slovakia). In Bioclimatology and Natural Hazards; Strelcová, K., Matyas, C., Kleidon, A., Lapin, M., Matejka, F., Blazenec, M., Holecy, J., Eds.; Springer Science & Business Media: Berlin/Heidelberg, Germany, 2008; pp. 251–259. [Google Scholar]
  17. Minár, J.; Falan, V.; Bánovský, M.; Damankošová, Z.; Kouch, M. Influence of site conditions on the windstorm impact: A case study of the High Tatras foothills in 2004. Land. Anal. 2009, 10, 95–101. [Google Scholar]
  18. Bulánková, E.; Kalaninová, D.; Šporka, F. River morphology of mountain streams influenced by an extreme windstorm in the High Tatra Mountains (northern Slovakia). Biologia 2013, 68, 487–500. [Google Scholar] [CrossRef]
  19. Čuchta, P.; Miklisová, D.; Kováč, Ľ. The succession of soil Collembola communities in spruce forests of the High Tatra Mountains five years after a windthrow and clear–cut logging. For. Ecol. Manag. 2019, 433, 504–513. [Google Scholar] [CrossRef]
  20. Gömöryová, E.; Střelcová, K.; Fleischer, P.; Gömöry, D. Soil microbial characteristics at the monitoring plots on windthrow areas of the Tatra National Park (Slovakia): Their assessment as environmental indicators. Environ. Monitor. Assess. 2011, 174, 31–45. [Google Scholar] [CrossRef]
  21. Čerevková, A.; Renčo, M.; Cagáň, L. Short-term effects of forest disturbances on soil nematode communities in European mountain spruce forests. J. Helminthol. 2013, 87, 376–385. [Google Scholar] [CrossRef]
  22. Ushio, M.; Wagai, R.; Balser, T.C.; Kitayama, K. Variations in the soil microbial community composition of a tropical montane forest ecosystem: Does tree species matter? Soil Biol. Biochem. 2008, 40, 2699–2702. [Google Scholar] [CrossRef]
  23. Cesarz, S.; Ruess, L.; Jacob, M.; Jacob, A.; Schaefer, M.; Scheu, S. Tree species diversity versus tree species identity: Driving forces in structuring forest food webs as indicated by soil nematodes. Soil Biol. Biochem. 2013, 62, 36–45. [Google Scholar] [CrossRef]
  24. Rosinger, C.; Sandén, H.; Matthews, B.; Mayer, M.; Godbold, D. Patterns in ectomycorrhizal diversity, community composition, and exploration types in European beech, pine, and spruce forests. Forests 2018, 9, 445. [Google Scholar] [CrossRef]
  25. Neher, D.A.; Wu, J.; Barbercheck, M.E.; Anas, O. Ecosystem type affects interpretation of soil nematode community measures. Appl. Soil Ecol. 2005, 30, 47–64. [Google Scholar] [CrossRef]
  26. Yokobe, T.; Hyodo, F.; Tokuchi, N. Seasonal effects on microbial community structure and nitrogen dynamics in temperate forest soil. Forests 2018, 9, 153. [Google Scholar] [CrossRef]
  27. Neher, D.A.; Peck, S.L.; Rawlings, J.O.; Campbell, C.L. Measures of nematode community structure and sources of variability among and within agricultural fields. Plant Soil 1995, 170, 167–181. [Google Scholar] [CrossRef]
  28. Barkman, J.J.; Doing, H.; Segal, S. Kritische Bemerkungen und Vorschlage zur quantitativen Vegetationsanalyze. Acta Bot. Neerl. 1964, 13, 394–419. [Google Scholar] [CrossRef]
  29. Cobb, N.A. Estimating the Nematode Population of the Soil; US Department of Agriculture: Batesville, IN, USA, 1918. [Google Scholar]
  30. Van Benzooijen, J. Methods and Techniques for Nematology; Wagenningen University: Wagenningen, The Netherlands, 2006; 46p. [Google Scholar]
  31. Wasilewska, L. Soil invertebrates as bioindicators, with special reference to soil-inhabiting nematodes. Russ. J. Nematol. 1997, 5, 113–126. [Google Scholar]
  32. Bongers, T.; Bongers, M. Functional diversity of nematodes. Appl. Soil Ecol. 1998, 10, 239–251. [Google Scholar] [CrossRef]
  33. Bongers, T. The maturity index: An ecological measure of environmental disturbance based on nematode species composition. Oecologia 1990, 83, 14–19. [Google Scholar] [CrossRef]
  34. Yeates, G.W. Modification and qualification of the Nematode Maturity Index. Pedobiologia 1994, 38, 97–101. [Google Scholar]
  35. Ferris, H.; Bongers, T.; de Goede, R.G.M. A framework for soil food web diagnostics: Extension of the nematode faunal analysis concept. Appl. Soil Ecol. 2001, 18, 13–29. [Google Scholar] [CrossRef]
  36. Shannon-Wiener, C.E.; Weaver, W.J.; Weater, W.J. The Mathematical Theory of Communication; University of Illinois Press: Urbana, IL, USA, 1949; 65p. [Google Scholar]
  37. Heip, C.; Herman, P.M.J.; Soetaert, K. Data processing evaluation and analysis. In Introduction to the Study of Meiofauna; Higgins, H.P., Thiel, H., Eds.; Smithsonian Institution Press: Washington, DC, USA, 1988; pp. 197–231. [Google Scholar]
  38. Yeates, G.W.; Bongers, T.; de Goede, R.G.M.; Freckman, D.W.; Georgieva, S.S. Feeding habits in soil nematode families and genera—An outline for soil ecologists. J. Nematol. 1993, 25, 315–331. [Google Scholar] [PubMed]
  39. Ferris, H. Form and function: Metabolic footprints of nematodes in the soil food web. Eur. J. Soil Biol. 2010, 46, 97–104. [Google Scholar] [CrossRef]
  40. Sieriebriennikov, B.; Ferris, H.; de Goede, R.G.M. NINJA: An automated calculation system for nematode-based biological monitoring. Eur. J. Soil Biol. 2014, 61, 90–93. [Google Scholar] [CrossRef]
  41. Islam, K.R.; Weil, R.R. Microwave irradiation of soil for routine measurements of microbial biomass carbon. Biol. Fertil. Soils 1998, 27, 408–416. [Google Scholar] [CrossRef]
  42. Kandeler, E. Bestimmung der N-mineralisation im anaeroben Brutversuch. In Bodenbiologische Arbeitsmethoden; Schinner, F., Öhlinger, R., Kandeler, E., Margesin, E.R., Eds.; Springer: Heidelberg, Germany, 1993; pp. 160–161. [Google Scholar]
  43. Khaziev, F.K. Fermentativnaya aktivnost’ pochv; Metodicheskoe posob’e: Moskva, Russia, 1976; p. 180. [Google Scholar]
  44. Insam, H. A new set of substrates proposed for community characterization in environmental samples. In Microbial Communities. Functional versus Structural Approaches; Insam, H., Rangger, A., Eds.; Springer: Berlin/Heidelberg, Germany, 1997; pp. 260–261. [Google Scholar]
  45. Hill, M.O. Diversity and evenness: A unifying notation and its consequences. Ecology 1973, 54, 427–432. [Google Scholar] [CrossRef]
  46. Ter Braak, C.J.; Schaffers, A.P. Co-correspondence analysis: A new ordination method to relate two community compositions. Ecology 2004, 85, 834–846. [Google Scholar] [CrossRef]
  47. Mitchell, R.J.; Hester, A.J.; Campbell, C.D.; Chapman, S.J.; Cameron, C.M.; Hewison, R.L.; Potts, J.M. Is vegetation composition or soil chemistry the best predictor of the soil microbial community? Plant Soil 2010, 333, 417–430. [Google Scholar] [CrossRef]
  48. Neher, D.A.; Williams, K.M.; Lovell, S.T. Environmental indicators reflective of road design in a forested landscape. Ecosphere 2017, 8, e01734. [Google Scholar] [CrossRef]
  49. Ter Braak, C.J.; Šmilauer, P. Canoco Reference Manual and User’s Guide: Software for Ordination, Version 5.0; Microcomputer Power: Ithaca, NY, USA, 2012. [Google Scholar]
  50. van Bruggen, A.H.; Semenov, A.M. In search of biological indicators for soil health and disease suppression. Appl. Soil Ecol. 2000, 15, 13–24. [Google Scholar] [CrossRef]
  51. Renčo, M.; Čerevková, A.; Homolová, Z.; Gömöryová, E. Long-term effects on soil nematode community structure in spruce forests of removing or not removing fallen trees after a windstorm. For. Ecol. Manag. 2015, 356, 243–252. [Google Scholar] [CrossRef]
  52. Máliš, F.; Konôpka, B.; Maľová, M. Post-harvest biomass stock and productivity of Calamagrostis epigejos community under beech and spruce forest stand. For. J. 2013, 59, 197–202. [Google Scholar] [CrossRef]
  53. Ellenberg, H.; Leuschner, C. Vegetation Mitteleuropas mit den Alpen: in ökologischer, dynamischer und historischer Sicht (Vol. 8104); Utb: Stuttgart, Germany, 2010. [Google Scholar]
  54. Lazarova, S.S.; de Goede, R.G.; Peneva, V.K.; Bongers, T. Spatial patterns of variation in the composition and structure of nematode communities in relation to different microhabitats: A case study of Quercus dalechampii Ten forest. Soil Biol. Biochem. 2004, 36, 701–712. [Google Scholar] [CrossRef]
  55. Lišková, M.; Čerevková, A.; Háněl, L. Nematode communities of forest ecosystems in associations with various soil orders. Russ. J. Nematol. 2008, 16, 129–142. [Google Scholar]
  56. Háněl, L.; Čerevková, A. Species and genera of soil nematodes in forest ecosystems of the Vihorlat Protected Landscape Area, Slovakia. Helminthologia 2010, 47, 123–135. [Google Scholar] [CrossRef] [Green Version]
  57. Räty, M.; Huhta, V. Earthworms and pH affect communities of nematodes and enchytraeids in forest soil. Biol. Fertil. Soils 2003, 38, 52–58. [Google Scholar] [CrossRef]
  58. Scheu, S.; Albers, D.; Alphei, J.; Buryn, R.; Klages, U.; Migge, S.; Platner, C.; Salamon, J.A. The soil fauna community in pure and mixed stands of beech and spruce of different age: Trophic structure and structuring forces. Oikos 2003, 101, 225–238. [Google Scholar] [CrossRef]
  59. De Deyn, G.B.; Raaijmakers, C.E.; van Ruijven, J.; Berendse, F.; van Der Putten, W.H. Plant species identity and diversity effects on different trophic levels of nematodes in the soil food web. Oikos 2004, 106, 576–586. [Google Scholar] [CrossRef]
  60. Kazda, M.; Pichler, M. Priority assessment for conversion of Norway spruce forests through introduction of broadleaf species. For. Ecol. Manag. 1998, 102, 245–258. [Google Scholar] [CrossRef]
  61. Elmer, M.; La France, M.; Förster, G.; Roth, M. Changes in the decomposer community when converting spruce monocultures to mixed spruce/beech stands. Plant Soil 2004, 264, 97–109. [Google Scholar] [CrossRef]
  62. Salamon, J.A.; Wolters, V. Nematoda response to forest conversion. Eur. J. Soil Biol. 2009, 45, 184–191. [Google Scholar] [CrossRef]
  63. Chauvat, M.; Titsch, D.; Zaytsev, A.S.; Wolters, V. Changes in soil faunal assemblages during conversion from pure to mixed forest stands. For. Ecol. Manag. 2011, 262, 317–324. [Google Scholar] [CrossRef]
  64. Renčo, M.; Čermák, V.; Čerevková, A. Composition of soil nematode communities in native birch forests in Central Europe. Nematology 2012, 14, 15–25. [Google Scholar] [CrossRef]
  65. Clausi, M.; Vinciguerra, T. Changes in nematode communities of forest soil in relation to clear-cutting. Nematol. Mediterr. 1999, 27, 315–322. [Google Scholar]
  66. Keith, A.M.; Brooker, R.W.; Osler, G.H.; Chapman, S.J.; Burslem, D.F.; van Der Wal, R. Strong impacts of belowground tree inputs on soil nematode trophic composition. Soil Biol. Biochem. 2009, 41, 1060–1065. [Google Scholar] [CrossRef]
  67. Nielsen, U.N.; Ayres, E.; Wall, D.H.; Li, G.; Bardgett, R.D.; Wu, T.; Garey, J.R. Global-scale patterns of assemblage structure of soil nematodes in relation to climate and ecosystem properties. Glob. Ecol. Biogeogr. 2014, 23, 968–978. [Google Scholar] [CrossRef]
  68. Zhang, X.; Guan, P.; Wang, Y.; Li, Q.; Zhang, S.; Zhang, Z.; Liang, W. Community composition, diversity and metabolic footprints of soil nematodes in differently-aged temperate forests. Soil Biol. Biochem. 2015, 80, 118–126. [Google Scholar] [CrossRef]
  69. Nielsen, M.N.; Winding, A. Microorganisms as Indicators of Soil Health; Technical Report No. 388; National Environmental Research Institute: Roskilde, Denmark, 2002. [Google Scholar]
  70. Bengtsson, J.; Lundkvist, H.; Saetre, P.; Sohlenius, B.; Solbreck, B. Effects of organic matter removal on the soil food web: Forestry practices meet ecological theory. Appl. Soil Ecol. 1998, 9, 137–143. [Google Scholar] [CrossRef]
  71. Siira-Pietikäinen, A.; Pietikäinen, J.; Fritze, H.; Haimi, J. Short-term responses of soil decomposer communities to forest management: Clear felling versus alternative forest harvesting methods. Can. J. For. Res. 2001, 31, 88–99. [Google Scholar] [CrossRef]
  72. Andersson, M.; Michelsen, A.; Jensen, M.; Kjøller, A. Tropical savannah woodland: Effects of experimental fire on soil microorganisms and soil emissions of carbon dioxide. Soil Biol. Biochem. 2004, 36, 849–858. [Google Scholar] [CrossRef]
Figure 1. Redundancy analysis bi-plot of association of main understory plant species log(y+1) and soil properties in disturbed (ESFE12, ESFE36) and undisturbed plots (UNDS12, UNDS36), 12 and 36 months after event. Plant codes are given in Table 2. SM, soil moisture (% of initial weight); pH/H2O, soil acidity; N, soil nitrogen content (% of dry weight); C, soil carbon content (% of dry weight); C:N, ratio of carbon to nitrogen. Eigenvalues are 0.863 (F = 11.2; p = 0.002), 0.025, 0.020, and 0.011 for first (horizontal), second (vertical), third, and fourth axes, respectively. The first two axes explained 89% of the variation.
Forests 10 00888 g001
Figure 2. Genus scatter plot of Principal Component Analysis, 1st and 2st axis, log(y+1) transformed genera abundance, soil attributes in disturbed early-successional forest ecosystems (ESFE12, ESFE36) and undisturbed plots (UNDS12, UNDS36), 12 and 36 months after event. Eigenvalues are 0.229, 0.127, 0.089, and 0.075 for first (horizontal), second (vertical), third, and fourth axes, respectively. Abbreviations: Acrobels = Acrobeloides; Acrobelo = Acrobeloides; Aglenchs = Aglenchus; Amphidel = Amphidelus; Anaplect = Anaplectus; Anatonch = Anatonchus; Aulolaim = Aulolaimus; Aporcell = Aporcelaimellus; Aporcela = Aporcelaimus; Aphelenc = Aphelenchoides; Bastiani = Bastiania; Boleodor = Boleodorus; Cephalob = Cephalobus; Ceratopl = Ceratoplectus; Cervidel = Cervidellus; Chiloplc = Chiloplacus; Coomansu = Coomansus; Coslench = Coslenchus; Crassolb = Crassolabium; Criconem = Criconemoides; Ditylenc = Ditylenchus; Dorylaim = Dorylaimus; Ecumenic = Ecumenicus; Epidoryl = Epidorylaimus; Ereptonm = Ereptonema; Eucephal = Eucephalobus; Eudoryla = Eudroylaimus; Eumonhys = Eumonhystera; Filenchs = Filenchus; Gracilac = Gracilacus; Helicotl = Helicotylenchus; Heterocp = Heterocepahlobus; Malenchs = Malenchus; Mesodorl = Mesodorylaimus; Mesorhab = Mesorhabditis; Miconchs = Michonchus; Mononchs = Mononchus; Mylonchl = Mylonchulus; Panagrol = Panagrolaium; Paralong = Paralongidorus; Paramphd = Paramphidelus; Paratric = Paratrichodorus; Paratyln = Paratylenchus; Paraxonc = Paraxonchium; Prionchl = Prionchulus; Prismatl = Prismatolaimus; Prodoryl = Prodorylaimus; Psilench = Psilenchus; Pungents = Pungentus; Rhabdits = Rhabditis; Teratocp = Teratocephalobus; Tigronch = Tigronchoides; Trichodr = Trichodorus; Tripylin = Tripylina; Tylenchl = Tylencholaimelus; Tylenchus = Tylenchus; Wilsonem = Wilsonema.
Forests 10 00888 g002
Figure 3. Ordination of soil samples on the biplot resulting from the PCA based on the nematode species composition (a) and microbial characteristics (b) of the soil samples in disturbed (ESFE12—square, ESFE36—crosslet) and undisturbed plots (UNDS12—circles, UNDS36—rhomb), 12 and 36 months after event.
Forests 10 00888 g003
Figure 4. Biplot based on symmetric Co-Correspondence analysis illustrating the nematode community structure (a) and their mutual links with plant species (b) common in disturbed (ESFE12, ESFE36) and undisturbed plots (UNDS12, UNDS36), 12 and 36 months after event; 44.6% and 39% of the total variance of each data set. Correlation coefficients between nematode-plants derived site scores of the first three axes of symmetric correspondence canonical analysis (axis 1:0.962, λ1 = 0.0315, p = 0.002, axis 2:0.920) and (axis 1: 0.946, λ1 = 0.020, p = 0.030, axis 2:0.925) respectively. Codes of panel (a) are given in Figure 2; codes of panel (b) in are given in Table 2.
Forests 10 00888 g004
Table 1. Means of main understory plants cover (%) associated with associated with early-successional forest ecosystem (ESFE) and windstorm undisturbed areas (UNDS) 12 and 36 months after event each data is an average of the individual plots and sampling date (mean ± S.D).
PlantCodeESFE12UNDS12ESFE36UNDS36
Calamagrostis epigejosCalmEpig17.5 ± 3.16.6 ± 1.5 **24.6 ± 3.67.0 ± 0.7 **
Agrostis capillarisAgrsCapl14.4 ± 2.25.6 ± 2.3 **10.4 ± 1.84.8 ± 0.4 *
Melica unifloraMelcUnif5.8 ± 1.66.4 ± 1.56.2 ± 1.35.9 ± 1.5
Luzula campestrisLuzlCamp2.4 ± 1.11.4 ± 0.92.8 ± 0.82.2 ± 1.6
Urtica dioicaUrtcDoic3.0 ± 0.70.8 ± 0.85.8 ± 1.31.2 ± 0.8 *
Potentilla reptansPotnRept16.4 ± 2.55.2 ± 0.8 **15.4 ± 2.74.6 ± 0.9 **
Impatiens parvifloraImptParv1.6 ± 1.37.2 ± 1.33.4 ± 0.56.5 ± 1.9 *
Veronica officinalisVernOffc4.2 ± 0.4--5.2 ± 0.8--
Chelidonium majusChelMajs--6.2 ± 1.3 *--5.0 ± 2.2 *
Galium odoratumGaliOdor2.8 ± 0.313.0 ± 2.0 **3.4 ± 1.915.4 ± 1.5 **
Carduus acanthoidesCardAcan4.2 ± 0.8--3.6 ± 1.6--
Melitis melissophyllumMeltMels6.6 ± 2.11.0 ± 1.0 *7.2 ± 1.60.6 ± 0.5 *
Fragaria vescaFragVesc1.6 ± 0.5--2.8 ± 0.8--
Achillea millefoliumAchlMill0.4 ± 0.5--0.6 ± 0.9--
Euphorbia amygdaloidesEuphAmyg11.4 ± 1.90.6 ± 0.5 *22.8 ± 4.21.2 ± 0.8
Carex sp.Carxsp0.2 ± 0.1--0.2 ± 0.2--
Vicia angustifoliaViciAngs----0.1 ± 0.2--
Conyza canadensisConyCand----0.2 ± 0.1--
Significant differences (p < 0.05. p < 0.01) between the damaged area and the same control are denoted by * and **.
Table 2. Values of soil properties associated with early-successional forest ecosystem (ESFE) and windstorm undisturbed areas (UNDS) 12 and 36 months after event. Each data is an average of the individual plots and sampling date (mean ± S.D).
ParameterESFE12UNDS12ESFE36UNDS36
pH/H2O6.59 ± 0.396.80 ± 0.196.53 ± 0.556.6 ± 0.47
SM [%]55.22 ± 2.745.41 ± 3.31 *52.35 ± 3.0563.56 ± 2.92 **
Ntot [%]0.734 ± 0.090.819 ± 0.250.801 ± 0.16 *0.615 ± 0.17
Cox [%]10.898 ± 2.3512.431 ± 3.9114.546 ± 3.51 *8.074 ± 2.26
C/N14.738 ± 1.4915.129 ± 0.7318.797 ± 1.30 *13.146 ± 0.79
Significant differences (p < 0.05. p < 0.01) between the damaged area and the same control are denoted by * and **. SM. soil moisture (% of initial weight); pH (H2O). soil acidity; N. soil nitrogen content (% of dry weight); C. soil carbon content (% of dry weight); C:N. ratio of carbon to nitrogen.
Table 3. Mean abundance of nematode species associated with early successional forest ecosystem (ESFE) and windstorm undisturbed areas (UNDS) 12 and 36 months after event.
Species/TGc-pESFE12UNDS12ESFE36UND36S
Bacterial feeders (BactFeed) 95.3 ± 52.8154.6 ± 78.7132.9 ± 48.9269.0 ± 115.7
Acrobeles ciliatus20.2 ± 1.02.0 ± 0.4-3.3 ± 0.6
Acrobeloides nanus28.4 ± 2.117.2 ± 2.711.5 ± 5.531.9 ± 11.2
Acrolobus emarginatus2---0.6 ± 0.2
Alaimus parvus40.7 ± 0.5---
Alaimus primitivus411.8 ± 2.823.3 ± 11.69.6 ± 2.432.6 ± 24.8
Amphidelus bryophilus (N)4-1.4 ± 2.9-0.8 ± 1.0
Amphidelus elegans43.5 ± 1.16.8 ± 2.23.5 ± 1.84.7 ± 5.4
Anaplectus granulosus21.7 ± 0.75.4 ± 1.74.5 ± 2.45.9 ± 2.8
Aulolaimus oxycephalus33.3 ± 3.62.1 ± 2.03.4 ± 5.74.2 ± 3.9
Bastiania gracilis23.5 ± 1.55.3 ± 1.21.9 ± 0.94.0 ± 2.0
Bunonema sp. 111.4 ± 0.21.1 ± 0.5-0.6 ± 0.5
Cephalobus persegnis218.3 ± 10.71.8 ± 2.515.7 ± 8.88.5 ± 5.7
Ceratoplectus armatus2-0.5 ± 0.5--
Cervidellus vexilliger25.2 ± 3.97.3 ± 4.84.2 ± 5.111.5 ± 9.6
Ereptonema arcticum2-1.2 ± 0.8-4.2 ± 2.4
Eucephalobus mucronatus2-1.5 ± 1.5-2.2 ± 0.7
Eucephalobus striatus21.0 ± 2.02.6 ± 1.47.7 ± 3.910.4 ± 5.5
Eumonhystera dispar20.9 ± 1.0-1.7 ± 0.50.6 ± 0.5
Eumonhystera filiformis21.1 ± 0.80.9 ± 0.84.0 ± 2.32.3 ± 1.6
Heterocephalobus elongatus20.4 ± 0.21.1 ± 0.41.9 ± 0.22.7 ± 1.0
Chiloplacus propinquus2-1.7 ± 0.69.1 ± 2.710.3 ± 1.2
Mesorhabditis spp. juvs19.2 ± 5.117.8 ± 10.07.7 ± 6.730.9 ± 21.7
Panagrolaimus rigidus12.0 ± 0.42.0 ± 1.11.7 ± 0.40.8 ± 0.7
Panagrolaimus sp.11--1.1 ± 0.30.6 ± 0.2
Paramphidelus uniformis4--0.8 ± 0.91.0 ± 1.0
Plectus acuminatus22.7 ± 2.96.2 ± 4.75.4 ± 2.45.6 ± 8.7
Plectus longicaudatus20.9 ± 0.22.0 ± 1.0-1.9 ± 2.5
Plectus parietinus24.1 ± 2.74.5 ± 3.95.0 ± 2.411.0 ± 5.4
Plectus parvus22.4 ± 1.21.9 ± 2.13.2 ± 0.62.9 ± 1.0
Plectus silvaticus20.7 ± 0.50.9 ± 0.51.7 ± 0.80.7 ± 0.7
Prismatolaimus intermedius31.5 ± 0.34.1 ± 2.26.4 ± 2.36.6 ± 5.7
Prismatolaimusdolichurus3-0.8 ± 0.7-0.3 ± 0.1
Rhabditis spp. juvs.111.1 ± 16.715.3 ± 10.821.2 ± 19.653.6 ± 22.7
Teratocephalus costatus30.9 ± 0.92.1 ± 1.56.1 ± 1.24.3 ± 0.9
Teratocephalus terrestris32.0 ± 1.04.4 ± 1.2-1.4 ± 0.8
Wilsonema schuurmansstekhoveni23.6 ± 2.24.6 ± 1.54.5 ± 2.04.1 ± 3.9
Fungal feeders (FungFeed) 23.6 ± 15.550.5 ± 25.231.9 ± 10.966.4 ± 20.3
Aphelenchoides composticola22.5 ± 3.84.7 ± 2.78.2 ± 4.412.1 ± 5.1
Aphelenchoides minimus2-0.9 ± 1.51.4 ± 0.90.9 ± 1.1
Aphelenchoides parietinus22.5 ± 2.52.2 ± 1.83.8 ± 1.95.9 ± 4.0
Aphelenchoides sp. 12-6.0 ± 1.0-5.4 ± 2.1
Aphelenchoides sp. 220.6 ± 0.2-0.6 ± 0.30.3 ± 0.1
Ditylenchus intermedius21.2 ± 0.83.2 ± 1.82.5 ± 0.75.9 ± 2.1
Ditylenchus sp.12-1.1 ± 0.4-0.9 ± 0.5
Ditylenchus sp.220.2 ± 0.20.4 ± 0.21.5 ± 0.51.4 ± 0.5
Tylencholaimus mirabilis48.6 ± 4.215.5 ± 2.74.7 ± 2.917.2 ± 4.3
Tylencholaimus stecki48.0 ± 2.021.9 ± 7.49.2 ± 1.420.7 ± 3.8
Omnivores (Omnivors) 62.8 ± 21.4102.5 ± 34.7124.1 ± 55.682.5 ± 27.8
Aporcelaimellus obtusicaudatus50.4 ± 0.23.2 ± 1.411.3 ± 2.47.0 ± 1.0
Aporcelaimus pachydermus (N)5-1.0 ± 1.00.9 ± 0.6-
Aporcelaimus superbus5-1.6 ± 0.41.6 ± 0.6-
Crassolabium ettersbergense42.3 ± 1.014.2 ± 5.415.1 ± 2.89.1 ± 1.9
Dorylaimus bryophilus43.1 ± 0.57.0 ± 1.26.2 ± 0.65.5 ± 0.7
Dorylaimus spp. juvs415.9 ± 5.727.4 ± 11.323.7 ± 14.728.0 ± 10.4
Ecumenicus monohystera40.5 ± 0.10.5 ± 0.50.6 ± 0.2-
Epidorylaimus lugdunensis41.1 ± 0.40.2 ± 0.21.6 ± 0.41.0 ± 0.6
Eudorylaimus carteri41.1 ± 0.66.3 ± 1.16.7 ± 1.26.8 ± 1.5
Eudorylaimus centrocercus41.4 ± 0.27.9 ± 1.46.4 ± 1.03.6 ± 0.5
Eudorylaimus opistohystera4-1.3 ± 0.41.7 ± 0.2-
Eudorylaimus sp. 14-1.3 ± 0.5--
Eudorylaimus spp. juvs410.4 ± 11.6-8.8 ± 5.95.6 ± 4.8
Mesodorylaimus bastiani53.8 ± 1.64.5 ± 2.724.9 ± 11.22.5 ± 1.8
Mesodorylaimus sp. 15---0.4 ± 0.2
Mesodorylaimus spp. juvs519.7 ± 4.621.1 ± 10.39.2 ± 3.28.8 ± 2.2
Oxydirus oxycephalus51.3 ± 0.52.7 ± 1.11.2 ± 0.81.4 ± 0.7
Paraxonchium laetificans5-0.9 ± 0.42.6 ± 0.61.3 ± 1.0
Prodorylaimus uliginosus51.8 ± 0.51.4 ± 0.41.1 ± 1.01.5 ± 0.9
Pungentus silvestris4--0.5 ± 0.5-
Carnivores (Carnivor) 20.8 ± 15.942.0 ± 17.821.3 ± 10.737.9 ± 14.4
Anatonchus tridentatus42.1 ± 1.04.1 ± 1.52.7 ± 1.55.0 ± 1.0
Clarkus papillatus42.6 ± 0.46.8 ± 1.06.6 ± 0.86.4 ± 2.8
Coomansus zschokkei40.2 ± 0.20.4 ± 0.2-1.7 ± 0.4
Miconchus hopperi40.5 ± 0.44.2 ± 1.1-4.3 ± 0.7
Mononchus parvus42.9 ± 0.64.2 ± 3.4-1.1 ± 2.0
Mylonchulus brachyuris4-1.6 ± 1.81.9 ± 0.41.1 ± 1.0
Mylonchulus sigmaturus44.7 ± 2.26.8 ± 1.52.7 ± 2.010.5 ± 3.6
Prionchulus muscorum41.1 ± 0.81.7 ± 2.0-0.6 ± 1.1
Tripyla affinis32.6 ± 1.00.2 ± 0.2--
Tripyla setifera33.2 ± 1.0-2.0 ± 0.51.1 ± 0.5
Tripylina sp. 130.9 ± 0.411.4 ± 2.34.1 ± 1.05.8 ± 1.2
Tigronchoides ginglymodontus4-0.6 ± 0.41.3 ± 0.50.3 ± 0.1
Plant parasites (PlantPars) 131.1 ± 55.4212.0 ± 98.2136.7 ± 37.7236.8 ± 69.5
Criconema princeps3-0.4 ± 0.2-1.3 ± 0.6
Gracilacus straeleni2-2.5 ± 0.43.1 ± 1.09.4 ± 2.1
Helicotylenchus digonicus319.8 ± 4.439.3 ± 11.735.3 ± 9.972.3 ± 14.6
Helicotylenchus pseudorobustus3-4.7 ± 0.82.2 ± 0.53.4 ± 0.6
Paralongidorus rex (N)51.8 ± 0.21.1 ± 0.22.1 ± 0.42.5 ± 0.4
Paratylenchus projectus25.7 ± 1.06.3 ± 1.12.3 ± 1.64.6 ± 2.4
Paratylenchus spp. juvs220.3 ± 5.82.5 ± 0.85.5 ± 1.53.2 ± 0.8
Paratrichodorus pachydermus4-1.4 ± 3.22.7 ± 0.67.2 ± 2.2
Trichodorus sparsus41.7 ± 0.61.2 ± 0.24.5 ± 1.90.8 ± 0.2
Aglenchus agricola26.1 ± 3.613.1 ± 5.56.9 ± 2.215.7 ± 4.9
Basiria tumida2--1.1 ± 1.00.6 ± 0.2
Boleodorus thylactus23.4 ± 1.58.0 ± 2.35.7 ± 4.69.2 ± 2.8
Coslenchus costatus21.9 ± 2.29.3 ± 4.1-9.2 ± 3.0
Filenchus vulgaris234.4 ± 17.461.5 ± 29.732.5 ± 20.670.0 ± 41.1
Malenchus bryophilus235.4 ± 24.863.6 ± 36.434.0 ± 10.937.0 ± 15.5
Psilenchus hilarulus20.2 ± 0.2-1.9 ± 0.51.1 ± 0.6
Tylenchus elegans20.4 ± 0.2---
Number of species 64786782
(N)—species new for Slovak nematode fauna.
Table 4. Total nematode abundance, number of species, nematode functional guilds abundance associated with early-successional forest ecosystem (ESFE) and windstorm undisturbed areas (UNDS), 12 and 36 months after event. Each data is an average of the individual plots and sampling date (mean ± S.D).
ESFE12UNDS12ESFE36UNDS36
Nematode abundance663.8 ± 99.7 **1126.5 ± 55.5813.8 ± 99.4 **1489.8 ± 134.6
Nematode species number39.8 ± 2.8 **53.2 ± 5.645.7 ± 3.6 *59.2 ± 4.1
Ba143.6 ± 15.558.8 ± 20.963.4 ± 11.3 **173.1 ± 54.7
Ba2107.8 ± 28.7132.4 ± 22.3145.6 ± 36.5 *253.2 ± 44.2
Ba311.9 ± 8.7 *35.2 ± 12.433.5 ± 12.833.7 ± 18.5
Ba427.4 ± 13.9 **81.0 ± 27.724.6 ± 4.2 *78.3 ± 19.9
Ca313.3 ± 11.623.1 ± 14.212.3 ± 10.113.8 ± 11.2
Ca428.4 ± 10.8 *60.9 ± 3.530.5 ± 9.9 *61.9 ± 24.7
Fu214.0 ± 3.7 **26.0 ± 2.226.0 ± 9.5 *57.0 ± 9.6
Fu433.2 ± 17.4 *74.8 ± 17.627.8 ± 22.9 *75.7 ± 25.3
Om471.4 ± 14.2 *132.2 ± 19.5119.2 ± 56.5142.8 ± 16.6
Om554.0 ± 10.0 *72.8 ± 9.345.7 ± 14.0 *105.5 ± 59.1
Pp2215.6 ± 67.1 **333.6 ± 44.0185.9 ± 29.8 **319.8 ± 59.0
Pp339.6 ± 10.8 *98.7 ± 27.775.0 ± 22.1 *154.0 ± 48.8
Pp43.5 ± 3.65.0 ± 6.324.4 ± 12.916.1 ± 8.1
Pp52.5 ± 1.32.2 ± 3.93.8 ± 2.95.0 ± 5.8
Significant differences (p < 0.05. p < 0.01) between the damaged area and the same control are denoted by * and **. Ba1.2.3.4. bacterivores; Fu2.3.4. fungivores; Ca3.4.5. carnivores; Om4.5. omnivores; Pp2.3.5. plant parasites.
Table 5. Spearman´s rank correlation coefficients between nematode abundance, species number, functional guilds, nematode community, and ecological indices; microbial parameters and soil properties (SM, soil moisture content; pH/H2O; acidity; N, total nitrogen content; C, organic carbon content; C/N, carbon to nitrogen ratio).
SMpH/H2ONCC/N
Nematode abundancensnsnsns−0.45 *
Number of speciesnsnsnsnsns
Ba1nsns−0.45 *−0.56 **−0.54 **
Ba20.53 *ns−0.47 *−0.48 *ns
Ba3nsnsnsnsns
Ba4nsnsnsnsns
Ca3ns0.48 *nsnsns
Ca4ns0.60 **nsnsns
Fu20.46*ns−0.51 *nsns
Fu4nsns−0.49 *−0.47 *−0.47 *
Om4nsnsnsnsns
Om5nsnsnsnsns
Pp20.48 *nsnsnsns
Pp30.55 **nsnsnsns
Pp40.50 *nsnsnsns
Pp5nsnsnsnsns
Species Diversity Index (H´spp)nsnsnsnsns
Trophic Diversity Indexnsnsnsnsns
Nematode Channel Rationsns0.42 *0.48 *0.55 **
Maturity Indexnsnsnsns0.41 *
Maturity Index (2–5)nsnsnsnsns
Sigma Maturity Indexnsnsnsnsns
Plant Parasitic Index0.58 **nsnsns−0.47 *
Channel Indexnsns0.55 **0.41 *0.52 **
Basal Indexnsnsnsnsns
Enrichment Indexnsns−0.50 *−0.53 **ns
Structure Index−0.39 *nsnsns0.41 *
Basal respiration (μg CO2-C g−1 h−1)nsnsnsnsns
Catalase activity (ml O2 g−1 min−1)nsnsnsnsns
N mineralisation (μg NH4-N g−1 day−1)nsns0.38 *nsns
Microbial biomass (μg C g−1)ns0.40 *nsnsns
Microbial richnessnsnsnsnsns
Microbial diversity−0.47 *ns0.44 *0.58 **0.44 *
* p< 0.05; ** p < 0.01; ns - not significant.
Table 6. Microbial community indicators associated with early successional forest ecosystem (ESFE) and windstorm undisturbed areas (UNDS) 12 and 36 months after event. Each data is an average of the individual plots and sampling date (mean ± S.D).
CodeESFE12UNDS12ESFE36UNDS36
Basal respiration (μg CO2-C g−1 h−1)BaslResp1.4765 ± 0.291.4809 ± 0.430.7992 ± 0.15 **1.6432 ± 0.22
Catalase activity (ml O2 g−1 min−1)CatlActv2.8765 ± 0.232.5968 ± 0.533.7146 ± 0.763.6907 ± 1.21
N mineralisation (μg NH4-N g−1 day−1)NMiner10.253 ± 2.1013.594 ± 5.565.6472 ± 1.37 **13.128 ± 2.98
Microbial biomass (μg C g−1)MicrBiom653.21 ± 180.29694.28 ± 307.3455.84 ± 47.9 *541.29 ± 56.3
Microbial richnessMicrRich25.4 ± 1.3426.2 ± 0.8326.0 ± 1.024.8 ± 1.3
Microbial diversityMicrDivr15.147 ± 1.5615.154 ± 1.2012.23 ± 0.4913.552 ± 1.85
Significant differences (p < 0.05. p < 0.01) between the damaged area and the same control are denoted by * and **.
Table 7. Nematode community indices, biomass, and metabolic footprints associated with early successional forest ecosystem (ESFE) and windstorm undisturbed areas (UNDS) 12 and 36 months after event. Each data is an average of the individual plots and sampling date (mean ± S.D).
IndicesESFE12UNDS12ESFE36UNDS36
Maturity Index2.88 ± 0.6 *3.21 ± 0.32.96 ± 0.63.12 ± 0.4
Maturity Index (2–5)3.16 ± 0.23.29 ± 0.13.13 ± 0.2 *3.45 ± 0.4
Sigma Maturity Index2.71 ± 0.22.84 ± 0.22.71 ± 0.22.73 ± 0.1
Plant Parasitic Index2.36 ± 0.12.42 ± 0.12.48 ± 0.82.59 ± 0.7
Species Diversity Index (H´spp)3.06 ± 0.1 *3.37 ± 0.13.42 ± 0.23.59 ± 0.1
Trophic Diversity Index 16.1 ± 2.1 *21.8 ± 1.822.4 ± 2.723.6 ± 2.1
Nematode Channel Ratio0.81 ± 0.040.78 ± 0.010.80 ± 0.030.82 ± 0.03
Channel Index31.4 ± 16.538.8 ± 17.728.6 ± 6.3 *42.9 ± 5.6
Basal Index13.9 ± 4.610.9 ± 1.814.1 ± 1.213.3 ± 0.8
Enrichment Index57.9 ± 8.060.0 ± 9.659.4 ± 5.266.3 ± 4.3
Structure Index82.7 ± 6.286.6 ± 2.882.2 ± 1.582.1 ± 1.8
Total biomass, mg 2.6 ± 1.7 **5.2 ± 1.64.49 ± 0.95.4 ± 1.3
Composite footprint416.5 ± 216.0757.7 ± 201.1684.8 ± 275.3953.2 ± 169.5
Enrichment footprint53.1 ± 29.978.1 ± 29.795.2 ± 19.8 *240.1 ± 94.1
Structure footprint 338.8 ± 216.2633.2 ± 216.5550.1 ± 254.8627.6 ± 175.3
Herbivore footprint 9.2 ± 3.1 *29.9 ± 10.220.1 ± 4.6 *50.2 ± 15.9
Fungivore footprint11.4 ± 4.3 *24.9 ± 12.712.5 ± 5.3 *30.8 ± 4.5
Bacterivore footprint68.9 ± 28.7 *102.9 ± 23.7118.9 ± 22.3 *282.9 ± 104.0
Predator footprint39.8 ± 13.0 *69.9 ± 7.226.3 ± 10.4 *61.1 ± 19.4
Omnivore footprint294.2 ± 86.1 *570.7 ± 107.9509.9 ± 159.6556.3 ± 187.1
Significant differences (p < 0.05. p < 0.01) between the damaged area and the same control are denoted by * and **.

