Article

Photosynthetic Performance in Pinus canariensis at Semiarid Treeline: Phenotype Variability to Cope with Stressful Environment

by
Águeda María González-Rodríguez
*,
Patricia Brito
,
Jose Roberto Lorenzo
and
María Soledad Jiménez
Department of Botany, Ecology and Plant Physiology, University of La Laguna, Apdo. 456, 38200 Tenerife, Spain
*
Author to whom correspondence should be addressed.
Forests 2019, 10(10), 845; https://doi.org/10.3390/f10100845
Submission received: 1 August 2019 / Revised: 23 September 2019 / Accepted: 25 September 2019 / Published: 27 September 2019
(This article belongs to the Special Issue Alpine and Polar Treelines in a Changing Environment)

Abstract

:
Low temperatures represent the most important environmental stress for plants at the treeline ecotone; however, drought periods at the semiarid treeline could modify photosynthetic performance patterns. Gas exchange, chlorophyll fluorescence, photosynthetic pigments, and α-tocopherol were measured in a Pinus canariensis forest located at a semiarid treeline forest at 2070 m altitude over a whole year. The level of summer drought, caused by an extended period without rain and very low previous rainfall, was remarkable during the study. Furthermore, the cold season showed extraordinarily low temperatures, which persisted for five months. All of these factors combined made the study period an extraordinary opportunity to improve our understanding of photosynthetic performance in a drought-affected treeline ecotone. A high dynamism in all the measured parameters was detected, showing robust changes over the year. Maximum photosynthesis and optimal values were concentrated over a short period in spring. Beyond that, fine regulation in stomatal closure, high WUEi with a great plasticity, and changes in pigments and antioxidative components prevented dehydration during drought. In winter, a strong chronic photoinhibition was detected, and α-tocopherol and β-carotene acquired a main role as protective molecules, accompanied by morphological variations as changes in specific leaf areas to avoid freezing. The recovery in the next spring, i.e., after these extreme environmental conditions returned to normal, showed a strategy based on the breakdown of pigments and lower photosynthetic functions during the winter, and rebuilding and regreening. So, a high level of plasticity, together with some structural and physiological adaptations, make P. canariensis able to cope with stresses at the treeline. Nevertheless, the carbon gain was more limited by drought than by low temperatures and more extended droughts predicted in future climate change scenarios may strongly affect this forest.

1. Introduction

At high-mountain habitats and treeline ecotones, many environmental factors may be described as stressful for plants. In general, from a world-wide perspective, the most important is freezing, referring to temperatures which are so low that plant tissues suffer irreversible damage due to ice formation [1]. Nevertheless, other factors are frequently detected.
One of the most challenging stresses that should be closely studied is photoinhibition. Photoinhibition is a result of the overexcitation of the photosynthetic apparatus when a large amount of light energy is trapped by chlorophylls and an excess cannot be safely dissipated [2]. This overexcitation carries with it the potential to damage the photosystem II (PSII) [3]. This circumstance can arise only through exposure to high levels of light, but it acquires a leading role in cases where additional stress factors limit photosynthesis, thereby, reducing the light saturation.
In treeline forests, this photoinhibition occurs mainly during low temperatures which are frequent in the cold seasons. Chilling temperatures cause the loss of metabolic activity and impairments in photosynthesis; therefore, plants in this ecotone are more susceptible to photoinhibition [4].
The decrease in photosynthetic rates, and therefore the enhancement in photoinhibition risk, are not only caused by low temperatures. Decreases in photosynthetic rates in response to environmental constraints are highly species- and environment-specific [5]. Furthermore, limitations could be enhanced by regional climatic features, such as drought prevalence. Low soil water availability is a serious factor for photosynthesis, and although drought has not been considered as a specific tree-line condition [1], it may severely affect tree behavior.
All of these environmental restrictions have been shown to greatly impact the photosynthetic performance of trees. Plants have acquired a complete set of several mechanisms to maintain a balance between the energy input and its utilization, such as light avoidance (for example, leaves and/or chloroplast movements), the screening of radiation (mainly by phenolic components), the dissipation of absorbed light energy, the cyclic electron flow around photosystem I (PSI), the photorespiration pathway, and the scavenging systems of reactive oxygen species (ROS). The latter includes multiple enzymes (i.e., superoxide dismutase, ascorbate peroxidase…) and antioxidants as α-tocopherol and carotenoids, such as zeaxanthin, neoxanthin, and lutein [6,7,8,9,10]. Furthermore, carotenoids are involved in thermal energy dissipation. In this case, the excess of absorbed energy is dissipated by the light-harvesting complexes as harmless, longer wavelengths with the conversion of violaxanthin (V) to zeaxanthin (Z) via antheraxanthin (A) (VAZ cycle) [3].
In these respects, photooxidative stress and photoinhibition play important roles in treeline environmental conditions. Trees growing at high altitudes have developed efficient systems with high concentrations of antioxidants and photoprotective carotenoids in order to obtain better protection [11]. As environmental conditions are incessantly changing and limiting the presence of optimal conditions for plants, all the protection mechanisms have to be continuously adapted to this changing environment. As a consequence, plants which are able to display continuous and reversible changes in their physiologies and morphologies in response to punctual or cyclic changes may have a clear selective advantage [12].
In the subtropical oceanic Canary Islands, the treeline shows a semiarid Mediterranean climate which receives less rainfall than the lowland areas, mainly due to the existence of a quasi-permanent inversion layer [13,14]. High temperatures occur in the summer, while freezing and chilling temperatures are commonly registered for several months; furthermore, despite the islands’ oceanic localization, thermal oscillations are high. Due to all this, the Canary Islands treeline, with the endemic Pinus canariensis (Chr. Sm. ex DC in Buc) as the only tree species, may be considered a great natural laboratory to test the responses of trees to the environmental constraints which are representative of high altitudes, including under drought conditions.
Furthermore, treelines are considered very vulnerable to climate change. In future conditions, recurrent droughts may be present, and warmer temperatures are expected to be up to three times higher than the global average rate of warming [15,16]. So, the variability in photosynthetic and functional performance in the Canary Islands treeline could serve as an initial proxy to understand how an ecosystem will respond to the forecasted climate changes. A large amount of literature on treelines on a global scale exists; nevertheless, studies carried out on island treelines are scarce [17]. Several studies on water and CO2 fluxes in this ecotone have been undertaken in recent years [18,19,20,21]; nevertheless, seasonal photosynthetic activity and physiological parameters have received little attention [22].
Although, the treeline position on large-scale is determined primarily by thermal limitations [23], the aim of this study was to test whether an additional constraint, i.e., drought, could modify photosynthetic performance patterns. Furthermore, the plasticity of the physiological features under these specific environmental conditions was also evaluated. Finally, all the results were viewed within the context of a changing global climate, in which warmer temperatures and recurrent drought conditions are expected.

2. Materials and Methods

2.1. Study Site and Meteorological Conditions

This study was conducted in a treeline forest located in Las Cañadas of Teide National Park, Tenerife (28°18′21.5″ N, 16°34′5.8″ W; Canary Islands, Spain), in an extreme distribution area of the pine forest. The study plot was at an elevation of 2070 m above sea level, where the dominant species was P. canariensis, with an almost non-existent understory. After reforestation in 1950–1960, the canopy reached 17 m in height in 2008, with a stand density of 291 trees ha−1, a basal stem area of 53.8 m2 ha−1, and a leaf area index (LAI) of 3.4 m2 m−2. More details concerning the stand and climatic conditions are described in [20].
The main climatic features are characterized by a semiarid Mediterranean climate with a mean annual precipitation of 368 mm, where the drought period lasts from June to August, and precipitation is concentrated in late autumn and winter. The drought period coincides with the highest temperatures, while the minimum temperatures (subzero) are reached in the rainy period [20].
The climatic conditions over the course of the year were followed from an automatic meteorological station (MiniCube VV/VX16, EMS, Brno, CZ) located in a clearing at the edge of the experimental plot. Global radiation (EMS11, EMS, Brno, CZ), precipitation (MetOne370/376, EMS, Brno, CZ), air temperature (Tair), and relative air humidity (RH) (EMS33, EMS, Brno, CZ) at 1.5 m above ground were taken every minute and 30-min averages were recorded in a data logger (ModuLog 1029, EMS, Brno, CZ). The vapor pressure deficit (VPD) was calculated based on air temperature and relative air humidity. In addition, soil water potential (SWP) and soil water content (SWC) were also measured with three gypsum blocks and three soil moisture sensors (EC-10, Decagon Devices), respectively, to a depth of 30 cm at three locations; 30-min averages were recorded during the study period.

2.2. Measurements of Gas Exchange at Field Site

Leaf gas exchange rates of one-year-old needles were measured in sun-exposed branches in five representative trees at the field site. Measurements were done throughout the year, each 15d or 20 d, on a total of 19 d, using a portable infrared gas analyzer (LCA-4, ADC, Hoddesdon, UK) equipped with a 6.25 cm2 leaf chamber. In order to estimate differences in seasonal assimilation rates, measurements were always taken in the morning, where maximum rates have been recorded for this species [24]. The net CO2 assimilation rate (An), transpiration (E), stomatal conductance (gs) and intercellular CO2 concentration (Ci) were calculated according to [25], and related to, the projected needle surface area. This area was estimated by measuring the length and diameter of the needle portion exposed in the leaf chamber, while ensuring that the projected leaf area of the fascicles was 300 mm2 (nine to ten needles). During measurements, leaf temperature (TL) and photosynthetic photon flux density (PPFD) were also recorded. Moreover, the instantaneous water efficiency (WUEi) was calculated as the ratio between An and E (µmol CO2 assimilated per mmol of water transpired) and intrinsic water use efficiency was calculated as An/gs (µmol mol−1).
All measured data during the whole period were set together in a broad analysis in order to obtain optimal ranges of gas exchange variations with environmental factors. For this approach, the boundary line in a scatter diagram was estimated by selecting the optimal cause-and-effect relationship between two variables [24,26]. These relationships were calculated using the Origin 8 software (Origin Lab., USA). In the analysis of An versus PPFD, a light-response curve was fitted, using the quadratic equation of [27]:
A n   =   P P F D +   A n m a x ( (   P P F D + A n m a x ) 2 4   P P F D k   A n m a x ) 2 k   R d a y
where An is net CO2 assimilation (µmol CO2 m−2 s−1), ø is the photosynthetic efficiency on a quantum basis as the initial slope of the light curve response, PPFD is photosynthetic photonic flux density (µmol photons m−2 s−1), Anmax is light-saturated rate of gross photosynthesis (µmol CO2 m−2 s−1), k is convexity and Rday is dark respiration (µmol CO2 m−2 s−1). All parameters were estimated using Photosyn Assistant software, version 1.1.2 (Dundee Scientific, Dundee, UK).

2.3. Chlorophyll Fluorescence Measurements

The chlorophyll fluorescence throughout the entire period was measured at midday using similar and very close needles to those used in the gas exchange measurements. These measurements were done with a portable fluorimeter (HandyPEA, Plant Efficiency Analyzer, Hansatech, UK) on dark, adapted needles (30 min) to determine the basal fluorescence (Fo). After a saturating red light pulse (650 nm, 3000 μmol photons m−2 s−1) flashed by an array of six light-emitting diodes on a homogeneous irradiation area, the maximum fluorescence (Fm) was determined. FV/FM was calculated as the ratio (Fm − Fo)/Fm according to [28]. From this parameter, chronic photoinhibition (PIchr) was calculated as the percentage reduction in predawn FV/FM (FV/FM pd) relative to the annual maximum FV/FM measured in this species, and the dynamic photoinhibition (PIdyn) was calculated from midday FV/FM (FV/FM md) as the additional decrease [29]. Therefore:
PIchr = (FV/FM max − FV/FM pd)/(FV/FM max) × 100
PIdyn = (FV/FM pd − FV/FM md)/(FV/FM max) × 100
This approach is based on [30], that distinguishes between short- and long-term inhibitions. So, dynamic photoinhibition describes a fully reversible decrease in FV/FM, whereas chronic refers to a sustainable decrease in values at predawn. Total photoinhibition was calculated as the sum of chronic and dynamic photoinhibition.
Chlorophyll fluorescence transients induced by the saturating light pulse were recorded for 2 s, and the OJIP curve and derived parameters were calculated with PEAPlus V1.10 (Hansatech, UK). The fluorescence transient makes it possible to examine the single steps of the different movements in the initial phase of the electron transport chain. For example, energy fluxes through the PSII per active center of reaction (CR), denominated specific fluxes, or specific activities could be calculated where: ABS/CR is the effective antenna size of an active CR, TR0/CR is the maximal trapping rate of PSII (maximal rate by which an exciton is trapped by the CR), DI0/CR is the effective dissipation in an active CR, and ET0/CR is the electron transport in an active CR. Furthermore, the performance index on the basis of absorption, PIABS, could be also calculated, considering three independent steps contributing to photosynthesis: relative number of CRs per unit of absorbing chlorophyll, the flux trapping ratio per unit of absorbed energy, and the electron transport flux ratio beyond QA per trapping [31,32]. In recent years, all these parameters have become a powerful tool with which to study different stresses [33].

2.4. Pigments and Tocopherol Contents

Photosynthetic pigments and tocopherol determinations were made on the same days as the gas exchange and fluorescence measurements. In the predawn, a central section of needles was collected, frozen in liquid N2, and stored at −80 °C until analysis. Sections of the needles were pulverized in a mortar with liquid nitrogen and extracted in acetone with CaCO3 in order to determine chloroplast pigments and tocopherol contents. Pigments and tocopherols were separated and quantified by reverse phase HPLC (Waters, Ireland). The chromatography was performed in a reverse phase Spherisorb ODS-1 C18 column (Waters, Ireland) and a Simetry C-18 guard column (Waters, Ireland). For the analysis of the pigments, the mobile phase was solvent A (acetonitrile: Water:methanol; 100:5:10 by vol.) and solvent B (acetone:etilacetate; 2:1 by vol.), where pigments were eluted using a lineal gradient 90% (A) to 10% (B) in 17 min, 17–28 min 80% (A) to 20% (B), and finally, returning within 5 min to the first condition described. All the pigments were assessed with a UV-VIS diode array detector (visible) at 440 nm (Waters 2996, Waters, Ireland). For the tocopherol analysis, a mobile phase with 1ml methanol was used and the detection was achieved with a fluorescence detector (Waters SFD 2475, Waters, Ireland), with excitation at 295 nm and emission at 325 nm [34].

2.5. SLA and Needles Water Potential Determinations

The specific leaf area (SLA; cm2 projected area g−1 dry mass) was calculated in the same needles used for pigments and tocopherol analysis as the quotient of projected area and dry mass (72 h at 70 °C) in order to test the differences on morphological structure over the year.
In addition, needle water potential (Ψ) was measured from June to October (drought period) at predawn in order to obtain supplementary assessment of water status. For that, Ψ was measured in 15 samples (3 samples in 5 trees) using a pressure chamber (PMS Instruments Co., Corvallis, OR, USA).

2.6. Statistical Analysis

Differences in parameters were evaluated by season and/or days with analysis of variance (ANOVA). Homogeneity of variances was tested with Levene’s test, and post hoc comparisons were computed according to Tukey test. Data were transformed in order to retain normality and homogeneity. A Tamhane test was used when homogeneity was not achieved. Differences at P < 0.05 were regarded as being statistically significant. Calculations were performed using the software package SPSS 21.0 (SPSS, Inc., Chicago, IL, USA).

3. Results

3.1. Meteorological Conditions

The main meteorological parameters followed the main features of the climatic conditions. In spring, mild temperatures were registered, with a daily mean Tair of 12.5 °C and with soil water availability at topsoil (SWP = −0.0524 MPa). In summer, the highest mean daily Tair were registered, with a maximum value of 31.3 °C (Figure 1), with associated high VPD values (mean daily VPD = 2.16 kPa). Furthermore, SWP displayed the lowest values, highlighting the top soil drought during the entire summer period (Table 1). After that, rains were registered during autumn and winter. During this rainy period, temperatures were low, with a mean daily Tair close to 10 °C and with remarkably cold temperatures from the end of October to March, where a mean daily Tair of 5.7 °C was registered, reaching temperatures even below 0 °C (minimum Tair = −5.66 °C) (Figure 1). During this period, SWP reached its maximum, with values very close to zero (Table 1).
Moreover, the high thermal oscillation over the entire year should be taken into account, with values reaching 16 °C on the days of the measurements, but were even higher throughout the entire year (Figure 1).

3.2. Broad Analysis of Gas Exchange Parameters: Detecting Optimal Values

Our measurements carried out on 5 trees and with a great variability of environmental factors displayed very variable data throughout the whole period. The plotting all data of each parameter versus meteorological variables and boundary lines of data clouds (lines at the upper surface of data), maximum rates, when other parameters were not limiting, were calculated. More than 2000 data points were used on the calculations, ensuring a suitable approximation to optimal values [24,35,36,37]. Therefore, the relationships between gas exchange parameters and meteorological parameters were tested by regressing the values at the edge of the body of data which enable a best fit equation of these variables pooled throughout the entire measurement period.
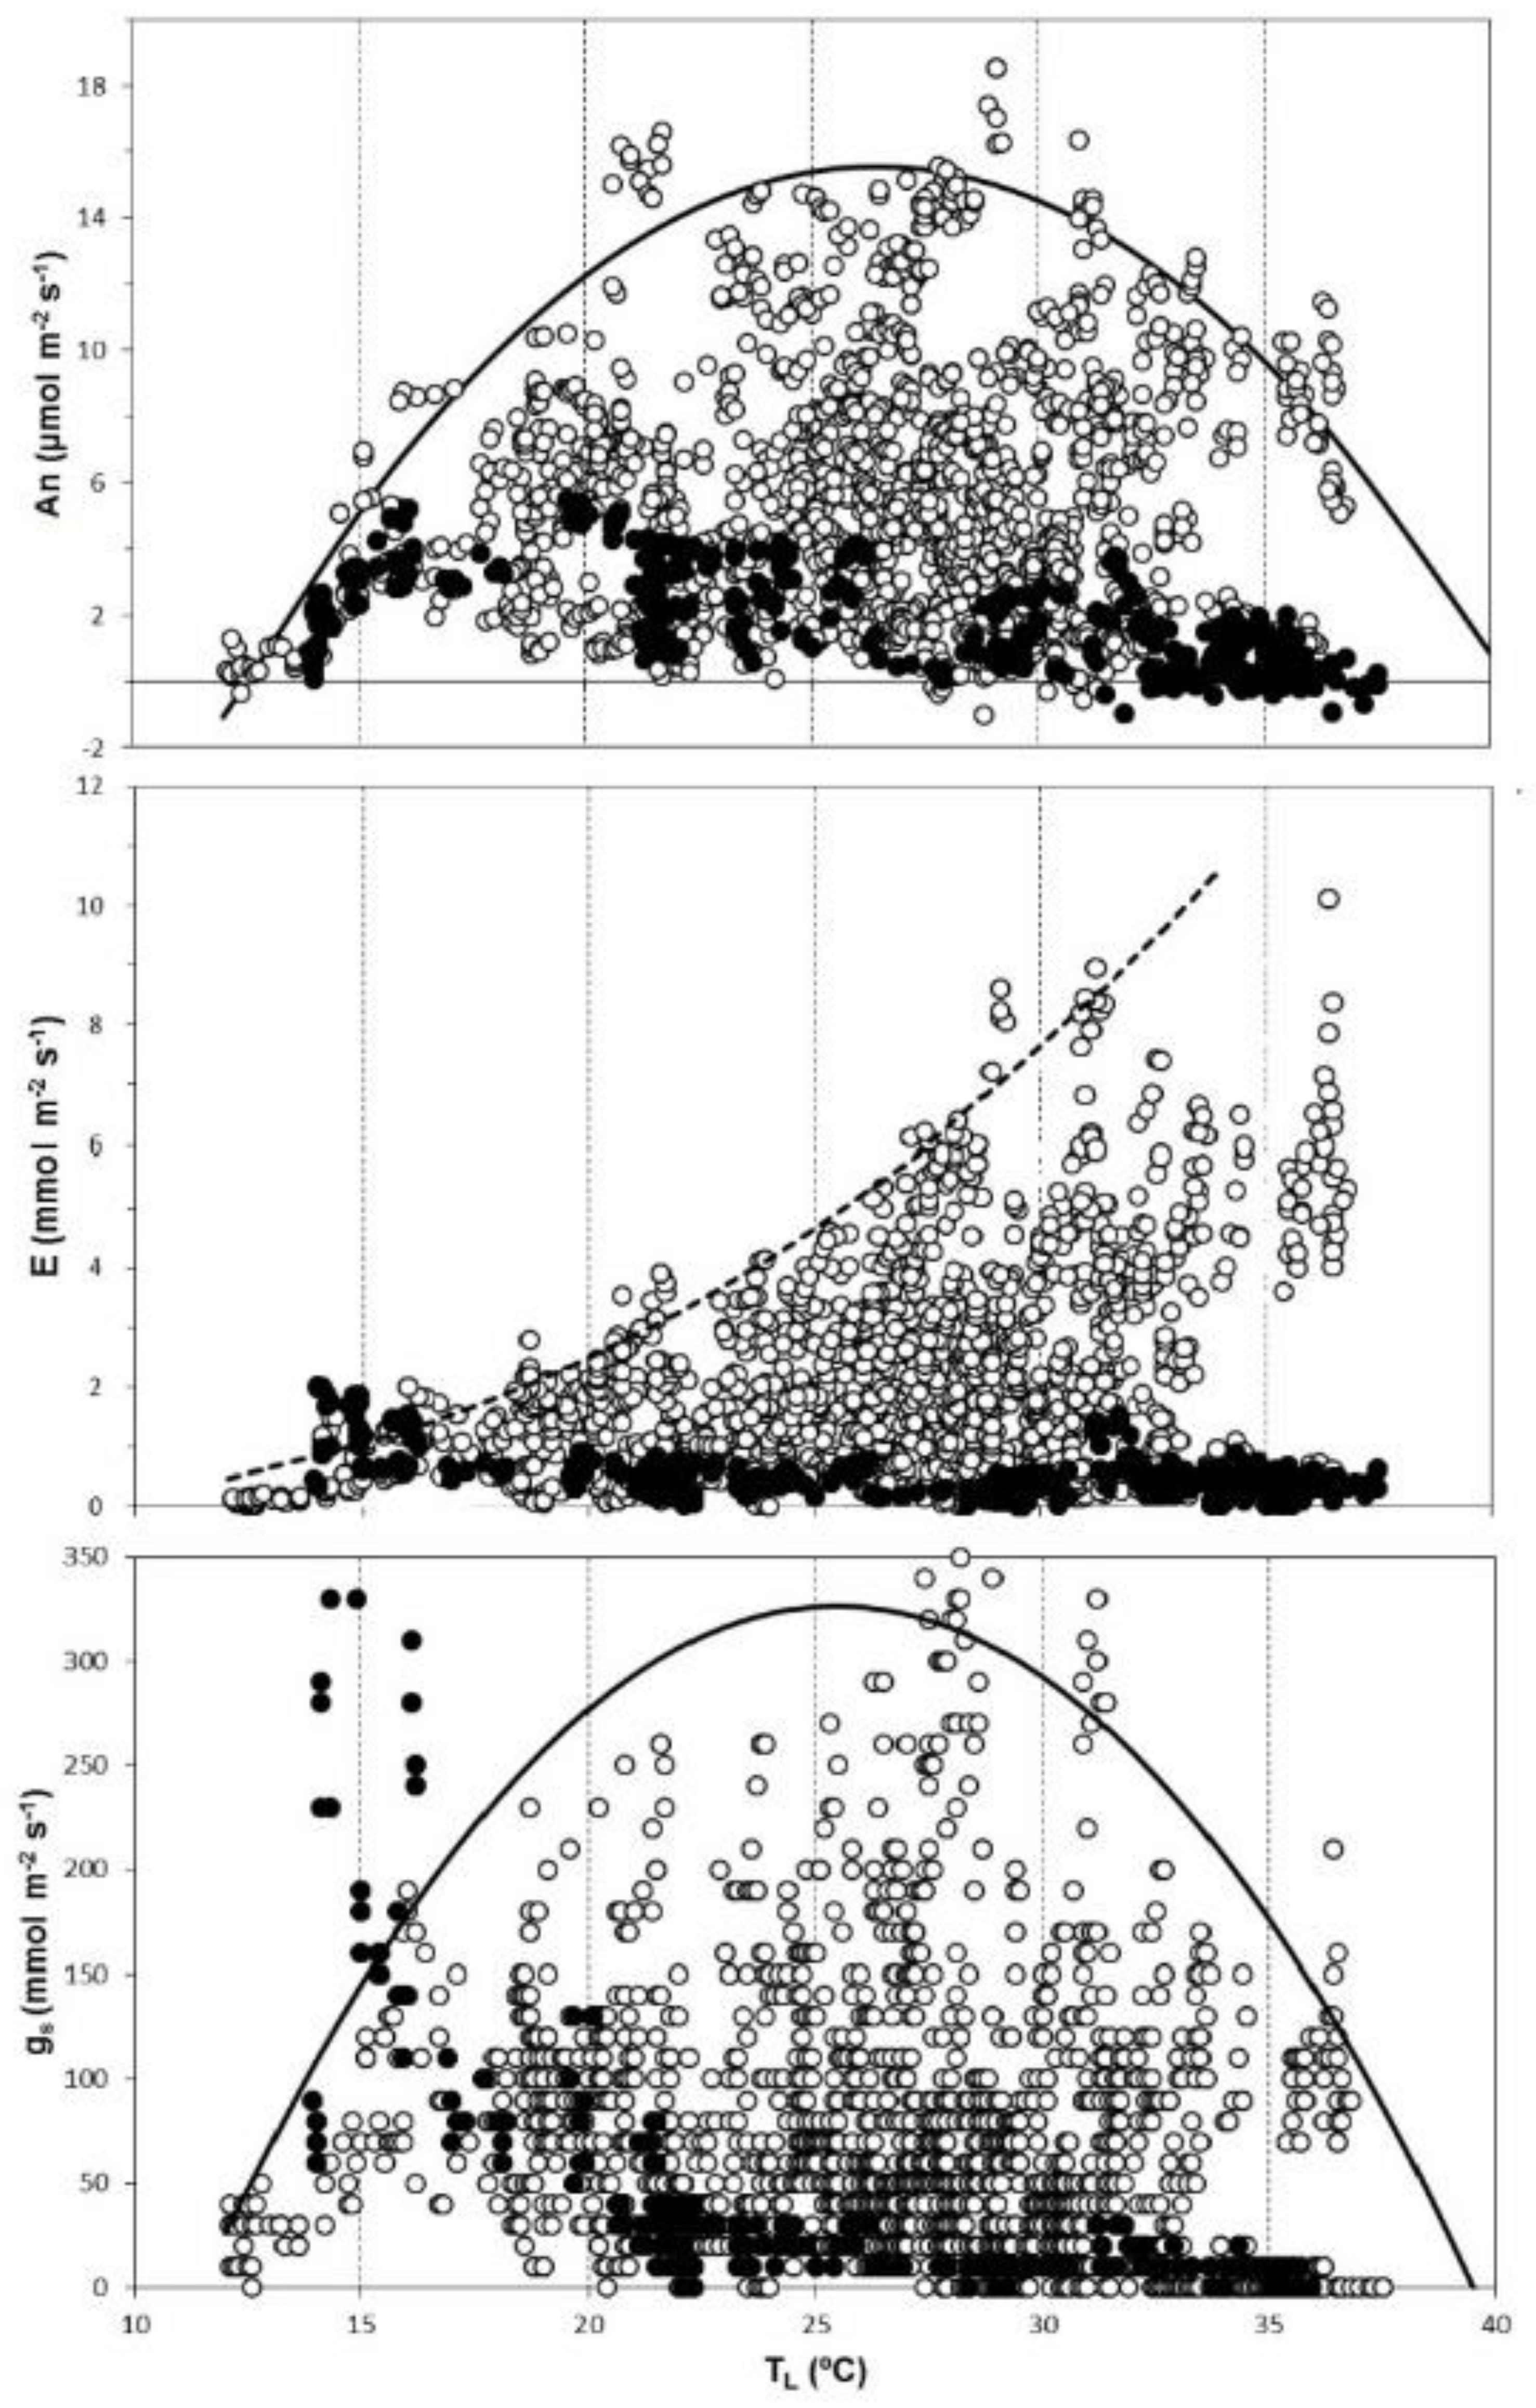
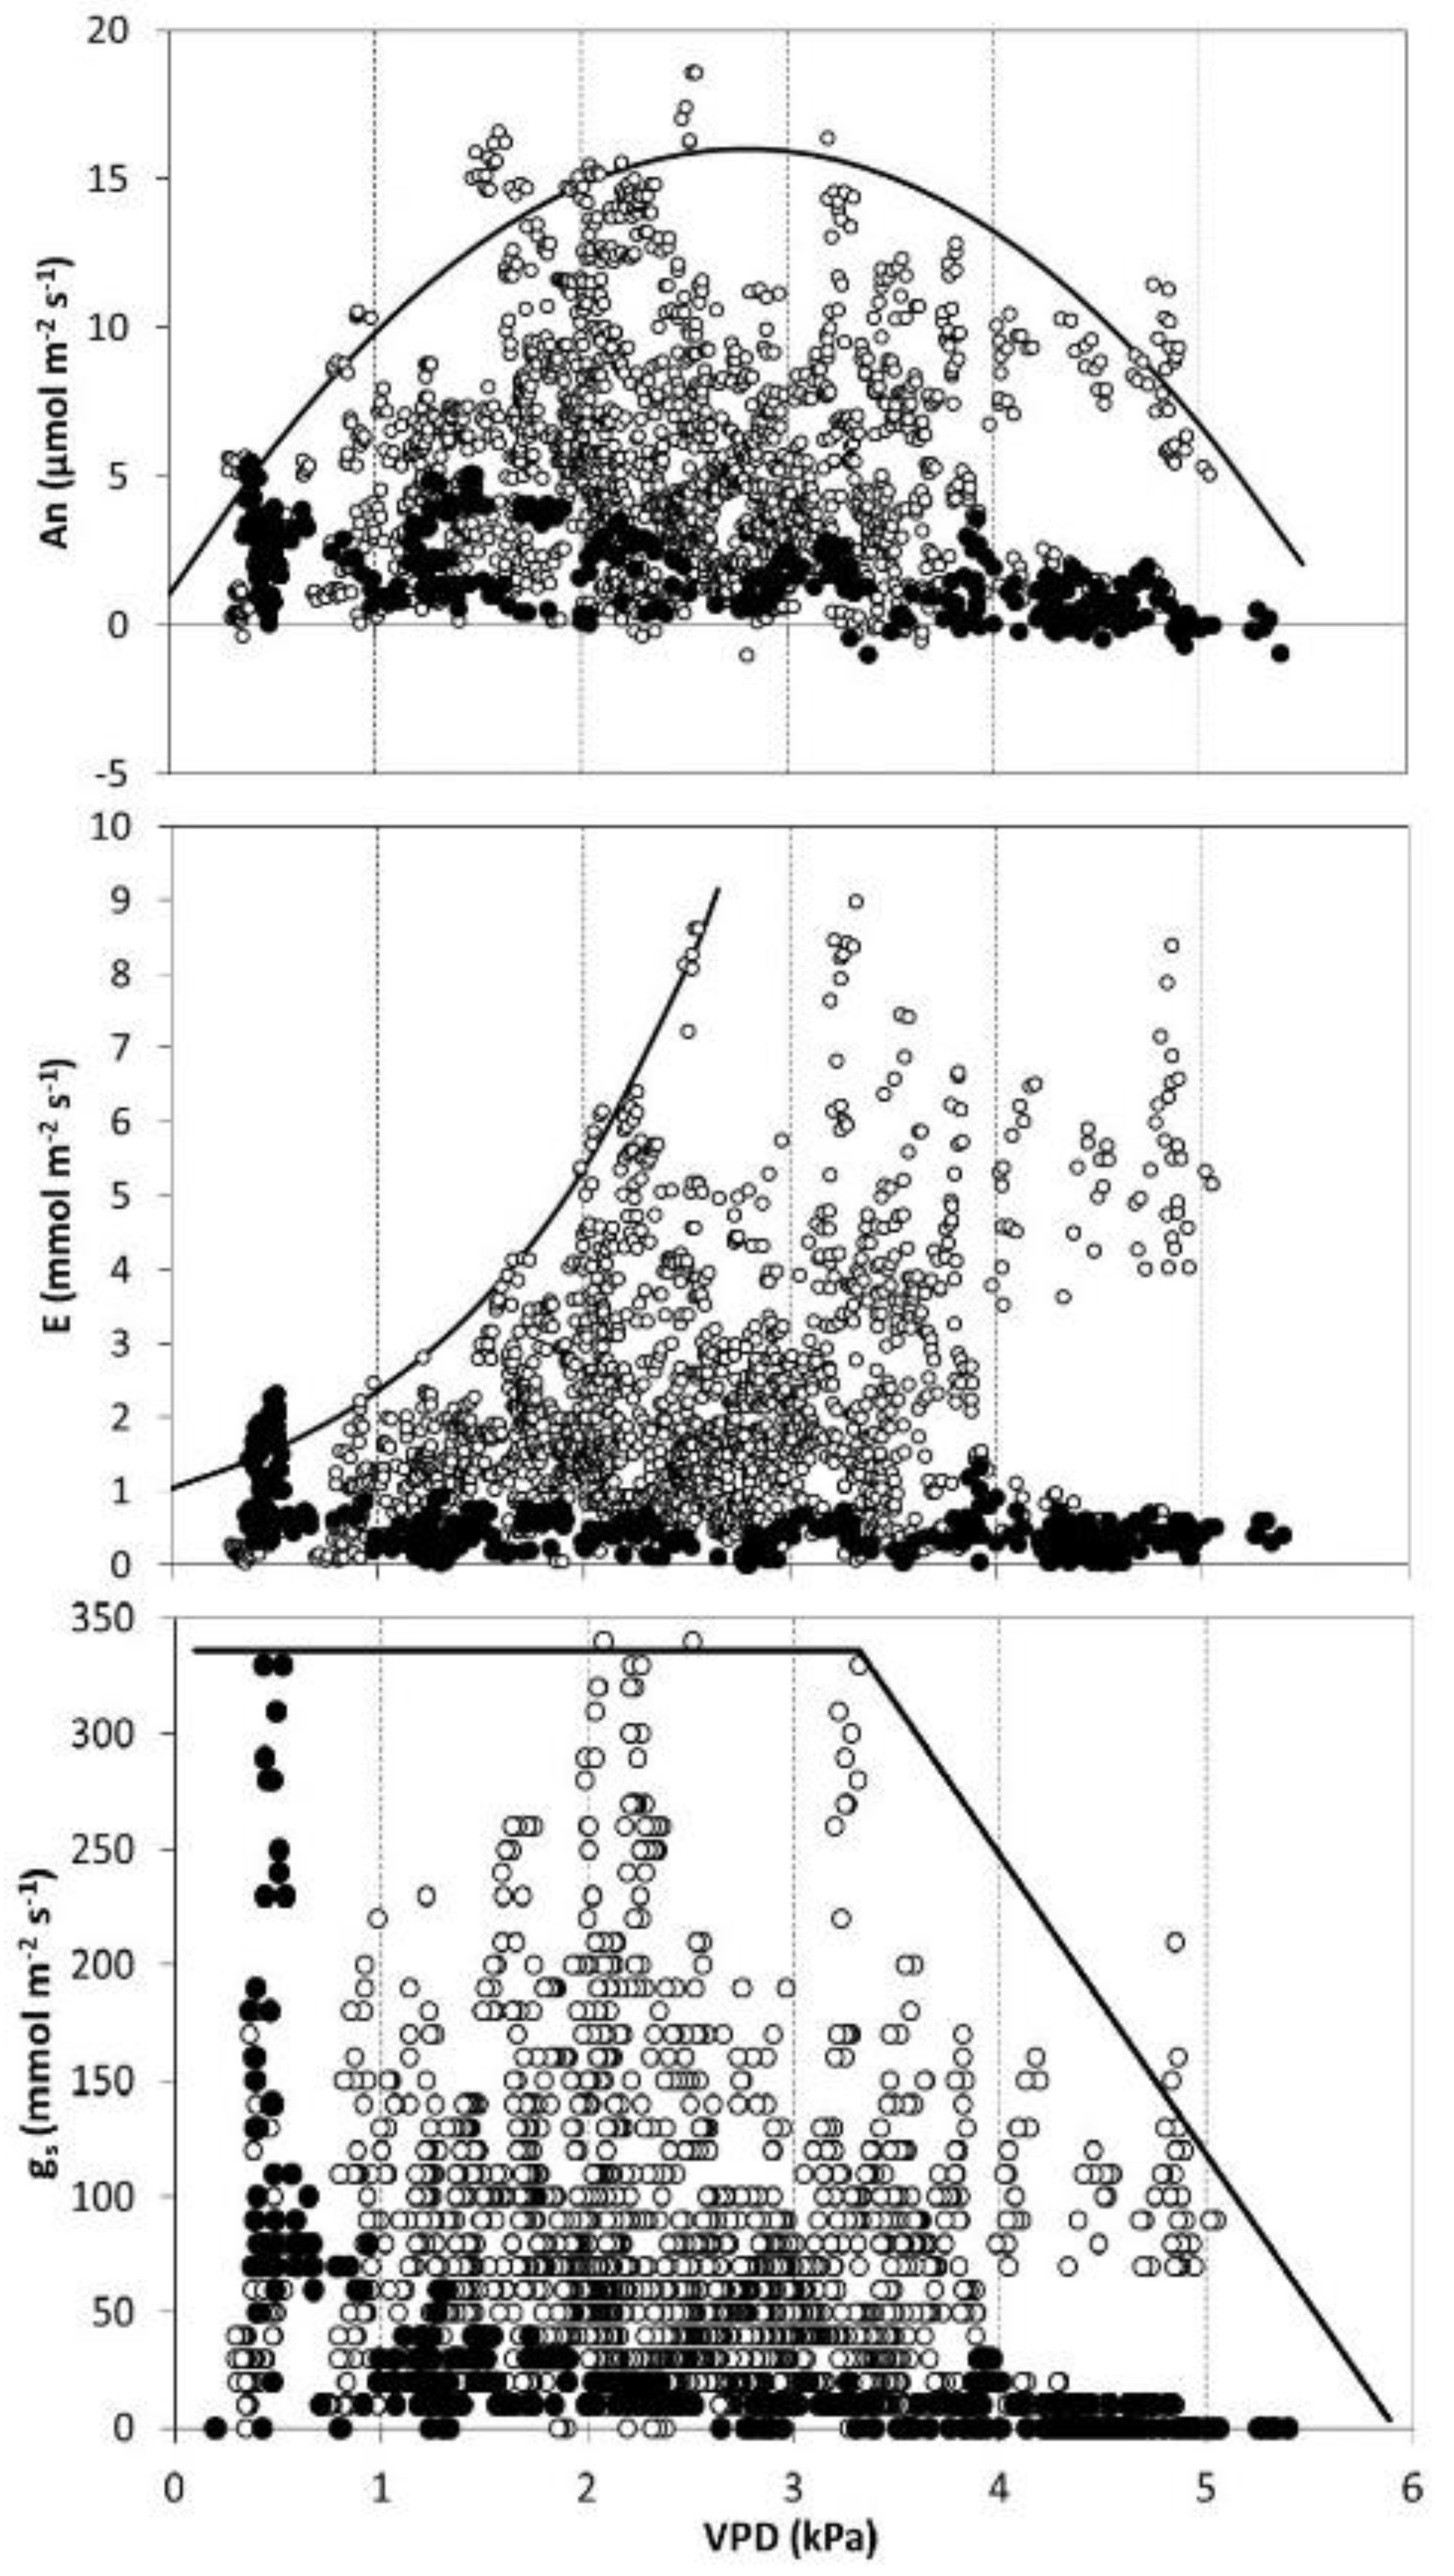
Maximum photosynthesis rates were detected at TL = 26.4 °C, maintaining 50 % of the maximum An between 16.6 and 36.3 °C, showing a hump-shaped relationship between both parameters (Figure 2). E did not display a saturation tendency at high temperatures what was as clear as that of An, and increased exponentially, displaying the highest values at 30 °C (Figure 2). Stomatal conductance was maximal at 25.5 °C, maintaining a value of up to 80 % between 19.2 and 31.7 °C (Figure 2). Due to a reduction in gs at high temperatures, An/gs increased linearly up to 30 °C, but did not go beyond this threshold. In relation with VPD, An showed a maximum of 3 kPa, with 20% of the highest rates registered being between 1.5 and 4.1 kPa (Figure 3). E rates increased exponentially up to maximum values detected at 2.5 kPa, and after this, remained at a maximum of 5 kPa (Figure 3). The relationship between gs and VPD did not present a clear pattern (Figure 3). Regarding gs, An and E displayed maxima at around 200 mmol m−2 s−1.
According to the Equation (1), An followed a typical light-response curve, where Anmax was 13.5 ± 0.92 µmol m−2 s−1 and Rday was 0.846 ± 0.49 µmol CO2 m−2 s−1. The light compensation point was very close to zero, and the light saturation point was 603 µmol CO2 m−2 s−1. The convexity (k) was 0.93 and ø of 0.021 ± 0.0033 µmol CO2 mmol−1 photons (data not shown).

3.3. Seasonal Pattern in Gas Exchange Parameters

Seasonal changes in mean An and E and their corresponding gs and VPD at the time of measurement are shown in Figure 4. Maximum An and corresponding high E values were clearly reached in spring (9.75 ± 0.32 µmol m2 s1 and 5.06 ± 0.19 mmol m2 s1, respectively), where the maxima for gs (166 ± 13.72 mmol m2 s1) (Figure 4) and ci were also detected (224 ± 32 µmol mol1; data not shown). After that, minimum values on these parameters were detected by the highest leaf VPD (higher than 3 kPa); meanwhile, from late-spring to summer, An and E exhibited a marked depression and were very close to zero (Figure 4). During this drought period, stomatal closure was detected in the morning, and the maximum rates in gs were 87 % lower than the spring maxima. Minimum seasonal mean values in ci were also registered (132 ± 52 µmol mol1; data not shown).
These reductions in gas exchange parameters during summer can be also observed in the broad analysis, where tendencies were undoubtedly different to the entire period (Black dots in Figure 2 and Figure 3). Thus, An was much lower, and started a dramatic decline from 15 °C (−0.26 µmol m2 s−1 per °C; Figure 2), while E was maintained close to zero, with values higher than 1 mmol m−2 s−1 only being registered at around 15 °C (Figure 2). A similar response was observed with VPD in summer, where An dropped with the increase in VPD (−0.61 µmol m2 s1 per kPa; Figure 3), and E values remained very close to zero, with VPD higher than 1 kPa (Figure 3). Stomatal closure was detected, and higher values in gs were only detected with the lowest TL and VPD (Figure 2 and Figure 3).
Additionally, when stomata were not closed in the early morning in the summer period, WUEi and An/gs were higher than in the rest of the year with soil water availability (WUEi 6.15 vs. 3.44 µmol mol−1; An/gs 121.92 vs. 83 µmol mol−1, respectively; P < 0.01). Thus, both parameters increased with high temperatures and VPD, reaching saturated values at 27 °C and 2.5 kPa (data not shown).
In the cold season, autumn and winter, rates in An and E were lower than would be expected based on TL recorded. In calculating the Anmax expected by regression using TL measured (from regression showed in Figure 2), noticeable low values were detected on days where the Tair overnight was below zero. On these days, the reductions were between 40%–95% of Anmax. The data obtained in the next spring should be highlighted, where the minimum Tair overnight was −0.02 °C, and low values in An were registered (2.58 µmol m−2 s−1) despite high TL (27.4 °C) (Figure 2 and Figure 4).

3.4. SLA and Needle Water Potential

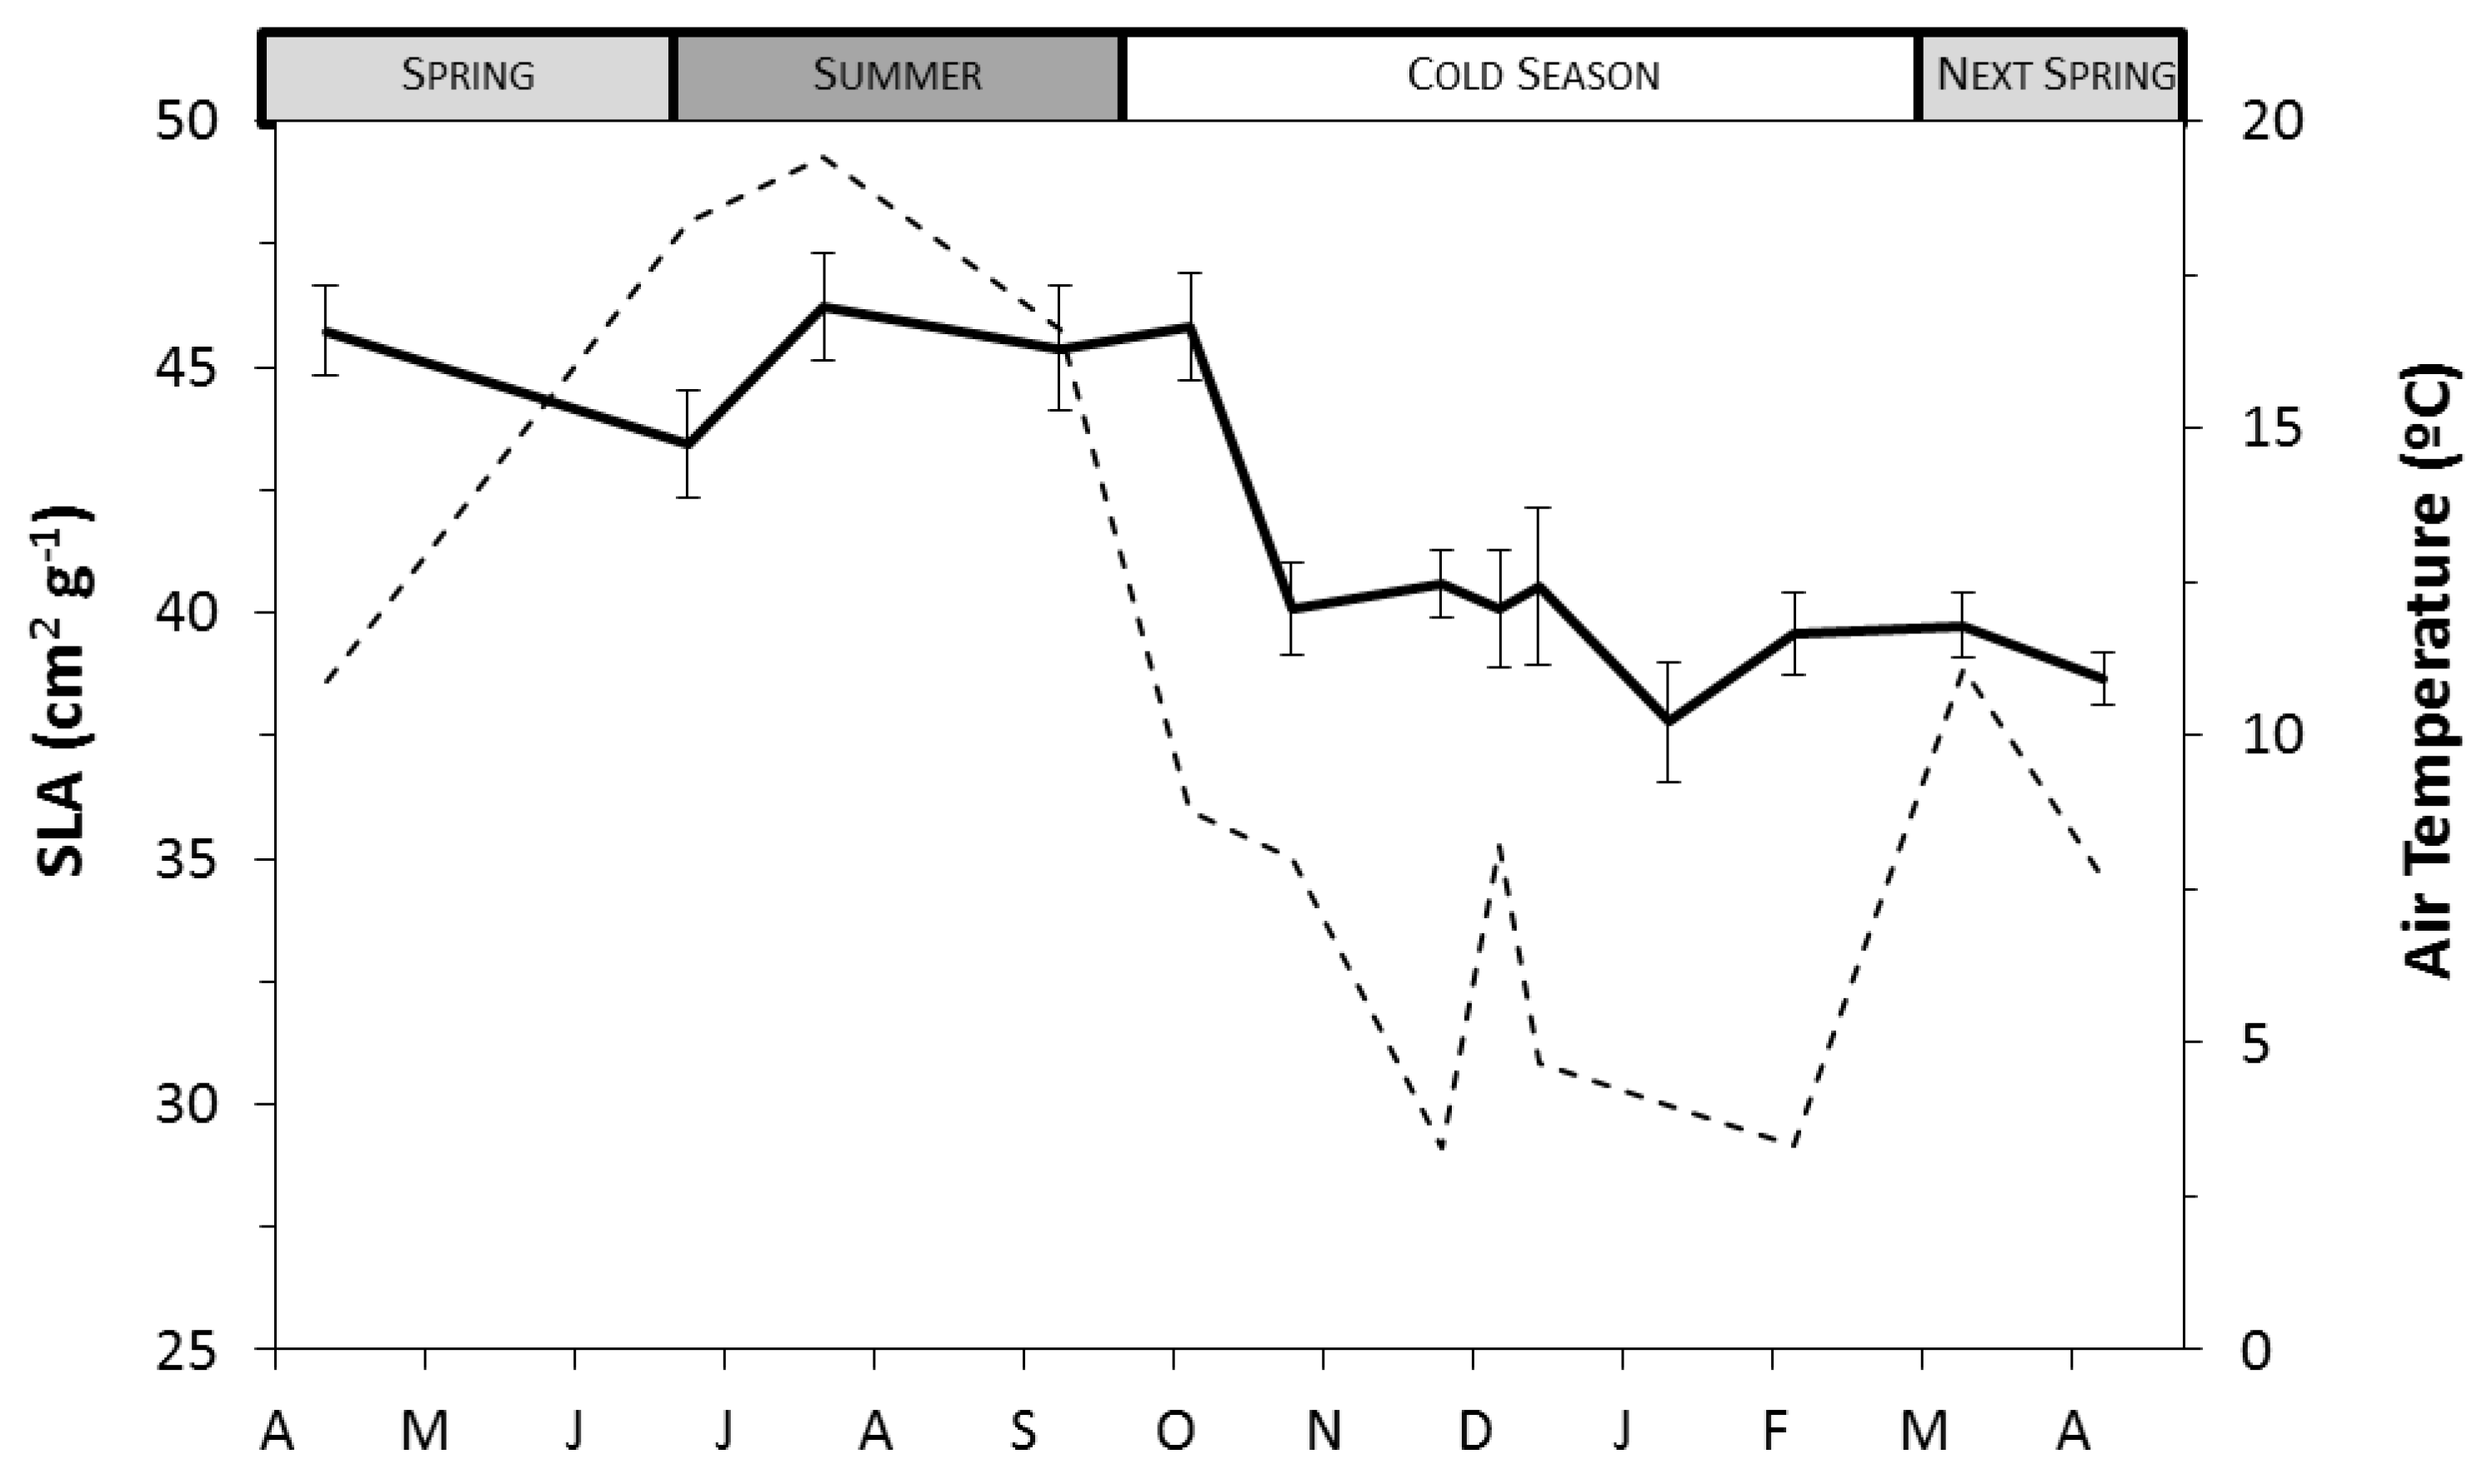
The values of specific leaf area (SLA) varied between 37.8 and 46.2 cm2 g−1. Moreover, they were significantly different, with a drastic reduction in autumn when temperatures started to decrease (Figure 5).
Needle water potential (Ψneedles) at predawn in the summer period showed lower values throughout the progress of the drought, with minimum values of −1.63 ± 0.33 MPa; nevertheless, Ψneedles did not present any significant differences (all P > 0.05; data not shown).

3.5. Seasonal Pattern in Chlorophyll Fluorescence

Maximum values in predawn FV/FM were measured during late spring and early summer, reaching the theoretical maximum (0.82 ± 0.02), while a greater reduction was detected in autumn and winter (0.650 ± 0.06). These maximum rates declined throughout the day, with sunlight exposition showing the typical midday depression (data not shown).
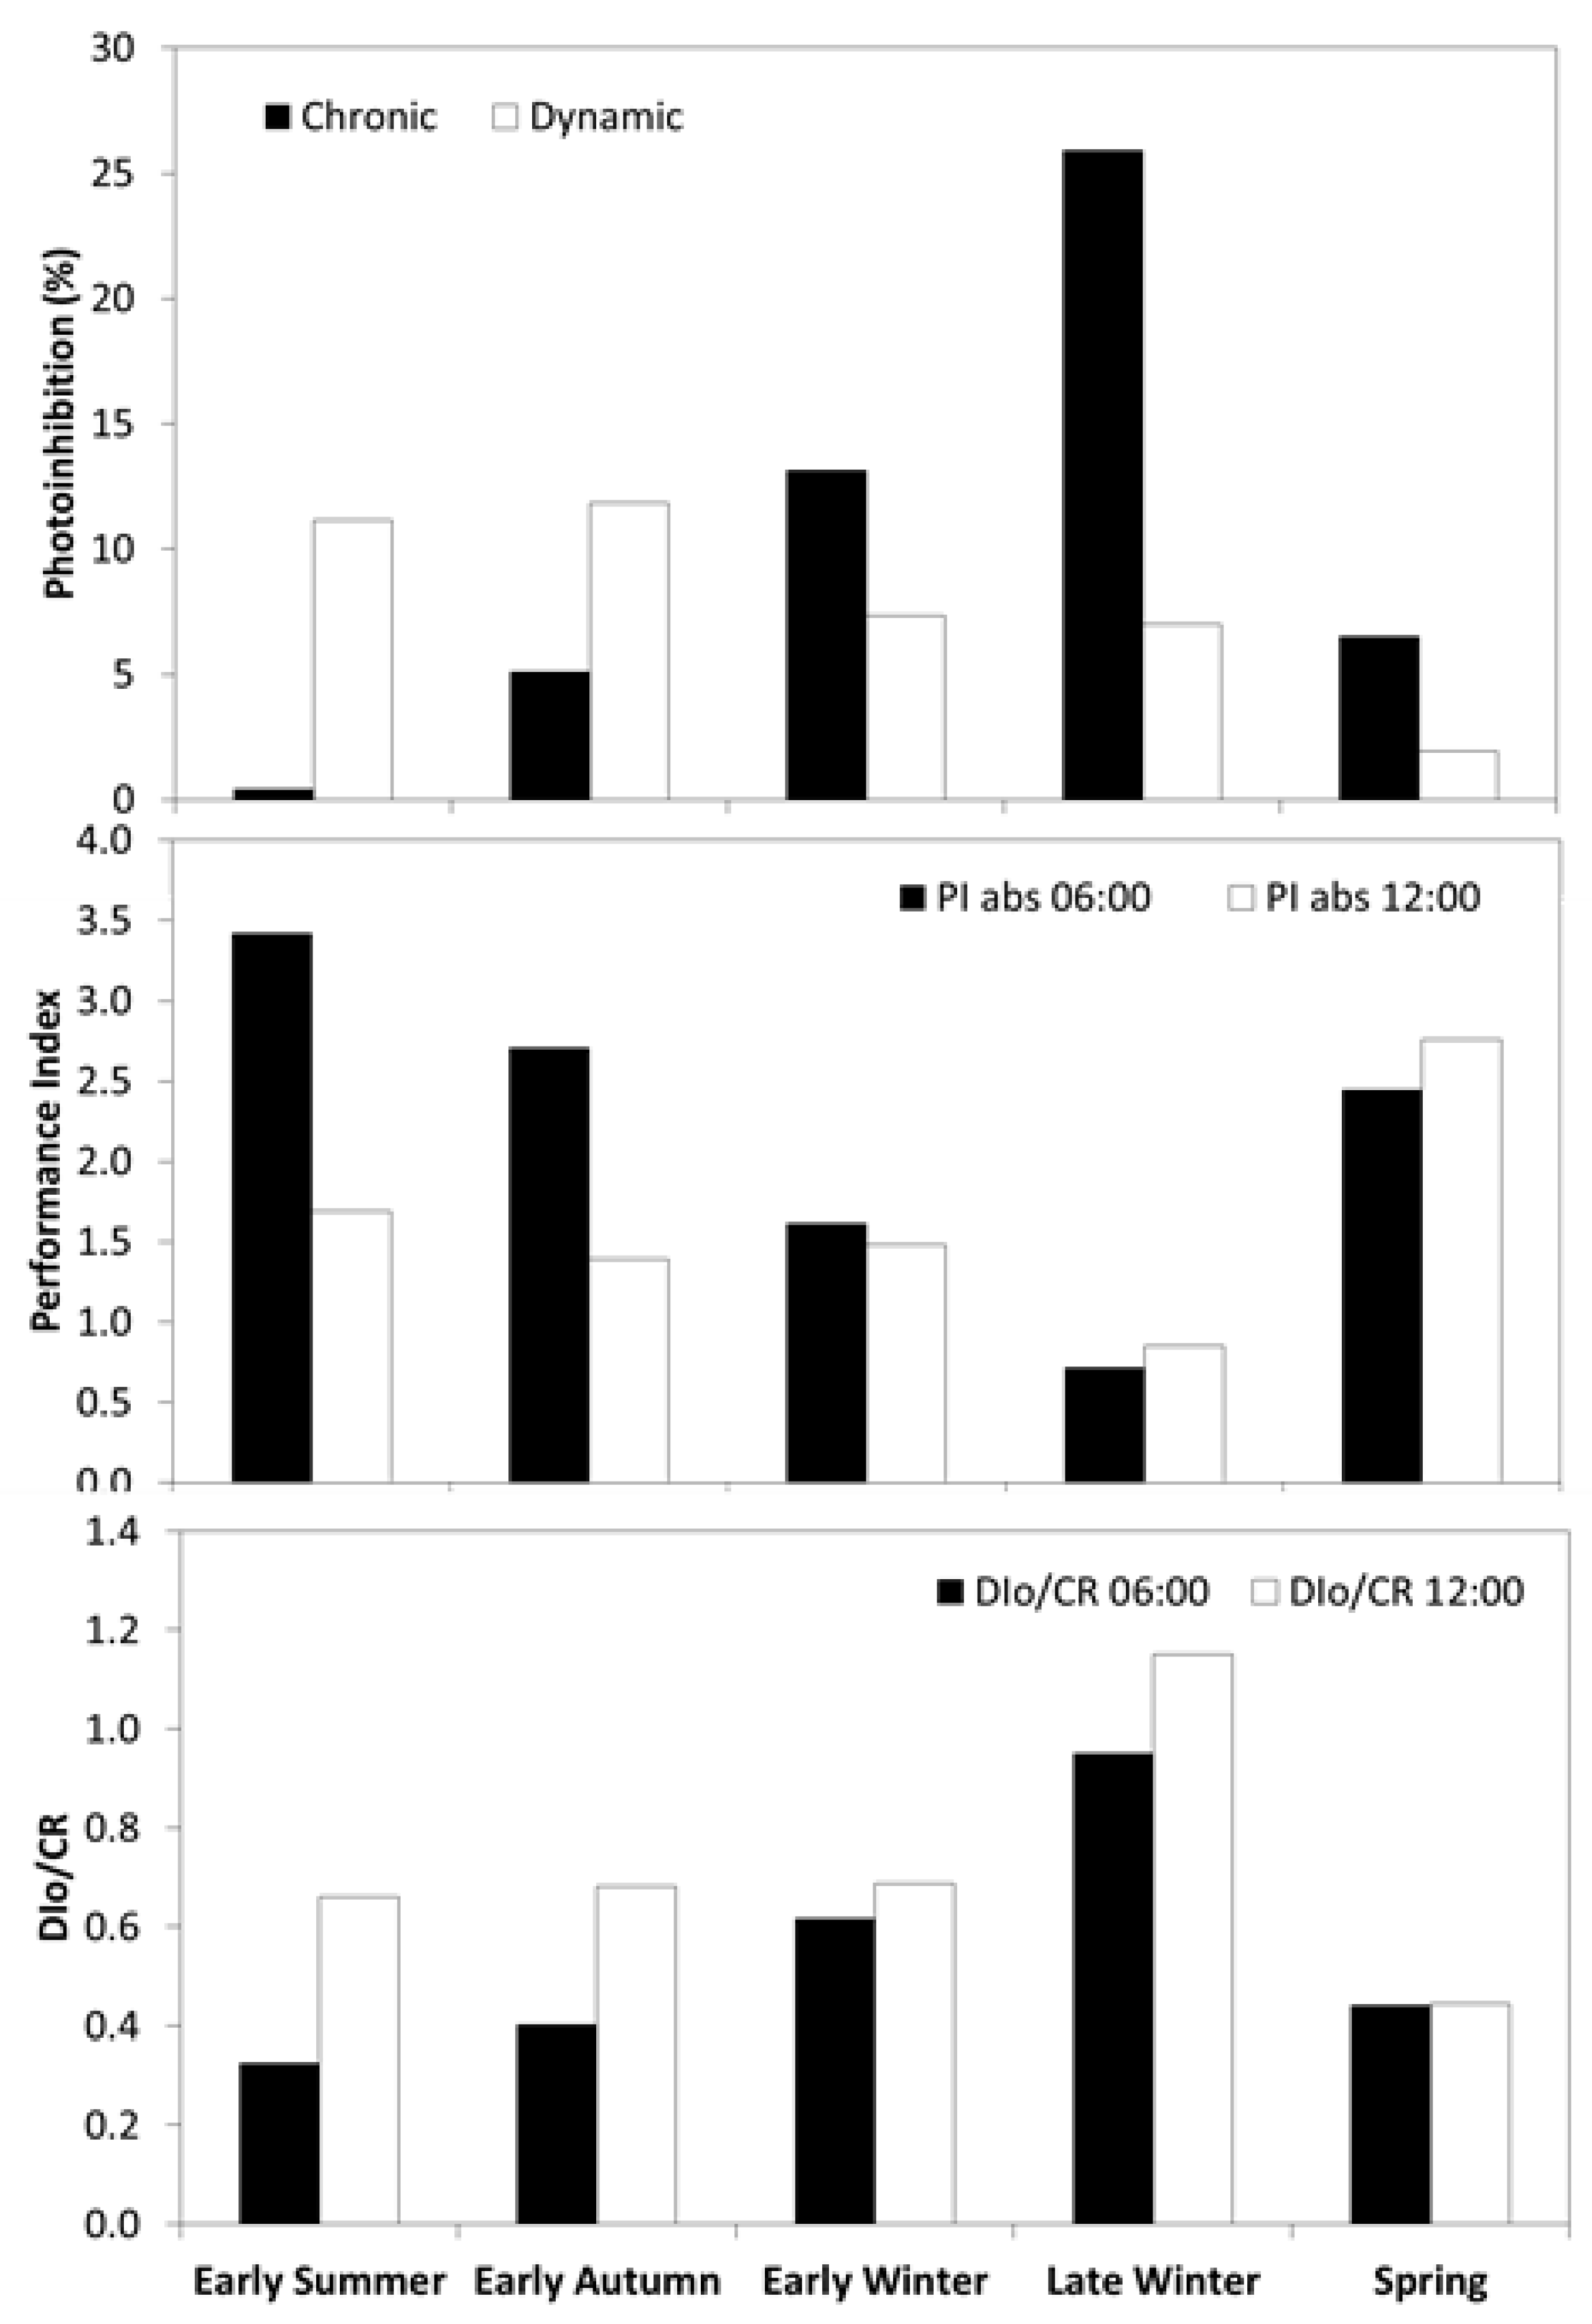
Selected representative days are shown in Figure 6, where total photoinhibition (chronic and dynamic), performance index (PIabs), and flux to energy dissipation per active reaction center (DI0/CR) are displayed. Chronic photoinhibition was non-existent at the beginning of the summer, with corresponding maximum PIabs at predawn. Throughout the cold season, chronic photoinhibition and DI0/CR increased progressively, with the maximum in late winter, where Tair overnight were below to zero. Correspondingly, PIabs at predawn decreased over winter.
Throughout the year, dynamic photoinhibition was detected; this was emphasized under stressful conditions (drought and cold temperatures). The relevance of the midday depression was remarkable in late winter, with minimum values in PIabs, matching an increase in the dissipation flux (DI0/CR) (Figure 6) and the decrease in electron transport flux (ET0/CR) (data not shown).
Despite having undergone double stress, the needles were able to recovery, and chronic photoinhibition was reduced in the next spring. Furthermore, PIabs remained relatively high, even at midday, with similar values to those at predawn (Figure 6). DI0/CR at predawn and midday were similarly low (Figure 6). Moreover, functional reaction centers (measured as CR/CS) showed the maximum value in spring (CR/CS = 240), corroborating the recovery, while in the previous summer, the value was 16 % lower, and in the previous winter, it showed an even greater reduction (25%; data not shown).

3.6. Seasonal Changes in Pigments and α-tocopherol

The maximum chlorophyll concentration was reached in the spring (578 ± 133 µmol m−2) and decresed throughout the year, with minimum values in winter representing a decline of 15 % (Table 2). Chlorophyll values recovered slightly with the onset of the next spring, and these changes were significantly identified in Chl b but not in Chl a (Table 2). Hence, the Chl a/b ratio varied throughout the year, maintaining minimum values in spring and summer and increasing when cold temperatures appeared. In the next spring, the ratio was lower than in winter, but did not reach the initial values obtained in the previous spring (Table 2).
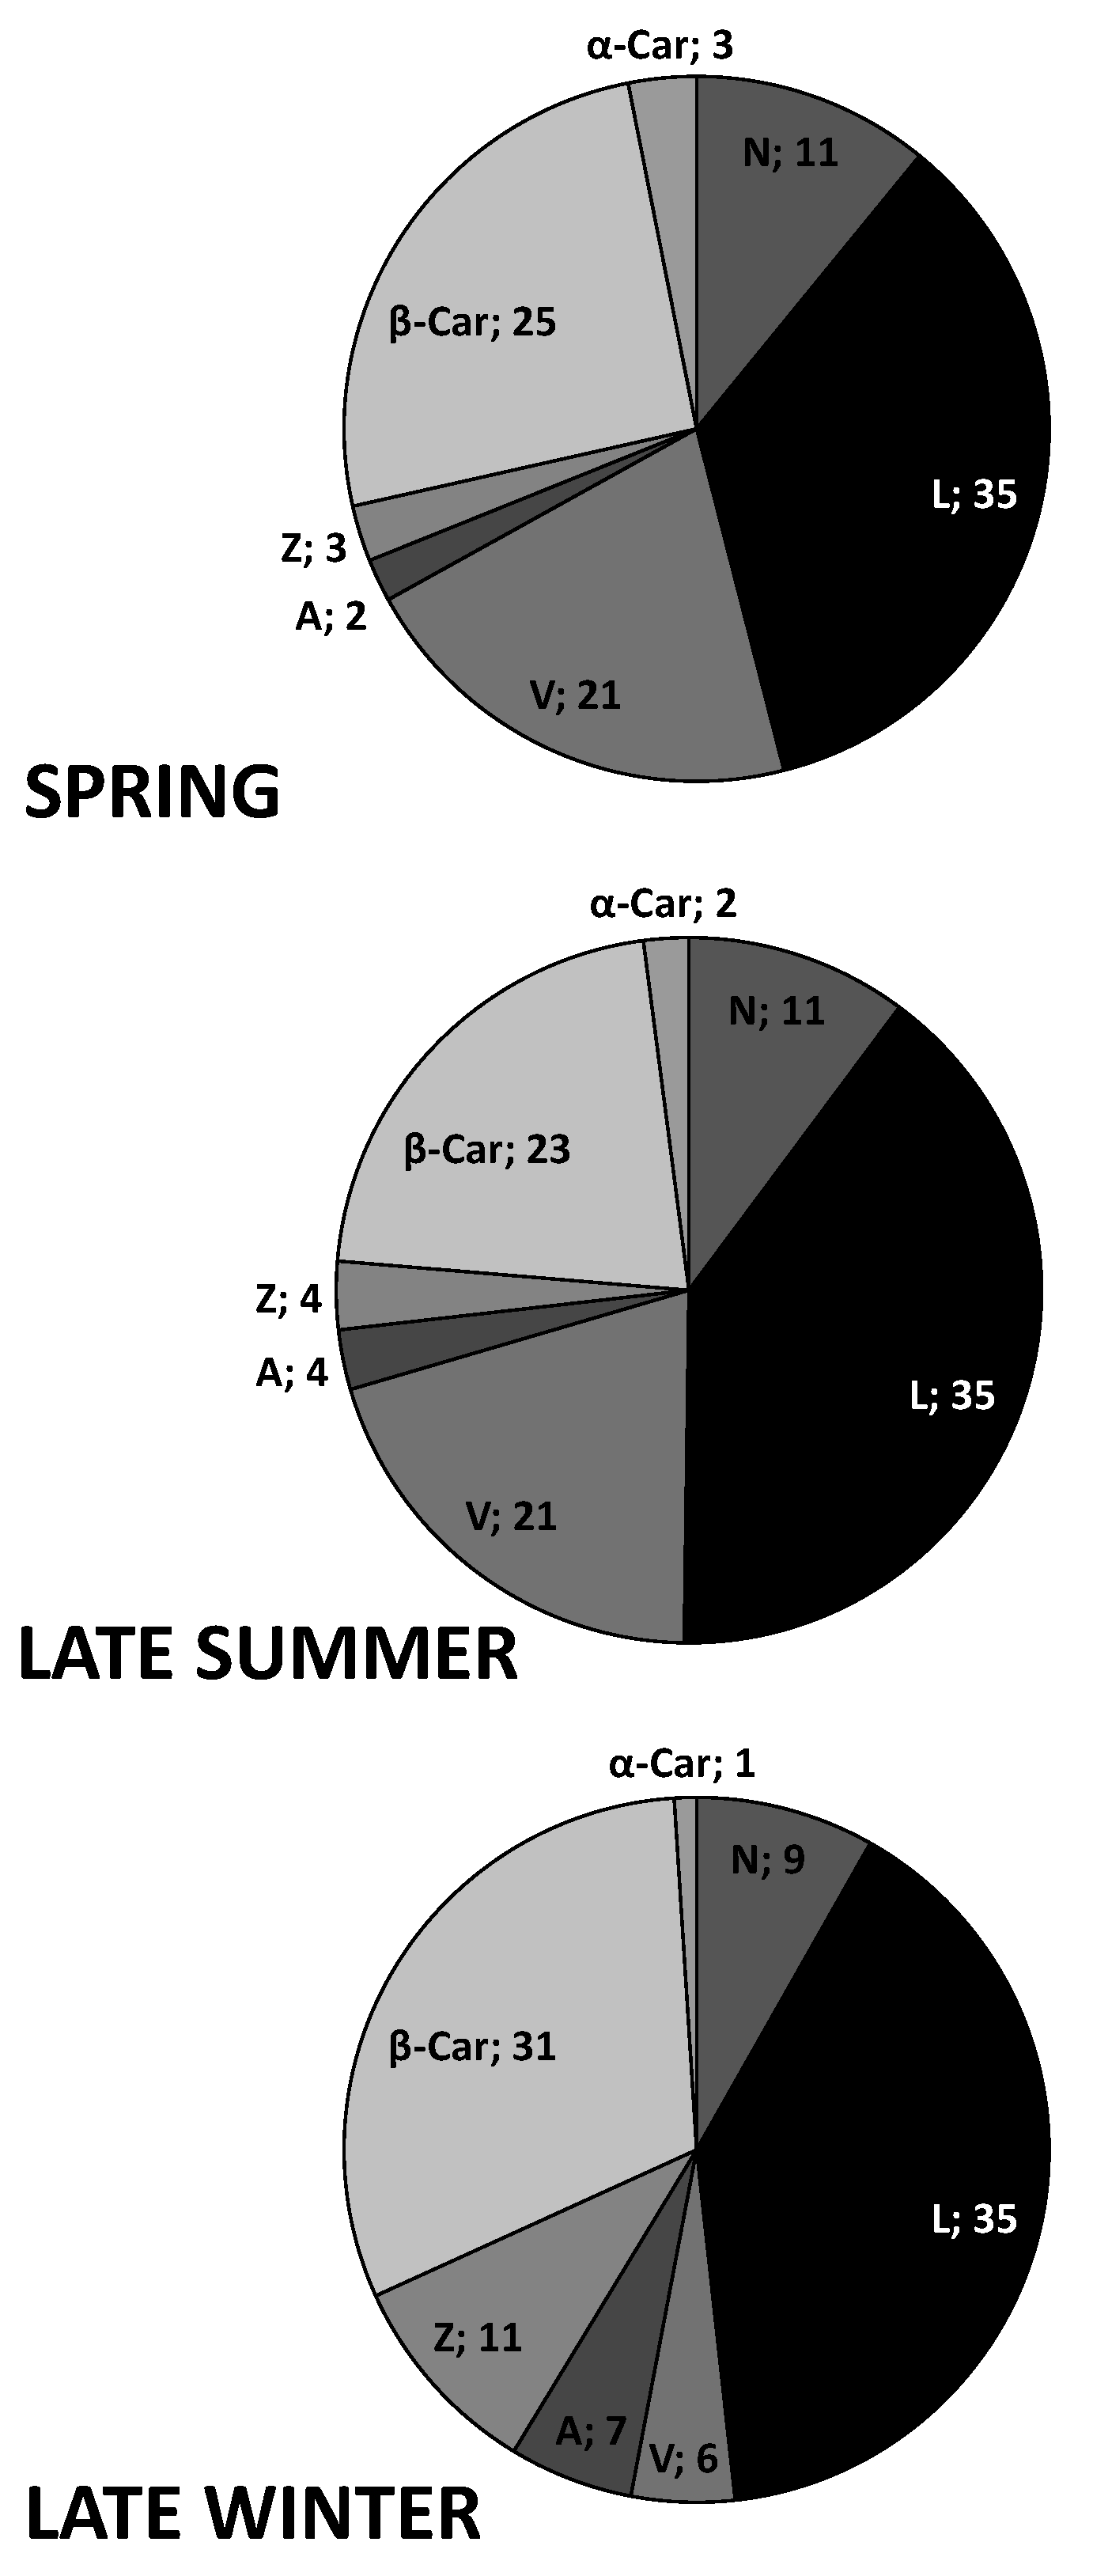
Minimum values in lutein, β-carotene and total VAZ were detected in the spring (Table 2). Lutein slightly increased in summer and was greater when cold temperatures appeared in autumn (late-October), maintaining these high values until the next spring (Table 2). The identical tendency was followed by total carotenoids, where minimum values were detected in the spring (Table 2). They increased throughout the seasons, including in the next spring, despite the recovery in total chlorophylls. In contrast, β-carotene reached maximum values in winter, higher than those in autumn, and no recovery was observed in following next spring (Table 2). In fact, β-carotene played the main role among the total carotenoids, showing an increase from 24% in spring and summer to 31 % in late winter (Figure 7). After minimum values in spring, VAZ increased approximately by 30 % in summer, and these values were maintained throughout the measurement period. In contrast to the other carotenoids, neoxanthin showed maximum values in spring and decreased in summer, autumn and winter, recuperating maximum values in the following spring (Table 2).
Regarding A+Z/VAZ, high values were observed throughout the year (0.44), reaching even higher values in winter (0.80), highlighting the great Z values which were observed at predawn (Table 2). This ratio was strongly inversely correlated with FV/FM at predawn (Pearson R = 0.83, P < 0.01).
α-Tocopherol was at its lowest in spring and doubled in summer. The maximum values were detected in autumn, increasing by a factor of 3.5 relative to spring; after that, they began to decrease, reaching significantly lower values in the following spring (Table 2).

4. Discussion

The main physiological parameters, including gas exchange, chlorophyll fluorescence, photosynthetic pigments and α-tocopherol, as well as SLA and needles water potential, were measured in a P. canariensis forest located at a semiarid treeline forest in Las Cañadas (Tenerife) at 2070 m altitude over the course of one full year. During the year, the summer drought was caused by an extensive rainless period from the end of May to the end of September, with very low previous rainfall (216 mm) [21]. Furthermore, the cold season showed extraordinarily low Tair, which persisted, with daily means close to 5 °C and minimum values close to −6 °C. All these conditions meant that the studied period as an extraordinary opportunity to improve our understanding of photosynthetic strategies in a treeline forest under the principal environmental constraints (temperature and drought).
Maximum photosynthetic rates were in the upper range measured in this species in the wind-trade area at a lower altitude (17 µmol m−2 s−1 [24], and in the range described for other Mediterranean conifers and Pinus species growing in similar latitudinal areas [5,38], suggesting no limitations in the net CO2 uptake of Pinus canariensis at treeline compared to lower elevations [1,11]. Optimal TL for photosynthesis was 26 °C, being very close to a previously identified value for this species (25 °C) [37], which includes, at the upper limit described, evergreen conifers and Mediterranean plants [39]. Nonetheless, the optimum range in which to maintain 50% Amax was highly reduced, showing a lower range (17–36 °C) than that previously described (11–40 °C) [24]. Maximum E displayed higher values than those described for other evergreen conifers, as previously documented for this species [24,37]. Similar to An, a maximum E was detected 5 °C lower than optimum temperature described for this species; above the threshold value of 30 °C, E did not increase. These narrowed optimums are frequently detected at field conditions where Tair is accompanied by additional environmental constraints [5], as it is in this treeline ecotone. These reductions in An and E were perfectly matched with a decrease in gs that remained at 50% between 16–35 °C. Maximum gs values were high, reaching 350 mmol m−2 s−1; nevertheless, higher rates have even been described for other Pinus species growing in humid habitats as P. banksiana and P. ellioti (500 mmol m−2 s−1) [38].
The light saturation point was slightly higher at the treeline than in exposed needles for this species (600 vs. 550 µmol m−2 s−1) [40], with similar values being observed in respiration rates. This saturation at higher PPFD is characteristic for plants with sun-type adaptations [39], in accordance with the high radiation and scarcity of clouds in this ecotone.
Gas exchange parameters and their meteorological optimal values displayed extraordinary seasonality. Maximum An and E corresponded with the main growing season (spring) [21], in which there was a high demand for carbohydrates. After that, from early summer, rates very close to zero caused by complete stomatal limitations with gs close to zero at VPD>1kPa were detected. In this period, both high VPD values and soil drought occurred, and these, combined with previous low precipitation [20], resulted in this strong reduction not being detected in the wind-trade distribution area [37]. The deep root system of this species could not prevent this strong stomatal closure. However, a reduction in gas exchange was detected, and trees did not seem to be affected by severe dehydration, as Ψneedle did not reach low values in September, thereby avoiding the tissue dehydration by earlier stomatal closure.
Despite this, early-morning stomatal opening was detected, permitting gas exchange which generated higher rates in WUEi during the drought period. This increase has been documented for other Mediterranean species under drought conditions [41]. Additionally, WUEi displayed high values during the entire period. WUEi tends to be high for pines due to efficiency in heat dissipation as a result of the species’ needle anatomy being much more efficient than narrow leaves [38]. This, together with the special stomatal complex with a singular epistomatal chamber in P. canariensis needles [42] displayed a fine regulation in stomatal closure and high values in WUEi.
After summer, an increase in An and E was detected in the cold season; however, maximum rates were not reached. This was not only due to low evaporative demand; chilling temperatures were also a relatively major limitation, showing the vulnerability of this species to sustained winter photoinhibition. This depression at low temperatures has been documented in Mediterranean areas, and it seems to be a consequence of non-stomatal factors due to its assimilation being highly depressed by low temperatures. Nevertheless, at present, there is not sufficient data to assess the relative significance of the underlying mechanisms [5].
Linked to gas exchange variability, needles also showed morphological plasticity. SLA values measured were low for values described for species growing in hot and dry sites, but were within the upper limit described for semiarid species [43,44]. This lower surface-to volume ratio could be associated with higher photosynthetic WUEi [45]. Moreover, significant changes in SLA were detected; the daily mean Tair from September (20 °C) was reduced to 5 °C at the end October, and these cooler temperatures were closely related to a significant reduction in SLA. Low SLA at low temperatures could reduce the incidence and severity of cold temperature stress by slowing down the rate of freezing [46]. These modifications are commonly associated with changes in leaf density due to the thickening of cuticles and epidermises, with increased functional sclerenquima investments and smaller and more tightly-packed mesophyll cells with thicker cell walls [44]. This plasticity in a heterogeneous environment may play an adaptive role in a strong seasonal climate [26]; nevertheless, in Mediterranean ecosystems, it has been recognized as a means to cope with drought [47].
FV/FM values also showed variability. At midday, values were depressed, showing a pronounced dynamic photoinhibition; for that reason, P. canariensis was classified as a photoinhibition-tolerant species by [4]. Decreases in CO2 assimilation rates during the drought did not severely affect the fluorescence parameters, so the decrease in the utilization of ATP and NADPH in the photosynthetic metabolism should be compensated for by other sinks, such as water-water cycling and photorespiration [48]. Freezing and chilling temperatures resulted in permanent declines in FV/FM and PIabs from early-autumn throughout early-spring. These reductions were maintained at predawn, showing a chronic photoinhibition that indicated a needle photochemistry that had been significantly affected. The chronic photoinhibition increased as the winter progressed, suggesting accumulative damage. Similar reductions during winter have been observed in many other conifer species [49,50,51]. This chronic photoinhibition coincided with the maintenance of xanthophyll deepoxidation at predawn, and high concentrations in VAZ pigments showing a high relevance in the thermal dissipation of excess energy, as also indicated by high DI0/CR. Such deepoxidation retention overnight has been detected in other winter stressed Mediterranean plants [52,53]. This retaining at low temperatures might play a photoprotective role as a mechanism to avoid harm by heat dissipation, even in the early morning [54,55].
Nevertheless, this chronic sustained photoinhibition could not be explained by the high Z alone. The much higher ABS/CR detected in winter might indicate a decrease in the concentration of active reaction centers, rather than an increase of light absorbance [33]. For that, some degree of accumulative damage may have also existed, which was also indicated by a decrease in functional centers and reduced chlorophyll contents. However, non-persistent winter damage was verified during the consecutive growing season, where a general restoration of photosynthetic functions, fluorescence parameters, and pigments (chlorophyll and neoxanthin) were observed in the following (warmer) spring. This is in accordance with recovery studies in other conifer species [56,57]. Several studies have demonstrated strong inverse correlations when faced with environmental constraints, such as low temperatures and/or drought, and needle longevity, so as to optimize resource availability and carbon balance [58,59], which has also been recognized in P. canariensis [60]. In addition, photoprotective mechanisms related to changes in pigments and α-tocopherol may allow trees to overcome cold stressful periods and to recover on spring. Pigment contents and their dynamics were characteristic for plants from high radiation habitats, and were within the range expected by healthy plants [61]. The decrease in chlorophyll concentration detected in winter is a common strategy to reduce the light capture, and has been largely documented in the Mediterranean area, including pine species [62]. This decrease was accompanied by an increase in neoxanthin and Chl a/b ratio indicating a higher degradation on light harvesting complexes [63]. Nevertheless, a slight recovery on chlorophylls and neoxathin was detected in the next spring, coinciding with the retrieval of maximum An.
During the entire period carotenoids rates were within the maximum rates described for plants [61], showing a robust acclimation. The highest values were detected in the cold season, indicating an upregulation of carotenoids to cope with low Tair combined with high light. β-carotene played the main role in this increase. This pigment can directly quench singlet oxygen or can prevent the formation of chlorophyll triplets in the excited state; it has also been associated with chlorophyll situated at reaction centers in PSI and PSII, where achieves photoprotection [64]. Due to the fact that singlet oxygen generated by PSII is largely responsible for most of the non-enzymatic lipid peroxidation on the thylakoid membrane [65], this role is of relevance under high photoinhibition. In summer, the changes in pigments were similar to those in winter, but this drought effect was not as pronounced as the decrease in temperatures.
Previous studies have shown that α-tocopherol did not increase in needles of P. canariensis under more stressful environmental conditions [34]; this lipophilic molecule displayed a dynamic role at the treeline. The rate increased throughout the year; this is a common response in plants due to leaf ageing [66]. Nevertheless, our higher observed values in autumn than in spring indicate a distinctive role of its protection mechanism under low temperatures. Moreover, tocopherols have been described as being particularly important in response to severe photo-oxidative stress when other protection mechanisms are nonexistent or are failing [67]. This could be the case in the winter of the year of study, where higher photoinhibition was detected. Other authors have proposed that tocopherol plays a more crucial role in low-temperature adaptation than in photoprotection [68]; this could also explain why the highest values were detected in autumn, i.e., with the onset of low temperatures.

5. Conclusions

Great dynamism in the potential photosynthetic performance was detected in a P. canariensis treeline forest. Optimal values were concentrated over a short period in spring. Beyond that, fine regulation in stomatal closure, high WUEi with a great plasticity, and changes in pigments and antioxidative components prevented dehydration during the drought. In winter, P. canariensis had to face robust chronic photoinhibition, with α-tocopherol and β-carotene playing the main roles. Morphological variations in needles were also detected as a means to prevent freezing. Moreover, the breakdown of pigments during the winter reduced the risk of overexcitation and photodamage, making rebuilding and regreening possible in the next spring. Taking these factors into account, a set of wide-ranging, structural and physiological adaptations make this species very resistant to stress.
In this treeline, forest carbon gain takes place mainly over a short period in spring. On a long-term scale, it was more limited by drought than by low temperatures, as has been described in Mediterranean areas [69]. For this reason, this semiarid forest, situated on the edge of this ecological threshold, may experience dramatic consequences due to ongoing climatic changes, where increasing temperatures and extended drought periods are predicted [15,70].

Author Contributions

Conceptualization, A.M.G-R. and P.B.; methodology, M.S.J. and A.M.G-R.; software, P.B.; validation, M.S.J., P.B., J.R.L. and A.M.G-R.; formal analysis, P.B.; investigation, A.M.G-R. and P.B.; resources, J.R.L.; data curation, A.M.G-R.; writing—original draft preparation, A.M.G-R. and P.B.; writing—review and editing, A.M.G-R.; visualization, A.M.G-R.; supervision, M.S.J., P.B., J.R.L. and A.M.G-R.; project administration, M.S.J. and A.M.G-R.; funding acquisition, M.S.J.

Funding

This work was supported by the Spanish Government (CGL2006-10210/BOS, CGL2010-21366-C04-04 MCI) and University of La Laguna (ULL) both co-financed by FEDER. P.B. received a fellowship from Canarian Agency for Research, Innovation and Information Society (ACIISI) co-financed by FEDER.

Acknowledgments

The authors express their gratitude to the National Park’s Network for permission to work in the Teide National Park.

Conflicts of Interest

The authors declare no conflict of interest.

References

  1. Körner, C. Alpine Treelines. Functional Ecology of the Global High Elevation Tree Limits; Springer: Basel, Switzerland, 2012; p. 219. [Google Scholar]
  2. Silva-Cancino, M.C.; Esteban, R.; Artetxe, U.; García-Plazaola, J.I. Patterns of spatio-temporal distribution of winter chronic photoinhibition in leaves of three evergreen Mediterranean species with contrasting acclimation responses. Physiol. Plant. 2012, 144, 289–301. [Google Scholar] [CrossRef] [PubMed]
  3. Takahashi, S.; Badger, M.R. Photoprotection in plants: A new light on photosystem II damage. Trends Plant Sci. 2011, 16, 53–60. [Google Scholar] [CrossRef] [PubMed]
  4. Martínez-Ferri, E.; Manrique, E.; Valladares, F.; Balaguer, L. Winter photoinhibition in the field involves different processes in four co-occurring Mediterranean tree species. Tree Physiol. 2004, 24, 981–990. [Google Scholar] [CrossRef] [PubMed]
  5. Flexas, J.; Diaz-Espejo, A.; Gagoa, J.; Galléa, A.; Galmés, J.; Gulías, J.; Medrano, H. Photosynthetic limitations in Mediterranean plants: A review. Env. Exp. Bot. 2014, 103, 12–23. [Google Scholar] [CrossRef]
  6. Asada, K. Production and scavenging of reactive oxygen species in chloroplasts and their functions. Plant Physiol. 2006, 141, 391–396. [Google Scholar] [CrossRef] [PubMed]
  7. Dall’Osto, L.; Cazzaniga, S.; North, H.; Marion-Poll, A.; Bassi, R. The Arabidopsis aba4-1 mutant reveals a specific function for neoxanthin in protection against photooxidative stress. Plant Cell 2007, 19, 1048–1064. [Google Scholar] [CrossRef] [PubMed]
  8. Havaux, M.; Niyogi, K.K. The violaxanthin cycle protects plants from photooxidative damage by more than one mechanism. Proc. Natl. Acad. Sci. USA 1999, 96, 8762–8767. [Google Scholar] [CrossRef] [PubMed] [Green Version]
  9. Havaux, M.; Eymery, F.; Porfirova, S.; Rey, P.; Dörmann, P. Vitamin E protects against photoinhibition and photooxidative stress in Arabidopsis thaliana. Plant Cell 2005, 17, 3451–3469. [Google Scholar] [CrossRef]
  10. Peng, C.L.; Lin, Z.-F.; Su, Y.-Z.; Lin, G.-Z.; Dou, H.-Y.; Zhao, C.-X. The antioxidative function of lutein: Electron spin resonance studies and chemical detection. Funct. Plant Biol. 2006, 33, 839–846. [Google Scholar] [CrossRef]
  11. Wieser, G.; Tausz, M. Trees at Their Upper Limit: Treelife Limitation at the Alpine Timberline; Springer: Dordrecht, The Netherlands, 2007; p. 225. [Google Scholar]
  12. Piersma, T.; Drent, J. Phenotypic flexibility and the evolution of organismal design. Trends Ecol. Evol. 2003, 18, 228–233. [Google Scholar] [CrossRef] [Green Version]
  13. Fernández-Palacios, F.M.; de Nicolás, J.P. Altitudinal pattern of vegetation variation on Tenerife. J. Veg. Sci. 1995, 6, 183–190. [Google Scholar] [CrossRef]
  14. Sperling, F.N.; Washington, R.; Whittaker, R.J. Future Climate Change of the Subtropical North Atlantic: Implications for the Cloud Forests of Tenerife. Clim. Chang. 2004, 65, 103–123. [Google Scholar] [CrossRef]
  15. IPCC. Intergovernmental Panel of Climate Change (IPCC) Synthesis Report, Contribution of Working Groups I, II and III to the Fifth Assessment Report of the Intergovernmental Panel on Climate Change 2014; IPCC: Geneva, Switzerland, 2014. [Google Scholar] [CrossRef]
  16. Expósito, F.J.; González, A.; Pérez, J.C.; Díaz, J.P.; Taima, D. High-resolution future projections of temperature and precipitation in the Canary Islands. J. Clim. 2015, 28, 7846–7856. [Google Scholar] [CrossRef]
  17. Severin, D.H.I.; Anthelme, F.; Harter, D.E.V.; Jentsch, A.; Lotter, E.; Steinbauer, M.J.; Beierkuhnlein, C. Patterns of island treeline elevation—A global perspective. Ecography 2015, 38, 001–010. [Google Scholar]
  18. Brito, P.; Morales, D.; Wieser, G.; Jiménez, M.S. Spatial and seasonal variations in stem CO2 efflux of Pinus canariensis at their upper distribution limit. Trees 2010, 24, 523–531. [Google Scholar] [CrossRef]
  19. Brito, P.; Jiménez, M.S.; Morales, D.; Wieser, G. Assessment of ecosystem CO2 efflux and its components in a Pinus canariensis forest at the treeline. Trees 2013, 27, 999–1009. [Google Scholar] [CrossRef]
  20. Brito, P.; Lorenzo, J.R.; González-Rodríguez, A.M.; Morales, D.; Wieser, G.; Jiménez, M.S. Canopy transpiration of a Pinus canariensis forest at the tree line: Implications for its distribution under predicted climate warming. Eur. J. Res. 2014, 133, 491–500. [Google Scholar] [CrossRef]
  21. Brito, P.; Lorenzo, J.R.; González-Rodríguez, A.M.; Morales, D.; Wieser, G.; Jiménez, M.S. Canopy transpiration of a semi arid Pinus canariensis forest at a treeline ecotone in two hydrologically contrasting years. Agric. For. Meteorol. 2015, 201, 120–127. [Google Scholar] [CrossRef]
  22. Gieger, T.; Leuschner, C. Altitudinal change in needle water relations of Pinus canariensis and possible evidence of a drought-induced alpine timberline on Mt. Teide, Tenerife. Flora 2004, 199, 100–109. [Google Scholar] [CrossRef]
  23. Paulsen, J.; Körner, C. A climate-based model to predict potential treeline position around the globe. Alp. Bot. 2014, 124, 1–12. [Google Scholar] [CrossRef] [Green Version]
  24. Peters, J.; Morales, D.; Jiménez, M.S. Gas exchange characteristics of Pinus canariensis needles in a forest stand on Tenerife, Canary Islands. Trees 2003, 17, 492–500. [Google Scholar] [CrossRef]
  25. Von Caemmerer, S.; Farquhar, G.D. Some relationships between the biochemistry of photosynthesis and the gas exchange of leaves. Planta 1981, 153, 376–397. [Google Scholar] [CrossRef] [PubMed]
  26. Gratani, L. Plant Phenotypic Plasticity in Response to Environmental Factors. Adv. Bot. 2014, 2018, 17. [Google Scholar] [CrossRef]
  27. Prioul, J.L.; Chartier, P. Partitioning of transfer and carboxylation components of intracellular resistance to photosynthetic CO2 fixation: A critical analysis of the methods used. Ann. Bot. 1977, 41, 789–800. [Google Scholar] [CrossRef]
  28. Genty, B.; Briantais, J.M.; Baker, N.R. The relationship between the quantum yield of photosynthetic electron-transport and quenching of chlorophyll fluorescence. Biochim. Biophys. Acta 1989, 990, 87–92. [Google Scholar] [CrossRef]
  29. Werner, C.; Correia, O.; Beyschlag, W. Characteristic patterns of chronic and dynamic photoinhibition of different functional groups in a Mediterranean ecosystem. Funct. Plant Biol. 2002, 29, 999–1011. [Google Scholar] [CrossRef]
  30. Osmond, C.B. What is photoinhibition? Some insights from comparison of shade and sun plants. In Photoinhibition of Photosynthesis: From Molecular Mechanisms to the Field; Baker, N.R., Bowyer, J.R., Eds.; BIOS Scientific Publishers: Lancaster, PA, USA, 1994; pp. 1–24. [Google Scholar]
  31. Strasser, R.J.; Tsimilli-Michael, M.; Srivastava, A. Analysis of the chlorophyll a fluorescence transient. In Chlorophyll a Fluorescence: A Signature of Photosynthesis; Papageorgiou, G.C., Govindjee, R., Eds.; Springer: Dordrecht, The Netherlands, 2004; pp. 321–362. [Google Scholar]
  32. Strasser, R.J.; Tsimilli-Michael, M.; Qiang, S.; Goltsev, V. Simultaneous in vivo recording of prompt and delayed fluorescence and 820-nm reflection changes during drying and after rehydration of the resurrection plant Haberlea rhodopensis. Biochim. Biophys. Acta 2010, 1797, 1313–1326. [Google Scholar] [CrossRef] [PubMed]
  33. Pflug, E.; Brüggemann, W. Frost-acclimation of photosynthesis in overwintering Mediterranean holm oak, grown in Central Europe. Int. J. Plant Biol. 2012, 3. [Google Scholar] [CrossRef]
  34. Tausz, M.; Wonisch, A.; Grill, D.; Morales, D.; Jiménez, M.S. Measuring antioxidants in tree species in the natural environment: From sampling to data evaluation. J. Exp. Bot. 2003, 387, 1505–1510. [Google Scholar] [CrossRef]
  35. Morales, D.; Peters, J.; Jiménez, M.S.; Tausz, M.; Wonisch, A.; Grill, D. Gas exchange of irrigated and non-irrigated Pinus canariensis seedlings growing outdoors in La Laguna, Canary Islands, Spain. Naturforsch 1999, 54, 693–697. [Google Scholar] [CrossRef]
  36. González-Rodríguez, A.M.; Morales, D.; Jimenez, M.S. Leaf gas exchange characteristics of a Canarian laurel forest tree species (Persea indica (L.) Spreng) under natural conditions. J. Plant Phys. 2002, 159, 695–704. [Google Scholar]
  37. Peters, J.; González-Rodríguez, A.M.; Jiménez, M.S.; Morales, D.; Wieser, G. Influence of canopy position, needle age and season on the foliar gas exchange of Pinus canariensis. Eur. J. Res. 2008, 127, 293–299. [Google Scholar] [CrossRef]
  38. Rundel, P.W.; Yoder, B.J. Ecophysiology of Pinus. In Ecology and Biogeography of Pinus; Richardson, D.M., Ed.; Cambridge University Press: Cambridge, UK, 2000; pp. 296–323. [Google Scholar]
  39. Larcher, W. Physiological Plant Ecology. Ecophysiology and Stress Physiology of Functional Groups, 4th ed.; Springer: Basel, Switzerland, 2003; p. 488. [Google Scholar]
  40. Peters, J. Ecofisiología del pino canario. Ph.D. Dissertation, University of La Laguna, Santa Cruz de Tenerife, Spain, 2000. [Google Scholar]
  41. Gulías, J.; Flexas, J.; Mus, M.; Cifre, J.; Lefi, E.; Medrano, H. Relationship between maximum leaf photosynthesis, nitrogen content and specific leaf area in Balearic endemic and non endemic Mediterranean species. Ann. Bot. 2003, 92, 215–222. [Google Scholar] [CrossRef] [PubMed]
  42. Zellnig, G.; Peters, J.; Jiménez, M.S.; Morales, D.; Grill, D.; Perktold, A. Three-Dimensional reconstruction of the stomatal complex in Pinus canariensis needles using serial sections. Plant Biol. 2002, 4, 70–76. [Google Scholar] [CrossRef]
  43. Galmés, J.; Flexas, J.; Medrano, H.; Niinemets, Ü.; Valladares, F. Ecophysiology of photosynthesis in semi-arid cenvironments. In Terrestrial Photosynthesis in a Changing Environment. A Molecular, Physiological and Ecological Approach; Flexas, J., Loreto, F., Medrano, H., Eds.; Cambridge University Press: Cambridge, UK, 2012; pp. 448–464. [Google Scholar]
  44. Niinemets, Ü. Climatic controls of leaf dry mass per area, density, and thickness in trees and shrubs at the global scale. Ecology 2001, 82, 453–469. [Google Scholar] [CrossRef]
  45. Paula, S.; Pausas, J.G. Leaf traits and resprouting ability in the Mediterranean basin. Funct. Ecol. 2006, 20, 941–947. [Google Scholar] [CrossRef]
  46. Poorter, H.; Niinemets, Ü.; Poorter, L.; Wright, I.J.; Villar, R. Causes and consequences of variation in leaf mass per area (LMA): A meta-analysis. New Phytol. 2009, 182, 565–588. [Google Scholar] [CrossRef] [PubMed]
  47. Zunzunegui, M.; Barradas, M.C.D.; Ain-Lhout, F.; Alvarez-Cansino, L.; Esquivias, M.P.; Novo, F.G. Seasonal physiological plasticity and recovery capacity after summer stress in Mediterranean scrub communities. Plant Ecol. 2011, 212, 127–142. [Google Scholar] [CrossRef]
  48. Baker, N.R.; Rosenqvist, E. Applications of chlorophyll fluorescence can improve crop production strategies: An examination of future possibilities. J. Exp. Bot. 2004, 403, 1607–1621. [Google Scholar] [CrossRef]
  49. Nippert, J.B.; Duursma, R.A.; Marshall, J.D. Seasonal variation in photosynthetic capacity of montane conifers. Funct. Ecol. 2004, 18, 876–886. [Google Scholar] [CrossRef] [Green Version]
  50. Porcar-Castell, A.; Juurola, E.; Ensminger, I.; Berninger, F.; Hari, P.; Nikinmaa, E. Seasonal acclimation of photosystem II in Pinus sylvestris. II. Using the rate constants of sustained thermal energy dissipation and photochemistry to study the effect of the light environment. Tree Physiol. 2008, 28, 1483–1491. [Google Scholar] [CrossRef] [PubMed]
  51. Robakowski, P.; Wyka, T. Winter photoinhibition in needles of Taxus baccata seedlings acclimated to different light levels. Photosynthetica 2009, 47, 527–535. [Google Scholar] [CrossRef]
  52. García-Plazaola, J.I.; Olano, J.M.; Hernández, A.; Becerril, J.M. Photoprotection in evergreen Mediterranean plants during sudden periods of intense cold weather. Trees-Struct. Funct. 2003, 17, 285–291. [Google Scholar]
  53. Müller, M.; Hernández, I.; Alegre, L.; Munné-Bosch, S. Enhanced alpha-tocopherol quinone levels and xanthophyll cycle de-epoxidation in rosemary plants exposed to water deficit during a Mediterranean winter. J. Plant Physiol. 2006, 163, 601–606. [Google Scholar] [CrossRef] [PubMed]
  54. Somersalo, S.; Krause, H.G. Photoinhibition at chilling temperatures and effects of freezing stress on cold acclimated spinach leaves in the field. A fluorescence study. Physiol. Plant. 1990, 79, 617–622. [Google Scholar] [CrossRef] [PubMed]
  55. Robakowski, P. Susceptibility to low-temperature photoinhibition in three conifers differing in successional status. Tree Physiol. 2005, 25, 1151–1160. [Google Scholar] [CrossRef] [PubMed] [Green Version]
  56. Ottander, C.; Öquist, G. Recovery of photosynthesis in winter-stressed Scots pine. Plant Cell Env. 1991, 14, 345–349. [Google Scholar] [CrossRef]
  57. Westin, J.; Sundblad, L.G.; Hällgren, J.E. Seasonal variation in photochemical activity and hardiness in clones of Norway spruce (Picea abies). Tree Physiol. 1995, 15, 685–689. [Google Scholar] [CrossRef]
  58. Oleksyn, J.; Reich, P.B.; Tjoelker, M.G.; Chalupka, W. Biogeographic differences in shoot elongation pattern among European Scots pine populations. Ecol. Man. 2001, 148, 207–220. [Google Scholar] [CrossRef]
  59. Sheffield, M.C.P.; Gagnon, J.L.; Jack, S.B.; McConville, D.J. Phenological patterns of mature longleaf pine (Pinus palustris Miller) under two different soil moisture regimes. For. Ecol. Manag. 2003, 179, 157–167. [Google Scholar] [CrossRef]
  60. Gasulla, F.; Gómez de Nova, O.; Barreno, E. Relaciones entre la variabilidad fenológica de Pinus canariensis, el clima y la concentración foliar de los nutrientes. Cuad. Soc. Esp. Cienc. 2004, 20, 141–146. [Google Scholar]
  61. Esteban, R.; Barrutia, O.; Artetxe, U.; Fernández-Marín, B.; Hernández, A.; García-Plazaola, J.I. Internal and external factors affecting photosynthetic pigment composition in plants: A meta-analytical approach. New Phytol. 2015, 206, 268–280. [Google Scholar] [CrossRef] [PubMed]
  62. Elvira, S.; Alonso, R.; Castillo, F.J.; Gimeno, B.S. On the response of pigments and antioxidants of Pinus halepensis seedlings to Mediterranean climatic factors and long-term ozone exposure. New Phytol. 1998, 138, 419–432. [Google Scholar] [CrossRef]
  63. Lichtenthaler, H.K.; Babani, F. Light adaptation and senescence of the photosynthetic apparatus. Changes in pigment composition, chlorophyll fluorescence parameters and photosynthetic activity. Adv. Photosynth. Respir. 2004, 19, 713–736. [Google Scholar]
  64. Telfer, A. Singlet Oxygen Production by PSII Under light stress: Mechanism, detection and the protective role of β-Carotene. Plant Cell Physiol. 2014, 55, 1216–1223. [Google Scholar] [CrossRef]
  65. Triantaphylidès, C.; Krischke, M.; Hoeberichts, F.A.; Ksas, B.; Gresser, G.; Havaux, M.; Van Breusegem, F.; Martin, J.M. Singlet oxygen is the major reactive oxygen species involved in photooxidative damage to plants. Plant Physiol. 2008, 148, 960–968. [Google Scholar] [CrossRef] [PubMed]
  66. Munné-Bosch, S. The role of a-tocopherol in plant stress tolerance. J. Plant Phys. 2005, 162, 743–748. [Google Scholar] [CrossRef]
  67. Falk, J.; Munné-Bosch, S. Tocochromanol functions in plants: Antioxidation and beyond. J. Exp. Bot. 2010, 61, 1549–1566. [Google Scholar] [CrossRef]
  68. Maeda, H.; Song, W.; Sage, S.L.; Della Pennaa, D. Tocopherols play a crucial role in low-temperature adaptation and phloem loading in Arabidopsis. Plant Cell 2006, 18, 2710–2732. [Google Scholar] [CrossRef]
  69. Flexas, J.; Gulías, J.; Jonasson, S.; Medrano, H.; Mus, M. Seasonal patterns and control of gas exchange in local populations of the Mediterranean evergreen shrub Pistacia lentiscus L. Acta Oecol. 2001, 22, 33–43. [Google Scholar] [CrossRef]
  70. Martín, J.L.; Bethencourt, J.; Cuevas-Agulló, E. Assessment of global warming on the island of Tenerife, Canary Islands (Spain). Trends in minimum, maximum and mean temperatures since 1944. Clim. Chang. 2012, 114, 343–355. [Google Scholar] [CrossRef]
Figure 1. Seasonal course of daily maximum air temperature (solid line) and daily minimum air temperature (dotted line) during the study period.
Forests 10 00845 g001
Figure 2. Regression analysis between leaf temperature (TL) and net CO2 assimilation rates (An: Top), transpiration rates (E: middle) and stomatal conductance (gs: Bottom) using boundary lines including 99 % of data points. Individual measurements were collected from March to April. Data showed in black are from the summer period. Regression for entire data set: An = -0.080* TL2 + 4.224 * TL − 40.268; E = −0.275 + 0.0012TL0.01; gs = −1.65 TL 2+ 84.26 TL − 747.03, all P < 0.000.
Forests 10 00845 g002
Figure 3. Regression analysis between vapor pressure deficit (VPD) and net CO2 assimilation rates (An: Top), transpiration rates (E: middle), and stomatal conductance (gs: bottom) using boundary lines including 99 % of data points. Individual measurements were collected from March to April. Data showed in black are from the summer period. Regression for entire data set: An = −1.91 VPD2 + 10.7 VPD + 1.09 and E = 1.036 e 0.822 VPD.
Forests 10 00845 g003
Figure 4. Seasonal course of daily net CO2 assimilation rates (An: Top), transpiration (E: Middle) and stomatal conductance (gs: Bottom, black circles) and vapor pressure deficit (VPD: Bottom, white circles). Data are means of fifteen needle fascicles ± standard deviation measured in the morning.
Forests 10 00845 g004
Figure 5. Specific leaf area (SLA, cm2 projected area g−1 dry mass) in P. canariensis needles (solid line) and mean daily air temperature in previous 5-days of measurement day (dotted line). Linear regression SLA: y = −0.6645x + 46.467 (R2 = 0.73, P < 0.05). Significant differences in SLA are shown with letters (P < 0.05).
Forests 10 00845 g005
Figure 6. Top: Chronic (black columns) and dynamic photoinhibition (white columns) in percentage during representative days for the seasons. Medium: Performance index (PI abs) at predawn (06:00; black) and midday (12:00: white) on the same days represented on top figure. Bottom: Flux to energy dissipation per reaction center (DIo/CR) at predawn (06:00; black) and midday (12:00; white).
Forests 10 00845 g006
Figure 7. Composition of each carotenoids (N, Neoxanthin; L, Lutein; V, Violaxanthin; A, Anteraxanthin; Z, Zeaxanthin, β-Car, β-Carotene and α-Car, α-Carotene) in percentage in spring, late summer, and late winter.
Forests 10 00845 g007
Table 1. Mean vapor pressure deficit (VPD; kPa), mean global radiation (GR; W m−2), mean air temperature (Tair; °C), and soil water potential at 30 cm depth (SWP; MPa) from 06:00 to 14:00 on the days in which the gas measurements were done at the study site. Values are mean ± standard deviation.
SeasonVPD (kPa)GR (W m−2)Tair (°C)SWP (MPa)
Spring0.85 ± 0.54645 ± 9012.33 ± 3.45−0.0662 ± 0.0742
Summer2.16 ± 1.27665 ± 11121.63 ± 5.91−1.1002 ± 0.0000
Cold season
(Autumn-Winter)
0.82 ± 0.33484 ± 7710.56 ± 3.82−0.0293 ± 0.0295
Next Spring1.10 ± 0.34713 ± 2512.96 ± 2.29−0.0202 ± 0.0012
Table 2. Pigment and tocopherol composition in P. canariensis needles (mean ± sd) where: chlorophyll a (Chl a; µmol m−2); chlorophyll b (Chl b; µmol m−2); total chlorophyll (Chl (a + b), µmol m−2); chlorophyll a to chlorophyll b ratio (Chl a/b); total carotenoids per chlorophyll (Tot Carot/Chl); Lutein per chlorophyll (L/Chl); β-Carotene per chlorophyll (β-Car); Total VAZ (V: Violaxanthin, A: Anteraxanthin, Z: Zeaxanthin) per chlorophyll (VAZ/Chl); Neoxanthin per chlorophyll (N/Chl); Anteraxanthin and Zeaxanthin to total VAZ ratio (A+Z/VAZ); and α-Tocopherol per chlorophyll (α-Toc/Chl). All data per chlorophyll are shown in mmol mol−1 Chl a + b. Different letters denote statistically significant differences at P < 0.05 after Duncan test over the seasons.
Pigments and TocopherolSpring SummerAutumnWinterNext SpringAnnual Mean
Chl a416 ± 94 a381 ± 122 a361 ± 110 a361 ± 95 a363 ± 107 a368 ± 107
Chl b161 ± 40 a144 ± 48 ab125 ± 40 bc118 ± 34 c130 ± 37 bc130 ± 42
Chl (a + b)578 ± 133 a525 ± 170 ab491 ± 144 ab474 ± 132 b493 ± 130 ab498 ± 148
Chl a/b2.60 ± 0.14 a2.66 ± 0.21 a2.89 ± 0.18 b3.07 ± 0.21 c2.82 ± 0.22 b2.87 ± 0.26
Tot Carot/Chl287 ± 32 a337 ± 40 b374 ± 49 c397 ± 54 c388 ± 55 c370 ± 56
L/Chl112 ± 13 a127 ± 20 b150 ± 16 c157 ± 18 c154 ± 19 c145 ± 22
β-Car/Chl69 ± 8 a78 ± 11 b97 ± 21 c115 ± 25 d111 ± 22 d98 ± 25
VAZ/Chl63 ± 16 a89 ± 24 b87 ± 22 b88 ± 23 b85 ± 19 b87 ± 23
N/Chl36.42 ± 1.47 a34.65 ± 2.64 b34.58 ± 3.08 b33.98 ± 3.10 b35.25 ± 2.50 ab35.52 ± 2.92
A+Z/VAZ0.51 ± 0.14 a0.21 ± 0.14 b0.51 ± 0.24 a0.54 ± 0.19 a0.49 ± 0.17 a0.44 ± 0.23
α-Toc/Chl98 ± 82 a197 ± 104 b341 ± 153 d295 ± 117 cd259 ± 117 c274 ± 141