Modeling the Influence of Eucalypt Plantation on Wildfire Occurrence in the Brazilian Savanna Biome


Abstract
1. Introduction
2. Materials and Methods
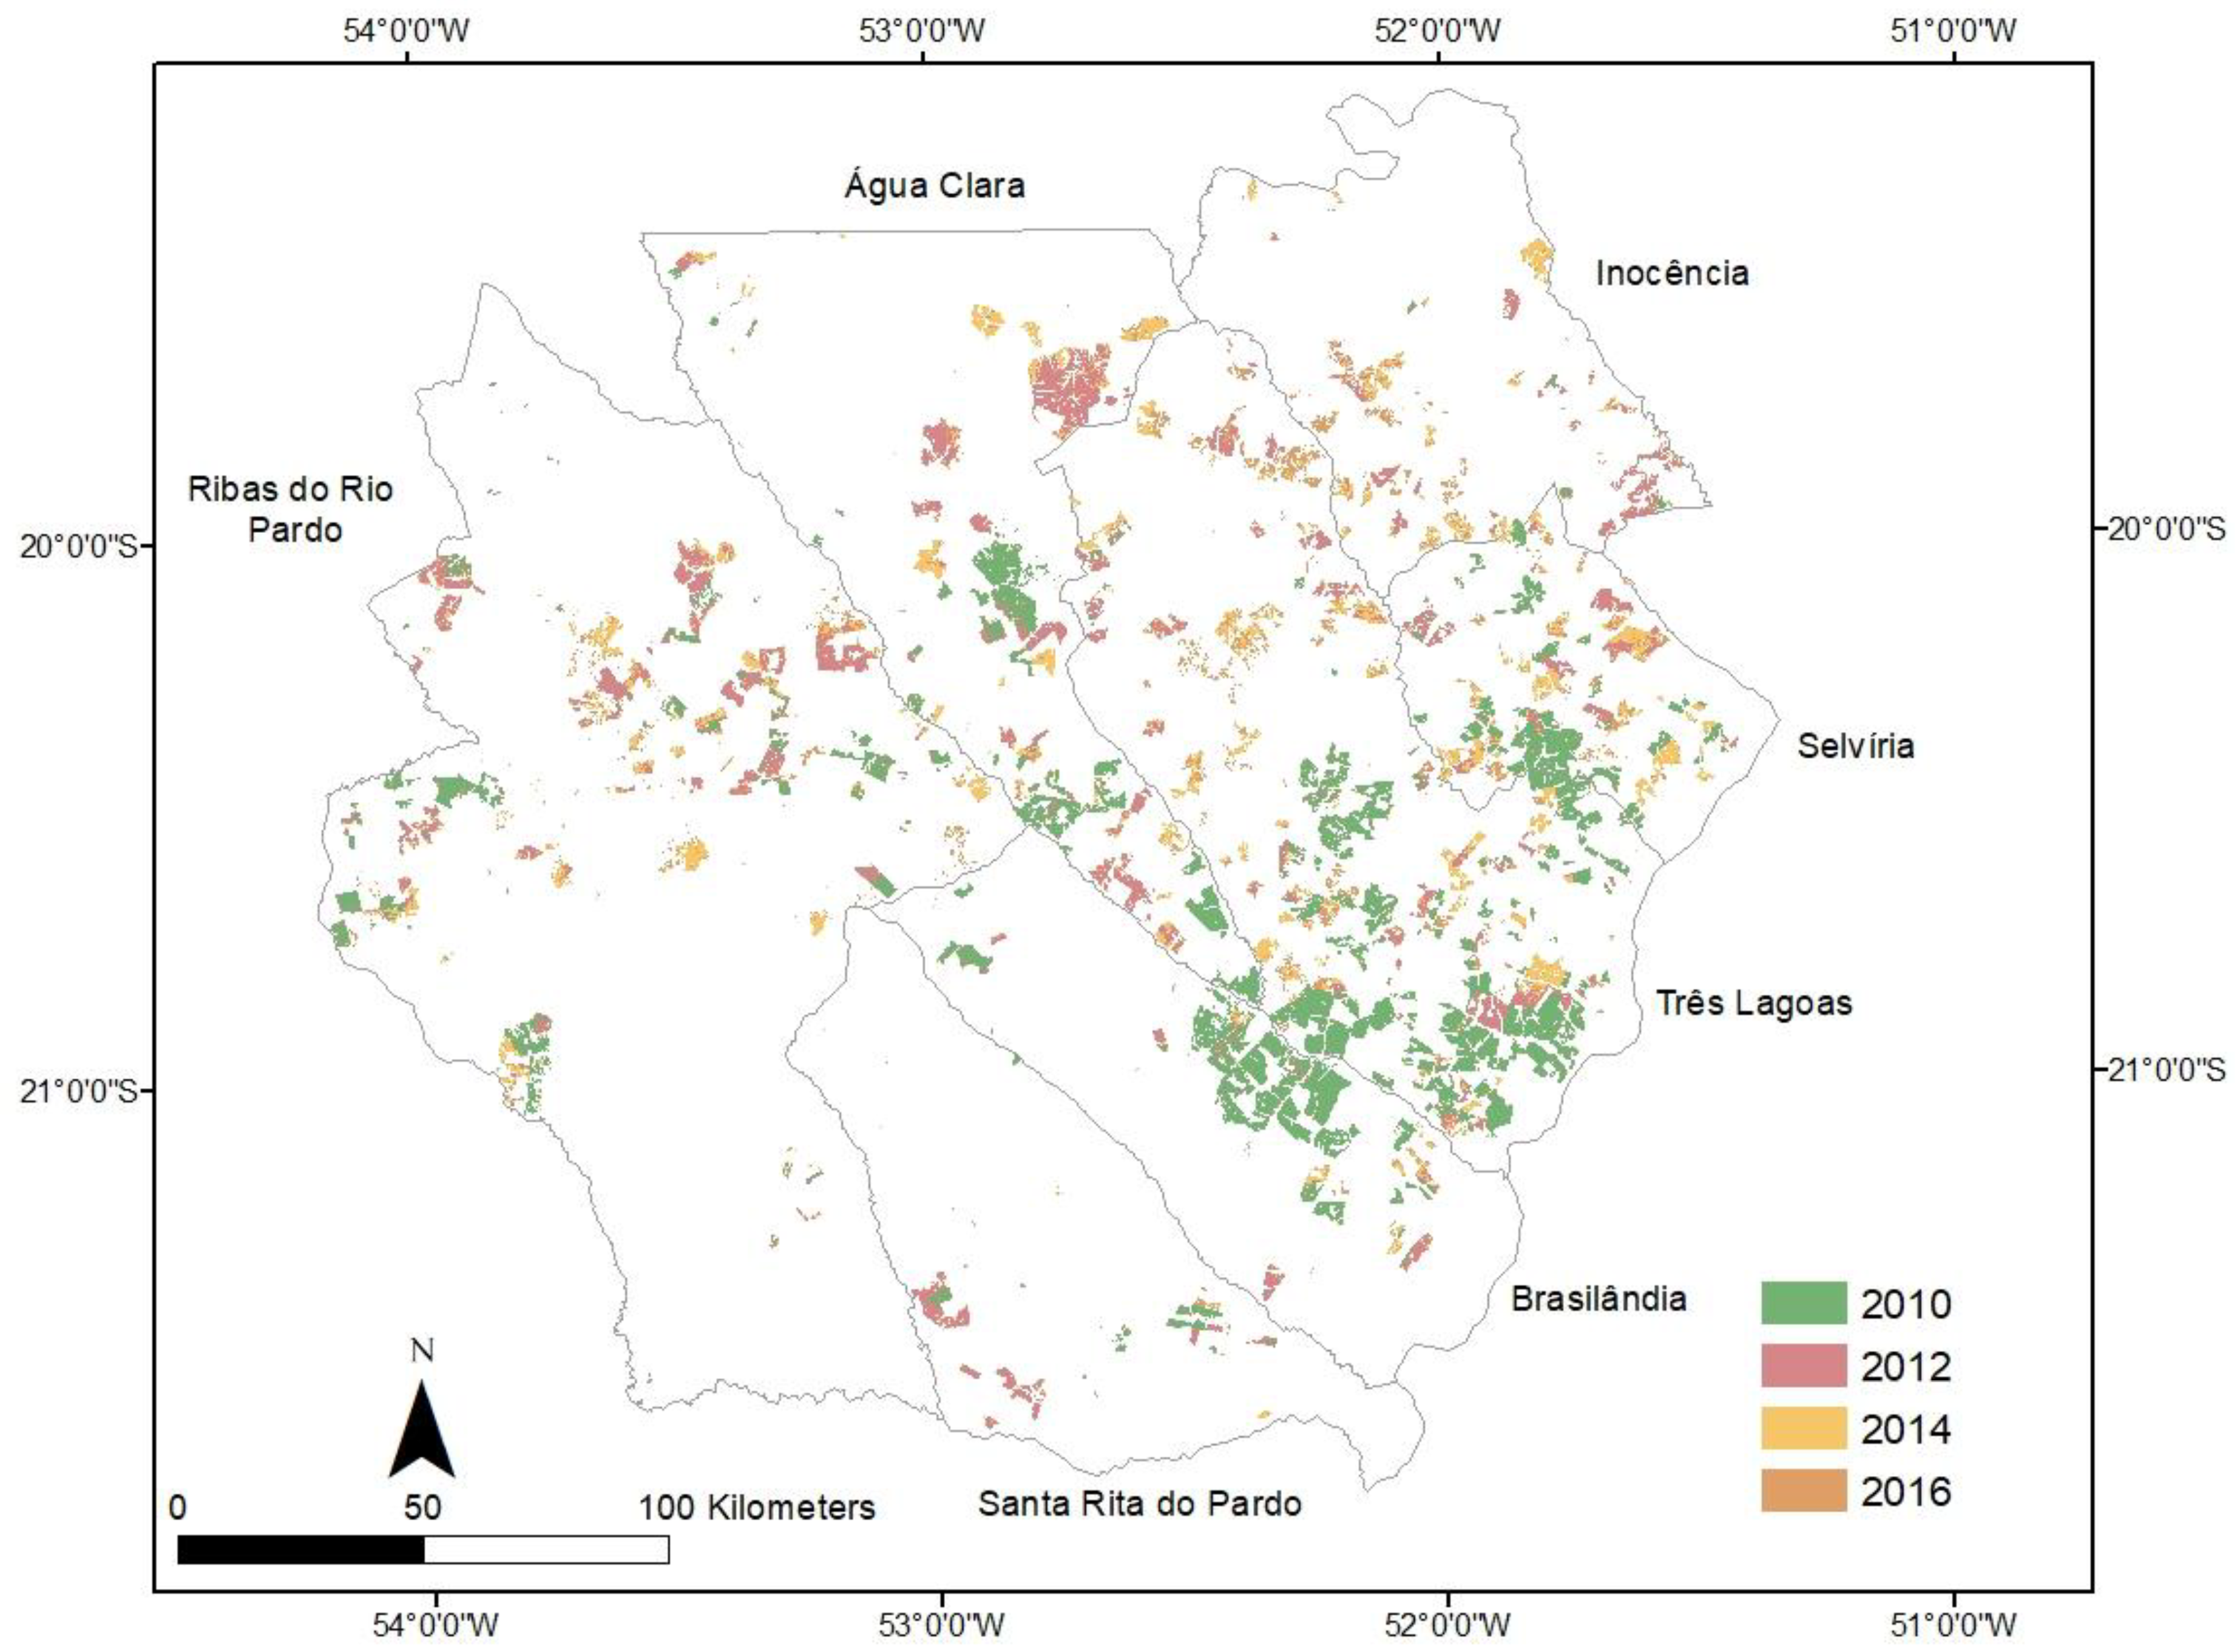
2.1. Study Area
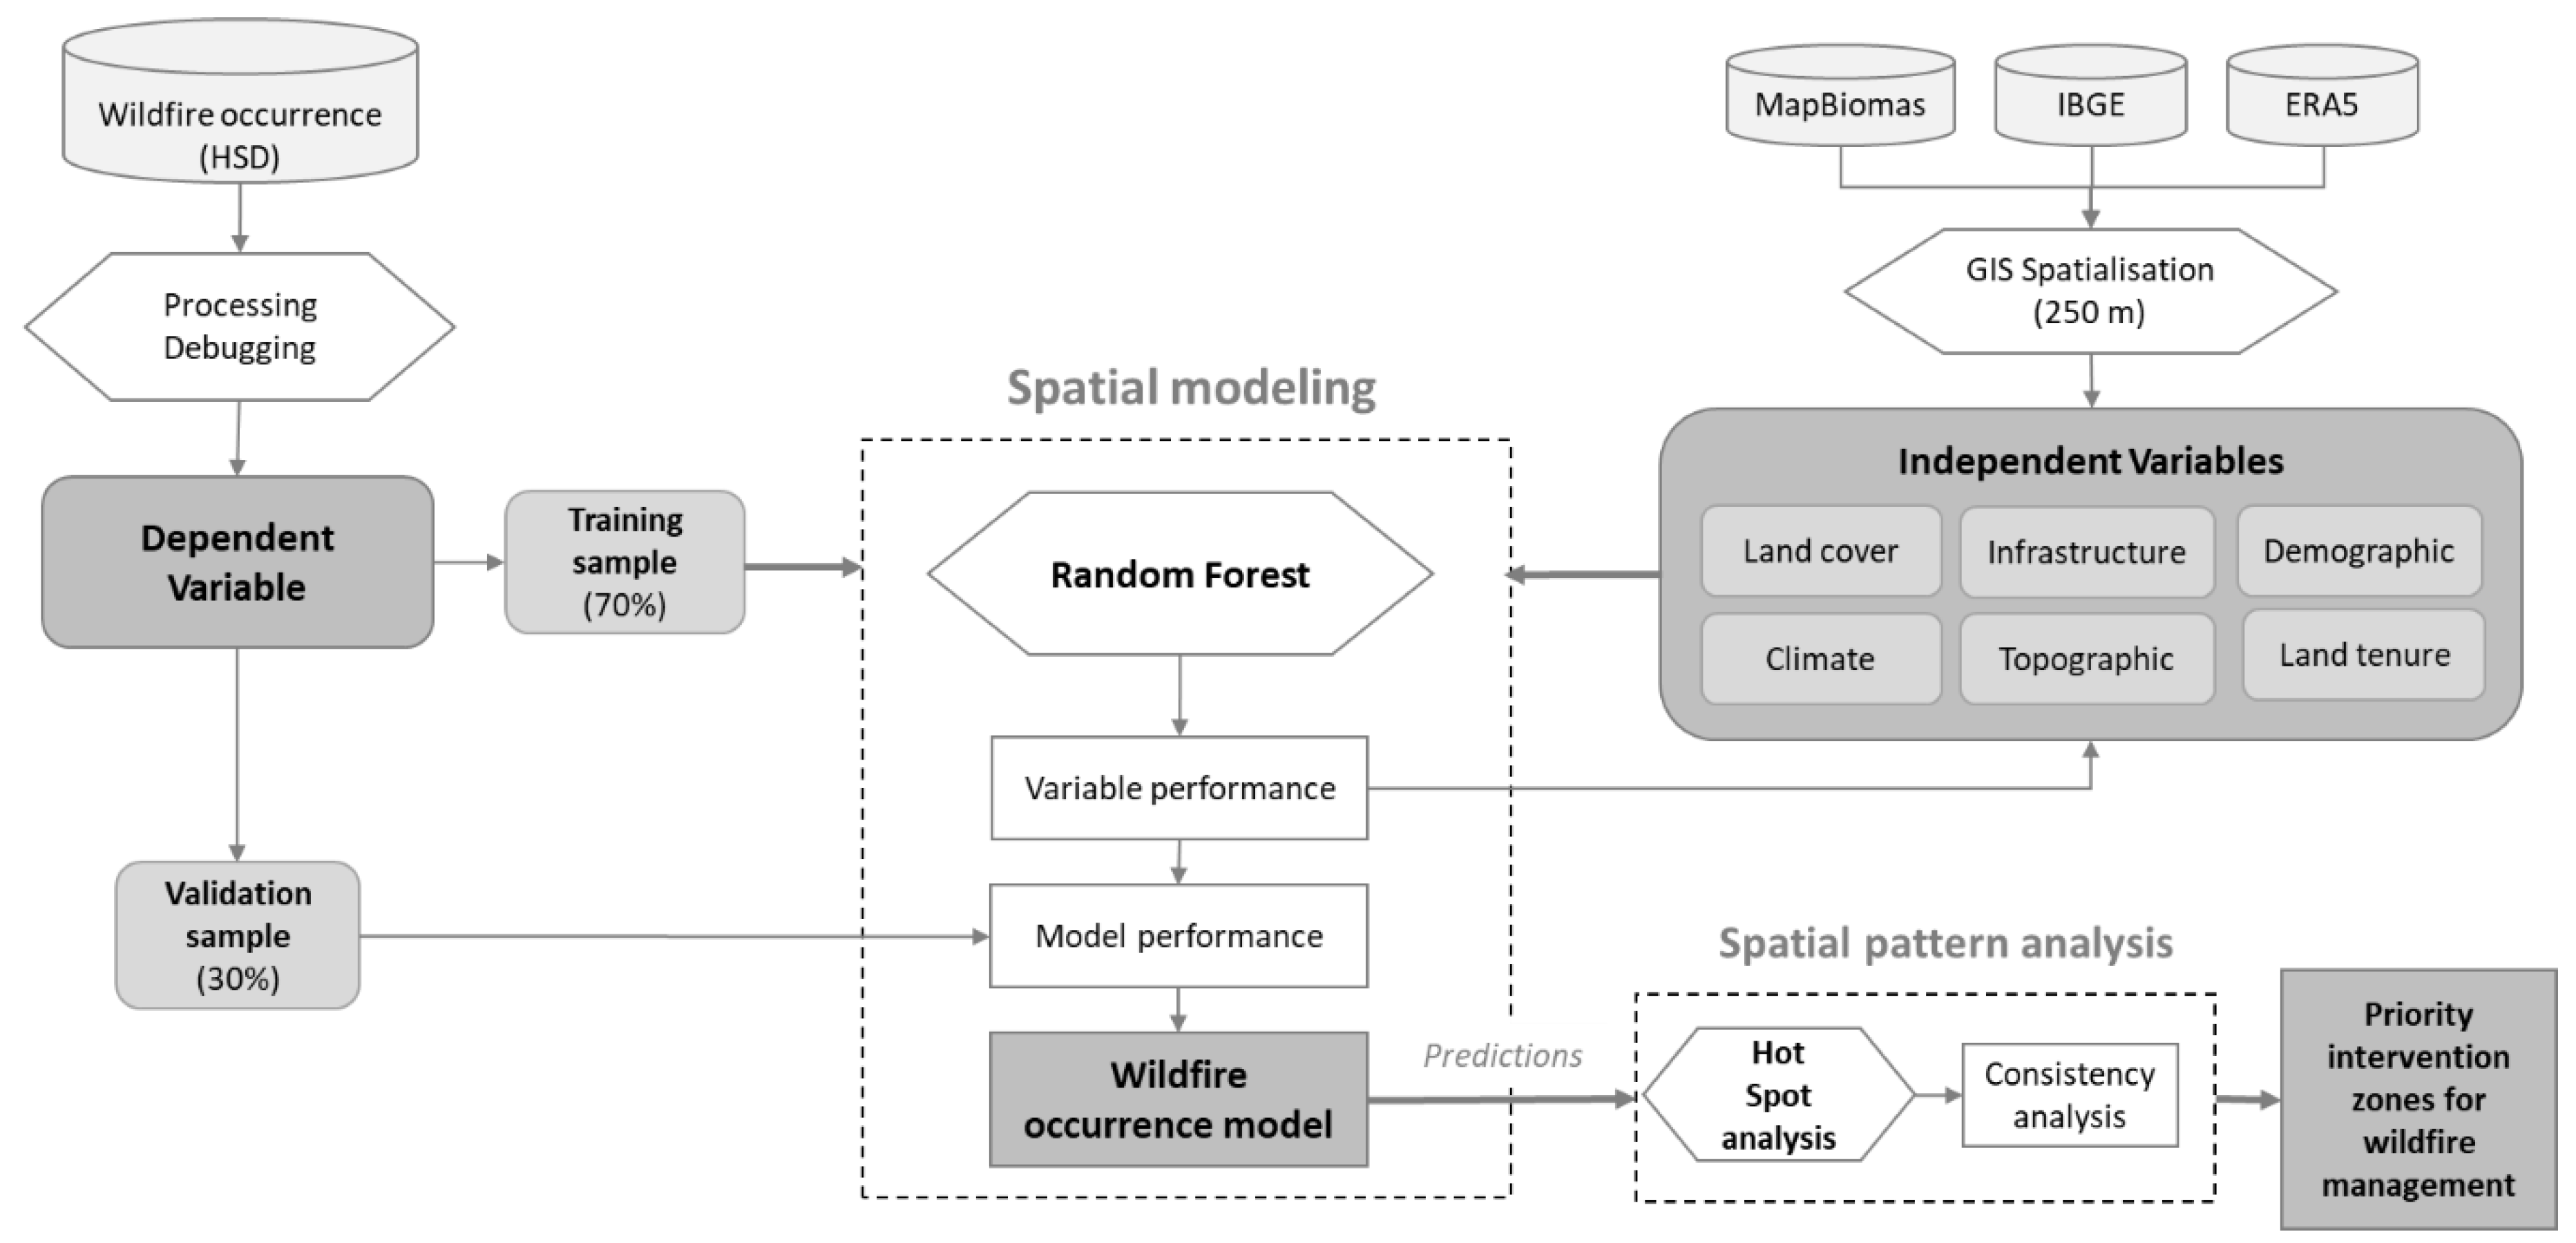
2.2. Methods
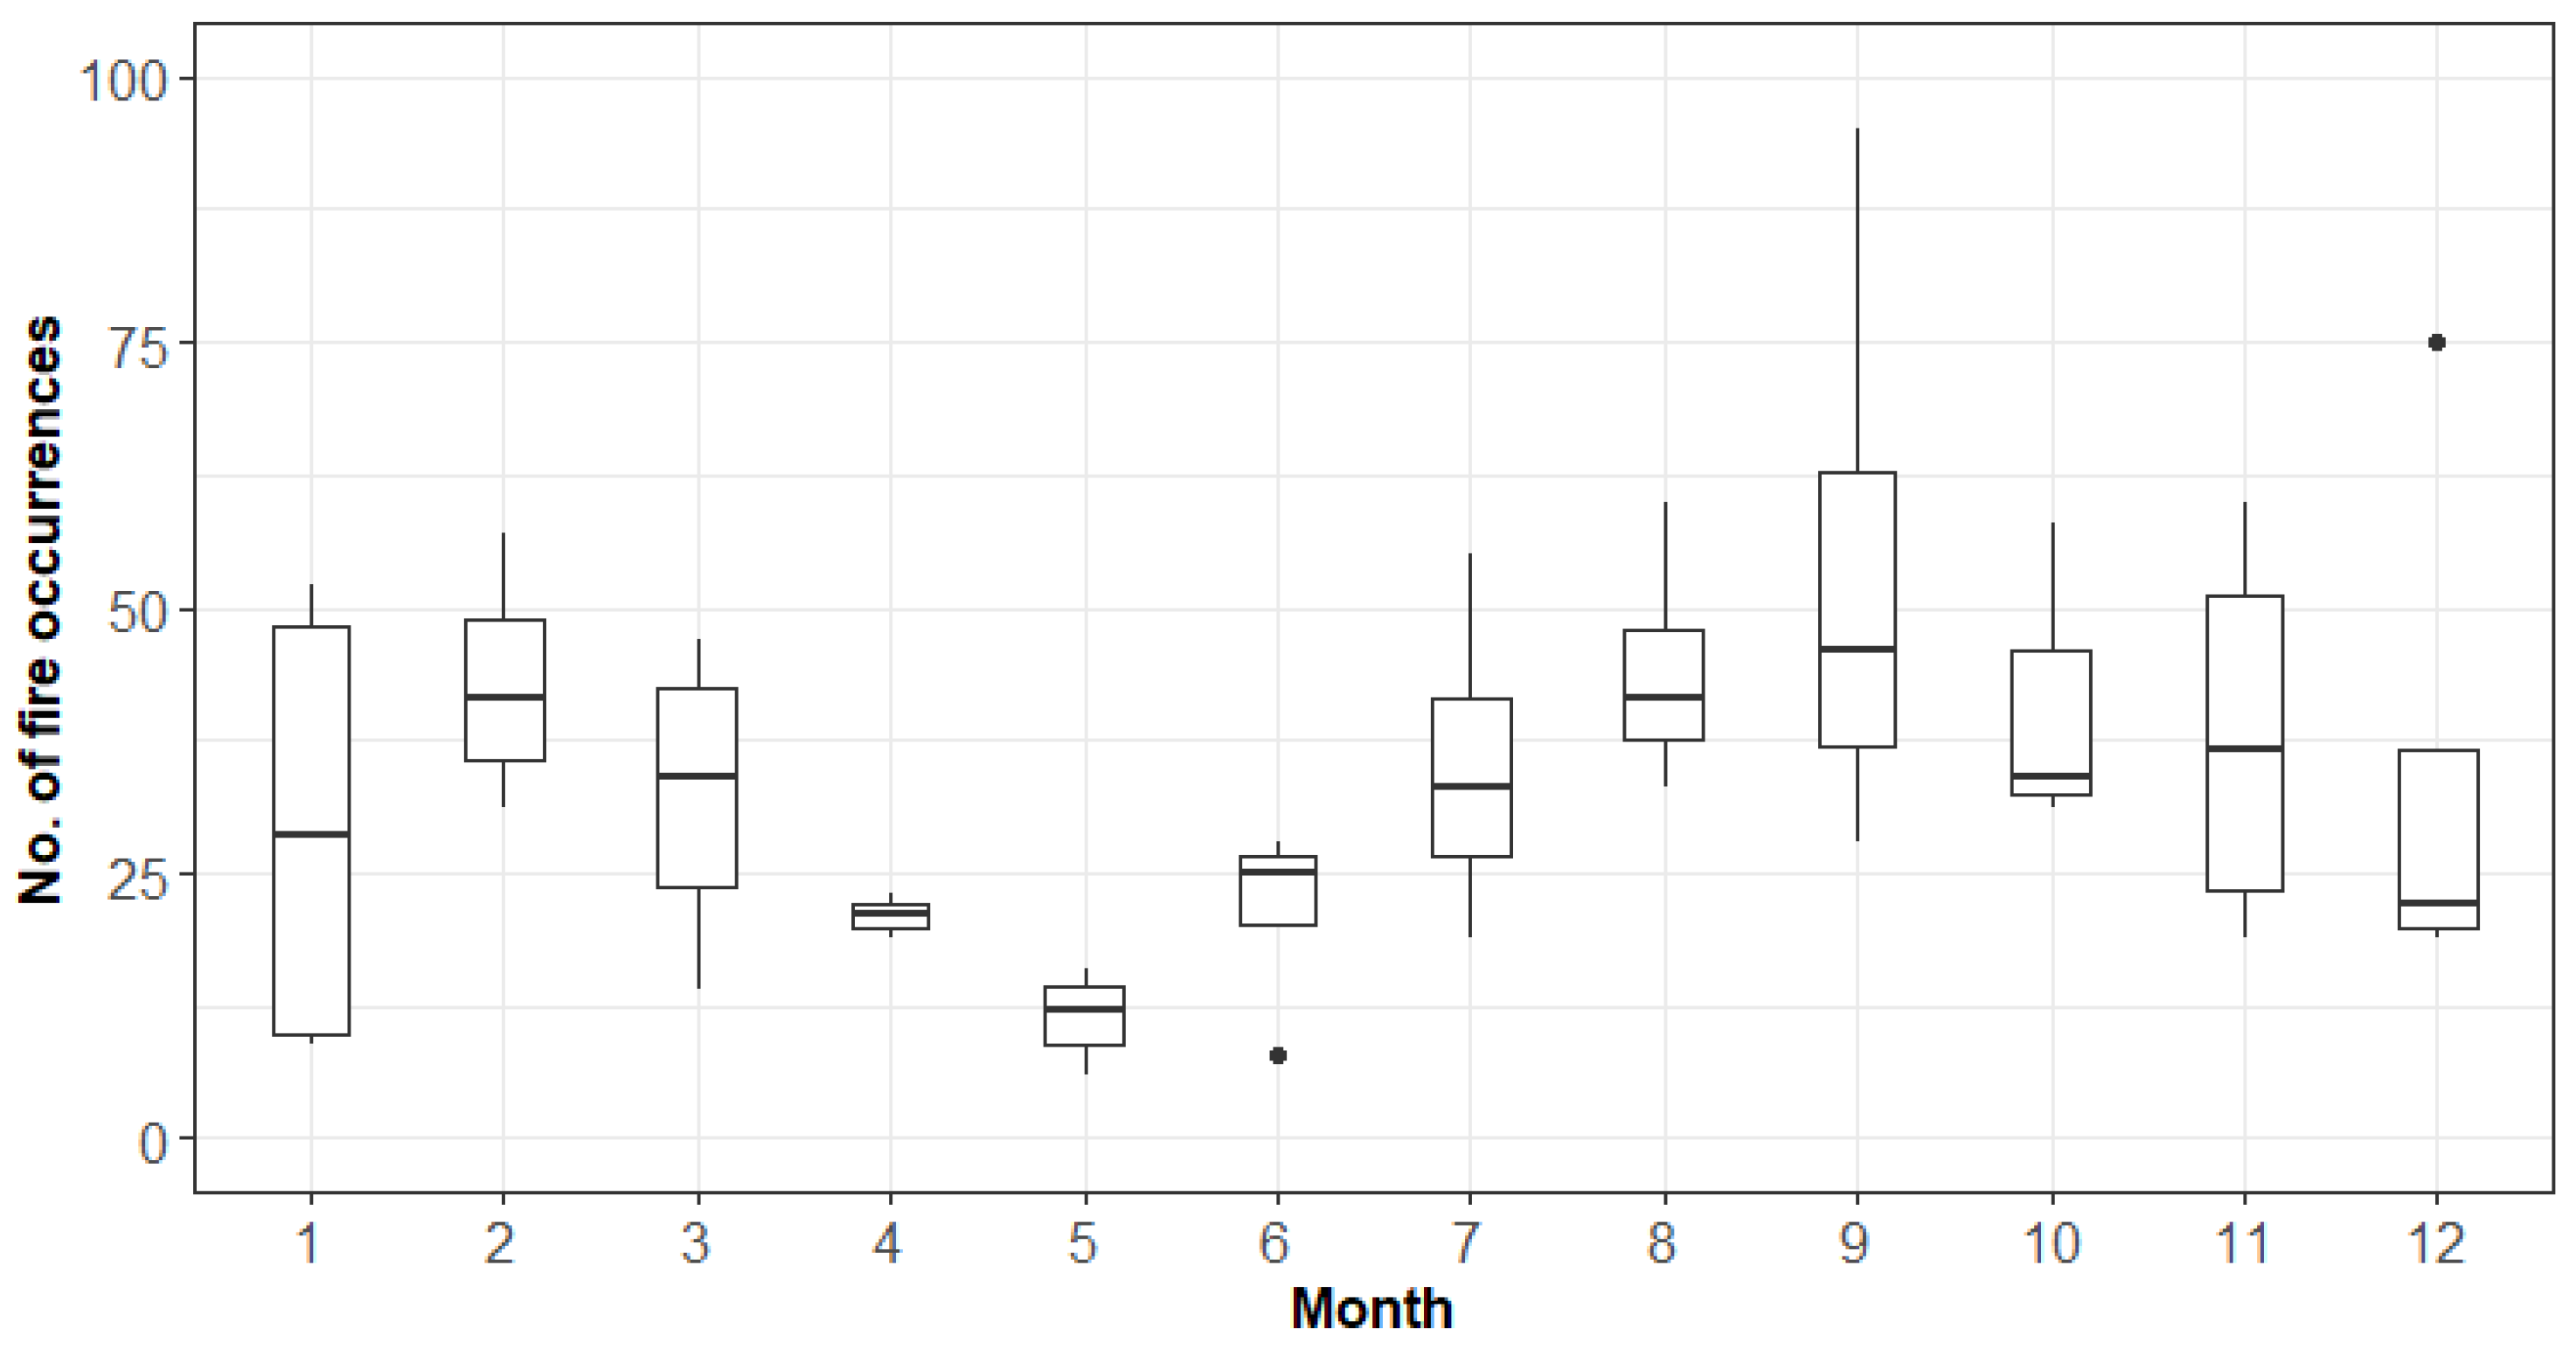
2.3. Dependent Variable
2.4. Explanatory Variables
2.5. Model Calibration and Evaluation
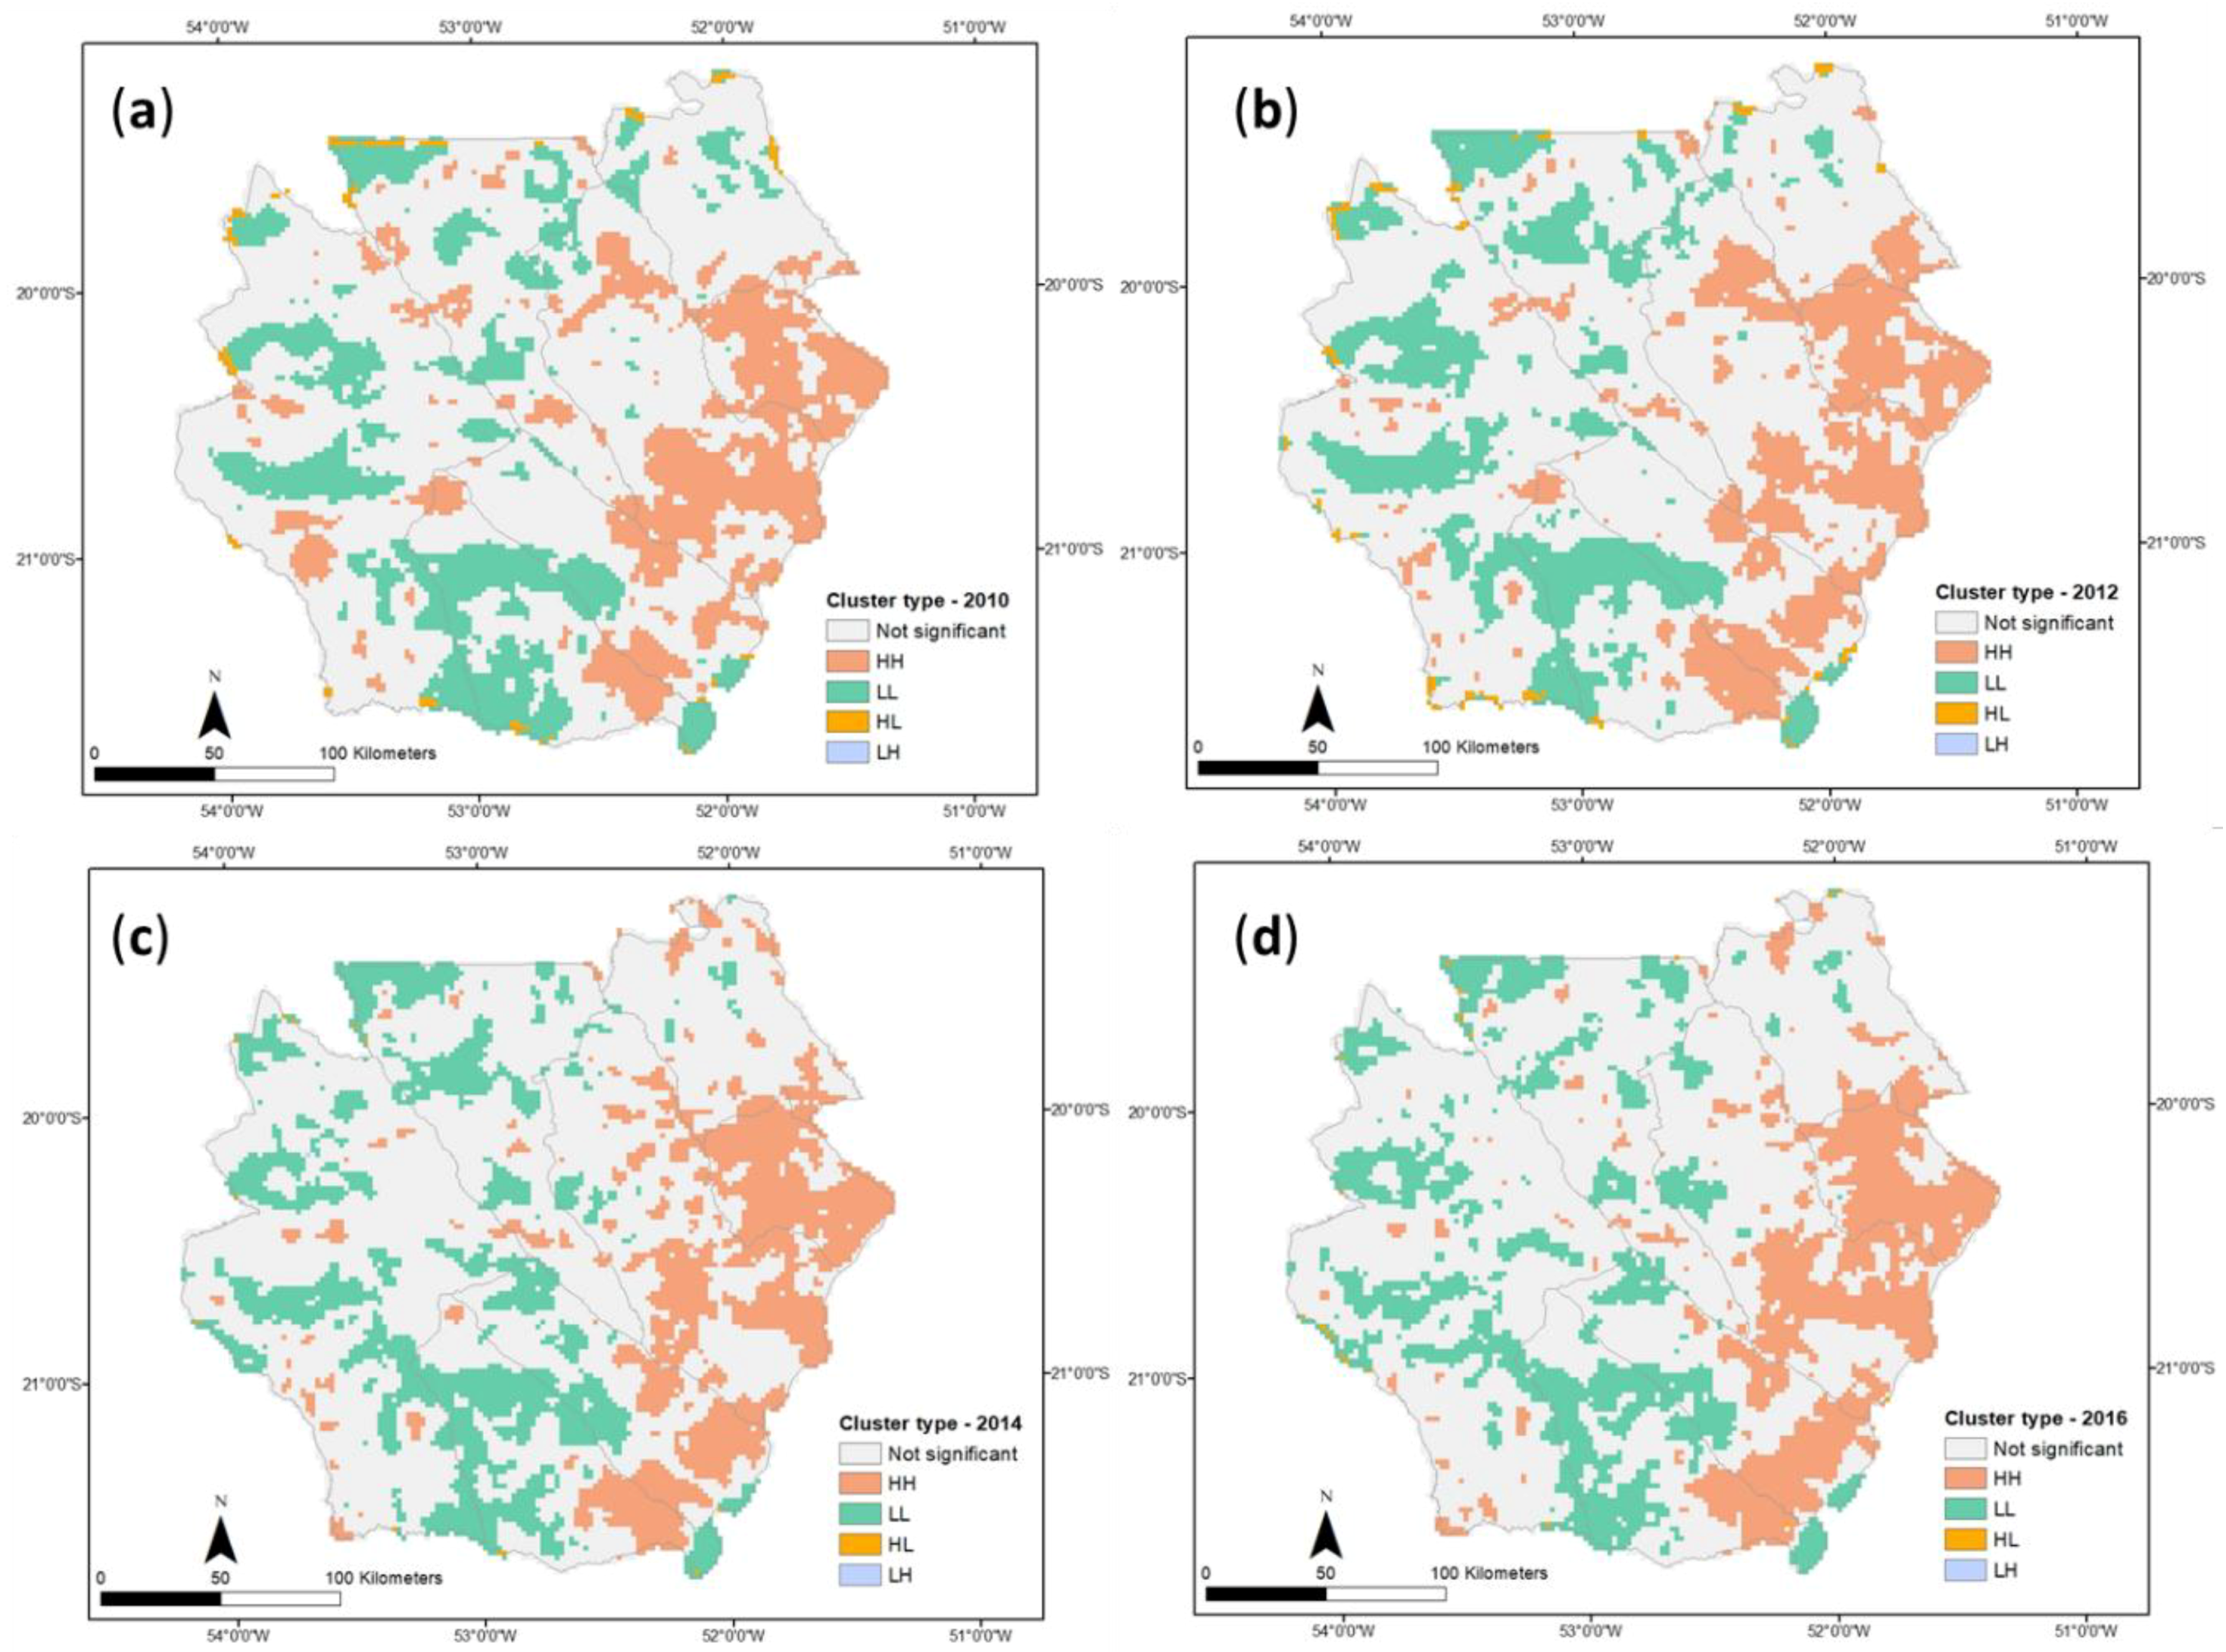
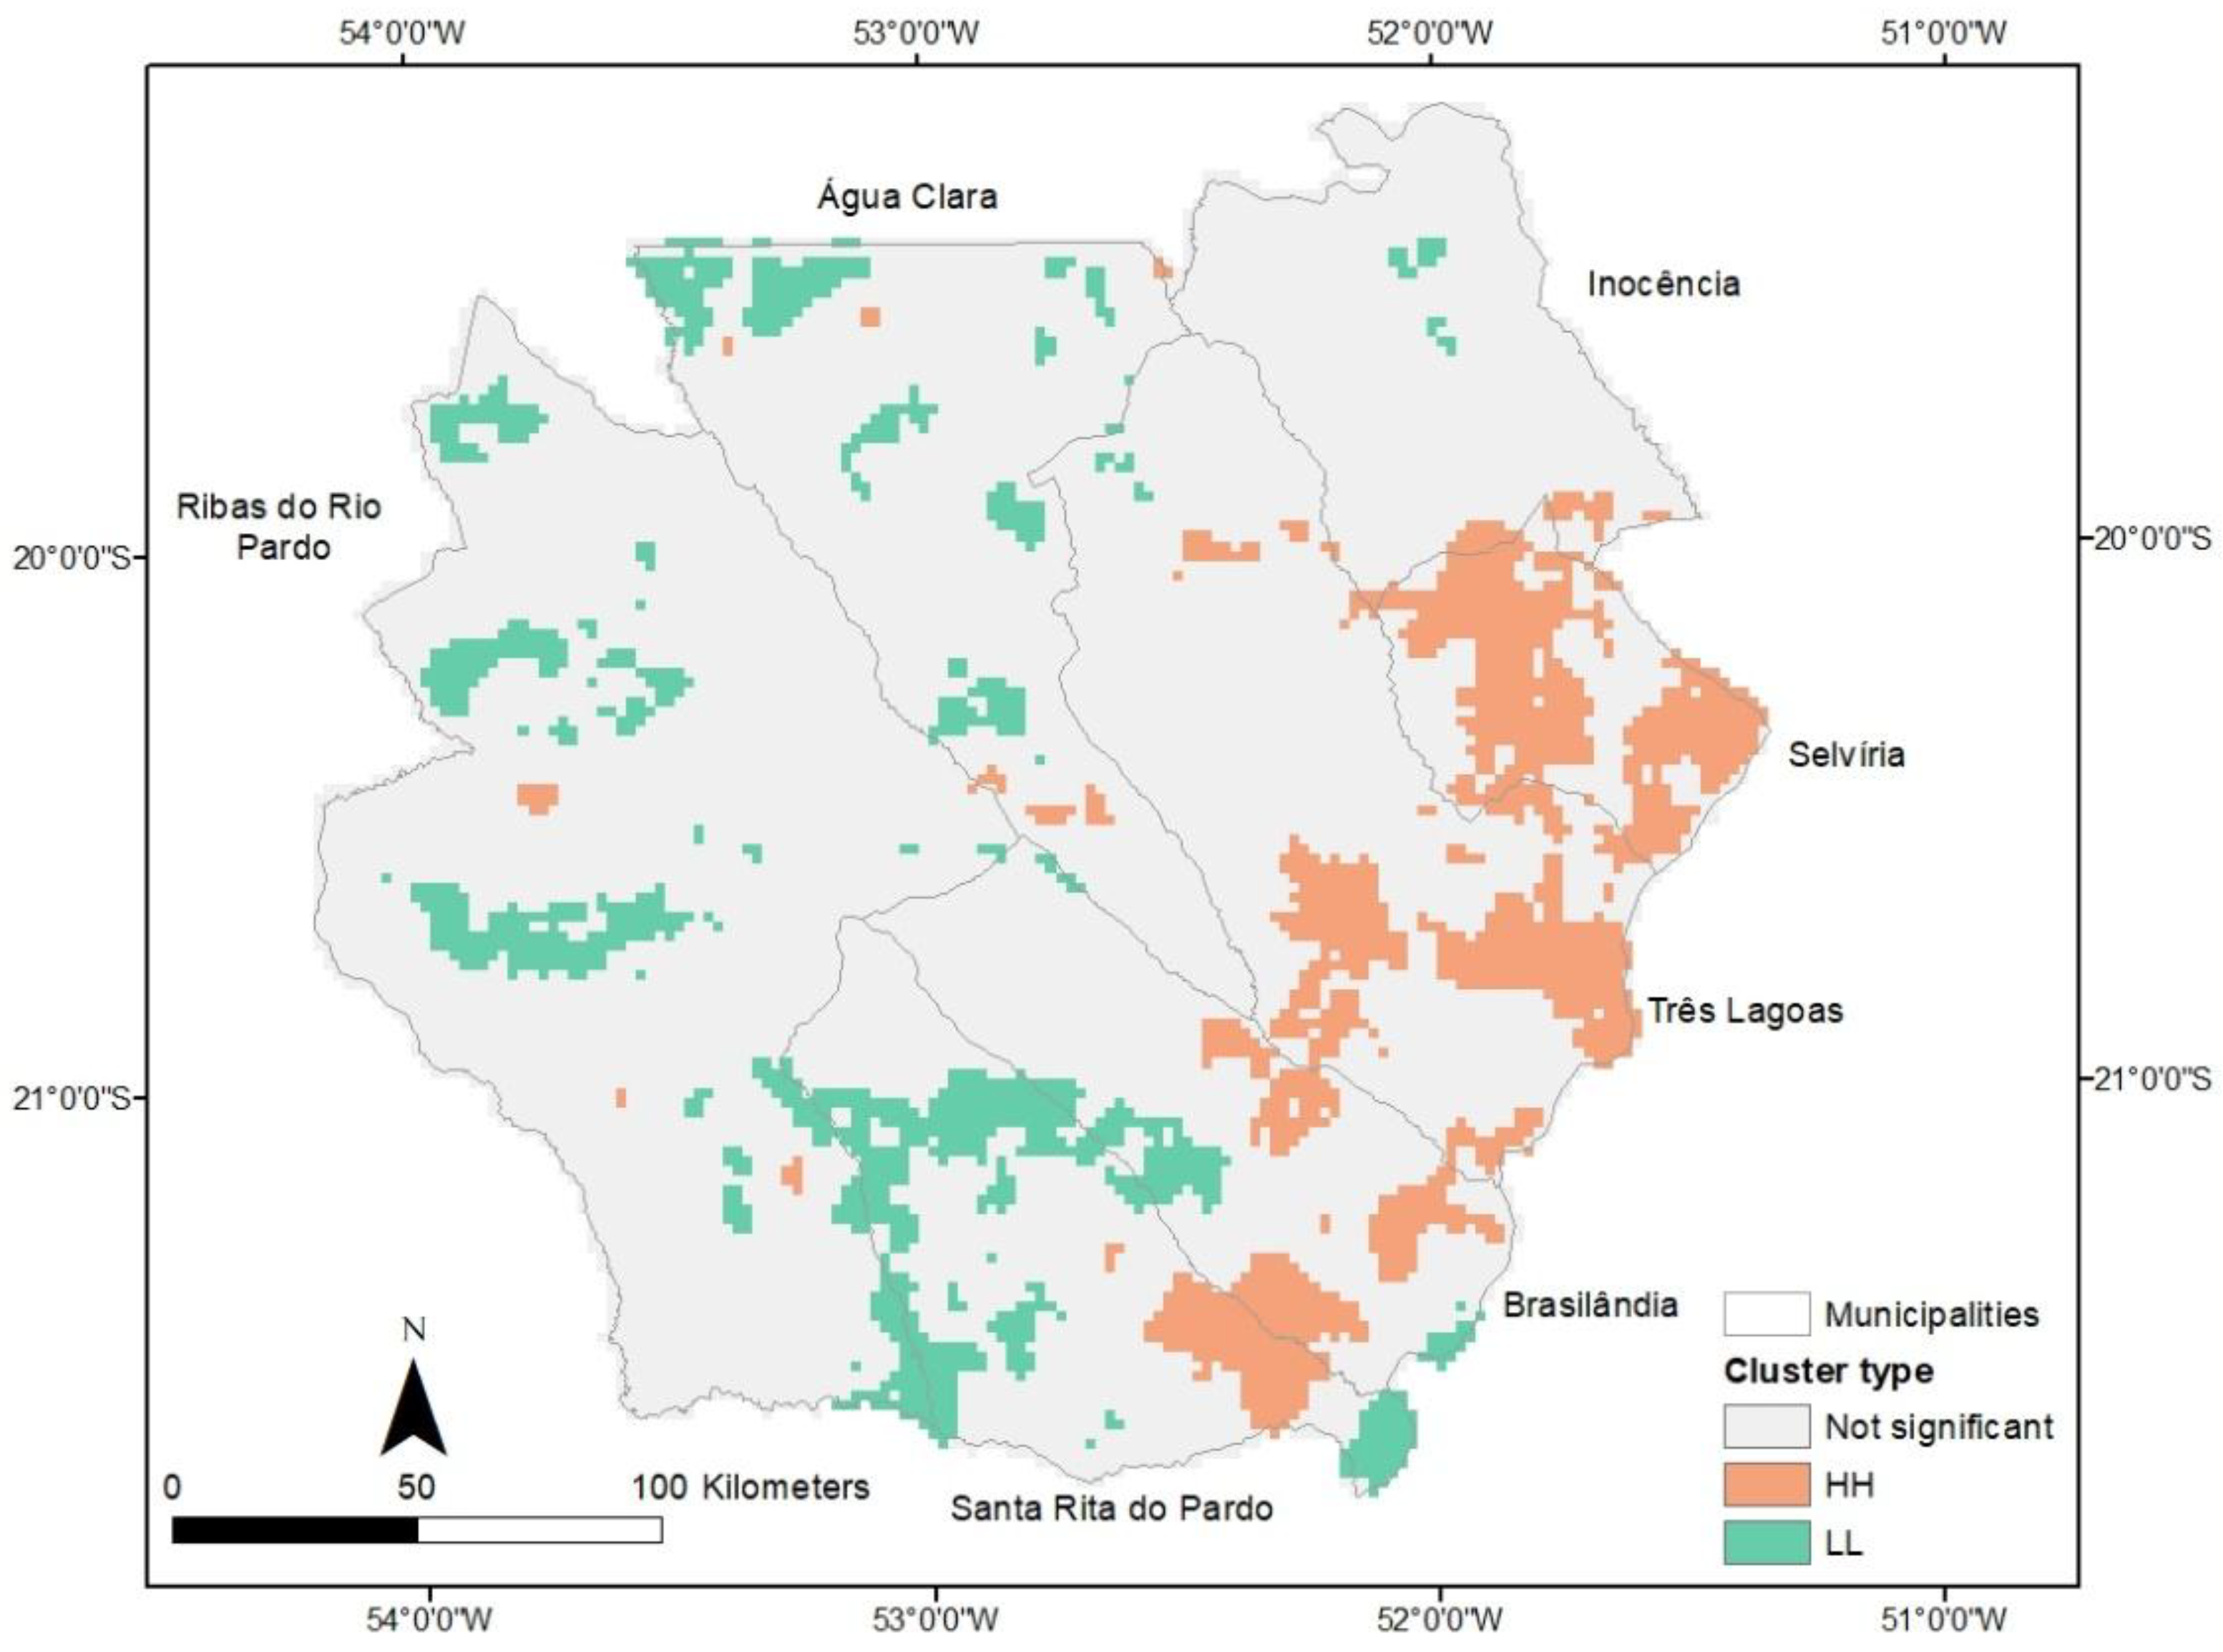
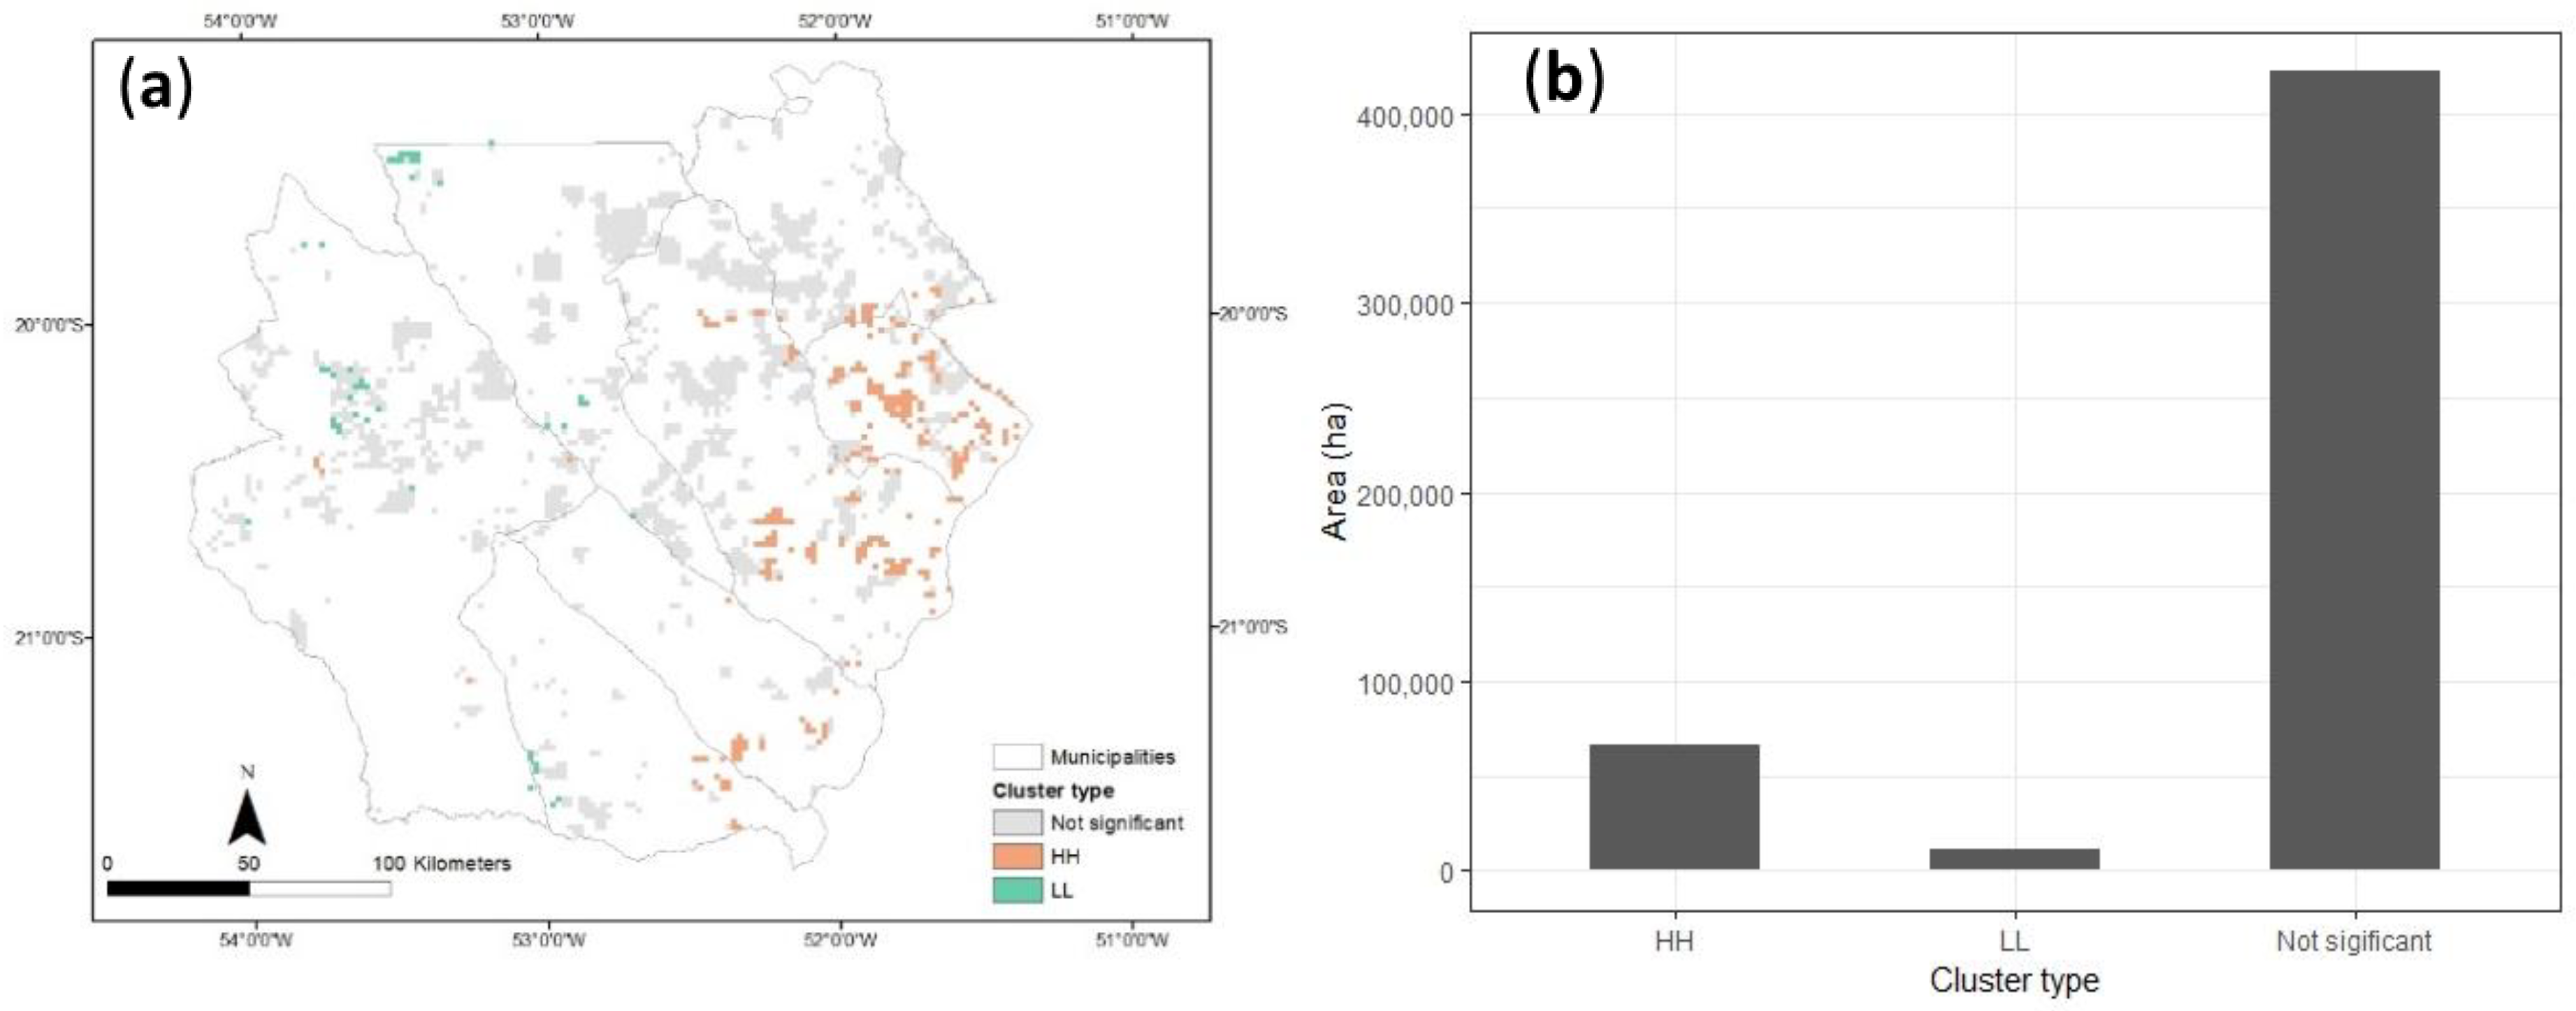
2.6. Spatial Analysis of the Ignition Probability Patterns
3. Results
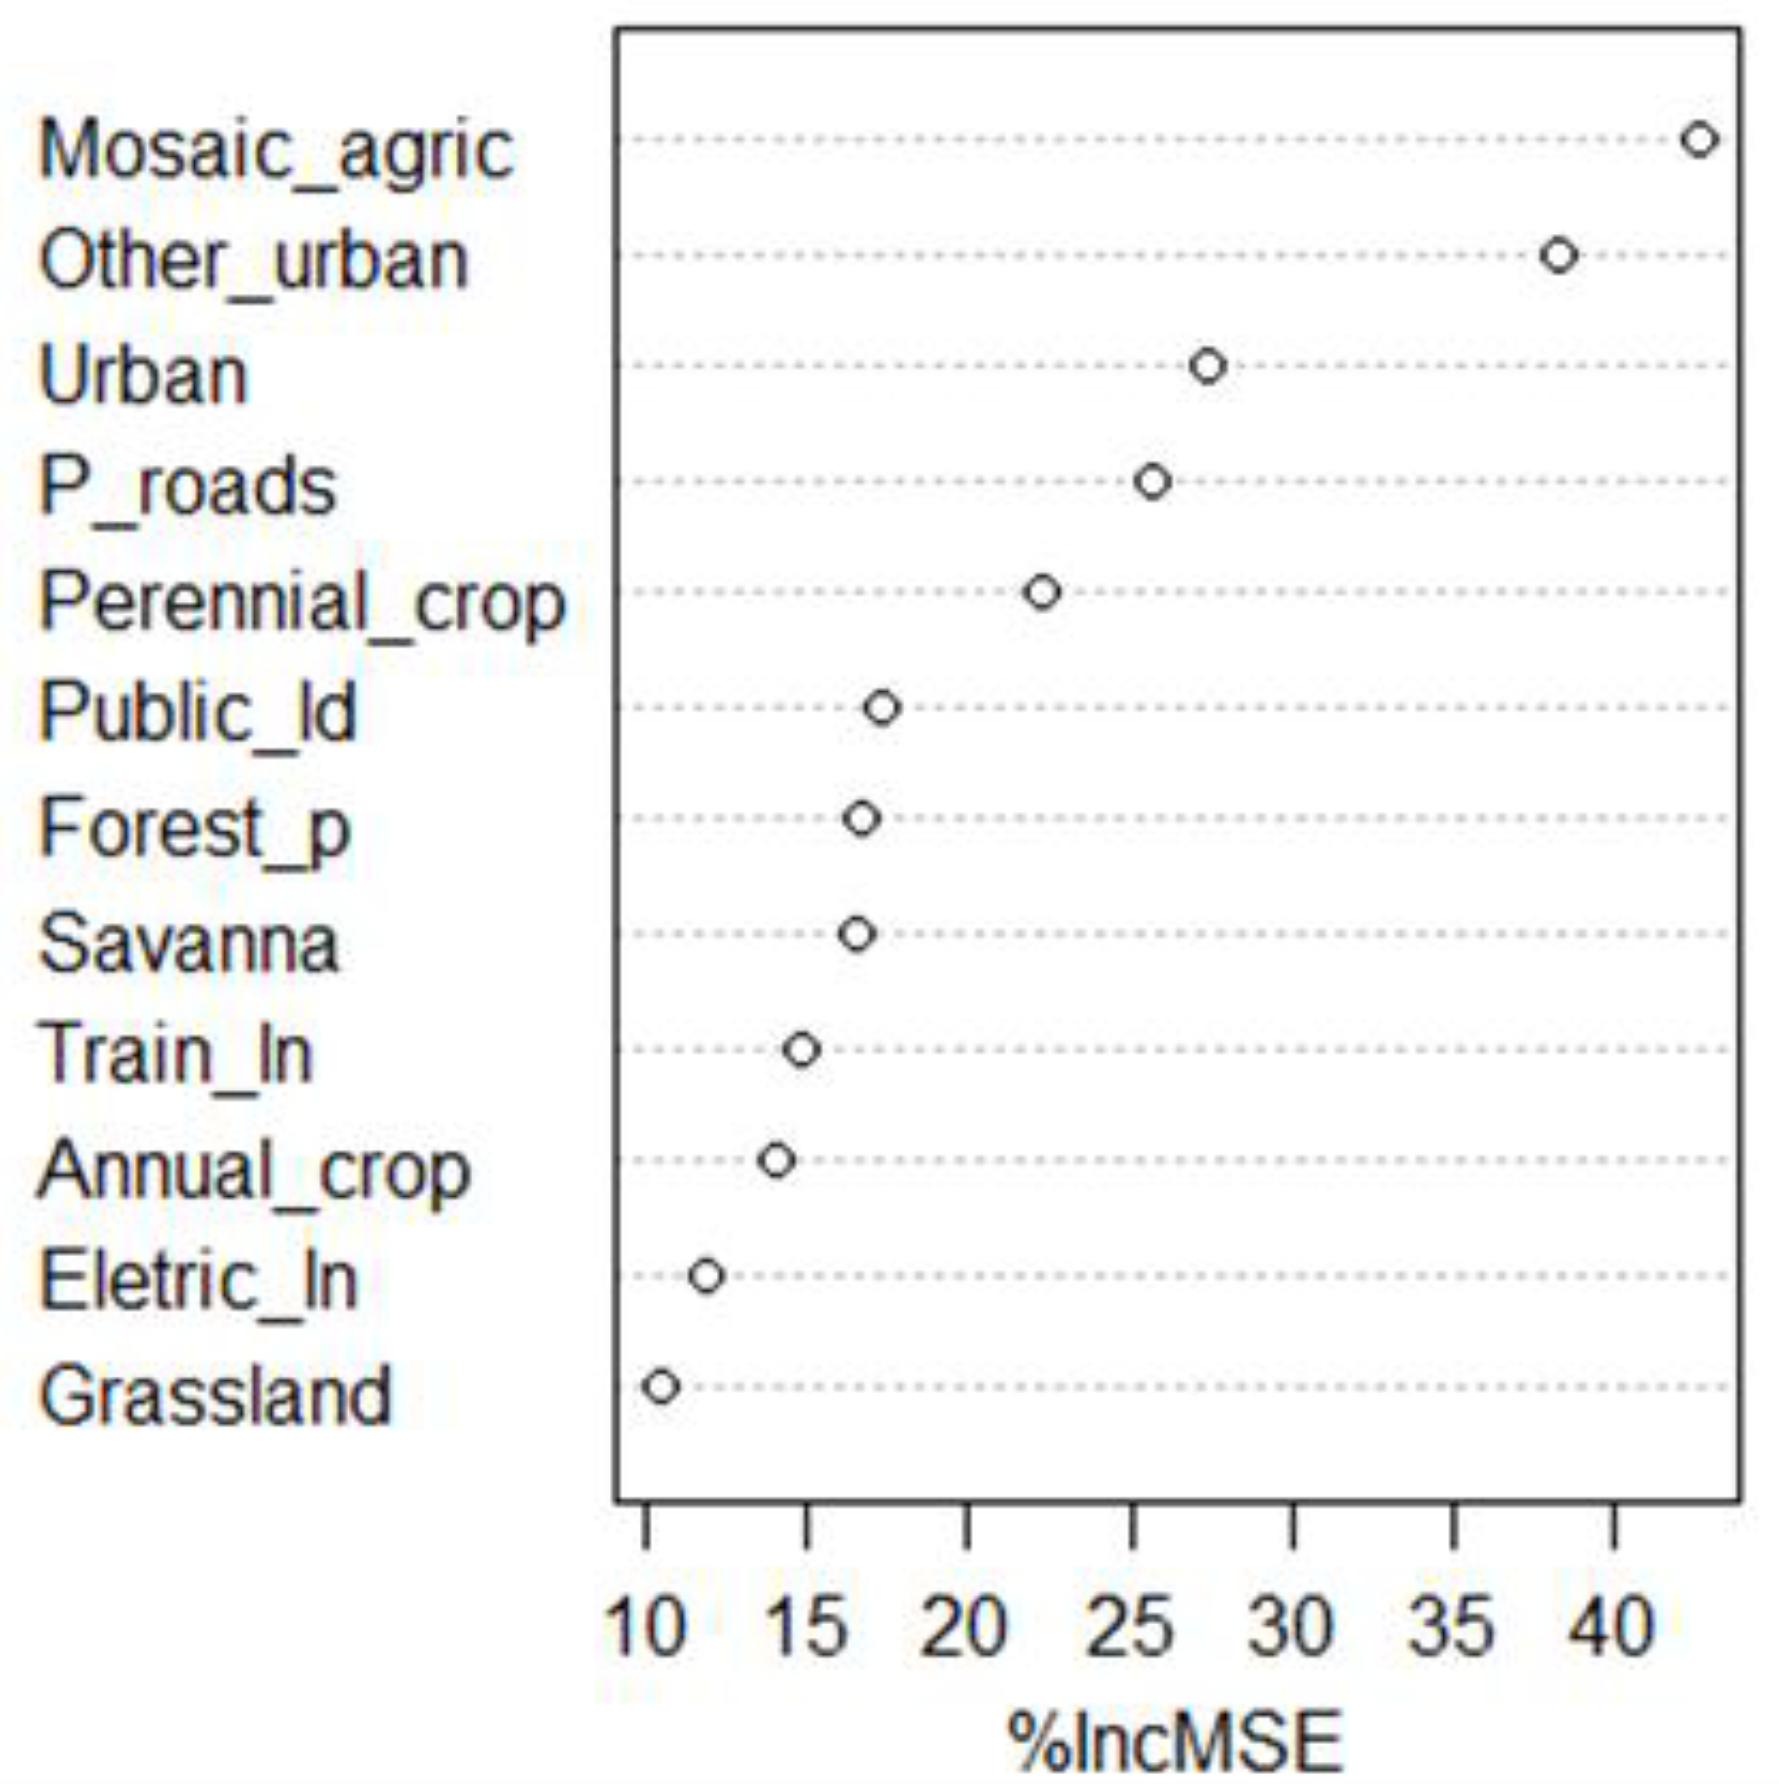
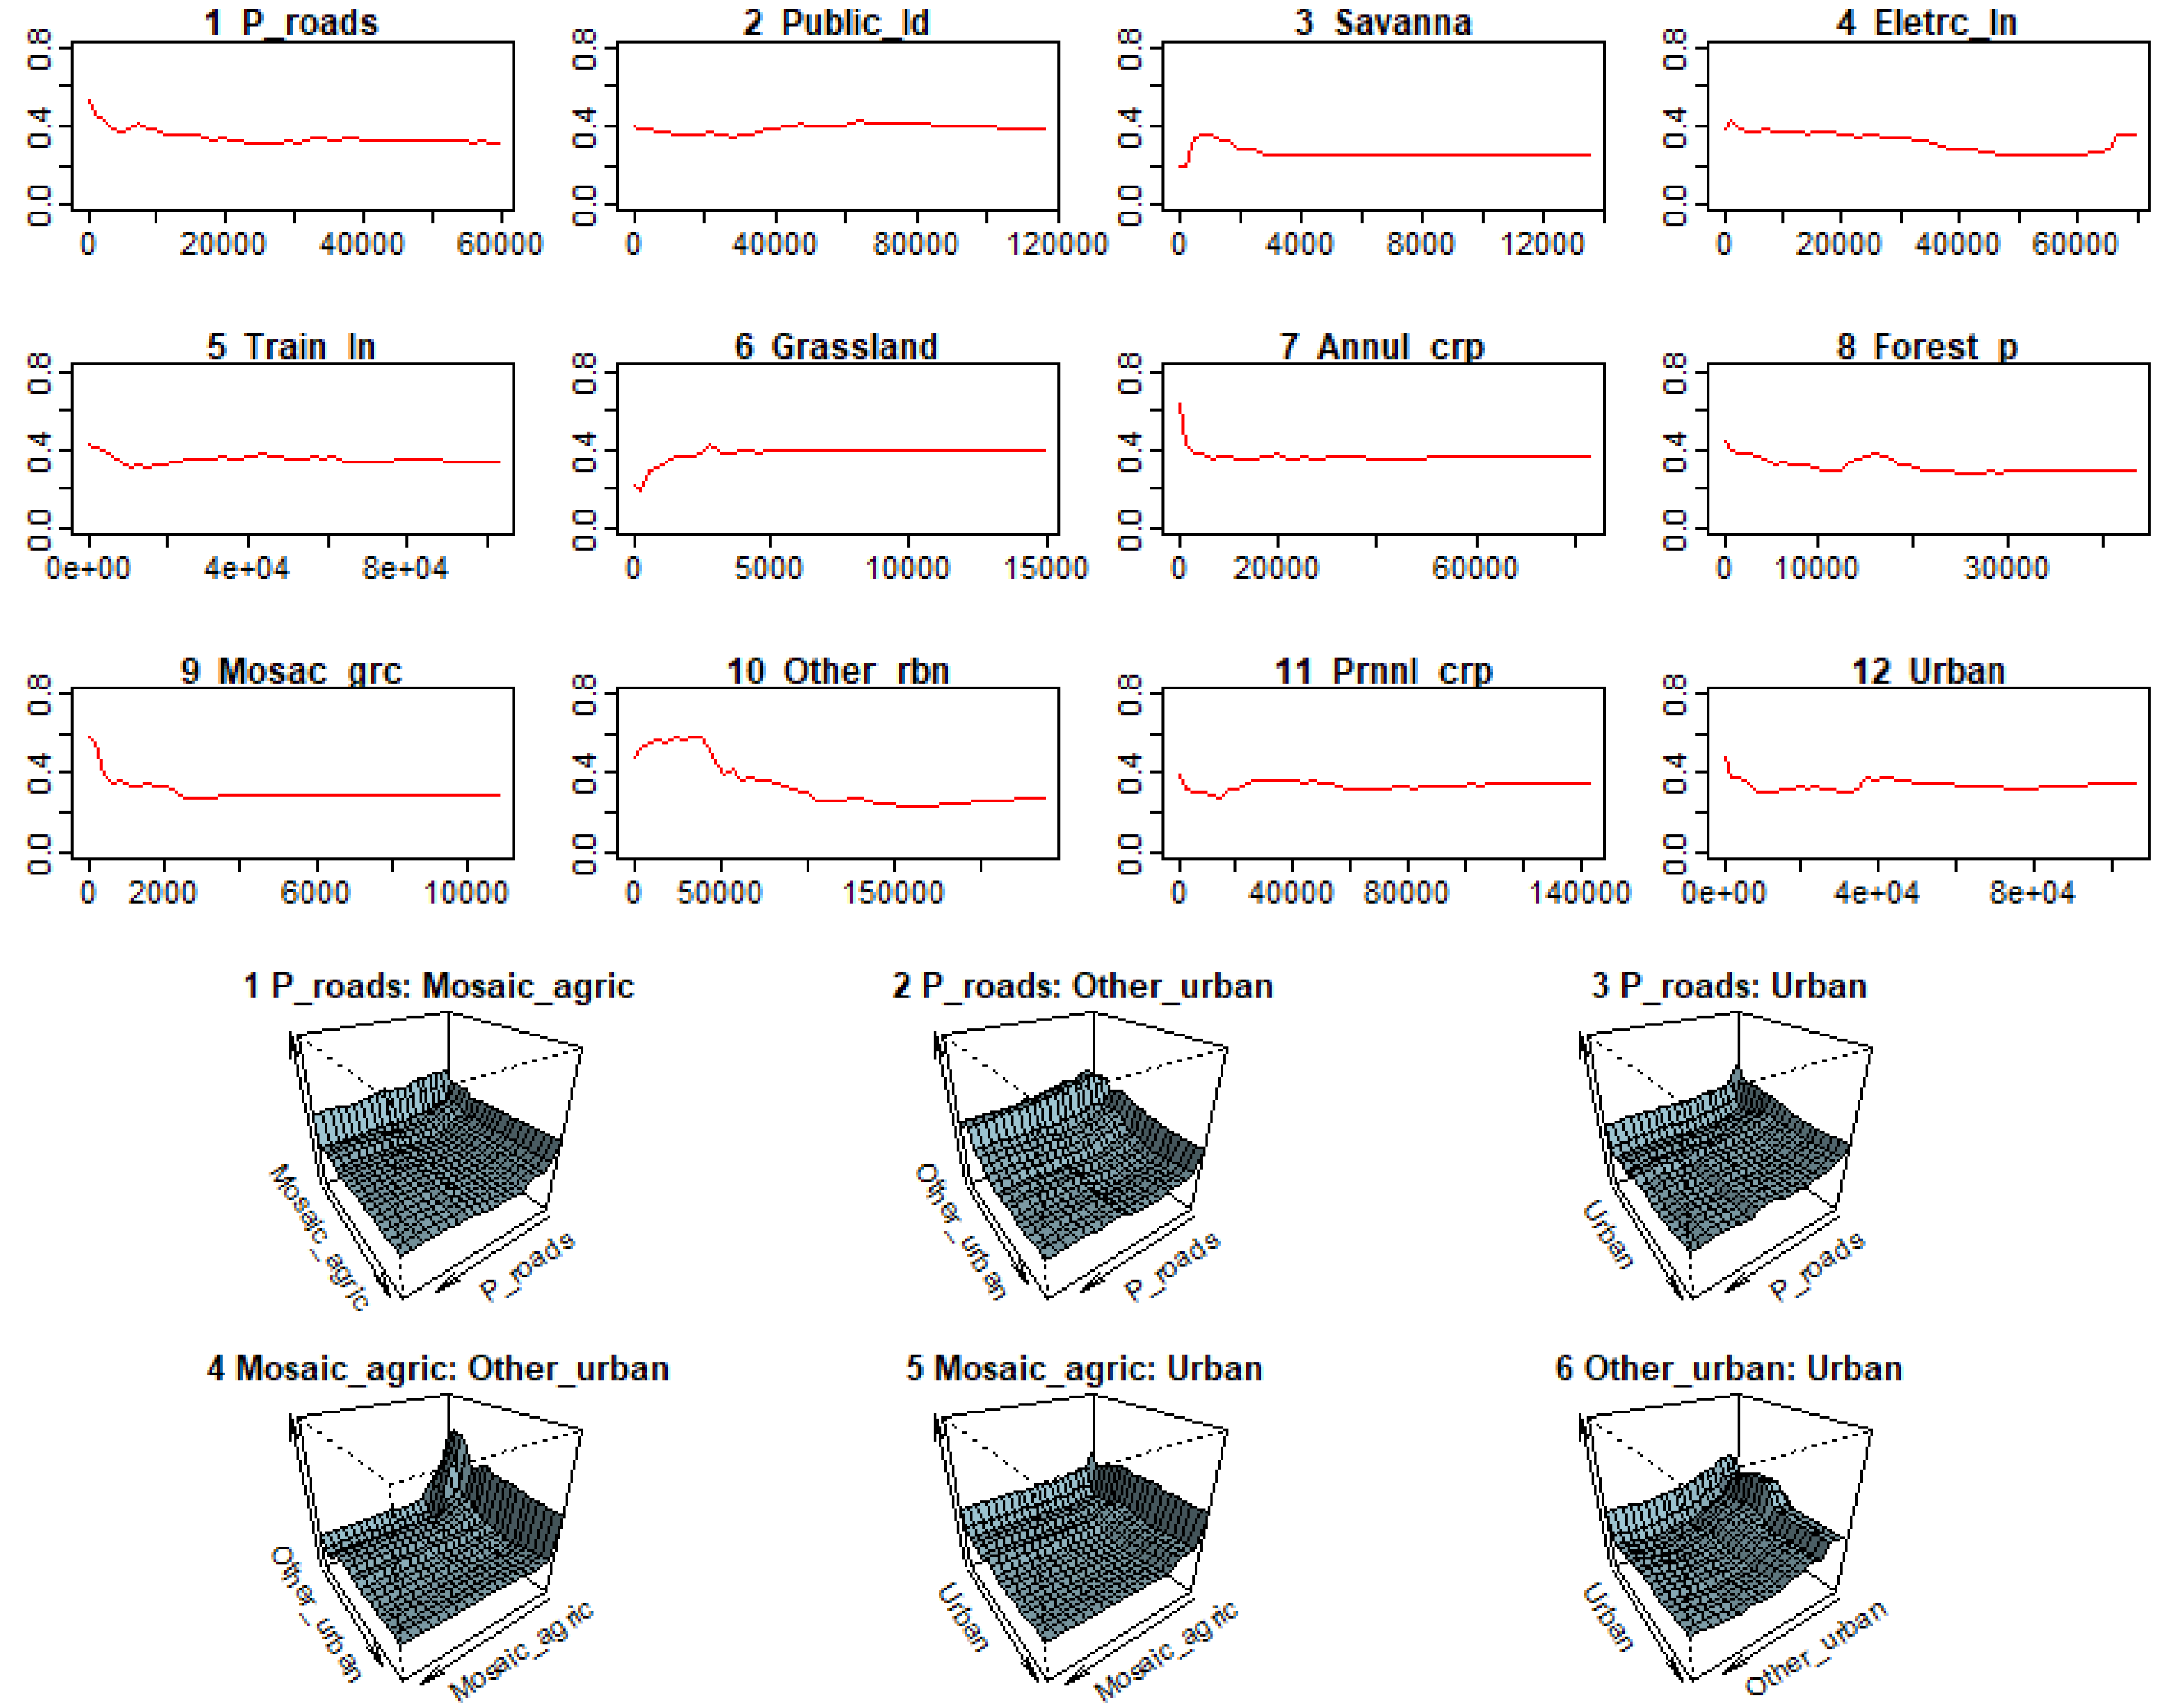
3.1. Model Performance and Variable Importance
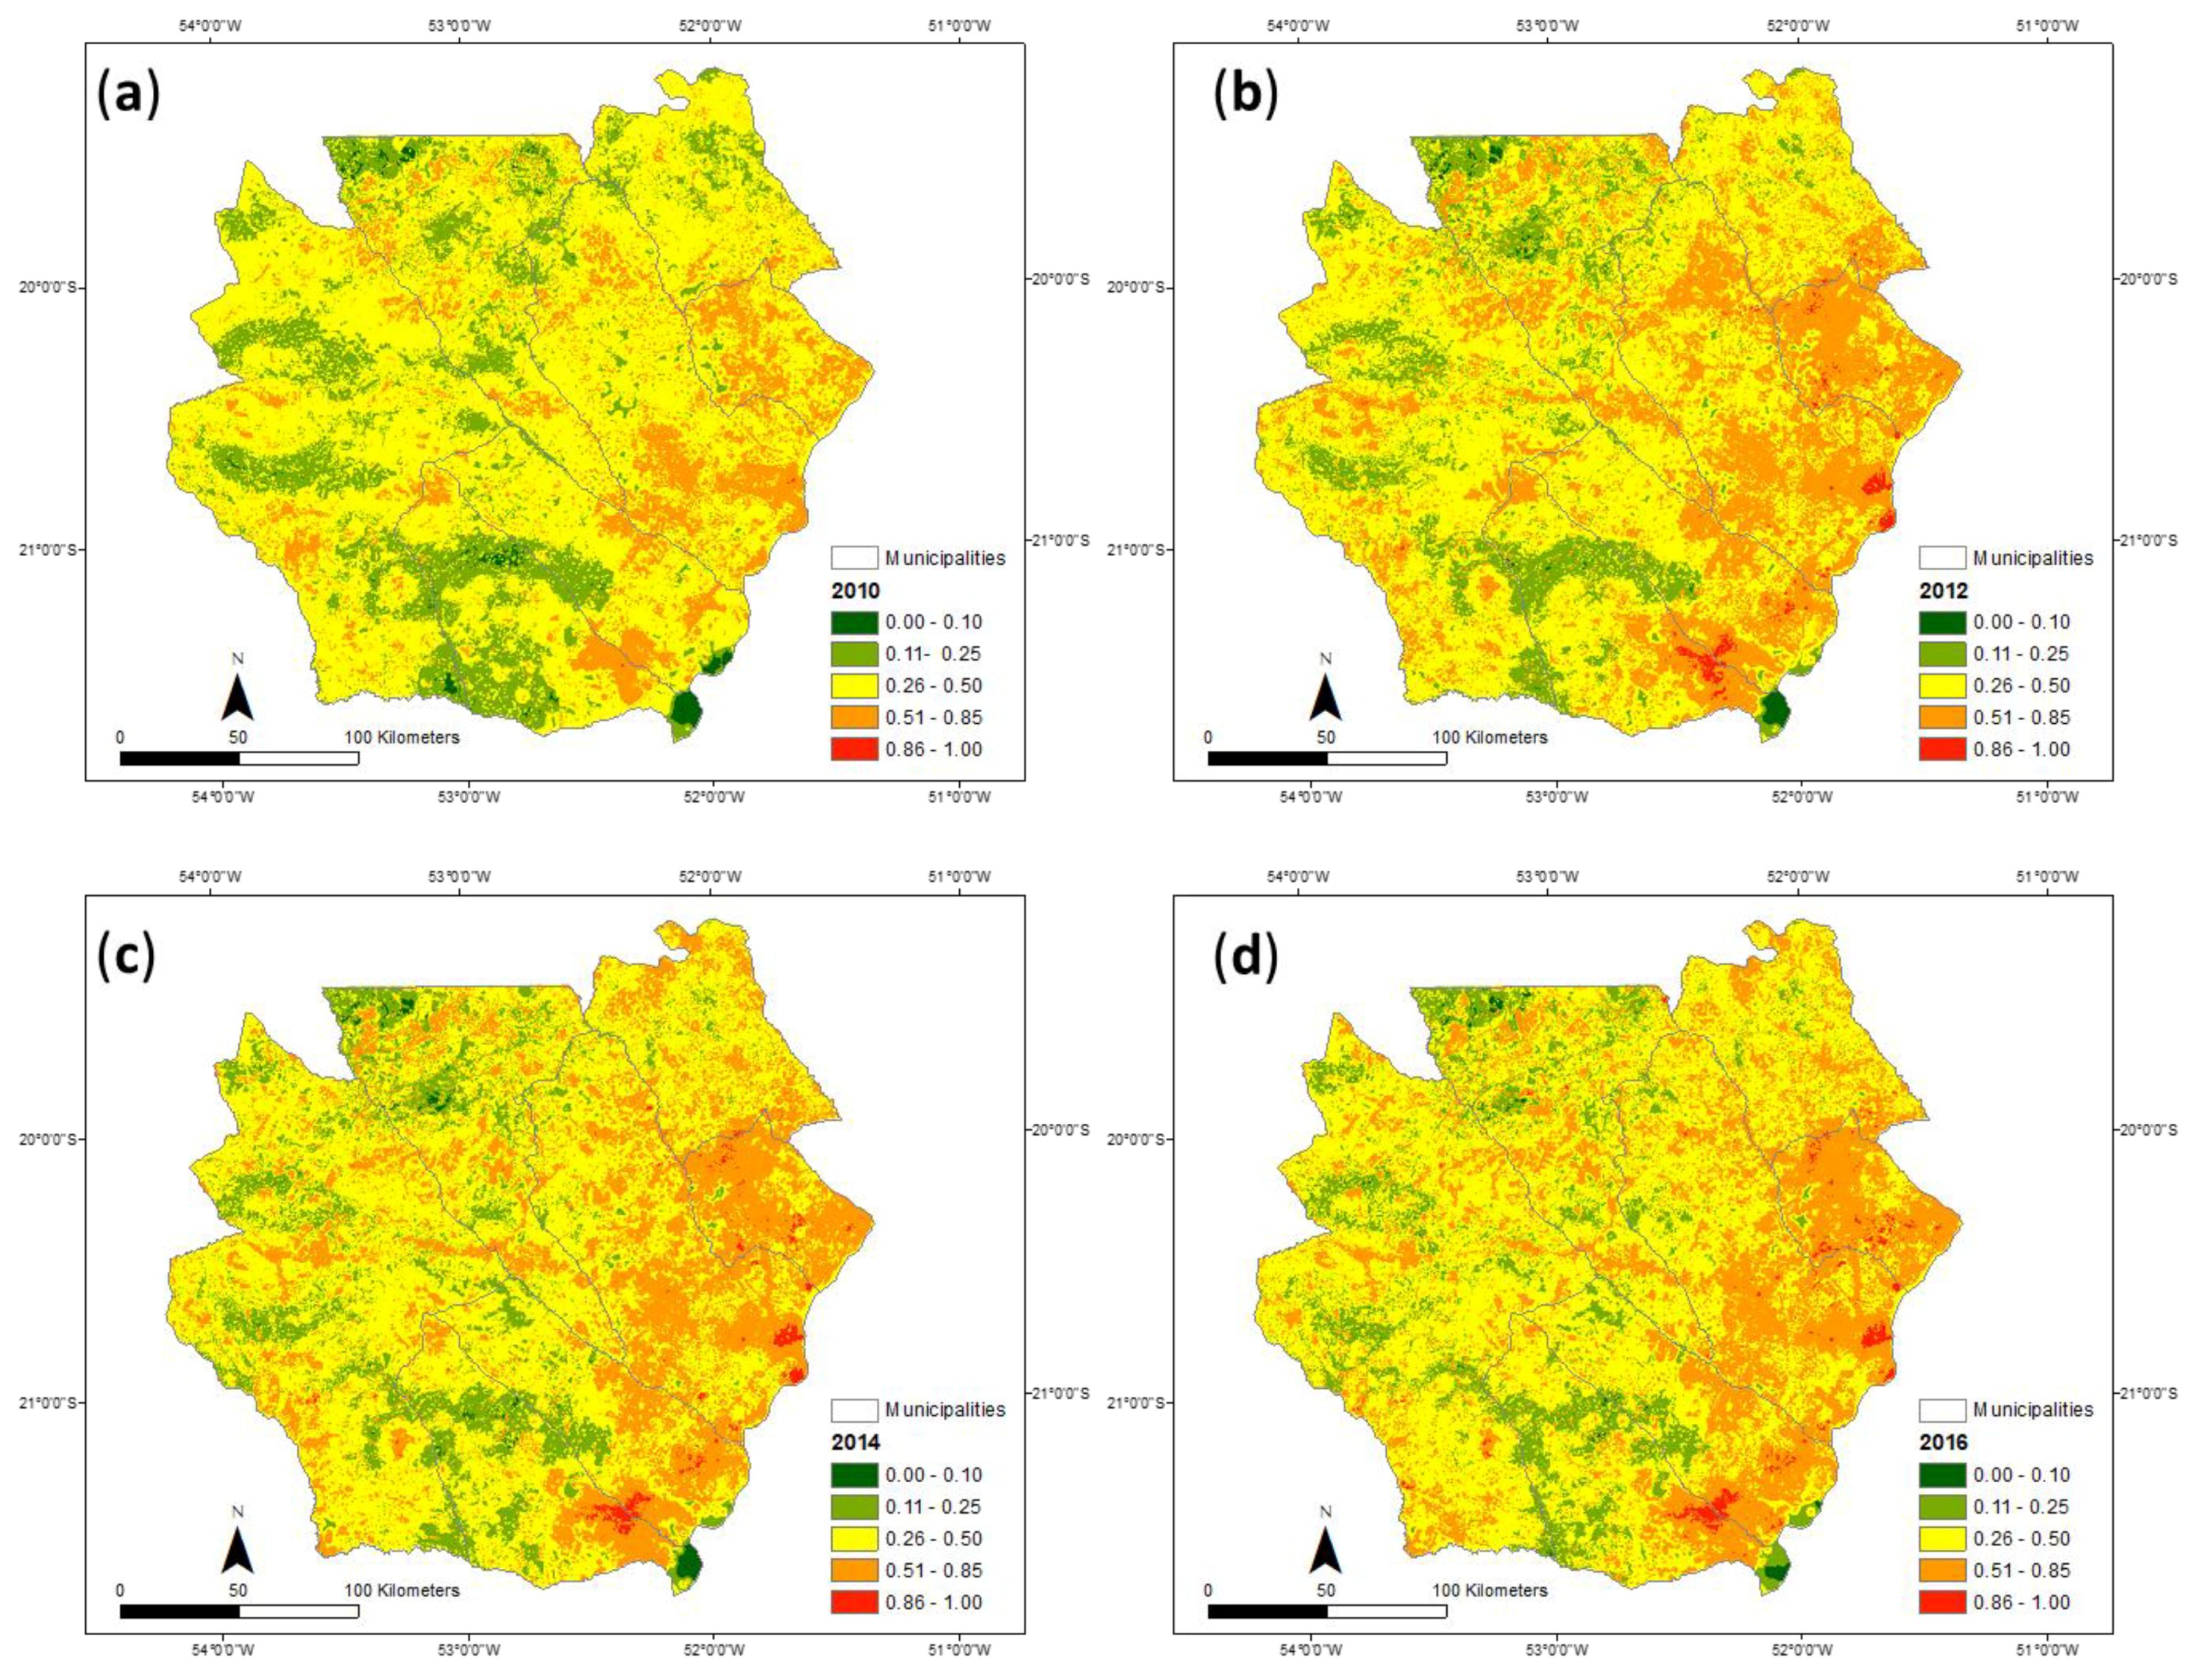
3.2. Spatial Distribution of Occurrence Probability
4. Discussion
5. Conclusions
Supplementary Materials
Author Contributions
Funding
Acknowledgments
Conflicts of Interest
References
- Payn, T.; Carnus, J.M.; Freer-Smith, P.; Kimberley, M.; Kollert, W.; Liu, S.; Orazio, C.; Rodriguez, L.; Silva, L.N.; Wingfield, M.J. Changes in planted forests and future global implications. For. Ecol. Manag. 2015, 352, 57–67. [Google Scholar] [CrossRef]
- Binkley, D.; Campoe, O.C.; Alvares, C.; Carneiro, R.L.; Cegatta, Í.; Stape, J.L. The interactions of climate, spacing and genetics on clonal Eucalyptus plantations across Brazil and Uruguay. For. Ecol. Manag. 2017, 405, 271–283. [Google Scholar] [CrossRef]
- de Moraes Gonçalves, J.L.; Alvares, C.A.; Higa, A.R.; Silva, L.D.; Alfenas, A.C.; Stahl, J.; de Barros Ferraz, S.F.; de Paula Lima, W.; Brancalion, P.H.S.; Hubner, A.; et al. Integrating genetic and silvicultural strategies to minimize abiotic and biotic constraints in Brazilian eucalypt plantations. For. Ecol. Manag. 2013, 301, 6–27. [Google Scholar] [CrossRef]
- IBÁ—Indústria Brasileira de Árvores. Summary for Policymakers; IBÁ: Brasília, Brazil, 2017. [Google Scholar]
- Project MapBiomas Collection 3.1 of Brazilian Land Cover & Use Map Series. Available online: http://mapbiomas.org/map#coverage (accessed on 22 January 2019).
- Mistry, J. Fire in the cerrado (savannas) of Brazil: An ecological review. Prog. Phys. Geogr. 2002, 22, 425–448. [Google Scholar] [CrossRef]
- Franco, A.C.; Rossatto, D.R.; de Carvalho Ramos Silva, L.; da Silva Ferreira, C. Cerrado vegetation and global change: The role of functional types, resource availability and disturbance in regulating plant community responses to rising CO2 levels and climate warming. Theor. Exp. Plant Physiol. 2014, 26, 19–38. [Google Scholar] [CrossRef]
- Bowman, D.M.J.S.; Bowman, D.M.J.S.; Balch, J.K.; Artaxo, P.; Bond, W.J.; Carlson, J.M.; Cochrane, M.A.; Antonio, C.M.D.; Defries, R.S.; Doyle, J.C.; et al. Fire in the Earth System. Science 2009, 481, 481–484. [Google Scholar] [CrossRef] [PubMed]
- Pausas, J.G.; Ribeiro, E. The global fire-Productivity relationship. Glob. Ecol. Biogeogr. 2013, 22, 728–736. [Google Scholar] [CrossRef]
- Grecchi, R.C.; Gwyn, Q.H.J.; Bénié, G.B.; Formaggio, A.R.; Fahl, F.C. Land use and land cover changes in the Brazilian Cerrado: A multidisciplinary approach to assess the impacts of agricultural expansion. Appl. Geogr. 2014, 55, 300–312. [Google Scholar] [CrossRef]
- Lapola, D.M.; Martinelli, L.A.; Peres, C.A.; Ometto, J.P.H.B.; Ferreira, M.E.; Nobre, C.A.; Aguiar, A.P.D.; Bustamante, M.M.C.; Cardoso, M.F.; Costa, M.H.; et al. Pervasive transition of the Brazilian land-Use system. Nat. Clim. Chang. 2014, 4, 27–35. [Google Scholar] [CrossRef]
- Merrill, D.F.; Alexander, M.E. Glossary of Forest Fire Management Terms; National Research Council of Canada: Ottawa, Canada, 1987. [Google Scholar]
- Klink, C.A.; Moreira, A.G.; Solbrig, O.T. Ecological impacts of agricultural development in the Brazilian Cerrados. In The World’s Savannas: Economic Driving Forces, Ecological Constraints and Policy Options for Sustainable Land Use Man in the Biosphere Series 12; Young, M.D., Solbrig, O.T., Eds.; Parthenon Publishing: London, UK, 1993. [Google Scholar]
- Eva, H.; Lambin, E.F. Fires and land-Cover change in the tropics: A remote sensing analysis at the landscape scale. J. Biogeogr. 2000, 27, 765–776. [Google Scholar] [CrossRef]
- Bar Massada, A.; Radeloff, V.C.; Stewart, S.I.; Hawbaker, T.J. Wildfire risk in the wildland-Urban interface: A simulation study in northwestern Wisconsin. For. Ecol. Manag. 2009, 258, 1990–1999. [Google Scholar] [CrossRef]
- Costafreda-Aumedes, S.; Comas, C.; Vega-Garcia, C. Human-Caused fire occurrence modelling in perspective: A review. Int. J. Wildland Fire 2017, 26, 983. [Google Scholar] [CrossRef]
- De Bem, P.P.; De Carvalho, O.A.; Matricardi, E.A.T.; Guimarães, R.F.; Gomes, R.A.T. Predicting wildfire vulnerability using logistic regression and artificial neural networks: A case study in Brazil’s Federal District. Int. J. Wildland Fire 2019, 28, 35–45. [Google Scholar] [CrossRef]
- Booth, T.H. Eucalypt plantations and climate change. For. Ecol. Manag. 2013, 301, 28–34. [Google Scholar] [CrossRef]
- Matthews, S.; Sullivan, A.L.; Watson, P.; Williams, R.J. Climate change, fuel and fire behaviour in a eucalypt forest. Glob. Chang. Biol. 2012, 18, 3212–3223. [Google Scholar] [CrossRef] [PubMed]
- White, B.L.A.; White, L.A.S.; Ribeiro, G.T.; Souza, R.M. Modelos matemáticos empíricos para descrever o comportamento do fogo em plantações comerciais de eucalipto no Brasil. Cerne 2016, 22, 397–406. [Google Scholar] [CrossRef][Green Version]
- Diaz-Balteiro, L.; Rodriguez, L.C.E. Optimal rotations on Eucalyptus plantations including carbon sequestration—A comparison of results in Brazil and Spain. For. Ecol. Manag. 2006, 229, 247–258. [Google Scholar] [CrossRef]
- Santos, J.F.; Soares, R.V.; Batista, A.C. Perfil Dos Incêndios Florestais No Brasil Em Áreas Protegidas No Período De 1998 a 2002. Floresta 2014, 36, 93–100. [Google Scholar] [CrossRef]
- Augusto, G.; Mataveli, V.; Elisa, M.; Silva, S.; Pereira, G.; Cardozo, S.; Kawakubo, F.S.; Bertani, G.; Costa, J.C.; Ramos, R.D.C.; et al. Satellite observations for describing fire patterns and climate-related fire drivers in the Brazilian savannas. Nat. Hazards Earth Syst. Sci. 2018, 18, 125–144. [Google Scholar]
- Finney, M.A. The challenge of quantitative risk analysis for wildland fire. For. Ecol. Manag. 2005, 211, 97–108. [Google Scholar] [CrossRef]
- Chuvieco, E.; Aguado, I.; Jurdao, S.; Pettinari, M.L.; Yebra, M.; Salas, J.; Hantson, S.; De La Riva, J.; Ibarra, P.; Rodrigues, M.; et al. Integrating geospatial information into fire risk assessment. Int. J. Wildland Fire 2014, 23, 606–619. [Google Scholar] [CrossRef]
- Thompson, M.P.; Calkin, D.E. Uncertainty and risk in wildland fire management: A review. J. Environ. Manag. 2011, 92, 1895–1909. [Google Scholar] [CrossRef] [PubMed]
- Donoghue, L.R.; Main, W.A. Some factors influencing wildfire occurrence and measurement of fire prevention effectiveness. J. Environ. Manag. 1985, 20, 87–96. [Google Scholar]
- Martell, D.L.; Otukol, S.; Stocks, B.J. A logistic model for predicting daily people-Caused forest fire occurrence in Ontario. Can. J. For. Res. 1987, 17, 394–401. [Google Scholar] [CrossRef]
- Crosby, J.S. Probability of Fire Occurrence Can Be Predicted; Central States Forest Experiment Station, U.S. Dept. of Agriculture, Forest Service: Columbus, OH, USA, 1954. [Google Scholar]
- Haines, D.A.; Main, W.A.; Johnson, V.J. Relation between the U.S. National Fire Danger Rating System Spread Component and Fire Activity in the lake States. Res. Pap. 1970, 1, 8. [Google Scholar]
- Chang, Y.; Zhu, Z.; Bu, R.; Chen, H.; Feng, Y.; Li, Y.; Hu, Y.; Wang, Z. Predicting fire occurrence patterns with logistic regression in Heilongjiang Province, China. Landsc. Ecol. 2013, 28, 1989–2004. [Google Scholar] [CrossRef]
- Gabriel, E.; Opitz, T.; Bonneu, F. Detecting and modeling multi-Scale space-Time structures: The case of wildfire occurrences. J. Fr. Stat. Soc. 2017, 158, 86–105. [Google Scholar]
- Fuentes-Santos, I.; Marey-Pérez, M.F.; González-Manteiga, W. Forest fire spatial pattern analysis in Galicia (NW Spain). J. Environ. Manag. 2013, 128, 30–42. [Google Scholar] [CrossRef]
- Yang, J.; He, H.S.; Shifley, S.R.; Gustafson, E.J. Spatial Patterns of Modern Period Human-Caused Fire Occurrence in the Missouri Ozark Highlands. For. Sci. 2007, 53, 1–15. [Google Scholar]
- Hering, A.S.; Bell, C.L.; Genton, M.G. Modeling spatio-Temporal wildfire ignition point patterns. Environ. Ecol. Stat. 2009, 16, 225–250. [Google Scholar] [CrossRef]
- Juárez, I.; Mira-McWilliams, J.; González, C. Important variable assessment and electricity price forecasting based on regression tree models: Classification and regression trees, Bagging and Random Forests. IET Gener. Transm. Distrib. 2015, 9, 1120–1128. [Google Scholar]
- Rodrigues, M.; De la Riva, J. An insight into machine-Learning algorithms to model human-Caused wildfire occurrence. Environ. Model. Softw. 2014, 57, 192–201. [Google Scholar] [CrossRef]
- Rodrigues, M.; Riva, J.D.L. Assessing the effect on fire risk modeling of the uncertainty in the location and cause of forest fires. In Advances in Forest Fire Research; Imprensa da Universidade de Coimbra: Coimbra, Portugal, 2014; pp. 1061–1072. [Google Scholar]
- Guo, F.; Wang, G.; Su, Z.; Liang, H.; Wang, W.; Lin, F.; Liu, A. What drives forest fire in Fujian, China? Evidence from logistic regression and Random Forests. Int. J. Wildland Fire 2016, 25, 505–519. [Google Scholar] [CrossRef]
- Oliveira, S.; Oehler, F.; San-Miguel-Ayanz, J.; Camia, A.; Pereira, J.M.C. Modeling spatial patterns of fire occurrence in Mediterranean Europe using Multiple Regression and Random Forest. For. Ecol. Manag. 2012, 275, 117–129. [Google Scholar] [CrossRef]
- Langner, A.; Miettinen, J.; Siegert, F. Land cover change 2002–2005 in Borneo and the role of fire derived from MODIS imagery. Glob. Chang. Biol. 2007, 13, 2329–2340. [Google Scholar] [CrossRef]
- Jepson, W. A disappearing biome? Reconsidering land-Cover change in the Brazilian savanna. Geogr. J. 2005, 171, 99–111. [Google Scholar] [CrossRef]
- Alvares, C.A.; Stape, J.L.; Sentelhas, P.C.; De Moraes Gonçalves, J.L.; Sparovek, G. Köppen’s climate classification map for Brazil. Meteorol. Z. 2013, 22, 711–728. [Google Scholar] [CrossRef]
- Miranda, E.E.d. Brasil em relevo. Available online: http://www.relevobr.cnpm.embrapa.br (accessed on 12 January 2019).
- IBGE. Censo agropecuário 2006; IBGE: Rio de Janeiro, Brazil, 2006. [Google Scholar]
- Moreira, F.; Viedma, O.; Arianoutsou, M.; Curt, T.; Koutsias, N.; Rigolot, E.; Barbati, A.; Corona, P.; Vaz, P.; Xanthopoulos, G.; et al. Landscape—Wildfire interactions in southern Europe: Implications for landscape management. J. Environ. Manag. 2011, 92, 2389–2402. [Google Scholar] [CrossRef]
- Brazilian Institute of Geography and Statistics. Demographic Census 2010: Urban Characteristics of the Surroundings of the Households; IBGE: Brasilia, Brazil, 2012. [Google Scholar]
- Reineking, B.; Weibel, P.; Conedera, M.; Bugmann, H. Environmental determinants of lightning-V. human-Induced forest fire ignitions differ in a temperate mountain region of Switzerland. Int. J. Wildland Fire 2010, 19, 541–557. [Google Scholar] [CrossRef]
- Pan, J.; Wang, W.; Li, J. Building probabilistic models of fire occurrence and fire risk zoning using logistic regression in Shanxi Province, China. Nat. Hazards 2016, 81, 1879–1899. [Google Scholar] [CrossRef]
- Morisette, J.T.; Giglio, L.; Csiszar, I.; Setzer, A.; Schroeder, W.; Morton, D.; Justice, C.O. Validation of MODIS active fire detection products derived from two algorithms. Earth Interact. 2005, 9, 1–25. [Google Scholar] [CrossRef]
- Chuvieco, E.; Kasischke, E.S. Remote sensing information for fire management and fire effects assessment. J. Geophys. Res. Biogeosci. 2007, 112, 1–8. [Google Scholar] [CrossRef]
- INPE Wildfires Monitoring Portal. Available online: http://www.inpe.br/queimadas (accessed on 22 January 2019).
- dos Santos, J.F.C.; Romeiro, J.M.N.; de Assis, J.B.; Torres, F.T.P.; Gleriani, J.M. Potentials and limitations of remote fire monitoring in protected areas. Sci. Total Environ. 2018, 616, 1347–1355. [Google Scholar] [CrossRef] [PubMed]
- Pereira, A.A.; Pereira, J.A.A.; Morelli, F.; Barros, D.A.; Acerbi, F.W.; Scolforo, J.R.S. Validaçã de focos de calor utilizados no monitoramento orbital de queimadas por meio de imagens TM. Cerne 2012, 18, 335–343. [Google Scholar] [CrossRef]
- Garcia, C.V.; Woodard, P.M.; Titus, S.J.; Adamowicz, W.L.; Lee, B.S. A logit model for predicting the daily occurrence of human caused forest fires. Int. J. Wildland Fire 1995, 5, 101–111. [Google Scholar] [CrossRef]
- San-Miguel-Ayanz, J.; Schulte, E.; Schmuck, G.; Camia, A. The European Forest Fire Information System in the context of environmental policies of the European Union. For. Policy Econ. 2013, 29, 19–25. [Google Scholar] [CrossRef]
- Coutinho, L.M. Fire in the Ecology of the Brazilian Cerrado. In Fire in the Tropical Biota; Springer: Heidelberg, Germany, 1990; pp. 82–105. [Google Scholar]
- Mistry, J.; Berardi, A. Assessing fire potential in a Brazilian savanna nature reserve. Biotropica 2005, 37, 439–451. [Google Scholar] [CrossRef]
- Soares, R.V. Ocorrência de incêndios em povoamentos florestais. Floresta 1992, 22, 39–53. [Google Scholar] [CrossRef]
- Vasconcelos, M.J.; Silva, S.; Tomé, M.; Alvim, M.; Pereira, J.M.C. Spatial Prediction of Fire Ignition Probabilities: Comparing Logistic Regression and Neural Networks. Photogramm. Eng. Remote Sens. 2001, 67, 73–81. [Google Scholar]
- Chuvieco, E.; Aguado, I.; Yebra, M.; Nieto, H.; Salas, J.; Martín, M.P.; Vilar, L.; Martínez, J.; Martín, S.; Ibarra, P.; et al. Development of a framework for fire risk assessment using remote sensing and geographic information system technologies. Ecol. Modell. 2010, 221, 46–58. [Google Scholar] [CrossRef]
- Rodrigues, M.; de la Riva, J.; Fotheringham, S. Modeling the spatial variation of the explanatory factors of human-Caused wildfires in Spain using geographically weightedlogistic regression. Appl. Geogr. 2014, 48, 52–63. [Google Scholar] [CrossRef]
- Project MapBiomas. General “Handbook”—Algorithm Theoretical Basis Document (ATBD); MapBiomas: Brasília, Brazil, 2018; Volume 1. [Google Scholar]
- Kuhn, M. Caret: Classification and Regression Training. R Foundation for Statistical Computing: Vienna, Austria, 2018. [Google Scholar]
- Team, R.C. R: A Language and Environment for Statistical Computing. R Foundation for Statistical Computing: Vienna, Austria, 2018. [Google Scholar]
- Hijmans, R.J.; van Etten, J.; Cheng, J.; Mattiuzzi, M.; Sumner, M.; Greenberg, J.A.; Lamigueiro, O.P.; Bevan, A.; Racine, E.B.; Shortridge, A. Package ‘raster’: Geographic Data Analysis and Modeling. R Foundation for Statistical Computing: Vienna, Austria, 2018. [Google Scholar]
- Milborrow, S. Plotmo: Plot a Model’s Residuals, Response, and Partial Dependence Plots. R Foundation for Statistical Computing: Vienna, Austria, 2018. [Google Scholar]
- Liaw, A.; Wiener, M. Classification and Regression by randomForest. R Foundation for Statistical Computing: Vienna, Austria, 2002. [Google Scholar]
- Hanley, J.A.; McNeil, B.J. The meaning and use of the area under a receiver operating characteristic (ROC) curve. Radiology 1982, 143, 29–36. [Google Scholar] [CrossRef] [PubMed]
- Zhou, X.H.; Obuchowski, N.A.; McClish, D.K. Statistical Methods in Diagnostic Medicine; Wiley Series in Probability and Statistics; John Wiley & Sons Inc.: Hoboken, NJ, USA, 2011. [Google Scholar]
- Franklin, J. Mapping Species Distributions; Cambridge University Press: Cambridge, UK, 2010. [Google Scholar]
- Rodrigues, M.; Alcasena, F.; Vega-García, C. Modeling initial attack success of wildfire suppression in Catalonia, Spain. Sci. Total Environ. 2019, 666, 915–927. [Google Scholar] [CrossRef] [PubMed]
- McCune, B.; Grace, J.B.; Urban, D.L. Analysis of Ecological Communities; MjM software design: Gleneden Beach, OR, USA, 2002. [Google Scholar]
- Amelin, L. Local Indicators of Spatial Association-LISA. Geogr. Anal. 1995, 27, 93–116. [Google Scholar]
- Petersen, R.; Aksenov, D.; Esipova, E.; Goldman, E.; Harris, N.; Kuksina, N.; Kurakina, I.; Loboda, T.; Manisha, A.; Sargent, S.; et al. Mapping Tree Plantations with Mutlispectral Imagery: Preliminary Results for Seven Tropical Countries; World Resources Institute: Washington, DC, UK, 2016. [Google Scholar]
- Freitas, F.L.M.; Guidotti, V.; Sparovek, G.; Hamamura, C. Nota Técnica: Malha Fundiária do BRASIL; Atlas—A Geografia da Agropecuária Brasileira: Piracicaba, Brazil, 2018. [Google Scholar]
- Ministry of Transport Federal State and Municipal Highways of Brazil. Available online: http://mapas.mma.gov.br/geonetwork/srv/br/metadata.show?id=1109 (accessed on 28 January 2019).
- Agency National Electric Power Maps of the Electric Sector. Available online: https://sigel.aneel.gov.br/portal/home/ (accessed on 5 February 2019).
- (C3S) Copernicus Climate Change Service ERA5: Fifth Generation of ECMWF Atmospheric Reanalyses of the Global Climate. Available online: https://cds.climate.copernicus.eu/cdsapp#!/home (accessed on 18 January 2019).
- Lovreglio, R.; Leone, V.; Giaquinto, P.; Notarnicola, A. New tools for the analysis of fire causes and their motivations: The Delphi technique. For. Ecol. Manag. 2006, 234, S18. [Google Scholar] [CrossRef]
- Alvarado, S.T.; Silva, T.S.F.; Archibald, S. Management impacts on fire occurrence: A comparison of fire regimes of African and South American tropical savannas in different protected areas. J. Environ. Manag. 2018, 218, 79–87. [Google Scholar] [CrossRef] [PubMed]
- Catry, F.X.; Rego, F.C.; Bação, F.L.; Moreira, F. Modeling and mapping wildfire ignition risk in Portugal. Int. J. Wildland Fire 2009, 18, 921. [Google Scholar] [CrossRef]
- Vasilakos, C.; Kalabokidis, K.; Hatzopoulos, J.; Matsinos, I. Identifying wildland fire ignition factors through sensitivity analysis of a neural network. Nat. Hazards 2009, 50, 125–143. [Google Scholar] [CrossRef]
- Preisler, H.K.; Westerling, A.L. Statistical model for forecasting monthly large wildfire events in Western United States. J. Appl. Meteorol. Climatol. 2007, 46, 1020–1030. [Google Scholar] [CrossRef]
- Magnussen, S.; Taylor, S.W. Prediction of daily lightning- and human-Caused fires in British Columbia. Int. J. Wildland Fire 2012, 21, 342–356. [Google Scholar] [CrossRef]
- Nogueira, J.; Rambal, S.; Barbosa, J.; Mouillot, F. Spatial Pattern of the Seasonal Drought/Burned Area Relationship across Brazilian Biomes: Sensitivity to Drought Metrics and Global Remote-Sensing Fire Products. Climate 2017, 5, 42. [Google Scholar] [CrossRef]
- Magi, B.I.; Rabin, S.; Shevliakova, E.; Pacala, S. Separating agricultural and non-Agricultural fire seasonality at regional scales. Biogeosciences 2012, 9, 3003–3012. [Google Scholar] [CrossRef]
- d’Annunzio, R.; Sandker, M.; Finegold, Y.; Min, Z. Projecting global forest area towards 2030. For. Ecol. Manag. 2015, 352, 124–133. [Google Scholar] [CrossRef]
- Moreira, F.; Rego, F.C.; Ferreira, P.G. Temporal (1958–1995) pattern of change in a cultural landscape of northwestern Portugal: Implications for fire occurrence. Landsc. Ecol. 2001, 16, 557–567. [Google Scholar] [CrossRef]
- Luke, R.H.; McArthur, A.G. Bushfires in Australia; Australian Government Publishing Service for CSIRO: Canberra, Australia, 1978; ISBN 0642023417. [Google Scholar]
- Cheney, N.P.; Richmond, R.R. The Impact of Intensive Forest Management on Fire Protection with Special Regard to Plantations of Eucalypts; CSIRO: Canberra, Australia, 1980; ISBN 0724063277. [Google Scholar]
- White, B.L.A.; Ribeiro, G.T.; Souza, R.M. Caracterização do material combustível e simulação do comportamento do fogo em eucaliptais no litoral norte da bahia, Brasil. Floresta 2014, 44, 33–42. [Google Scholar] [CrossRef]
- Catry, F.X.; Rego, F.; Moreira, F.; Fernandes, P.M.; Pausas, J.G. Post-Fire tree mortality in mixed forests of central Portugal. For. Ecol. Manag. 2010, 260, 1184–1192. [Google Scholar] [CrossRef]
- Catry, F.X.; Moreira, F.; Tujeira, R.; Silva, J.S. Post-Fire survival and regeneration of Eucalyptus globulus in forest plantations in Portugal. For. Ecol. Manag. 2013, 310, 194–203. [Google Scholar] [CrossRef]
- Guyette, R.P.; Stambaugh, M.C. Post-Oak fire scars as a function of diameter, growth, and tree age. For. Ecol. Manag. 2004, 198, 183–192. [Google Scholar] [CrossRef]
- Marques, S.; Garcia-gonzalo, J.; Borges, J.G.; Botequim, B.; Manuela, M. Stand Damage and Tree Mortality Models for Enhanced Forest Planning in Portugal. Silva Fenn. 2011, 45, 69–83. [Google Scholar] [CrossRef]
- Wyant, J.G.; Omi, P.N.; Laven, R.D. Fire Induced Tree Mortality in a Colorado Ponderosa Pine/Douglas-Fir Stand. For. Sci. 1986, 32, 49–59. [Google Scholar]
- Alcasena, F.J.; Salis, M.; Nauslar, N.J.; Aguinaga, A.E.; Vega-García, C. Quantifying economic losses from wildfires in black pine afforestations of northern Spain. For. Policy Econ. 2016, 73, 153–167. [Google Scholar] [CrossRef]
- Alcasena, F.J.; Salis, M.; Ager, A.A.; Castell, R.; Vega-García, C. Assessing wildland fire risk transmission to communities in northern spain. Forests 2017, 8, 30. [Google Scholar] [CrossRef]
- Ager, A.A.; Vaillant, N.M.; Finney, M.A. Integrating Fire Behavior Models and Geospatial Analysis for Wildland Fire Risk Assessment and Fuel Management Planning. J. Combust. 2011, 2011, 572452. [Google Scholar] [CrossRef]
- Gonçalves, J.L.M.; Alvares, C.A.; Rocha, J.H.T.; Brandani, C.B.; Hakamada, R. Eucalypt plantation management in regions with water stress. South. For. 2017, 79, 169–183. [Google Scholar] [CrossRef]


| Category | Code | Name | Description | Unit | Reference |
|---|---|---|---|---|---|
| Land cover | Savanna | Brazilian savanna | Euclidian distance to variable | Meters | [5] |
| Grassland | Grasslands | Euclidian distance to variable | Meters | [5] | |
| Annual_crop | Annual crop | Euclidian distance to variable | Meters | [5] | |
| Forest_p | Eucalypt forest plantation | Euclidian distance to variable | Meters | [5,75] | |
| Mosaic_agric | Mosaic agriculture/pasture | Euclidian distance to variable | Meters | [5] | |
| Other_urban | Other urban areas | Euclidian distance to variable | Meters | [5] | |
| Perennial_crop | Perennial crop | Euclidian distance to variable | Meters | [5] | |
| Indg | Indigenous territory | Euclidian distance to variable | Meters | [76] | |
| Water | Water bodies | Euclidian distance to variable | Meters | [5] | |
| Urban | Urban | Euclidian distance to variable | Meters | [5] | |
| Infrastructure | P_roads | Paved roads | Euclidian distance to variable | Meters | [77] |
| Unp_roads | Unpaved roads | Euclidian distance to variable | Meters | [77] | |
| Eletric_ln | Electric power lines | Euclidian distance to variable | Meters | [78] | |
| Train_ln | Train lines | Euclidian distance to variable | Meters | [77] | |
| Climate | Temp | Temperature | Daily temperature | K | [79] |
| wSpeed | Wind speed | Daily wind speed | m s−1 | [79] | |
| Rel_umd | Relative humidity | Daily humidity | % | [79] | |
| Topography | Elev | Elevation | Terrain elevation | Meters | [44] |
| Asp | Aspect | Relief aspect | Class | [44] | |
| Land tenure | Public_ld | Public land | Euclidian distance to variable | Class | [76] |
| Ld_tenure | Land tenure | Euclidian distance to variable | Class | [76] | |
| Prop_size | Rural properties size | Euclidian distance to variable | Class | [76] | |
| Demographic | Pop_den | Population density | Population density | Inhabitant per km2 | [47] |
| Ignition Likelihood (%) | 2010 | 2012 | 2014 | 2016 | ||||
|---|---|---|---|---|---|---|---|---|
| Area (ha) | % | Area (ha) | % | Area (ha) | % | Area (ha) | % | |
| 0.00–0.10 | 42,625.0 | 0.7 | 24,237.5 | 0.4 | 25,093.8 | 0.4 | 15,262.5 | 0.3 |
| 0.11–0.25 | 991,843.8 | 17.4 | 663,200.0 | 11.7 | 721,675.0 | 12.7 | 678,281.3 | 11.9 |
| 0.26–0.50 | 3,731,675.0 | 65.6 | 3,170,775.0 | 55.8 | 3,173,193.8 | 55.8 | 3,189,231.3 | 56.1 |
| 0.51–0.85 | 917,731.3 | 16.1 | 1,785,450.0 | 31.4 | 1,723,256.3 | 30.3 | 1,753,662.5 | 30.9 |
| 0.86–1.00 | 406.3 | 0.0 | 40,618.8 | 0.7 | 41,062.5 | 0.7 | 47,843.8 | 0.8 |
© 2019 by the authors. Licensee MDPI, Basel, Switzerland. This article is an open access article distributed under the terms and conditions of the Creative Commons Attribution (CC BY) license (http://creativecommons.org/licenses/by/4.0/).
Share and Cite
Galizia, L.F.d.C.; Rodrigues, M. Modeling the Influence of Eucalypt Plantation on Wildfire Occurrence in the Brazilian Savanna Biome. Forests 2019, 10, 844. https://doi.org/10.3390/f10100844
Galizia LFdC, Rodrigues M. Modeling the Influence of Eucalypt Plantation on Wildfire Occurrence in the Brazilian Savanna Biome. Forests. 2019; 10(10):844. https://doi.org/10.3390/f10100844
Chicago/Turabian StyleGalizia, Luiz Felipe de Castro, and Marcos Rodrigues. 2019. "Modeling the Influence of Eucalypt Plantation on Wildfire Occurrence in the Brazilian Savanna Biome" Forests 10, no. 10: 844. https://doi.org/10.3390/f10100844
APA StyleGalizia, L. F. d. C., & Rodrigues, M. (2019). Modeling the Influence of Eucalypt Plantation on Wildfire Occurrence in the Brazilian Savanna Biome. Forests, 10(10), 844. https://doi.org/10.3390/f10100844