Article

Intraspecific Competition Affects Crown and Stem Characteristics of Non-Native Quercus rubra L. Stands in Germany

Silviculture and Forest Ecology of the Temperate Zones, Faculty of Forest Sciences, University of Göttingen, Büsgenweg 1, 37077 Göttingen, Germany
*
Author to whom correspondence should be addressed.
Forests 2019, 10(10), 846; https://doi.org/10.3390/f10100846
Submission received: 6 August 2019 / Revised: 19 September 2019 / Accepted: 27 September 2019 / Published: 28 September 2019
(This article belongs to the Section Forest Inventory, Modeling and Remote Sensing)

Abstract

:
Accurate guidelines for silvicultural management of exotic tree species in Germany are sparse. For example, northern red oak (Quercus rubra L.) is the most commonly planted exotic deciduous tree species in Germany, but its response to varying levels of competition intensity has not yet been adequately explored. Here, we used terrestrial laser scanning to non-destructively examine the responses of stem and crown characteristics of Quercus rubra to intraspecific competition. A total of 100 dominant red oak trees were investigated in ten pure red oak stands, located in five federal states of Germany. The external stem quality characteristics namely stem non-circularity and bark anomalies decreased with increasing tree competition. Also, the crown characteristics crown volume, crown surface area, maximum crown area, crown length, and branch length declined by the degree of individual tree competition. We conclude that individual tree properties can be controlled by competition intensity, resulting in improved timber quality as shown for other tree species.

1. Introduction

Tree species selection and stand density control are usually the most important decisions forest managers can make. While the effects of silvicultural treatments that control competition intensity have been studied since the beginning of forest science [1,2,3] and are well known for native tree species [1,2,3,4,5], guidelines for exotic trees species are often lacking or are uncertain [6]. Northern red oak (Quercus rubra L.) is the most commonly planted exotic deciduous tree species in Germany, covering 0.5% of its forested area [7,8]. Native to eastern USA and Canada [9], red oak has been cultivated in Germany for more than a century.
Several studies have addressed silvicultural management of native oak species in Germany [10,11,12]. Studies of the management of red oak in Europe are, however, in contrast to North America [13,14,15], far more scarce, only a few management trials with red oak are available [16,17,18]. Responses of Quercus rubra L. with respect to crown expansion and stem growth under varying competition intensities and different sites have not yet been fully explored outside their native range. While there is general agreement that thinning from above is a suitable treatment [19,20,21,22], the discussion is ongoing regarding both the number of crop trees to be promoted and the degree of individual tree competition that promote timber quality [21,22].
Terrestrial laser scanning (TLS) has recently been utilized as a tool to explore tree morphology in detail, including quality-related attributes of trees [23,24,25,26,27]. Several studies have demonstrated that various tree characteristics, such as diameter at breast height [28], total tree height [29,30], or timber volume [31] can be derived from TLS. Additionally, Kretschmer et al. [32] generated a method to identify bark irregularities, such as branch knots or branch scars, and recently, Höwler et al. [27,33] used TLS-based measures to describe external stem characteristics (i.e., bark anomalies, lean and sweep) of beech (Fagus sylvatica L.) trees in response to competition. Other studies have shown the potential of TLS to measure tree crown shapes under varying levels of intra- and interspecific competition [34,35,36,37].
Here we used TLS at different sites in Germany to investigate the morphological responses of red oaks to the competition. Although we are aware that red oak monocultures are no longer recommended in current silvicultural programs, we used pure stands in order to better understand competitive effects at a basic level without complex interspecific and species-specific implications [19].
The objective of our study was to contribute to improved management schemes for red oak. More specifically, we hypothesized that: (1) Increasing intraspecific competition results in shorter and more slender tree crowns, and (2) results in fewer external stem characteristics that are negatively related to the commercial timber quality of red oak.

2. Materials and Methods

2.1. Study Sites

Our study was conducted in five federal states of Germany: Brandenburg, Thuringia, Lower Saxony, North Rhine-Westphalia, and Baden-Wuerttemberg, and covered a broad geographical site range (Figure 1 and Table 1). In each state, two study sites were chosen according to the following criteria: (1) Quercus rubra trees needed to be middle-aged (mature trees but not yet in their final harvesting period, here between 55–85 years), (2) the area should comprise at least one hectare, (3) stands should be more or less pure (minimum share of red oak: 80%), (4) stands had to be located on sites that local authorities had classified as suitable for red oak, and (5) stands should cover a wide range of genetic diversity (chloroplast DNA haplotypes, derived from a preceding study [38].

2.2. Tree Inventory

We conducted a full inventory of all ten stands using the Field-Map—instrument and software package (IFER—Monitoring and Mapping Solutions, Ltd., Czech Republic). Tree coordinates, diameter at breast height (DBH) of every tree with a DBH ≥ 7 cm, social status (tree classes according to Kraft [3], and information on each tree’s health status (alive, dead, broken alive, or broken dead) from visual assessment were recorded. For morphological assessments we randomly selected ten dominant red oak trees (tree classes 1–2 according to Kraft [3]) per study site, resulting in a total of 100 “subject trees”. The study trees were selected within a 10 m wide buffer zone along the border of the respective site.
The competitive status of each study tree was calculated based on an area of about 700 m2 (r = 15 m) around each tree. All neighboring trees whose stems were located inside the 15 m radius were considered potential competitors. Since the measured maximum subject tree crown radius was ± 6.5 m, we assumed that the 15 m radius included all neighboring trees which could potentially influence the growth performance of the subject trees. In order to quantify competition intensity (Equation (1)) we used an Index adopted from Hegyi [43].
H e g y i I n d e x = i = 1 n D i D j × 1 D i s i j
with subject tree j, competitor tree i, diameter at breast height (D (cm)) and the distance between subject tree j and the competitor trees i (Dis (m)).

2.3. Terrestrial Laserscanning

We used terrestrial laser scanning to describe the three-dimensional (3D) structure and external stem characteristics of each subject tree. All scans were performed between January and May 2018 in order to record the trees without their leaves. We used a Faro Focus 3D 120 laser scanner (Faro Technologies Inc., Lake Mary, FL, USA) mounted on a tripod at 1.3 m height above the ground. The scanner was set to capture a field of view of 360° horizontally and 300° vertically to a maximum distance of 120 m. The spatial resolution comprised nearly 44 million measurements per scan by setting the angular step width to 0.035°, which equates to a resolution of 10,240 measurements per 360°. Depending on the overall stand density and visibility in the surroundings of the subject tree, four to five scans were conducted [44]. The mean distance between the position of the scanner and the subject tree depended on the crown proliferation. For spatial co-registration of all scans made in the surroundings of a subject tree, we used 15 to 25 artificial checkerboard targets (tie points on foil-coated DIN-A4 (21.0 cm × 29.7 cm) paper). As a result, a full 3D point cloud of each stem, including the crown of each subject tree, was available.

2.4. Post-processing of TLS Data

We exported the 3D point cloud of each subject tree as an .xyz-file (Cartesian coordinates) and imported the data into the CloudCompare Software (Cloud Compare 2.6, retrieved from http://www.cloudcompare.org/). Using CloudCompare, each subject tree was manually extracted from the total point cloud and also stored as an .xyz-file [36]. For a more in-depth analysis of external stem characteristics that could be related to timber quality, the stem was separated from the individual tree point cloud using crown base height as the separation point between stem and crown. The 3D models of the stems were also exported as .xyz-files for further analysis.

2.4.1. Timber Quality Assessment

Using a newly developed algorithm written in the software Mathematica (Wolfram Research, Champaign, IL, USA) [27], the 100 point clouds of the tree stems were virtually cut into 4 m long sections. Timber quality is commonly classified based on such sections in Germany according to the ‘framework for trading wood’ (RVR 2014). This framework defines which stem properties and wood attributes shall be evaluated and how timber is to be sorted into different quality grades.
To homogenize the spatial resolution point clouds of all trees, we used a point cloud grid (PCG) of 1.75 cm resolution for each stem section [27,34]. Using PCGs, variations in point cloud densities among trees scanned with identical scan settings can be reduced [27]. Such variations naturally result from varying scanner-to-tree distances, varying overlap of data from different scan positions, and occlusion effects due to understory vegetation. An accuracy assessment of the approach is difficult but was attempted in Höwler et al. [33], when bark anomalies were contrasted to internal wood characteristics.
Then, for every 4 m stem section the same approach was used: The homogenized point clouds were partitioned into horizontal layers of 1.75 cm thickness, representing “stem discs”. These layers were processed in accordance to the “QR” decomposition that creates a circle to the points of each layer, factorizing a matrix with “Q” as the orthogonal and “R” as the upper triangular matrix [27,45]. A minimum of 20 points has been considered to constitute a stable circle fit, as in further studies it has been proved as solid [27]. Afterward, the diameter, center coordinates and each height of every created circle were recorded [27].
The measure “total lean” for every stem section was calculated based on horizontal differences between the lowest and the highest circle position. To guarantee a length-independent measurement of lean, the resulting value was divided by the total length of each stem section. “Total sweep” was defined as the ratio of the shortest distance between the centers of the lowest and highest circle (straight line) within a stem section and the distances between the centers of all circles of every stem section within a tree. To obtain sweep per meter, total sweep was corrected by the length of each stem section [27].
In the following, we provide definitions for scan-based measures that were used for quality assessment of the external stem surface.
First, “stem non-circularity” was determined for each stem section based on the stem discs (see above). For each disc, we calculated the absolute differences between every point on the stem surface and the radius of the stem disc derived from the circle fit conducted for each disc [27,37]. As introduced by Höwler et al. ([27], p. 1607), “The mean of these absolute distances was calculated for each height layer. The median of all height layers was finally considered a measure of stem non-circularity of the stem section”. We also used the standard deviation of the stem non-circularity measure for all height layers per stem section as a measure of variability in stem non-circularity along the vertical stem axis [27].
Secondly, we determined the mean distance between each point on the surface of a stem disc and the center of the respective stem disc. This measure was used to identify points that were either unusually far (larger than average distance + standard deviation) from the center of the stem disc (bumps) or unusually close (shorter than average − standard deviation of the stem disc) to the center (dents). We considered those points as “bark anomalies” (i.e., branch scars). “Bark anomalies thus count all points with a position that deviates “more than usual” from the fitted circle.” ([27], p. 1607), and it is highly adapted to the local conditions of the stem as each stem disc is considered individually [27]. To calculate bark anomalies per meter the number of bark anomalies was divided by the length of the stem sections [27]. Additionally, bark anomalies per square meter were computed based on the surface area of the respective stem sections to account for the differences of stem diameters.
Taking into account the RVR framework, lean and sweep are allusions of “simple sweep”. Bark anomalies comprise all branch caused defects (i.e., water sprouts, alive or dead branches). Crown characteristics are not included in the RVR Framework.

2.4.2. Tree Architecture

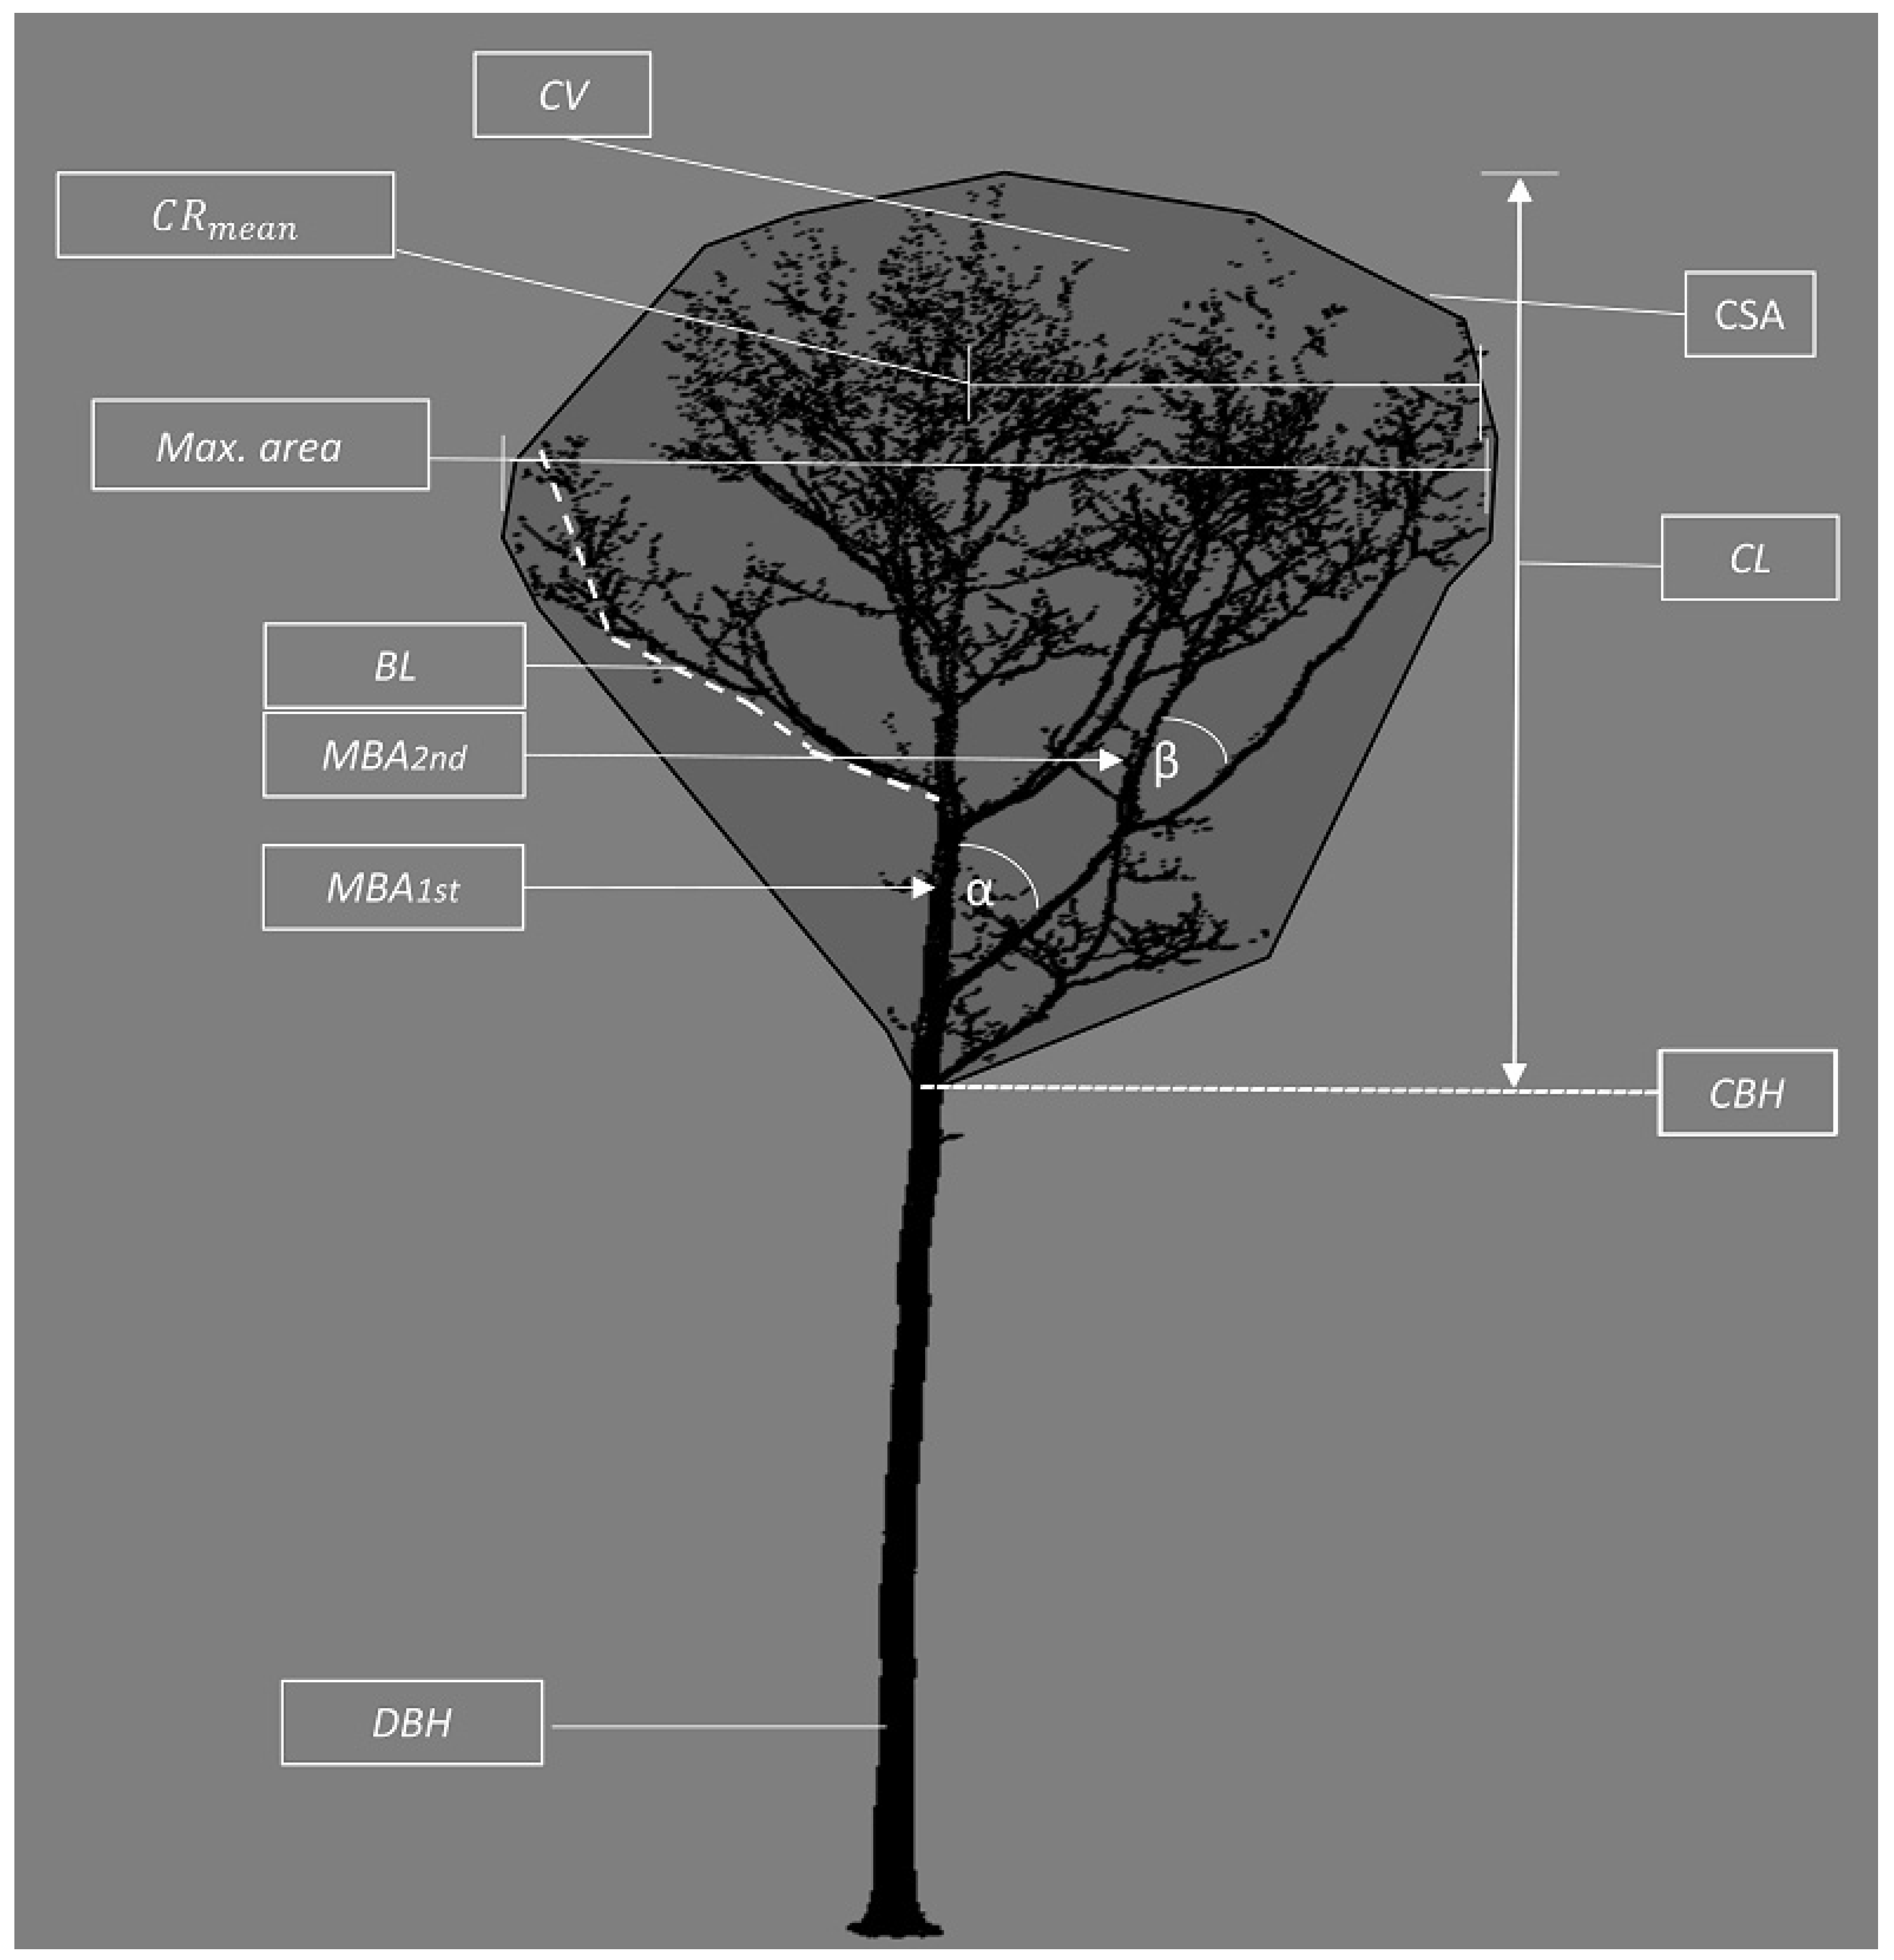
To describe tree architecture in terms of branching pattern we used Quantitative Structural Models (QSMs) deduced from the point clouds with the software Computree [46] following the methodology introduced by Hackenberg et al. [47]. Hierarchical collections of cylinders were fitted to local details of the point cloud to describe the tree [31]. From the cylinder models we derived measures of mean branch angle of first-order branches, mean branch angle of second-order branches, sum-, mean-, median-, maximum of branch lengths of first-order branches, tree stem volume, branch volume first-order, and—based on all cylinders of each tree—wooden tree volume (Figure 2).

2.4.3. Tree Morphology

We also derived 12 measures of tree morphology and dimension directly from the point cloud of a given tree. This approach included the variables diameter at breast height (DBH) [34], lean and sweep [37], stem non-circularity, bark anomalies [27], crown base height (CBH) [36], maximum crown area [30], crown surface area, crown volume, crown length (TTH-CBH), crown asymmetry [34], and mean crown radius (Figure 2) [30].

2.5. Statistical Analysis

We conducted all statistical analyses using the R Software environment [48]. We tested the data for normality using the Shapiro-Wilk Test. Variance homogeneity was tested using Levene’s test.
The effect of competition intensity on both crown characteristics and stem quality attributes in every stem section (0 m–4 m (measured beginning from the root collar), 4 m–8 m, 8 m–12 m) were analyzed using simple linear regression.
If needed, the independent or dependent variables were log-transformed to get normally distributed residuals and to depict nonlinear relationships with a linear model. Yield classes were used to assess whether the effect of competition on crown properties and stem quality was modified by site quality. Yield classes were derived from yield tables developed for red oak [19]. High yield classes indicate poor site conditions while low values indicate better site conditions [4]. In addition, linear mixed effect models were used to account for the hierarchical structure of the data, with idplot within federal states as a random factor. The random factor federal states did not significantly improve the models, so it was removed. The ID of the plots (idplot) (stand specific number) remained as a random factor and significantly improved the amount of variance explained. However, we decided to use simple linear regression models to show the overall effect of competition for the sake of simplicity and to present the results of the mixed effect models in the SI (site index) for comprehensiveness (Table S2).
As some relations belong to basic knowledge (influence of competition on diameter at breast height, stem volume, branch volume, and wooden tree volume), they will not be discussed in the following (Figure S2).
All models were fit with restricted maximum likelihood (REML). For all statistical analyses, we used a significance level of p < 0.05. However, since the use of p-values has recently been criticized [49], only obvious and biologically reasonable relationships were considered in the Discussion.

3. Results

Distribution of the number of bark anomalies per meter (median ± SD (standard deviation)) decreased from the lowest stem section (0 m–4 m) to the top section (8 m–12 m) (0 m–4 m: 932.9 + 201.7, 4 m–8 m: 534.5 + 127.3, 8 m–12 m: 271.5 ± 87.3). The values for mean stem non-circularity decreased from the first section (0 m–4m: 0.009 ± 0.003) to the second section (4 m–8 m: 0.007 ± 0.002). Between the second section and last sections, the values for stem non-circularity were almost equal (8 m–12 m: 0.007 ± 0.002).
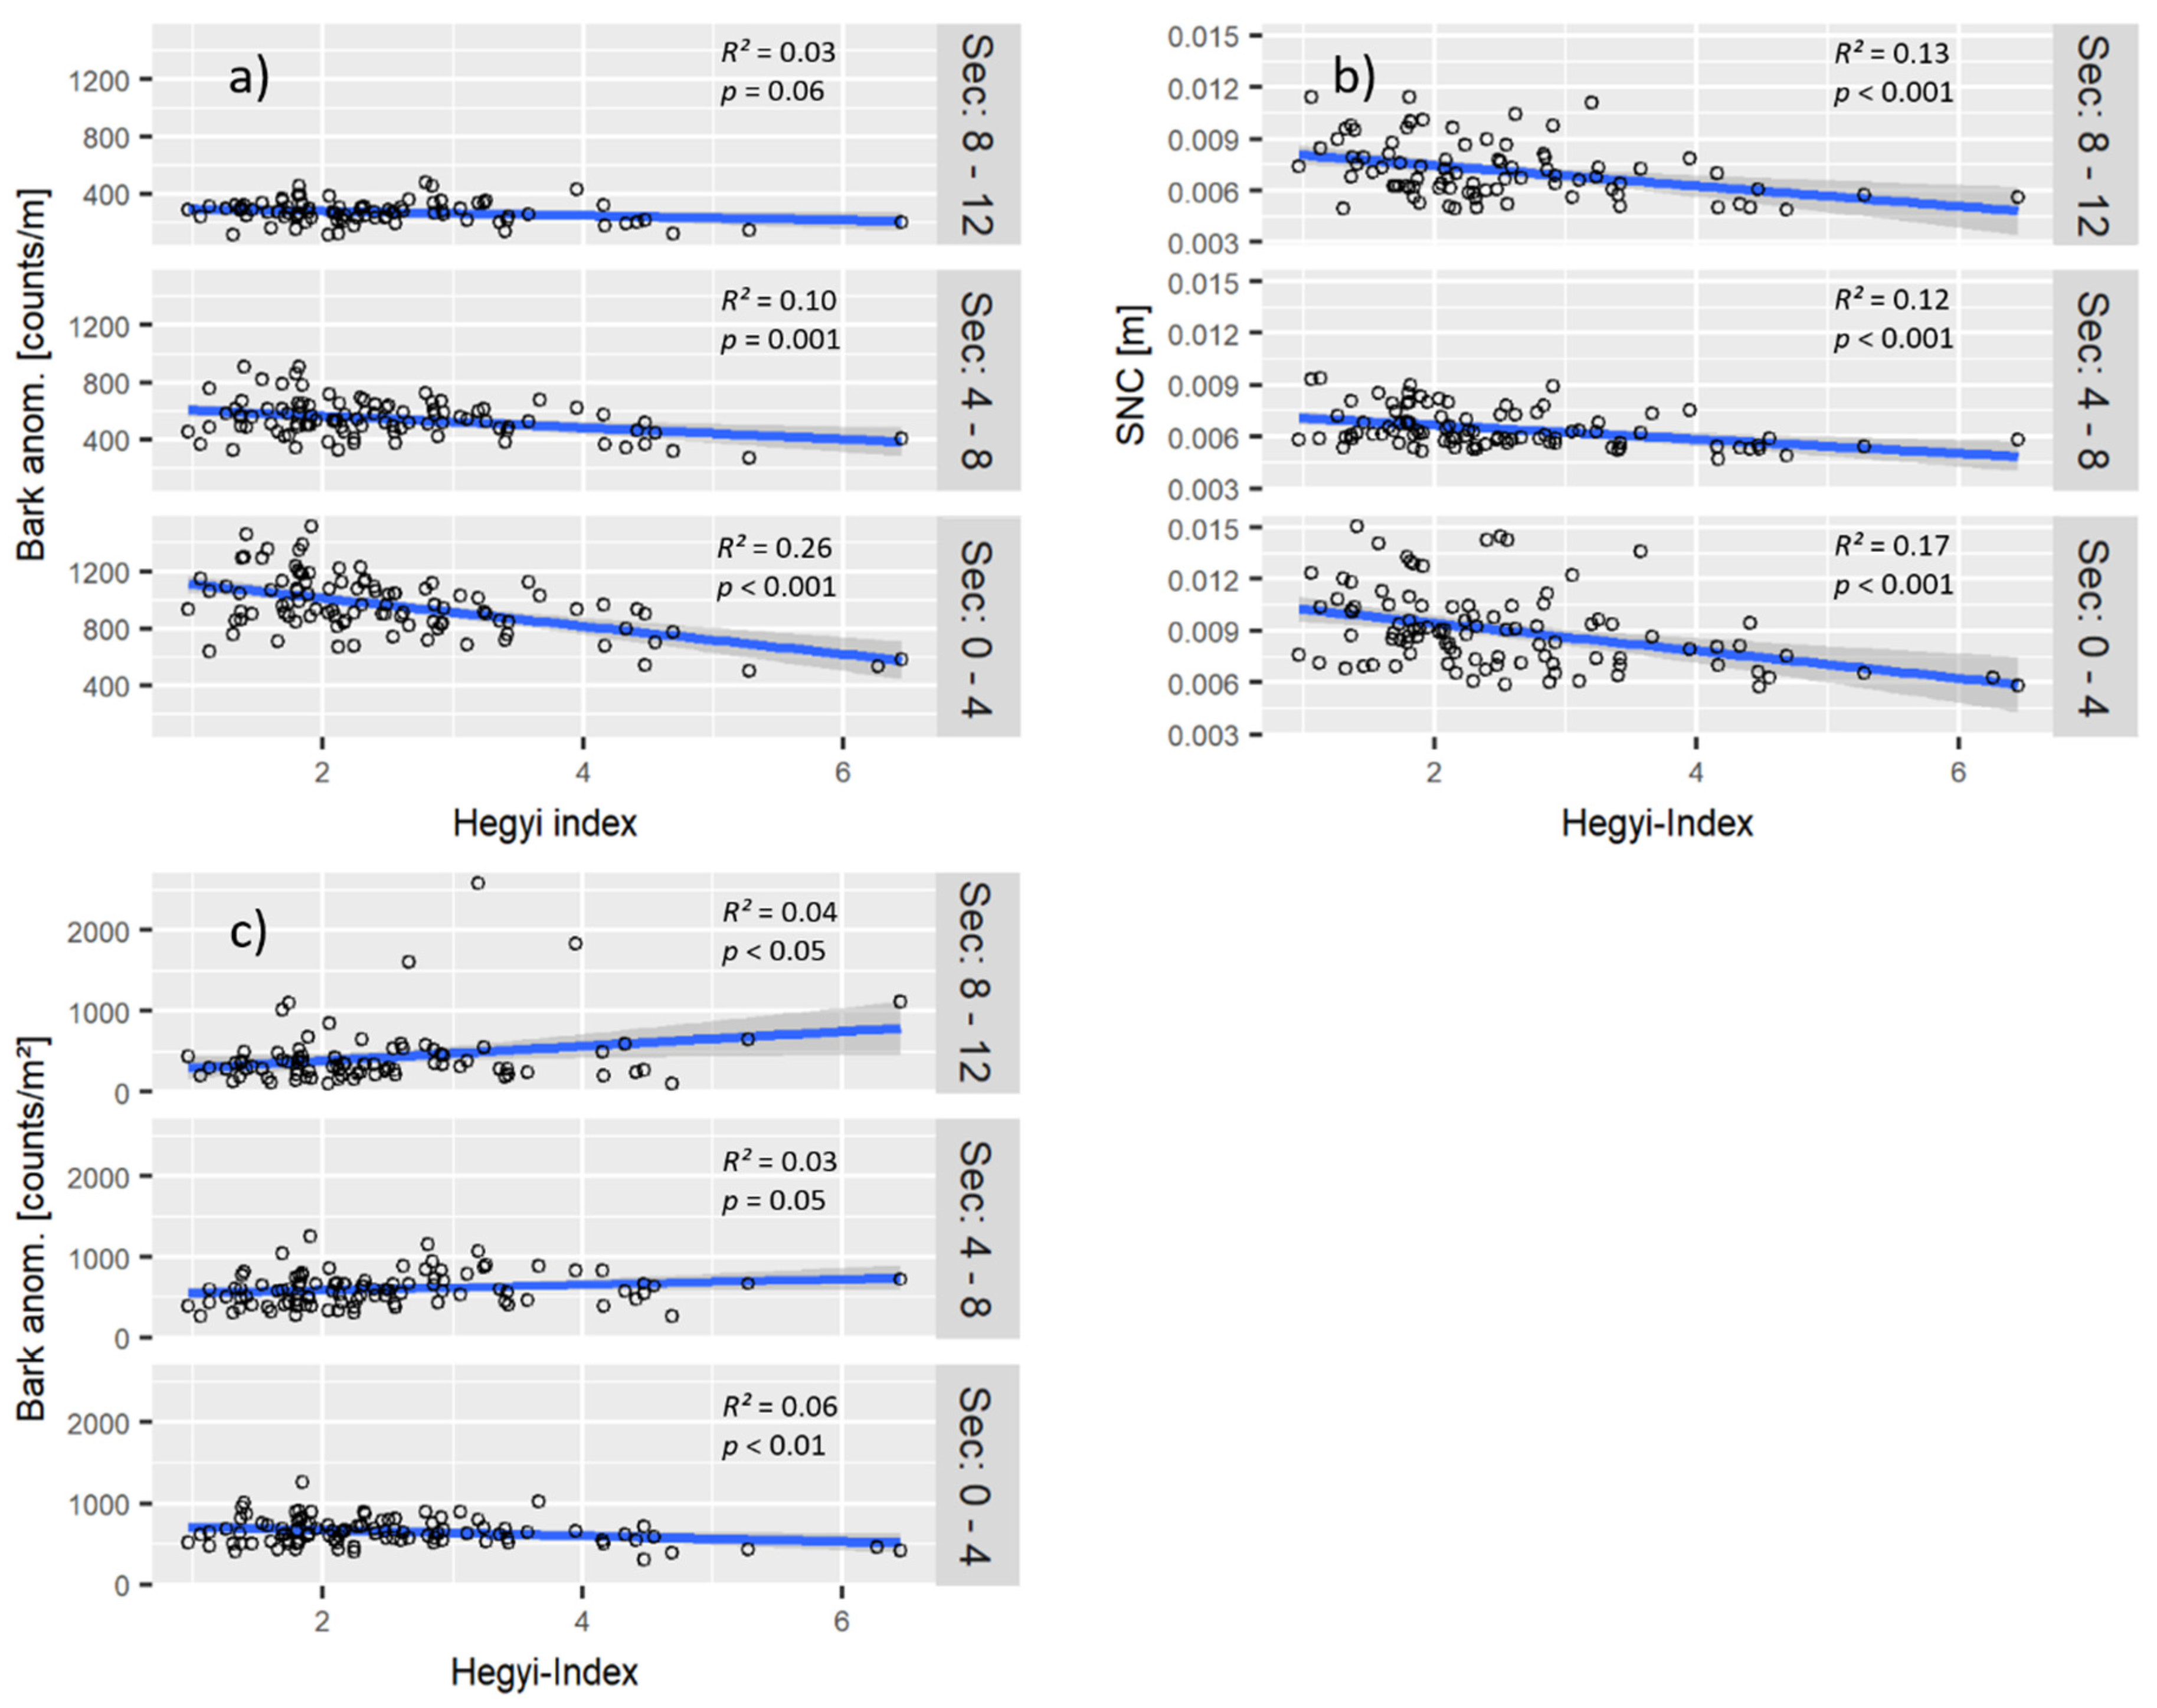
Two external stem characteristics and seven crown characteristics were significantly related to competition intensity. The two stem quality attributes stem non-circularity (section 0 m–4 m (p < 0.001), 4 m–8 m (p < 0.001) and 8 m–12 m (p < 0.001)) and bark anomalies (section 0 m–4 m (p < 0.001) and 4 m–8 m (p = 0.001)) significantly declined with increasing competition (Figure 3). At a given level of competition, both measures had higher values at better sites (Table S1). Also, bark anomalies per square meter were significantly related to competition. In section 0 m–4 m the number of bark anomalies decreased with increasing competition indices (p < 0.01). Whereas in the sections 4 m–8 m (p = 0.05) and 8 m–12 m (p < 0.05) the number of bark anomalies per square meter increased with increasing competition (Figure 3). For lean and sweep no significant relationship with competition was observed (Figure S1).
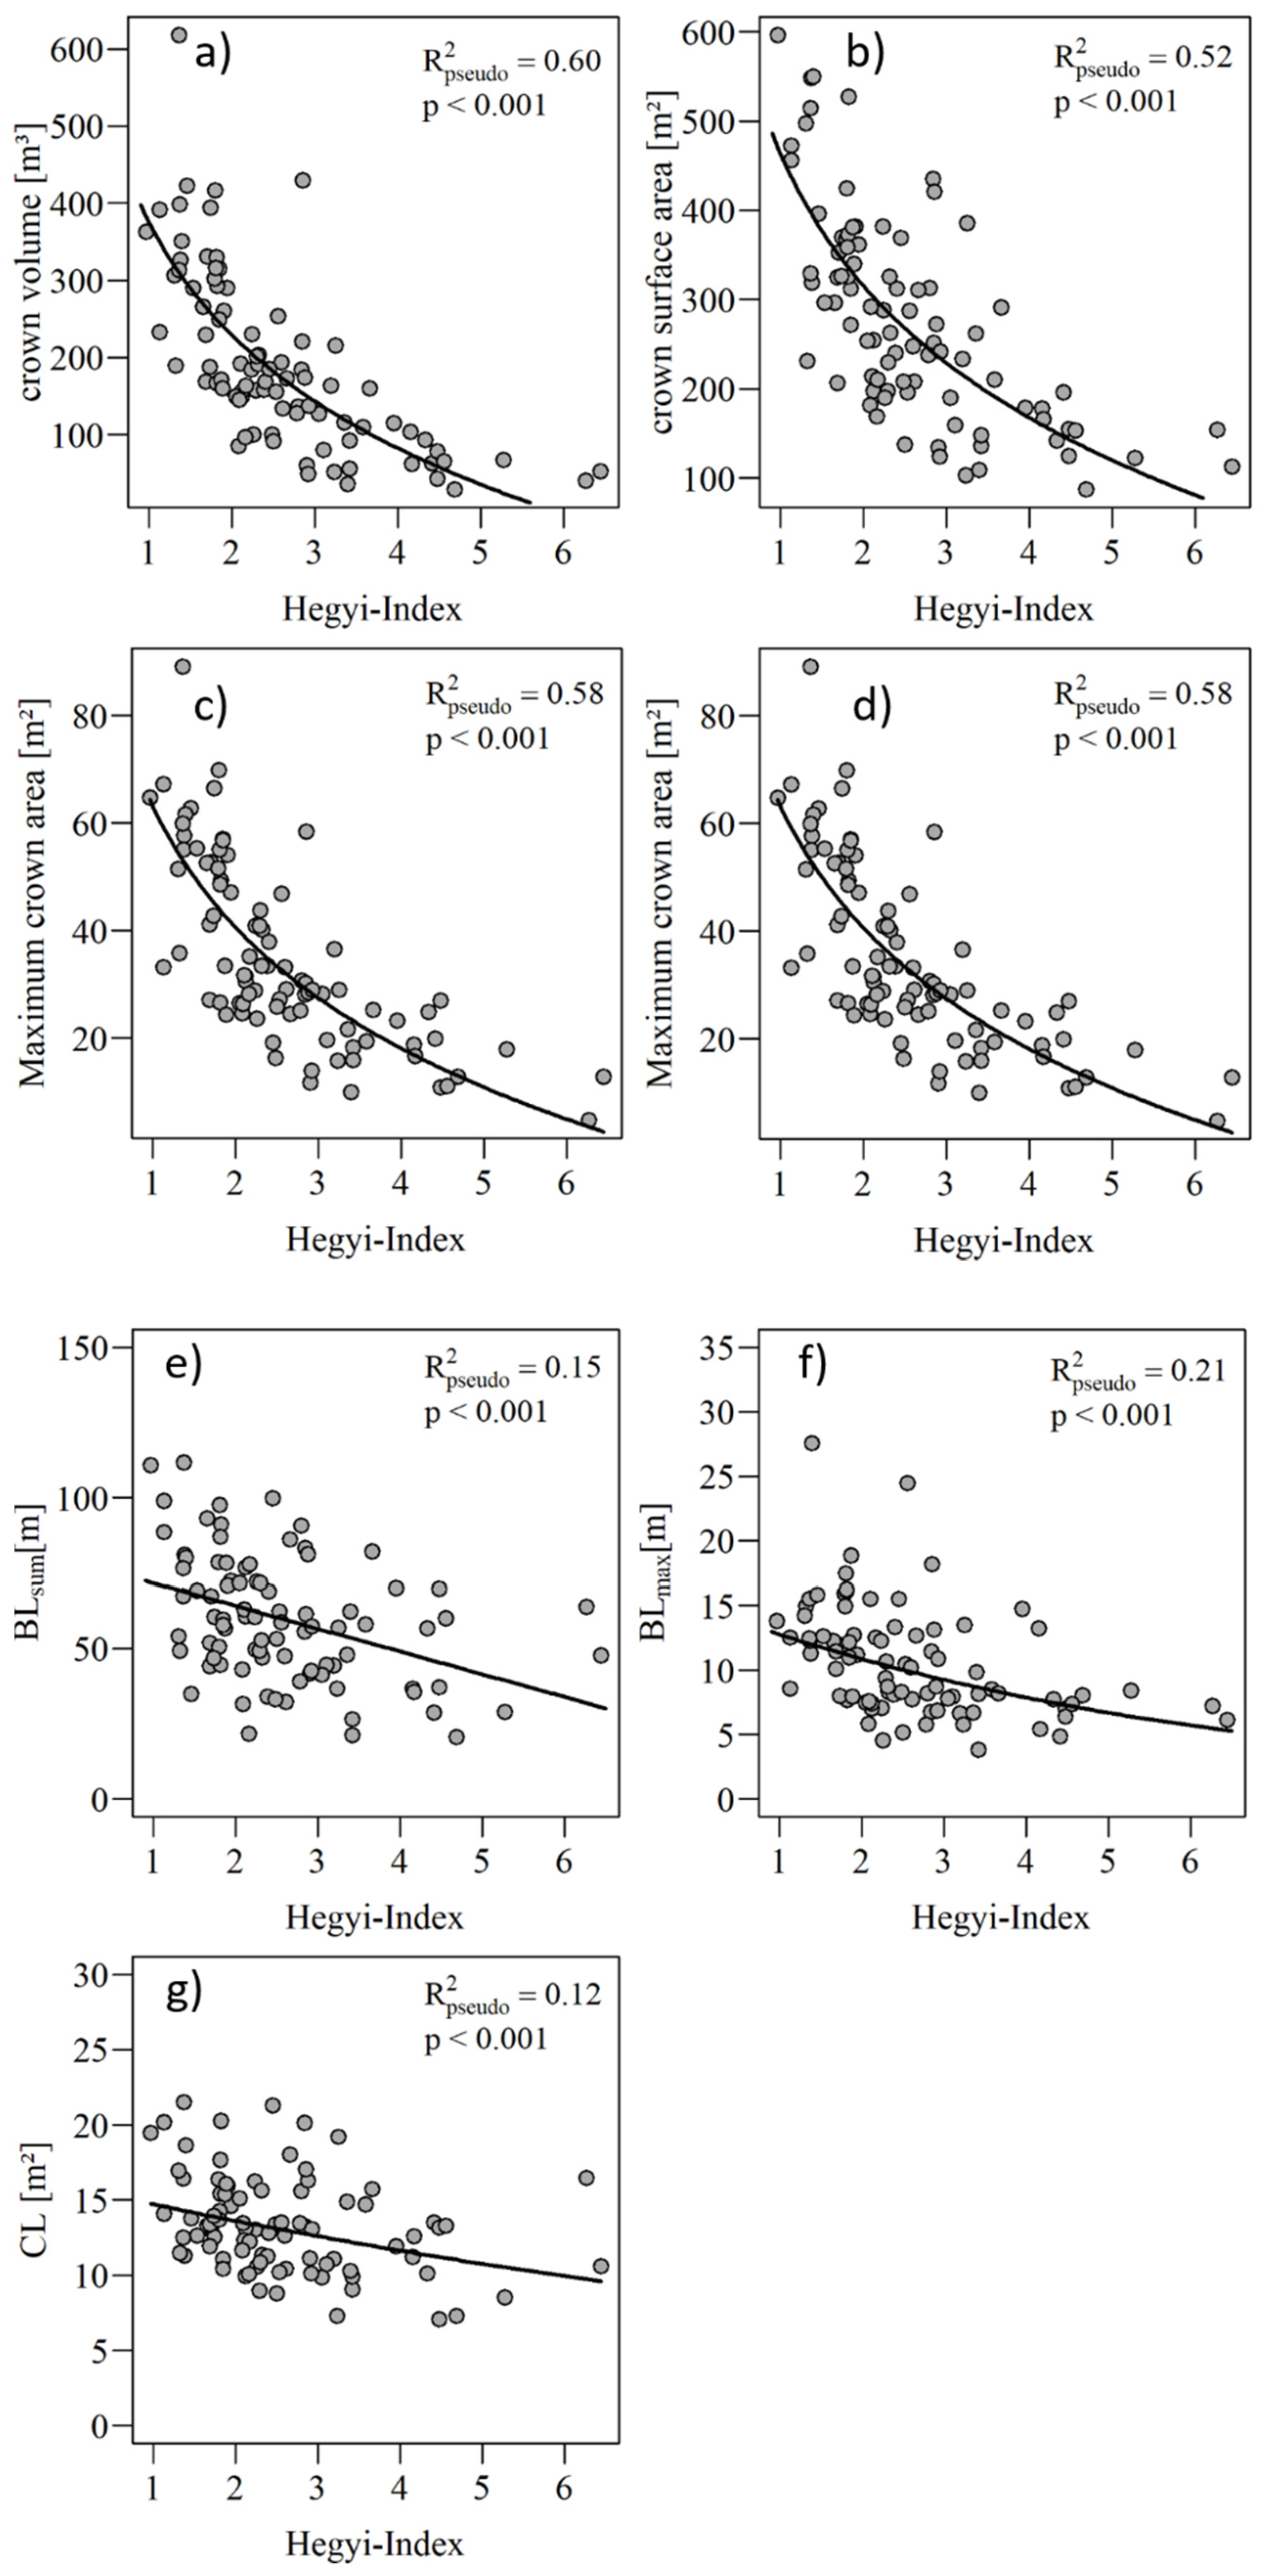
The seven crown attributes crown volume (p < 0.001), crown surface area (p < 0.001), mean crown radius (p < 0.001), maximum crown area (p < 0.001), maximum branch length (p < 0.001), sum of branch length (p < 0.001), and crown length (p < 0.001) decreased with increasing competition intensity (range = 0.97–6.45, min and max) (Figure 4).
We found no significant relation between competition and the crown attributes mean branch length, median branch length, mean branch angle of first-order branches, mean branch angle of second-order branches, crown asymmetry, and crown base height (Figure S2).
The tree attributes diameter at breast height (p < 0.001), stem volume (p < 0.001), branch volume first order (p < 0.001) and wooden tree volume (p < 0.001) decreased with increasing competition (Figure S2).
Apart from the competition, crown surface area, mean crown radius, maximum branch length, and sum of branch length were also significantly influenced by the site index. In three out of four cases crown attributes increased with site quality (Table S1).

4. Discussion

4.1. Effect of Competition Intensity on Crown Attributes

The results of this study show that competition plays an important role in shaping both the morphology and the architecture of red oak trees. Horizontal crown extension (mean crown radius and maximum crown area), vertical crown extension (crown length), and the complete three-dimensional crown extension (crown volume and crown surface area) decreased with increased competition. Maximum branch length, accounting for a large part of the crown volume, was also reduced by increased competition. These findings are in line with previous studies of deciduous trees, suggesting that crown extension can be used as a predictor of the degree of competition a tree has experienced during its development [50,51,52,53]. For example, Mäkinen and Hein [54] showed that branch lengths of Norway spruce trees were affected by high competition intensities and led to smaller crowns, including shorter crown lengths.
Crown extension reflects the availability of above-ground resources [51,55]. In turn, the resource acquisition capacity of trees is negatively affected by increasing competition. Consequently, increased competition leads to a reduction in crown length [56,57], which is due to the loss of branches in the lower crown areas as a result of low light availability in the lower crown sections [58]. Vertical crown extension, however, is the driving force of productivity, since it determines leaf area and impacts light interception and the microclimate of the canopy [51,59,60,61].
We found the expected negative relationship between crown extension and competition even though we could only quantify the present competition status, which does not necessarily correspond to the situation in past decades. If, for example, a recent thinning intervention had reduced competition of our study trees, their crown shape still would have been strongly affected by the previous tree neighborhood. It seems that actual competition status is therefore closely related to crown attributes that are relevant for productivity [62].

4.2. Effect of Competition Intensity on Stem Quality Characteristics

The external stem quality characteristics number of bark anomalies and stem non-circularity decreased with increasing competition. Irregularities on the stem surface originate from both former branches and multiple stem injuries (e.g., bark seams) [63]. This study confirmed previous findings that increasing stand density leads to reduced branchiness [54,64,65,66,67]. Thus, for red oak high competition intensities are also necessary to improve timber quality [33,68,69,70], as increasing branchiness is thought to reduce the stem quality and value of many tree species [4,70,71]. Recovered bark wounds, which were included in our assessment of the number of bark anomalies, can have negative impacts on inner stem quality (e.g., white rot) of oak [72] leading to reduced timber value. Thus, the number of bark anomalies is a reasonable measure for predicting inner timber quality [27].
It has to be considered that bark anomalies may also include recovered bark wounds, which can be caused by harvesting machines during a thinning intervention. The intensity of damage depends on several factors i.e., stand density, machine type or environmental conditions [73,74]. Bark wounds can be observed 10 years or 20 years after harvest [75]. Further studies about the impact of stem wounds in the number of bark anomalies are necessary. Another possible effect of harvest events is the phototropic growth of red oak [19], that can result in swept and leaned stems after strong release. The results of this study did not show any significant results with the stem characteristics lean and sweep, so we suggest, that there was no strong release during past thinning interventions.
In order to correct the absolute number of bark anomalies by stem dimensions, we calculated the number of bark anomalies per m2 as well. We found our expectations confirmed that the upper stem sections did not profit from the higher competition in terms of stem quality because here the diameter increment was not high enough to quickly cover the scars from former branches. Stem non-circularity decreased with increasing competition, revealing another positive effect of higher competition intensities [27,76]. Dean et al. [77] found that stem non-circularity can lead to an overestimation by up to 10% of mature tree stem volume for Sequoiadendron giganteum, Eucalyptus regnans and Quercus robur, which in turn reduces the timber yield of the stem strength classes.

4.3. Effect of Site Conditions

Site conditions generally reflected both total timber yields and height growth in forest stands. Thus, we used yield classes to classify the site conditions.
Both stem quality attributes and all crown characteristics were related to competition intensity and yield classes. At a given level of competition, higher values of bark anomalies and stem non-circularity and hence poorer stem quality were found on better sites. We assume that this finding is due to differences in growth. On good sites, trees grow faster, resulting in larger stem and branch diameters. After self-pruning, branch occlusion may take longer or may be more pronounced for these large branches as expressed by the measures bark anomalies and stem non-circularity.
The interaction term that included the three crown characteristics crown surface area, maximum branch length and the sum of branch length resulted in stronger responses to competition intensity under good than under poor site conditions. In line with the stress-gradient-hypothesis [78,79] it seems that on good sites competition for resources is greater than on less good sites (lower yield classes).

4.4. Silvicultural Recommendations

We found significant effects of competition intensity on external stem quality attributes, specifically stem non-circularity and bark anomalies. High competition intensities led to better stem qualities with respect to both measures. Several other tree characteristics (e.g., mean crown radius or crown volume) were also affected by competition intensities. To obtain higher timber quality, our results indicate that red oaks need, rather high stand densities to produce fewer external stem defects. External stem quality characteristics are strongly related to internal stem quality [33,80]. With higher competition intensities, intended diameters of subject trees may be reached later, but stem qualities will be higher [81]. Once the desired branch-free log lengths are reached, it is essential to release future crop trees from the competition in order to direct diameter increment primarily to these trees.
As this study captured only a snapshot of the relationship of competition to morphology, longer time series of red oak thinning trials under different site conditions would be desirable. Such experiments would make it possible to assign direct growth responses, which could then be related to a release from the competition. The effect of competition from other tree species in mixed red oak stands is another field that should be explored by future studies on red oak outside its natural range.

5. Conclusions

We examined the effect of competition intensity on tree and crown characteristics of northern red oak. Crown dimensions decreased with increasing competition, but stem quality was, in general, better in denser stands. We conclude that increased competition was the main driver of enhanced stem quality and reduced crown size.
European northern red oak stands could be managed similarly to many native broadleaved tree species. In Germany this would mean applying low thinning intensities in young stands until self-pruning has reached the desired height, followed by heavy thinning from above in order to support crown extension of selected subject trees and hence growth.

Supplementary Materials

The following are available online at https://www.mdpi.com/1999-4907/10/10/846/s1. Table S1: Relationship between tree characteristics, competition intensity (Hegyi-Index) and site Index (yield class; the lower the class, the better the site); Table S2: Results of the linear mixed effect model with competition as independent, idplot (site effect) as random factor; Figure S1: Linear models of competition intensity (Hegyi-Index) and the stem quality attributes sweep and lean along the stem sections; Figure S2: Relationsship between competition intensity (Hegyi-Index) and various tree characteristics.

Author Contributions

Conceptualization, K.B., T.V., D.S. and C.A.; data curation, K.B., formal analysis, K.B., D.S. and T.V., investigation, K.B., methodology, K.B., T.V., D.S., P.A. and C.A.; project administration, C.A. and T.V.; supervision, T.V., D.S., P.A. and C.A.; writing—original draft, K.B.; writing—review and editing, K.B., D.S., T.V., P.A. and C.A.

Funding

The study was supported by the German Federal Ministry of Food and Agriculture (Funding code FKZ 22023314). Development of TLS-based quality measures was supported by funds of the German government’s Special Purpose Fund held at Landwirtschaftliche Rentenbank (FKZ: 844732) provided to Dominik Seidel.

Acknowledgments

We thank Thomas Böckmann, Nico Frischbier, Bertram Leder, and Bernhard Mettendorf for providing basic data on red oak stands and for the access to the forest sites. We further thank Andreas Parth for technical assistance during fieldwork and for the post-processing of the data. We are grateful to all forests, in particular, Markus Gutmann, for their support by finding appropriate study sites. We finally thank Kathy Regan (USA) for linguistic corrections and two anonymous reviewers for their helpful comments on the manuscript.

Conflicts of Interest

The authors declare no conflict of interest. The funders had no role in the design of the study, in the collection, analyses, or interpretation of data, in the writing of the manuscript, or in the decision to publish the results.

References

  1. Cotta, H. Anweisung zum Waldbau; Arnoldische Buchhandlung: Leipzig, Germany, 1828. [Google Scholar]
  2. Bernhardt, A. Geschichte des Waldeigenthums, der Waldwirthschaft und Forstwissenschaft in Deutschland; Springer: Berlin, Germany, 1874. [Google Scholar]
  3. Kraft, G. Beiträge zur Lehre von den Durchforstungen, Schlagstellungen und Lichtungshieben; Klindworth’s: Hannover, Germany, 1884. [Google Scholar]
  4. Burschel, P.; Huss, J. Grundriss des Waldbaus. Ein Leitfaden für Studium und Praxis; Eugen Ulmer: Stuttgart (Hohenheim), Germany, 2003; ISBN 3800145707. [Google Scholar]
  5. Eisenhauer, D.R.; Sonnemann, S. Waldbaustrategien unter sich ändernden Umweltbedingungen–Leitbilder, Zielsystem und Waldentwicklungstypen. Wald. Landsch. Nat. 2009, 8, 71–88. [Google Scholar]
  6. Kölling, C. Nichtheimische Baumarten—Alternativen im klimagerechten Waldumbau? LWF Aktuell 2013, 96, 4–11. [Google Scholar]
  7. Stratmann, J.; Warth, H. Die Roteiche als Alternative zur Eiche oder Buche in Nordwestdeutschland. Allg. Forstz. 1987, 42, 40–41. [Google Scholar]
  8. Schmitz, F.; Polley, H.; Hennig, P.; Kroiher, F.; Marks, A.; Riedel, T.; Schmidt, U.; Schwitzgebel, F.; Stauber, T. Der Wald in Deutschland. Ausgewählte Ergebnisse der dritten Bundeswaldinventur. Bonn. 2014. Available online: https://www.bundeswaldinventur.de/fileadmin/SITE_MASTER/content/Dokumente/Downloads/BMEL_Wald_Broschuere.pdf (accessed on 21 May 2018).
  9. Sander, I.L. Quercus rubra L. Northern Red Oak. In Silvics of North America: 1. Conifers; 2. Hardwoods: Agricultural Handbook 654; Burns, R.M., Honkala, B.H., Eds.; Technical Coordinators; USDA, Forest Service: Washington, DC, USA, 1990; pp. 727–733. [Google Scholar]
  10. Leibundgut, H. Über die waldbauliche Behandlung der Eiche. Schweiz. Zeits. Forstwes. 1945, 96, 49–58. [Google Scholar]
  11. Mosandl, R.; Kateb, H.; Ecker, J. Untersuchungen zur Behandlung von jungen Eichenbeständen. Forstw. Cbl. 1991, 110, 358–370. [Google Scholar] [CrossRef]
  12. Block, J.; Schuck, J.; Seifert, T. Einfluss der waldbaulichen Behandlung und der Holznutzung auf den Nährstoffhaushalt von Traubeneichenökosystemen. In Eiche im Pfälzerwald: Publications of the Research Institute of Forest Ecology and Forestry Rhineland-Palatinate; Dong, P.H., Ed.; Research Institute for Forest Ecology and Forestry Rhineland-Palatinate: Palatinate, Germany, 2007; pp. 117–150. [Google Scholar]
  13. Sondermann. Changes in Hardwood Growing-Stock Tree Grades; Research Paper NE-608; US Department of Agriculture, Forest Service, Northeastern Forest Experiment Station: Broomall, PA, USA, 1987; p. 608.
  14. Dey, D.C.; Parker, W.C. Regeneration of Red Oak (Quercus Rubra L.) Using Shelterwood Systems: Ecophysiology, Silviculture and Management Recommandations; Forest Research Information Report No. 59; Ontario Forest Research Institute: Ontario, CA, USA, 1996; ISBN 0-7778-4863-5. [Google Scholar]
  15. Dey, D.C.; Royo, A.A.; Brose, P.H.; Hutchinson, T.F.; Spetich, M.A.; Stoleson, S.H. An ecologically based approach to oak silviculture_A synthesis of 50 years of oak ecosystem research in North America. Rev. Colomb. For. 2010, 13, 201–222. [Google Scholar]
  16. Du Cros, E.T. The french approach to broadleaved silviculture. Ir. For. 1987, 44, 116–126. [Google Scholar]
  17. Rédei, K.; Csiha, I.; Keserû, Z.; Rásó, J.; Gyôri, J. Management of red oak (Quercus rubra L.) stands in the Nyírség forest region (Eastern-Hungary). Hung. Agric. Res. 2010, 3, 13–17. [Google Scholar]
  18. Klemmt, H.-J.; Neubert, M.; Falk, W. Das Wachstum der Roteiche im Ver- gleich zu den einheimischen Eichen. LWF Aktuell 2013, 97, 28–31. [Google Scholar]
  19. Bauer, F. Die Roteiche; JD Sauerländer’s Vertrag: Frankfurt, Germany, 1953. [Google Scholar]
  20. Göhre, K.; Wagenknecht, E. Die Roteiche und ihr Holz; Deutscher Bauernverlag: Berlin, Germany, 1955. [Google Scholar]
  21. Seidel, J.; Kenk, G. Wachstum und Wertleistung der Eichenarten in Baden-Württemberg. AFZ-Der Wald 2003, 1, 28–31. [Google Scholar]
  22. Nagel, R. Roteiche Quercus rubra L. In Potenziale und Risiken eingeführter Baumarten; Vor, T., Spellmann, H., Bolte, A., Ammer, C., Eds.; Universitätsverlag Göttingen: Göttingen, Germany, 2015; pp. 219–267. ISBN 9783863952402. [Google Scholar]
  23. Watt, P.J.; Donoghue, D.N.M. Measuring forest structure with terrestrial laser scanning. Int. J. Remote Sens. 2007, 26, 1437–1446. [Google Scholar] [CrossRef]
  24. Newnham, G.J.; Armston, J.D.; Calders, K.; Disney, M.I.; Lovell, J.L.; Schaaf, C.B.; Strahler, A.H.; Danson, F.M. Terrestrial Laser Scanning for Plot-Scale Forest Measurement. Curr. For. Rep. 2015, 1, 239–251. [Google Scholar] [CrossRef] [Green Version]
  25. Seidel, D. A holistic approach to determine tree structural complexity based on laser scanning data and fractal analysis. Ecol. Evol. 2018, 8, 128–134. [Google Scholar] [CrossRef] [PubMed]
  26. Seidel, D.; Ehbrecht, M.; Dorji, Y.; Jambay, J.; Ammer, C.; Annighöfer, P. Identifying architectural characteristics that determine tree structural complexity. Trees 2019, 33, 911–919. [Google Scholar] [CrossRef]
  27. Höwler, K.; Annighöfer, P.; Ammer, C.; Seidel, D. Competition improves quality-related external stem characteristics of Fagus sylvatica. Can. J. For. Res. 2017, 47, 1603–1613. [Google Scholar] [CrossRef]
  28. Simonse, M.; Aschoff, T.; Spiecker, H.; Thies, M. Automatic determination of forest inventory parameters using terrestrial laser scanning. In Proceedings of the Scandlaser Scientific Workshop on Airborne Laser Scanning of Forests; Hyyppä, J., Nesset, E., Olsson, H., Granqvist Pahlén, T., Reese, H., Eds.; Department of Forest Resource Management and Geomatics, Swedish University of Agricultural Sciences: Umeá, Sweden, 2003; pp. 252–258. [Google Scholar]
  29. Hopkinson, C.; Chasmer, L.; Young-Pow, C.; Treitz, P. Assessing forest metrics with a ground-based scanning lidar. Can. J. For. Res. 2004, 34, 573–583. [Google Scholar] [CrossRef] [Green Version]
  30. Seidel, D.; Schall, P.; Gille, M.; Ammer, C. Relationship between tree growth and physical dimensions of Fagus sylvatica crowns assessed from terrestrial laser scanning. iForest 2015, 8, 735–742. [Google Scholar] [CrossRef]
  31. Raumonen, P.; Kaasalainen, M.; Åkerblom, M.; Kaasalainen, S.; Kaartinen, H.; Vastaranta, M.; Holopainen, M.; Disney, M.; Lewis, P. Fast Automatic Precision Tree Models from Terrestrial Laser Scanner Data. Remote Sens. 2013, 5, 491–520. [Google Scholar] [CrossRef] [Green Version]
  32. Kretschmer, U.; Kirchner, N.; Morhart, C.; Spiecker, H. A new approach to assessing tree stem quality characteristics using terrestrial laser scans. Silva Fenn. 2013, 47, 1071. [Google Scholar] [CrossRef]
  33. Höwler, K.; Vor, T.; Seidel, D.; Annighöfer, P.; Ammer, C. Analyzing effects of intra- and interspecific competition on timber quality attributes of Fagus sylvatica L.—From quality assessments on standing trees to sawn boards. Eur. J. For. Res. 2019, 138, 327–343. [Google Scholar] [CrossRef]
  34. Seidel, D.; Leuschner, C.; Müller, A.; Krause, B. Crown plasticity in mixed forests—Quantifying asymmetry as a measure of competition using terrestrial laser scanning. For. Ecol. Manag. 2011, 261, 2123–2132. [Google Scholar] [CrossRef]
  35. Bayer, D.; Seifert, S.; Pretzsch, H. Structural crown properties of Norway spruce (Picea abies [L.] Karst.) and European beech (Fagus sylvatica [L.]) in mixed versus pure stands revealed by terrestrial laser scanning. Trees 2013, 27, 1035–1047. [Google Scholar] [CrossRef]
  36. Metz, J.; Seidel, D.; Schall, P.; Scheffer, D.; Schulze, E.-D.; Ammer, C. Crown modeling by terrestrial laser scanning as an approach to assess the effect of aboveground intra- and interspecific competition on tree growth. For. Ecol. Manag. 2013, 310, 275–288. [Google Scholar] [CrossRef]
  37. Juchheim, J.; Annighöfer, P.; Ammer, C.; Calders, K.; Raumonen, P.; Seidel, D. How management intensity and neighborhood composition affect the structure of beech (Fagus sylvatica L.) trees. Trees 2017, 31, 1723–1735. [Google Scholar] [CrossRef]
  38. Pettenkofer, T.; Burkardt, K.; Ammer, C.; Vor, T.; Finkeldey, R.; Müller, M.; Krutovsky, K.; Vornam, B.; Leinemann, L.; Gailing, O. Genetic diversity and differentiation of introduced red oak (Quercus rubra) in Germany in comparison with reference native North American populations. Eur. J. For. Res. 2019, 138, 275–285. [Google Scholar] [CrossRef]
  39. DWD Climate Data Center (CDC). Jahressumme der Raster der monatlichen Niederschlagshöhe für Deutschland unter Berücksichtigung der Klimatologie. 1988–2018. Available online: https://opendata.dwd.de/climate_environment/CDC/grids_germany/annual/precipitation/ (accessed on 27 September 2019).
  40. DWD Climate Data Center (CDC). Jahresmittel der Raster der monatlich gemittelten Lufttemperatur (2m) für Deutschland. 1988–2018. Available online: https://opendata.dwd.de/climate_environment/CDC/grids_germany/annual/air_temperature_mean/ (accessed on 27 August 2019).
  41. DWD Climate Data Center (CDC). Jährliche Raster von Stiel-Eiche-Herbstliche Blattverfärbung in Deutschland. 1992–2018, Version 0.x. Available online: https://opendata.dwd.de/climate_environment/CDC/grids_germany/annual/phenology/STEBV/ (accessed on 27 September 2019).
  42. DWD Climate Data Center (CDC). Jährliche Raster von Stiel-Eiche-Beginn der Blattentfaltung in Deutschland. 1992–2018, Version 0.x. Available online: https://opendata.dwd.de/climate_environment/CDC/grids_germany/annual/phenology/STEBO/ (accessed on 27 September 2019).
  43. Hegyi, F. A simulation model for managing jack-pine stands. In Growth Models for Tree and Stand Simulations; Fries, J., Ed.; Royal College of Forest: Stockholm, Sweden, 1974; pp. 74–90. [Google Scholar]
  44. Van der Zande, D.; Jonckheere, I.; Stuckens, J.; Verstraeten, W.W.; Coppin, P. Sampling design of ground-based lidar measurements of forest canopy structure and its effect on shadowing. Can. J. Remote Sens. 2014, 34, 526–538. [Google Scholar] [CrossRef]
  45. Seidel, D.; Ammer, C. Efficient measurements of basal area in short rotation forests based on terrestrial laser scanning under special consideration of shadowing. iForest 2014, 7, 227–232. [Google Scholar] [CrossRef] [Green Version]
  46. Piboule, A.; Krebs, M.; Esclatine, L.; Hervé, J.-C. (Eds.) Computree: A Collaborative Platform for Use of Terrestrial Lidar in Dendrometry. In Proceedings of the International IUFRO Conference MeMoWood, Nancy, France, 1–4 October 2013. [Google Scholar]
  47. Hackenberg, J.; Spiecker, H.; Calders, K.; Disney, M.; Raumonen, P. SimpleTree—An Efficient Open Source Tool to Build Tree Models from TLS Clouds. Forests 2015, 6, 4245–4294. [Google Scholar] [CrossRef]
  48. R Core Team. R: A Language and Environment for Statistical Computing; R Foundation for Statistical Computing: Vienna, Austria, 2018. [Google Scholar]
  49. Wasserstein, R.L.; Schirm, A.L.; Lazar, N.A. Moving to a World Beyond “p < 0.05”. Am. Stat. 2019, 73, 1–19. [Google Scholar] [CrossRef]
  50. Roloff, A. Baumkronen. Verständnis und Praktische Bedeutung eines Komplexen Naturphänomens; Eugen Ulmer: Stuttgart, Germany, 2001. [Google Scholar]
  51. Purves, D.W.; Lichstein, J.W.; Pacala, S.W. Crown plasticity and competition for canopy space: A new spatially implicit model parameterized for 250 North American tree species. PLoS ONE 2007, 2, e870. [Google Scholar] [CrossRef] [PubMed]
  52. Thorpe, H.C.; Astrup, R.; Trowbridge, A.; Coates, K.D. Competition and tree crowns: A neighborhood analysis of three boreal tree species. For. Ecol. Manag. 2010, 259, 1586–1596. [Google Scholar] [CrossRef]
  53. Dieler, J.; Pretzsch, H. Morphological plasticity of European beech (Fagus sylvatica L.) in pure and mixed-species stands. For. Ecol. Manag. 2013, 295, 97–108. [Google Scholar] [CrossRef]
  54. Mäkinen, H.; Hein, S. Effect of wide spacing on increment and branch properties of young Norway spruce. Eur. J. For. Res. 2006, 125, 239–248. [Google Scholar] [CrossRef]
  55. Pretzsch, H.; Schütze, G. Crown allometry and growing space efficiency of Norway spruce (Picea abies L. Karst.) and European beech (Fagus sylvatica L.) in pure and mixed stands. Plant Biol. (Stuttg.) 2005, 7, 628–639. [Google Scholar] [CrossRef] [PubMed]
  56. Brown, P.L.; Doley, D.; Keenan, R.J. Stem and crown dimensions as predictors of thinning responses in a crowded tropical rainforest plantation of Flindersia brayleyana F. Muell. For. Ecol. Manag. 2004, 196, 379–392. [Google Scholar] [CrossRef]
  57. Lang, A.C.; Härdtle, W.; Bruelheide, H.; Geißler, C.; Nadrowski, K.; Schuldt, A.; Yu, M.; von Oheimb, G. Tree morphology responds to neighbourhood competition and slope in species-rich forests of subtropical China. For. Ecol. Manag. 2010, 260, 1708–1715. [Google Scholar] [CrossRef]
  58. Mäkelä, A.; Vanninen, P. Impacts of size and competition on tree form and distribution of aboveground biomass in Scots pine. Can. J. For. Res. 1998, 28, 216–227. [Google Scholar] [CrossRef]
  59. Prescott, C.E. The influence of the forest canopy on nutrient cycling. Tree Physiol. 2002, 22, 1193–1200. [Google Scholar] [CrossRef] [Green Version]
  60. Hardiman, B.S.; Gough, C.M.; Halperin, A.; Hofmeister, K.L.; Nave, L.E.; Bohrer, G.; Curtis, P.S. Maintaining high rates of carbon storage in old forests: A mechanism linking canopy structure to forest function. For. Ecol. Manag. 2013, 298, 111–119. [Google Scholar] [CrossRef]
  61. Jucker, T.; Bouriaud, O.; Coomes, D.A.; Baltzer, J. Crown plasticity enables trees to optimize canopy packing in mixed-species forests. Funct. Ecol. 2015, 29, 1078–1086. [Google Scholar] [CrossRef]
  62. Assmann, E. The Principles of Forest Yield Study; Pergamon Press Ltd.: Oxford, UK, 1970. [Google Scholar]
  63. Richter, C. Holzmerkmale Beschreibung der Merkmale, Ursachen, Vermeidung, Auswirkungen auf die Verwendung des Holzes, Technologische Anpassung; DRW: Leinfelden-Echterdingen, Germany, 2010. [Google Scholar]
  64. Ballard, L.A.; Long, J.N. Influence of stand density on log quality of lodgepole pine. Can. J. For. Res. 1988, 18, 911–916. [Google Scholar] [CrossRef]
  65. Gottschalk, K.W. Stem quality of oak in 15-year-old stands: Influence of species within harvesting treatment and fencing. In Advances in Research in Intermediate Oak Stands; Spiecker, H., Rogers, R., Somogyi, Z., Eds.; Institute for Forest Growth, Albert-Ludwigs-University of Freiburg: Freiburg, Germany, 1997; pp. 85–97. [Google Scholar]
  66. Mäkinen, H. Effect of stand density on radial growth of branches of Scots pine in southern and central Finland. Can. J. For. Res. 1999, 29, 1216–1224. [Google Scholar] [CrossRef]
  67. Mäkinen, H. Effect of stand density on the branch d, evelopment of silver birch (Betula pendula Roth) in central Finland. Trees 2002, 16, 346–353. [Google Scholar] [CrossRef]
  68. Sondermann, D.L. Quality Response of Even-Aged 80 Year Old White Oak Trees after Thinning; Research Paper NE-543; US Department of Agriculture, Forest Service, Northeastern Forest Experiment Station: Broomall, PA, USA, 1984; 6p.
  69. Maintaining Biodiversity in Forest Ecosystems; Hunter, M.L., Jr. (Ed.) Cambridge University Press: New York, NY, USA, 1999. [Google Scholar]
  70. Fischer, H. Qualitätserziehung bei jungen Traubeneichen (Quercus petraea Liebl.) allein durch innerartlicher Konkurrenz. Forst Holz 2000, 55, 377–382. [Google Scholar]
  71. RVR. Rahmenvereinbarung für den Rohholzhandel in Deutschland RVR. 2015. Available online: http://www.rvr-deutschland.de/docs/dynamisch/8302/rvr_gesamtdokument_2.auflage_stand_oktober_2015.pdf (accessed on 27 May 2019).
  72. Schulz, H. Auswirkungen von Rückeschäden an jungen Buchen und Edellaubhölzern. Holzforschung 1973, 27, 42–47. [Google Scholar] [CrossRef]
  73. Hassler, C.C.; Grushecky, S.T. An Assessment of Following Timber Harvests in West Virginia. North. J. Appl. For. 1999, 16, 191–196. [Google Scholar] [CrossRef]
  74. Akay, A.E.; Yilmaz, M.; Tonguc, F. Impact of Mechanized Harvesting Machines on Forest Ecosystem: Residual Stand Damage. J. Appl. Sci. 2006, 6, 2414–2419. [Google Scholar] [Green Version]
  75. Seablom, T.J.; Reed, D.D. Assessment of Factors Contributing to Residual Tree Damage from Mechanized Harvesting in Northern Hardwoods. North. J. Appl. For. 2005, 22, 124–131. [Google Scholar] [CrossRef] [Green Version]
  76. Zingg, A.; Ramp, B. Wachstum und Stammqualität in reinen und gemischten Buchenbeständen. Tagungsbericht, Jahrestagung 1997 des Deutschen Verbandes Forstlicher Forschungsanstalten 2003, 152–164. [Google Scholar]
  77. Dean, C. Calculation of wood volume and stem taper using terrestrial single-image close-range photogrammetry and contemporary software tools. Silva Fenn. 2003, 37, 359–380. [Google Scholar] [CrossRef]
  78. Bertness, M.D.; Callaway, R. Positive interactions in communities. Trends Ecol. Evol. 1994, 9, 191–193. [Google Scholar] [CrossRef]
  79. Maestre, F.T.; Callaway, R.M.; Valladares, F.; Lortie, C.J. Refining the stress-gradient hypothesis for competition and facilitation in plant communities. J. Ecol. 2009, 97, 199–205. [Google Scholar] [CrossRef]
  80. Sterba, H.; Vospernik, S.; Söderbergh, I.; Ledermann, T. Harvesting Rules and Modules for Predicting Commercial Timber Assortments. In Sustainable Forest Management: Growth Models for Europe; Hasenauer, H., Ed.; Springer: Berlin/Heidelberg, Germany, 2006; ISBN 978-3-540-31304-5. [Google Scholar]
  81. Sonderman, D.L.; Rast, E.D. Effect of Thinning on Mixed-Oak Stem Quality; Northeastern Forest Experiment Station: Broomall, PA, USA, 1988.
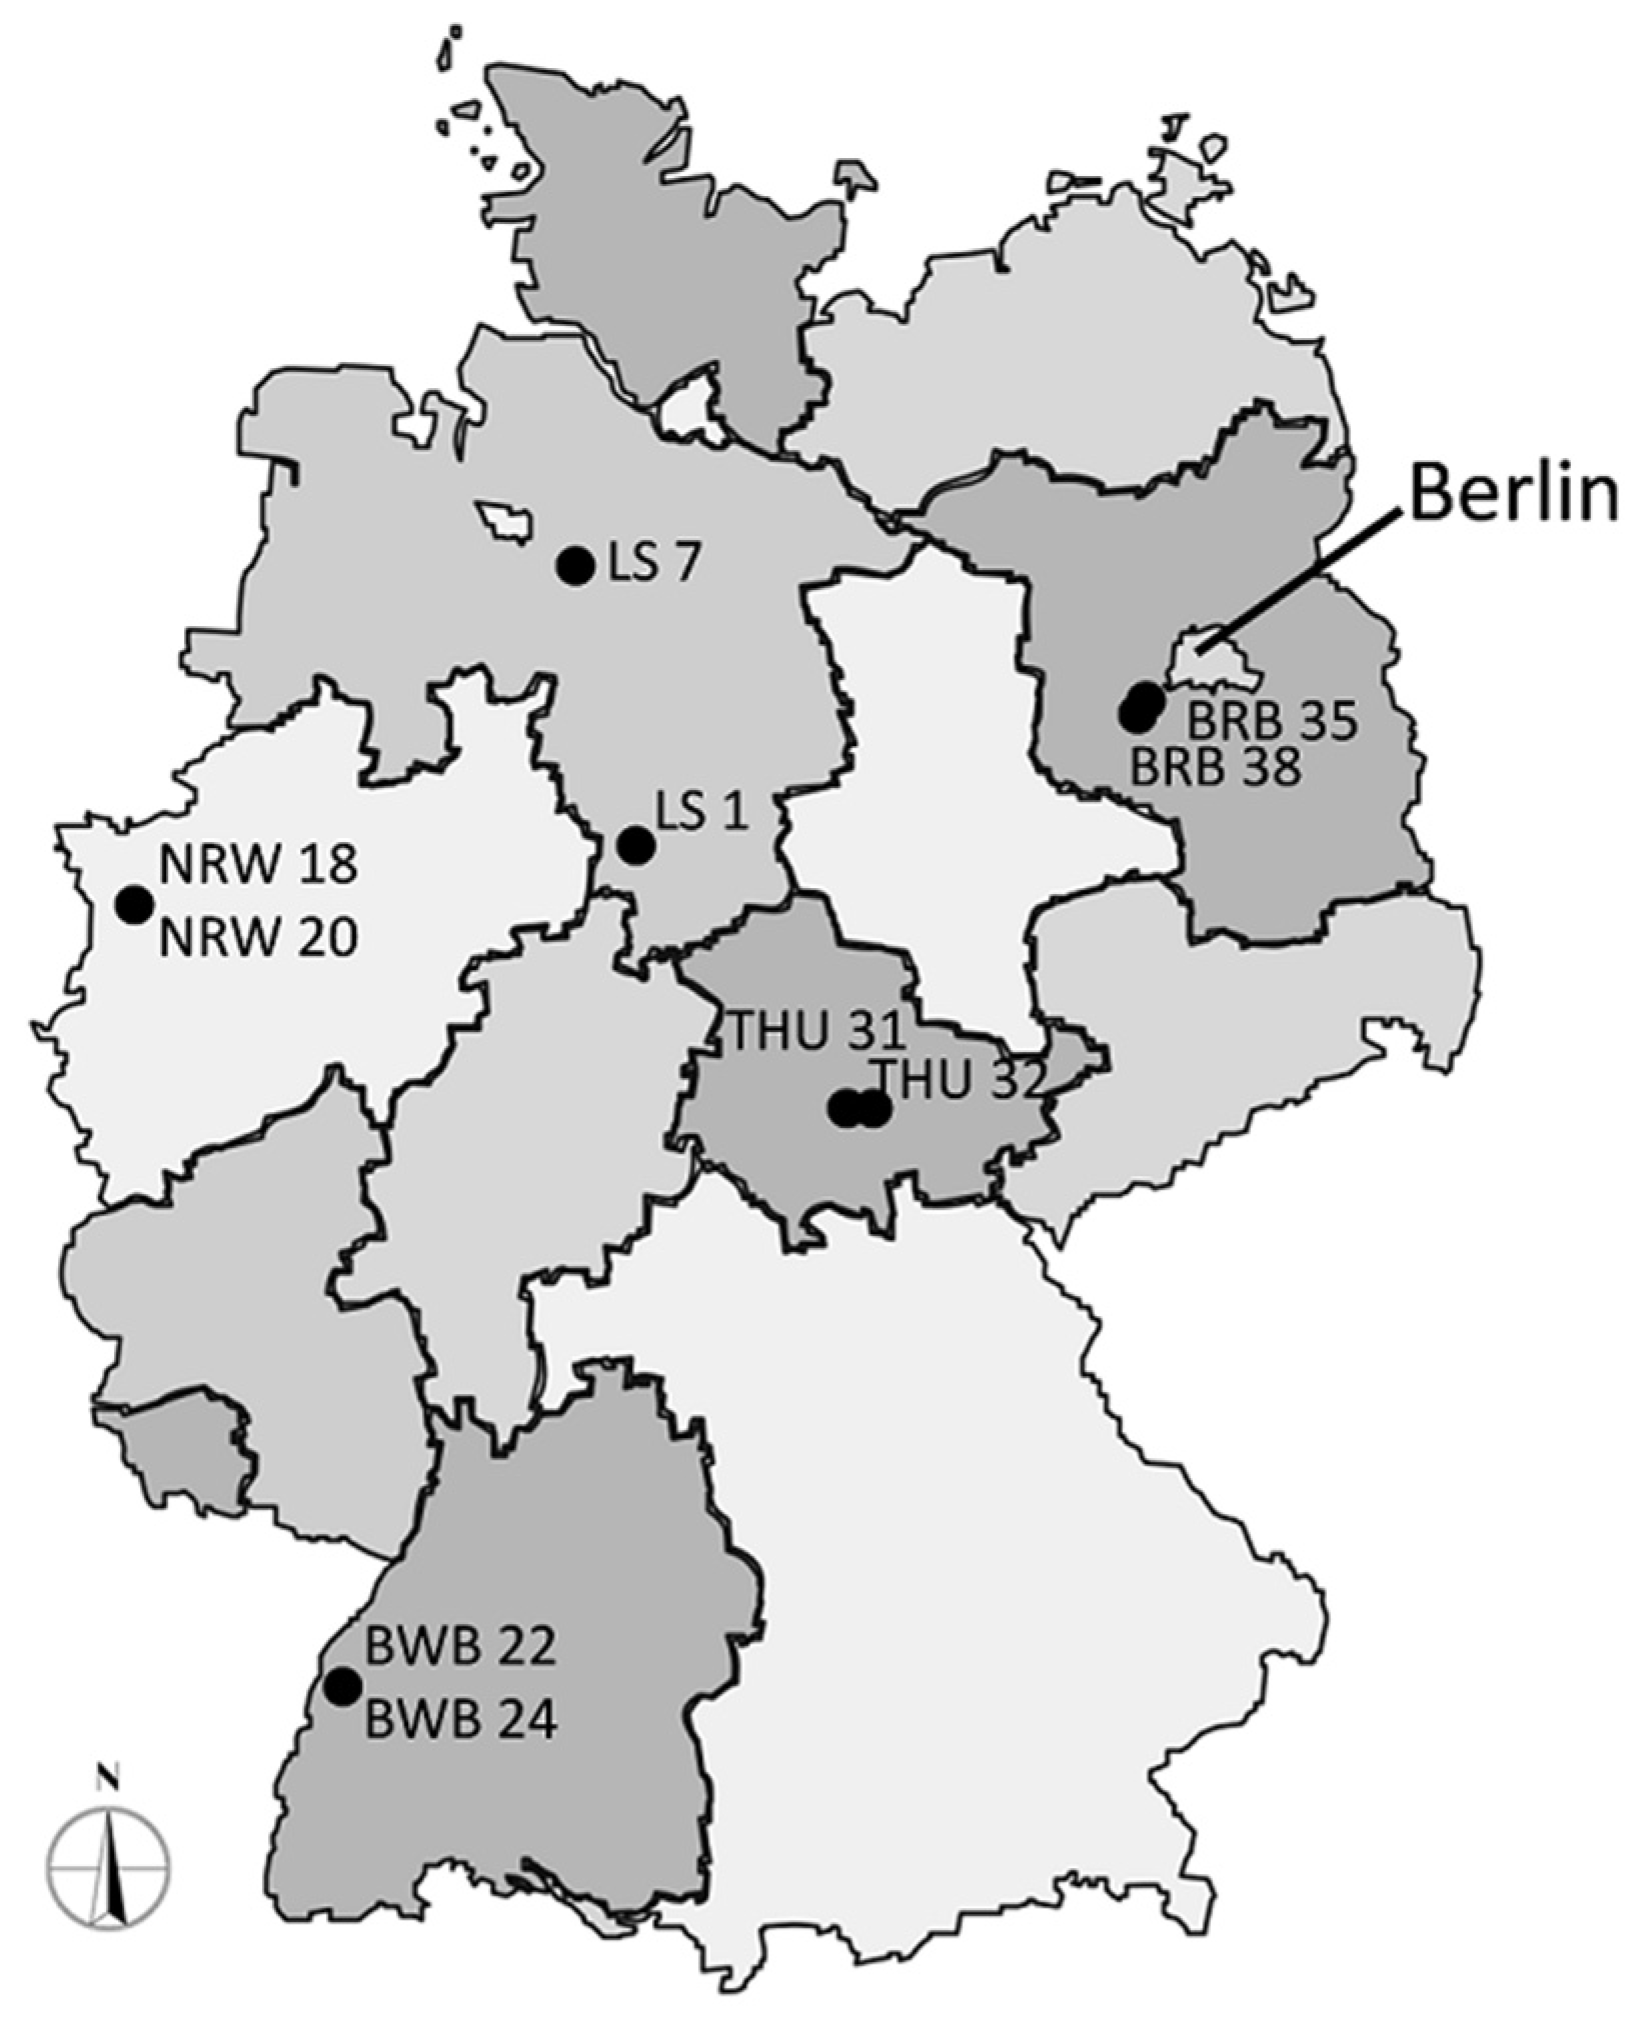
Figure 1. Location of the ten study sites in Germany. Stands indicated with only one marker within a region are located very close together. Lower Saxony (LS), North Rhine-Westphalia (NRW), Baden-Wuerttemberg (BWB), Thuringia (THU), Brandenburg (BRB).
Forests 10 00846 g001
Figure 2. Graphical visualization of the most important tree characteristics analyzed for each subject tree: CV: Crown volume (m3), CRmean: Mean crown radius (m), max area: Maximum crown area (m2), BL: Branch length (m), MBA1st: Mean branch angle first order (°), MBA2nd: Mean branch angle second-order (°), CSA: Crown surface area (m2), CL: Crown length (m), CBH: Crown base height (m).
Forests 10 00846 g002
Figure 3. Linear models of competition intensity (Hegyi-Index) and the stem quality attributes bark anomalies (Bark anom.) ((a) counts/m and (c) counts/m2) and stem non-circularity (SNC) ((b) in m) along the stem sections 0 m–4 m (Sec: 0–4), 4 m–8 m (Sec: 4–8), 8 m–12 m (Sec: 8–12) as cumulative values for all 100 tested trees.
Forests 10 00846 g003
Figure 4. Relationship between competition intensity (Hegyi-Index) and the crown characteristics: (a) Crown volume (CV), (b) crown surface area (CSA), (c) mean crown radius (CRmean), (d) maximum crown area (max area), (e) sum of the branch length (BLsum), (f) maximum branch length (BLmax), and (g) crown length (CL).
Forests 10 00846 g004
Table 1. Main characteristics of the ten study sites and stands dominated by northern red oak in Germany: Lower Saxony (LS), North Rhine-Westphalia (NRW), Baden-Wuerttemberg (BWB), Thuringia (THU), Brandenburg (BRB).
Stand InformationLSNRWBWBTHUBRB
DistrictDasselRotenburgNiederrhein NiederrheinOffenburgOffenburgNeustadtJena-HolzlandPotsdamPotsdam
DepartmentSievershausenDiensthopLeuchtLeuchtSchutterwaldSchutterwaldStrößwitzWolfersdorfGüterfeldeGüterfelde
PlotID171820222431323538
Area size (ha)1.00.90.81.30.81.01.01.11.01.0
latitude51°46′47.34″ N52°56′46.74″ N51°32′14.11″ N51°32′19.68″ N48°27′13.11″ N48°27′9.64″ N50°45′37.95″ N50°46′19.90″ N52°27′13.29″ N52°22′57.95″ N
longitude9°35′25.30″ E9°21′58.43″ E6°29′26.77″ E6°29′50.10″ E7°51′32.91″ E7°51′37.01″ E11°43′31.84″ E11°38′27.95″ E13°4′37.92″ E13°5′43.83″ E
Genetic Hap. *AA, B, CA, B, CA, E, BA, C, E, BA, C, B AA, B, CA, C, OA, B
soil textureloessic loamloamy sandgravelly-, loamy sandloamy sandsilty loamsilty loamsandsandsandsandy cover layers over boulder clay
Last thinning intervention20132017201720172013/20142013/20142013201520142007
Crown thinning (m3, * ha−1)33.535252530–4030–40303036N/A
MPV (mm) **468346354359397397350341291284
TMV (°C) **13.615.816.916.818.018.015.815.817.017.0
LVP (days) **154173181181185185167168174174
Elevation(m.a.s.l.)5246968721481483923724738
Yield class **3.32.21.61.60.80.60.61.22.81.6
Age (years)66675868676057826367
mean stand height (m)18.422.723.524.827.627.326.927.319.924.4
mean DBH (cm) **20.320.628.127.720.322.82627.818.621.8
Tree density (trees/area size)706662334447583550415673731614
BA (m2) **31.834.122.934.729.235.525.748.122.025.7
* Genetic Hap.: Haplotypes were assessed by Pettenkofer et al. [38] in the same northern red oak stands prior to our study, ** MPV: Mean precipitation during the vegetation period (May–September) [39], ** TMV: Mean temperature during the vegetation period (May–September) [40], LVP: Length of the vegetation period (days), calculated based on the number of days between leaf emergence and leaf discoloration of Quercus robur (information for Quercus rubra L. was lacking) of the last 25 years provided by the Climate Data Centre [41,42], yield-class: Calculated based on the yield table for red oak of Bauer [19], DBH: Mean diameter at breast height, BA: Basal area, calculated as the sum of the cross-sectional areas (at breast height) of all stems ≥7 cm in DBH.