Article

Contrasting Rhizospheric and Heterotrophic Components of Soil Respiration during Growing and Non-Growing Seasons in a Temperate Deciduous Forest

Center for Ecological Research, Northeast Forestry University, Harbin 150040, China
*
Author to whom correspondence should be addressed.
Forests 2019, 10(1), 8; https://doi.org/10.3390/f10010008
Submission received: 27 November 2018 / Revised: 19 December 2018 / Accepted: 21 December 2018 / Published: 25 December 2018
(This article belongs to the Special Issue Rhizosphere Dynamics under Global Change)

Abstract

:
The contributions of heterotrophic respiration (RH) to total soil respiration (RS) for the non-growing season, growing season, and annual period are 84.8%, 60.7%, and 63.3%, respectively.Few studies have partitioned RS into its rhizospheric (RR) and heterotrophic components throughout the year in northern forest ecosystems. Our objectives were to quantify the contributions of non-growing season and heterotrophic respiration. We conducted a trenching experiment to quantify RR and RH in a temperate deciduous forest in Northeast China over two years using chamber methods. Temperature sensitivities (Q10) for RS and for RH were both much higher in the non-growing season (November to April) than those in the growing season. The Q10 for RS was higher than Q10 for RH in both seasons, indicating a higher temperature sensitivity of roots versus microorganisms. Mean non-growing season RS, RH, and RR for the two years were 94, 79 and 14 g carbon (C) m−2, respectively, which contributed 10.8%, 14.5%, and 4.5% to the corresponding annual fluxes (869, 547 and 321 g C m−2 year−1, respectively). The contributions of RH to RS for the non-growing season, growing season, and annual period were 84.8%, 60.7%, and 63.3%, respectively. Using the same contribution of non-growing season RS to annual RS, to scale growing season measurements, to the annual scale would introduce significant biases on annual RH (−34 g C m−2 yr−1 or −6%) and RR (16 g C m−2 yr−1 or 5%).We concluded that it was important to take non-growing season measurements in terms of accurately partitioning RS components in northern forests.

1. Introduction

Soil respiration (RS) is estimated to be 83–108 Pg carbon (C) yr−1 globally [1,2,3], which consumes 67%–88% of the terrestrial gross primary production (123 Pg C yr−1) [4]. In addition, RS is potentially an important positive feedback for climate warming [5,6,7]. Thus, RS plays an essential role in global carbon cycling.
Soil respiration is overwhelmingly comprised of heterotrophic (RH; respiration by microbes and soil fauna) and rhizospheric (RR; respiration by roots, their associated mycorrhizal fungi, and other micro-organisms directly dependent on labile carbon compounds leaked from roots) components [8,9,10]. RR and RH may be driven by different mechanisms [8,11], and thus respond differently to environmental factors, both at given sites [8,12,13] and globally [14,15]. Partitioning RS is an important step for assessing plant physiology, C allocation, ecosystem C balance, and the climate feedback potential of changes in RS [5,15,16,17].
Most RS measurements in northern forests are limited in the growing season [18]. The lack of RS studies during the non-growing season is due not only to the misconception that there is little biological activity during this period, but also to the inherent difficulties associated with cold winter sampling over snowpack [19]. However, soil respiration has been shown to continue throughout the winter in a wide variety of northern or alpine ecosystems [18,20,21,22,23,24]. Studies which have integrated RH contribution to RS throughout an entire year or growing season show a mean value of 54% for the forest ecosystem [9].The relative contributions of RR and RH vary during the year [25,26,27,28,29,30,31,32]. In cold climates, the RH contribution is commonly lower than or similar to that of RR during the growing season, and higher during the dormant periods. However, few measurements quantified RH contribution during the winter, particularly for the snow-covered period in northern or alpine ecosystems [25,27,33,34].
There are several methods for partitioning RS, each with advantages and limitations [9,16,35,36]. The trenching experiment is the most popular method used in boreal and temperate forest ecosystems [35], because of its simplicity and low cost [9]. Soil respiration has been partitioned by the trenching method for six forest ecosystems in the Maoershan site during growing season [28], but no direct measurements were conducted during the non-growing season [24]. In this study, the trenching approach was used throughout two successive years in a broadleaved deciduous forest. We hypothesized that using a same value of root contribution as growing season measurements throughout annual cycles would introduce significant biases in the estimating of annual RS and its components.

2. Materials and Methods

2.1. Experimental Design and Field Measurements

This study was conducted at the Maoershan Forest Ecosystem Research Station of Northeast Forestry University, Heilongjiang Province, Northeast China (45°24′ N, 127°40′ E, 400 m a.s.l.). The climate is a continental monsoon climate with a windy and dry spring, a warm and humid summer, and a dry and cold winter. The mean (1989–2009) annual precipitation is 629 mm, and mean annual air temperature is 3.1 °C. The mean January and July air temperatures are −18.5 °C and 22.0 °C, respectively [24]. The broadleaved deciduous forest around the eddy flux tower was ~60-years old. The dominant tree species include Ulmus japonica Sarg., Fraxinus mandshurica Rupr., Betula platyphylla Suk., Populusdavidiana Dode, Juglans mandshurica Maxim., etc. [37]. The soil is a type of alfisol with a parent rock of granite.
Eight 20 m × 30 m plots were set up around the eddy flux tower in August 2007. We measured RS during the growing season for all plots, and three plots (plot number 2–4) for the non-growing season. The basic stand characteristics were given in Table 1.
Four 100-cm diameter trenched subplots were established in each plot by digging a trench (30 cm wide) around the outside boundary to a depth of 80 cm in October 2007. Trenches were lined with plastic sheets to prevent root entry and potential lateral CO2 transport [41], and refilled and packed carefully with the same soil. Eight polyvinyl chloride (PVC) collars (10.2 cm inside diameter, 6 cm height) were randomly placed for RS measurements in each plot, and one collar was installed in each trenched subplot for RH measurements.
Since May of 2008, soil surface CO2 effluxes for control plots (RS) and trenching subplots (RH) were measured using an LI-COR 6400 portable infrared gas analyzer (IRGA) (LI-COR 6400, LI-COR Inc., Lincoln, NE, USA) equipped with a dynamic chamber (LI-COR 6400-9, LI-COR Inc., Lincoln, NE, USA) bi-weekly to monthly during the growing season. The measurement protocol (three cycles based on a change of 5 μmol mol−1 CO2, subsequently averaged at each collar) was similar to that used in previous soil respiration studies at this site [28,42]. Soil temperatures at 5 cm depth (T5) and 10 cm depth (T10) was simultaneously measured by a digital thermocouple, and the soil volumetric water content at the top 10 cm depth was detected by a Time-Domain Reflectometry (CS620, Campbell Scientific, Logan, UT, USA).
During the non-growing season, other chamber methods were adopted to measure the RS and RT because of LI-COR 6400 failure at low temperatures. A dark static chamber method was used from December 2009 to April 2010. Four steel collars (40 cm wide × 50 cm length) were installed in October 2009 in each plot, and the other four collars were installed in the four trenched subplots. A small vent in the chamber was used to balance the air pressure inside and outside the chamber [43]. Before each measurement, the snow around the base was removed carefully to minimize disturbance of the snow over the base. The stainless-steel statistic chamber (40 cm wide ×50 cm length × 50 cm height) was fitted to the collarand sealed with adhesive tape. Then the snow was quickly refilled to minimize the potential CO2 pulse from the snow hollow around the chamber base and insulate the soil from the cold air. The chamber was covered by a specific white quilt to prevent heating by solar radiation. A small fan was used to mix the gas in the chamber. Fifty mL gas samples were collected using fine needle syringes 0, 10, 20, and 30 min following placement of the chamber on the base [44]. Snow depth (DS), T5, and T10 near each chamber were also measured with a ruler and a thermocouple, respectively. Samples were transferred to evacuated gaseous bags, which were stored at room temperature. The CO2 was measured with gas chromatography (7890A GC System, Agilent Technologies, Santa Clara, CA, USA) within three days. Fluxes were calculated from the linear rate of change in gas concentration, the chamber internal volume, and soil surface area [44].
During the period of December 2010 and April 2011, the RS, RH, T5, and T10 were measured using a LI-COR 8100 portable IRGA equipped with a LI-COR 8100-103survey chamber (LI-COR Inc., Lincoln, NE, USA). To avoid the lateral diffusion of CO2 [33], deep soil collars (determined by snow depth, as did in reference 18) were inserted into the soil surface and stabilized for at least 10 min before measuring the CO2 efflux. There were four control and four trench-treatment chambers in each plot. The DS was also measured with a ruler near each chamber of the control plot.
Continuous half-hour means of photosynthetically active radiation (PAR), air temperature (Ta), soil temperature at 5 cm (T5) and 10 cm (T10) depths, and water content at 10 cm depth (SWC10) were measured and recorded in dataloggers (CR1000, Campbell Scientific, Logan, UT, USA), which were equipped with PAR-LITE (Kipp and Zonen, Delft, the Netherlands) at 48 m [39], thermometers (model 107, Campbell Scientific, Logan, UT, USA), and FDRs (EasyAG 50, Sentek, Australia) beneath the flux tower, respectively.
Different methods were used to measure soil CO2 efflux in the growing and non-growing seasons, i.e., LI-6400 in the growing season, static chamber in the first winter, and LI-8100 in the second winter. We assume that the difference between methods could be ignored. According to Pumpanen et al. [45], the chambers could be sorted into three types: closed static chamber, closed dynamic chamber, and open dynamic chamber. The static chamber could underestimate CO2 efflux, mainly due to the rising concentration within the chamber headspace [45]. Therefore, we only used this technique in the winter, when CO2 concentration increases were very small due to the small flux (generally <0.8 μmol m−2 s−1). Previous studies verified that the LI-8100 and LI-6400 gave substantially similar results [46,47].

2.2. Data Analysis

Empirical models relating RS and RH to soil temperature and water content were developed for each plot, based on discrete measurements of RS and RH, soil temperature, and soil water content (SWC), as described in Wang et al. [28,42]. Logarithmic transformation of RS was needed to achieve linearity and homoscedasticity. A backward elimination procedure was performed to remove insignificant terms (α > 0.05). The form of the regression models is
ln(R) = a + b × T + c × SWC + d × T × SWC
where ln is natural logarithm; R represents RS or RH; T is the soil temperature; SWC is soil water content; and a, b, c, and d are regression coefficients.
The temperature responses of RS and RH were regressed by the log-transformed exponential equation
ln(R) = a + b × T
where R is RS or RH, and a and b are regression coefficients. Then the temperature coefficient (Q10) was calculated as [48]
Q10 = e10b
Based on a comparison of models with different predictors (Supplementary Materials), we used the T5 and SWC10 to model the growing seasonal fluxes, and the T5 for the non-growing season. The continuous T5 and SWC10 of the dataloggers were used to estimate the plot-specific T5 and SWC10 with simple linear models. Then the plot-specific T5 and SWC10 were used to drive the respiration models to get half-hour RS and RH [28,43]. The seasonal and annual fluxes were the time-integrations of the half-hour RS and RH values [24]. The difference in T5 and SWC10 between the treatments was tested by a paired t-test at the plot scale (taking the average for each plot and each year). The effect of the difference in SWC10 between the treatments was assessed by calculating annual flux in trenched plots (RH) with the SWC10 values in the control and trenched plots [49].Considering the diminishing root decomposition added by the trenching treatment [35], the measurements in the trenched plots were directly considered as RH. As a result, the RR was calculated as the difference between RS and RH.
In this paper, we report only the data in the last two climatic years for the three plots (numbers 2–4) to quantify the non-growing season contribution and root contribution. One reason was to avoid noncontinuous data, and the other was to minimize the effect of decomposition of newly dead roots after trenching [35].

3. Results

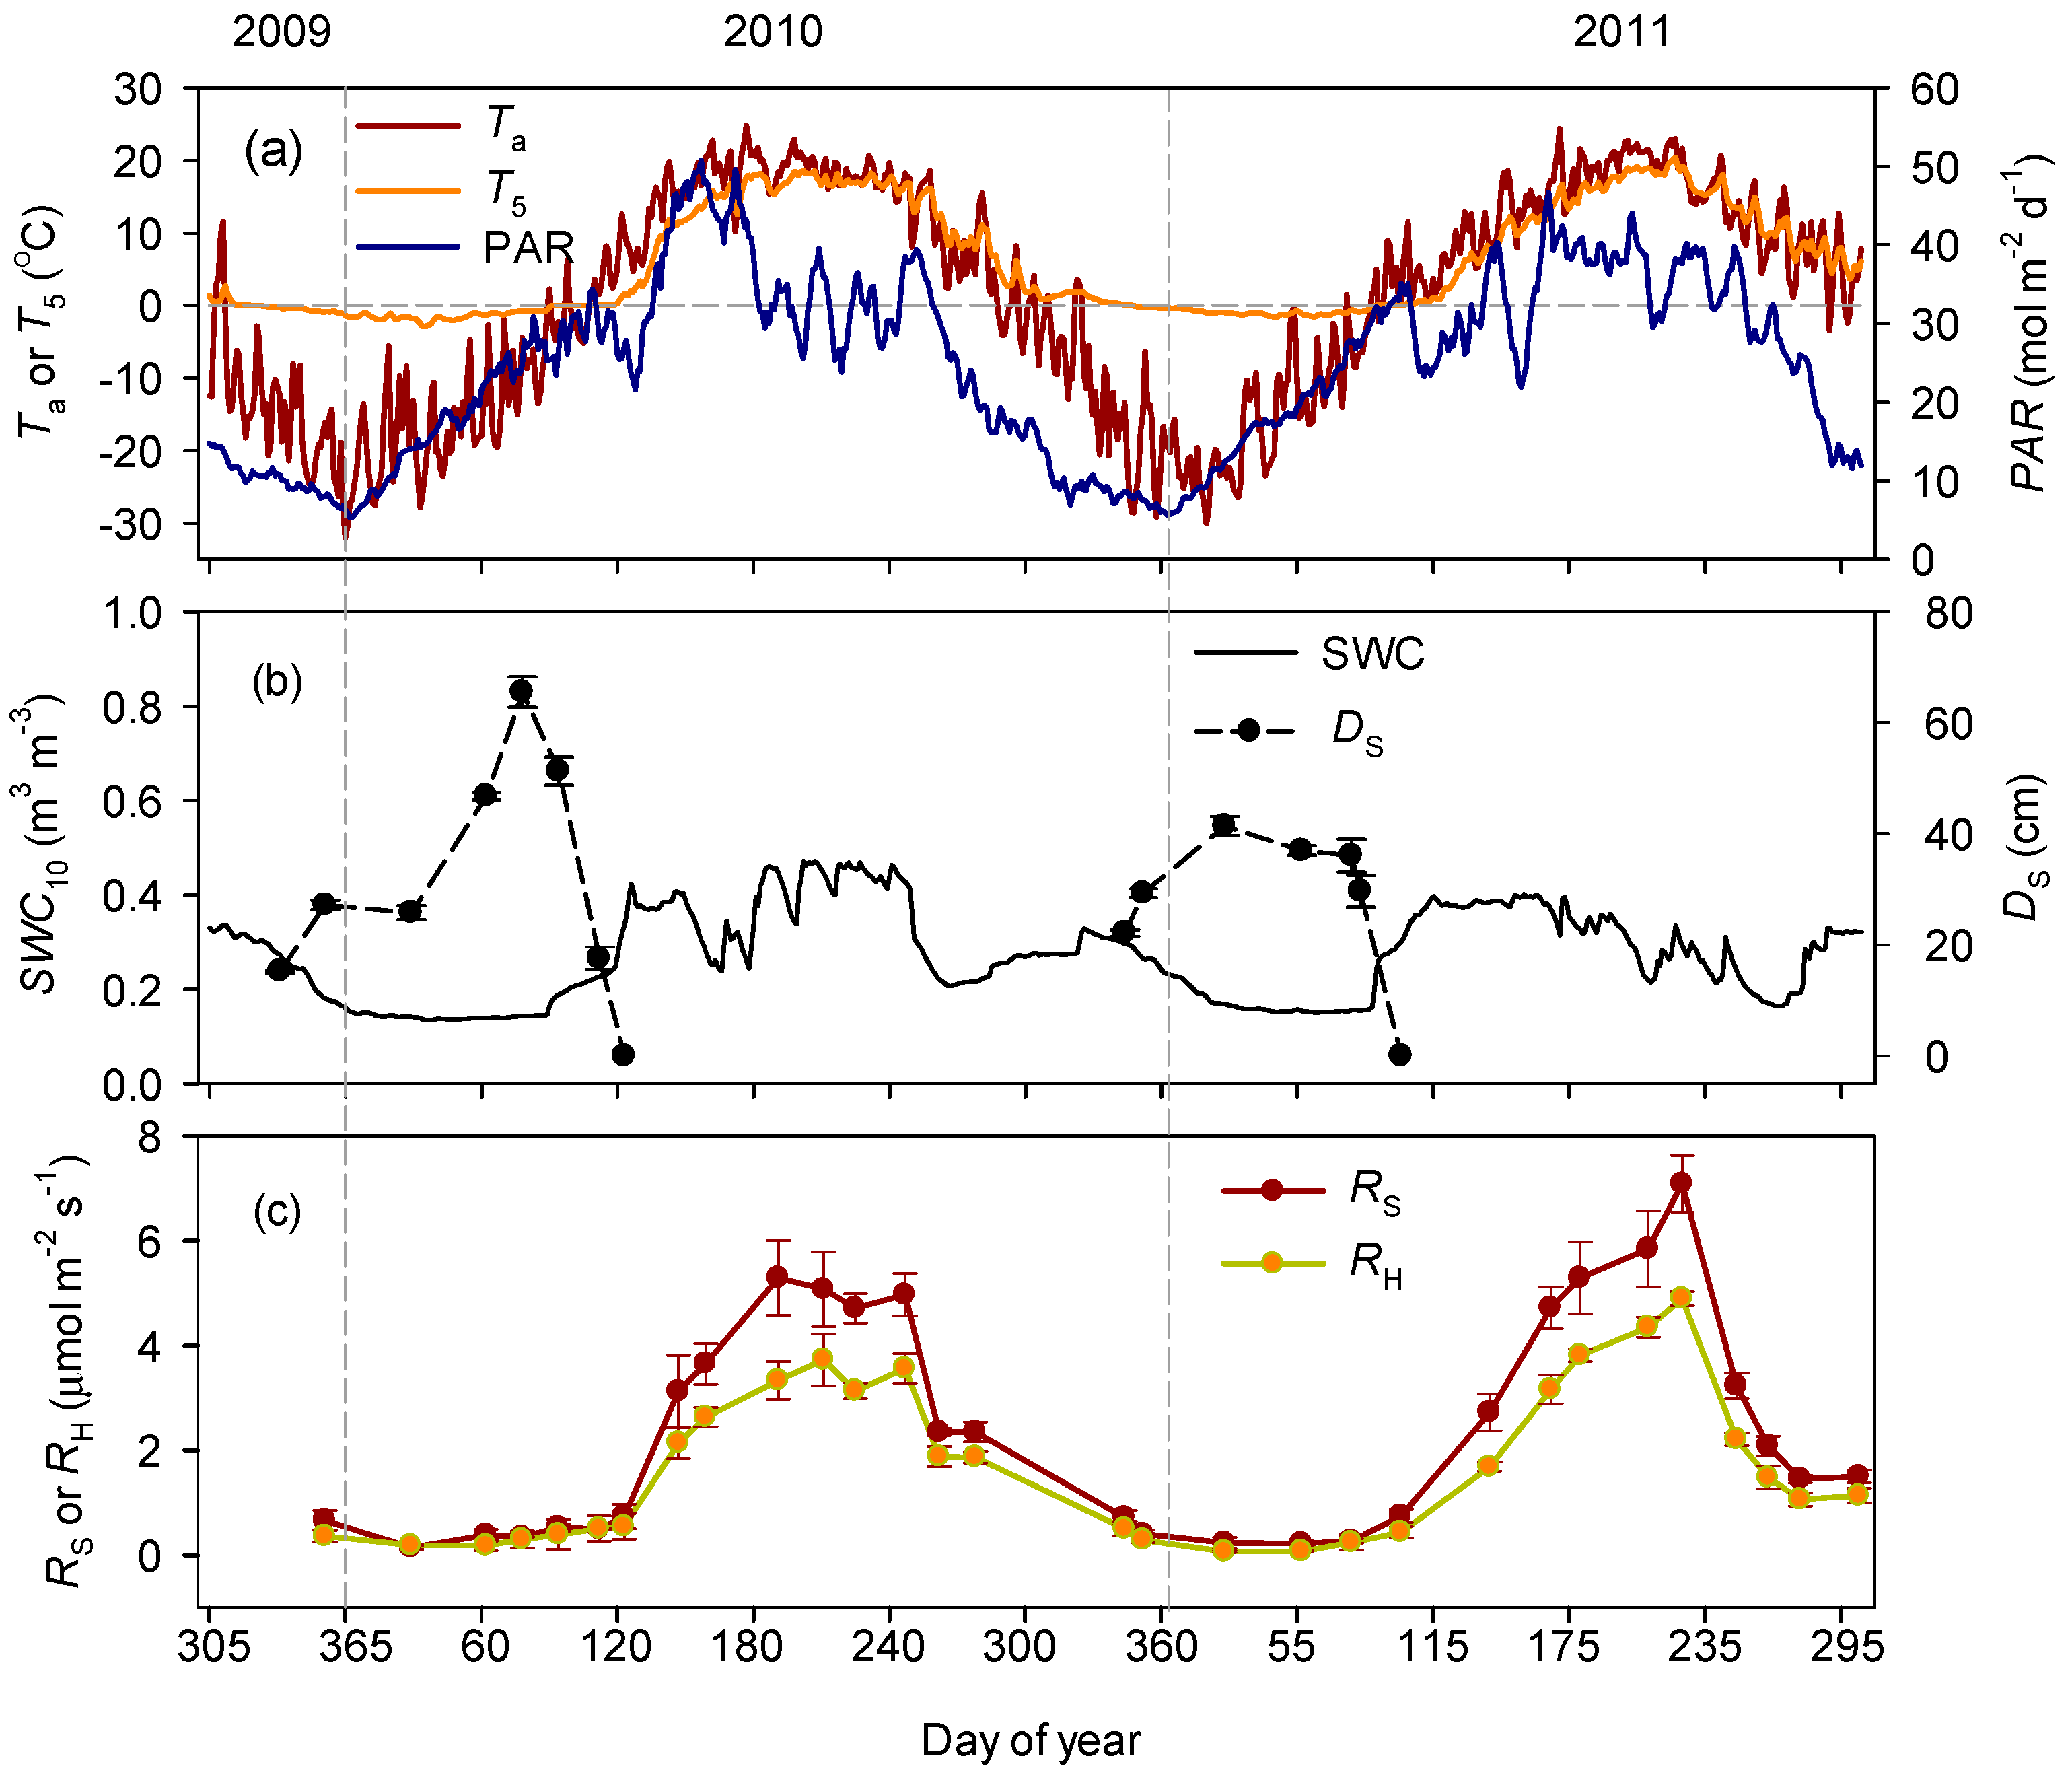
3.1. Seasonal Variations in Soil Respiration and Related Environmental Factors

Both air temperature (Ta) and soil temperature at 5 cm depths (T5) followed a bell-shaped curve during the study period (Figure 1a). The Ta varied from about −30 °C in January to a maximum of about 23 °C in June. The T5 generally lagged to the Ta by roughly one month, with a minimum (about −2 °C) in February and a maximum (about 20 °C) in August. Photosynthetically active radiation (PAR) peaked slightly earlier than Ta for both growing seasons, but interannually it was lower in mid-to-late summer of 2010. During the winter months, soil volumetric water content in the 10 cm soil layer (SWC10) was low (0.15 m3 m−3), and increased rapidly following snowmelt in early April (2011) or mid-April (2010; about 0.4 m3 m−3; Figure 1b). Snow depth (DS) differed dramatically between the two winters. Snow depth in January was shallower for 2010, but the peak occurred in March (66 cm) for 2010 and in January (41 cm) for 2011 (Figure 1b). The RS and RH generally followed the course of T5 (Figure 1c). The minimum of RS occurred in February for 2010 and in January for 2011 (0.11 and 0.15 μmol m−2 s−1, respectively), and RH occurred in January for both years (0.09 and 0.06 μmol m−2 s−1, respectively). However, RS maximized in early July while RH peaked in late July for 2010, whereas RS and RH both peaked in mid-August for 2011. The difference in RS and RH was generally followed by RS.

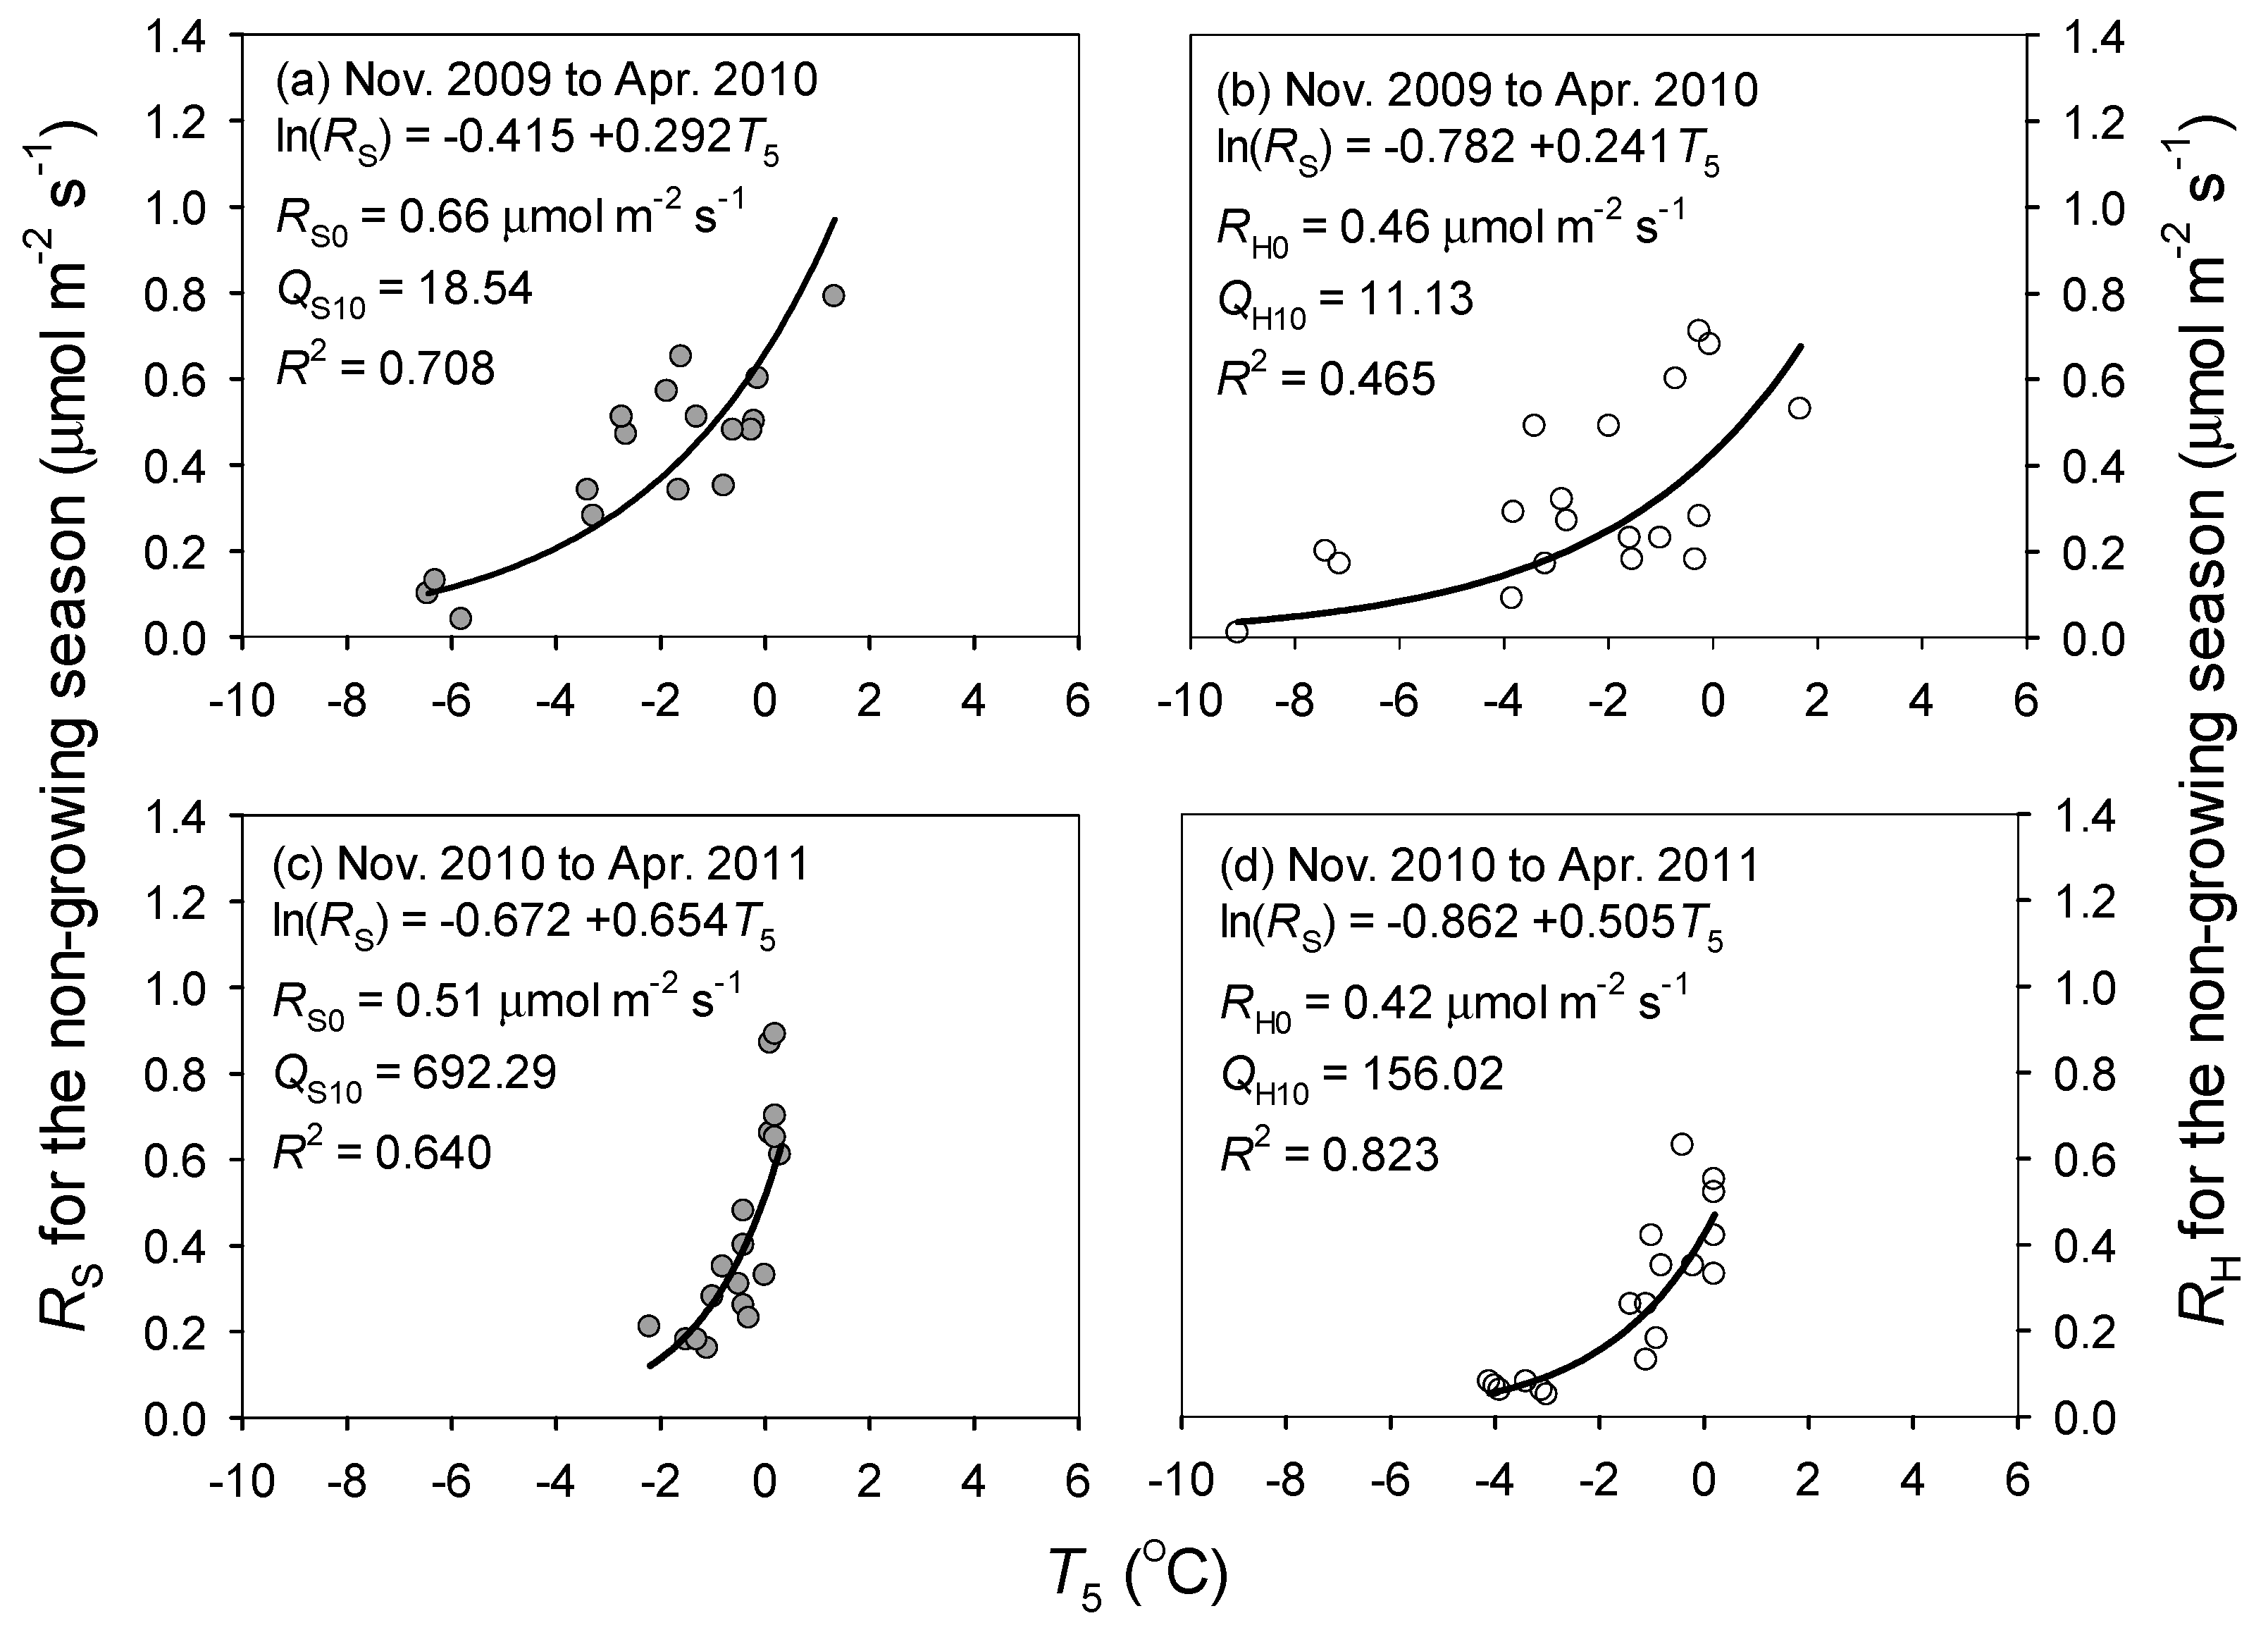
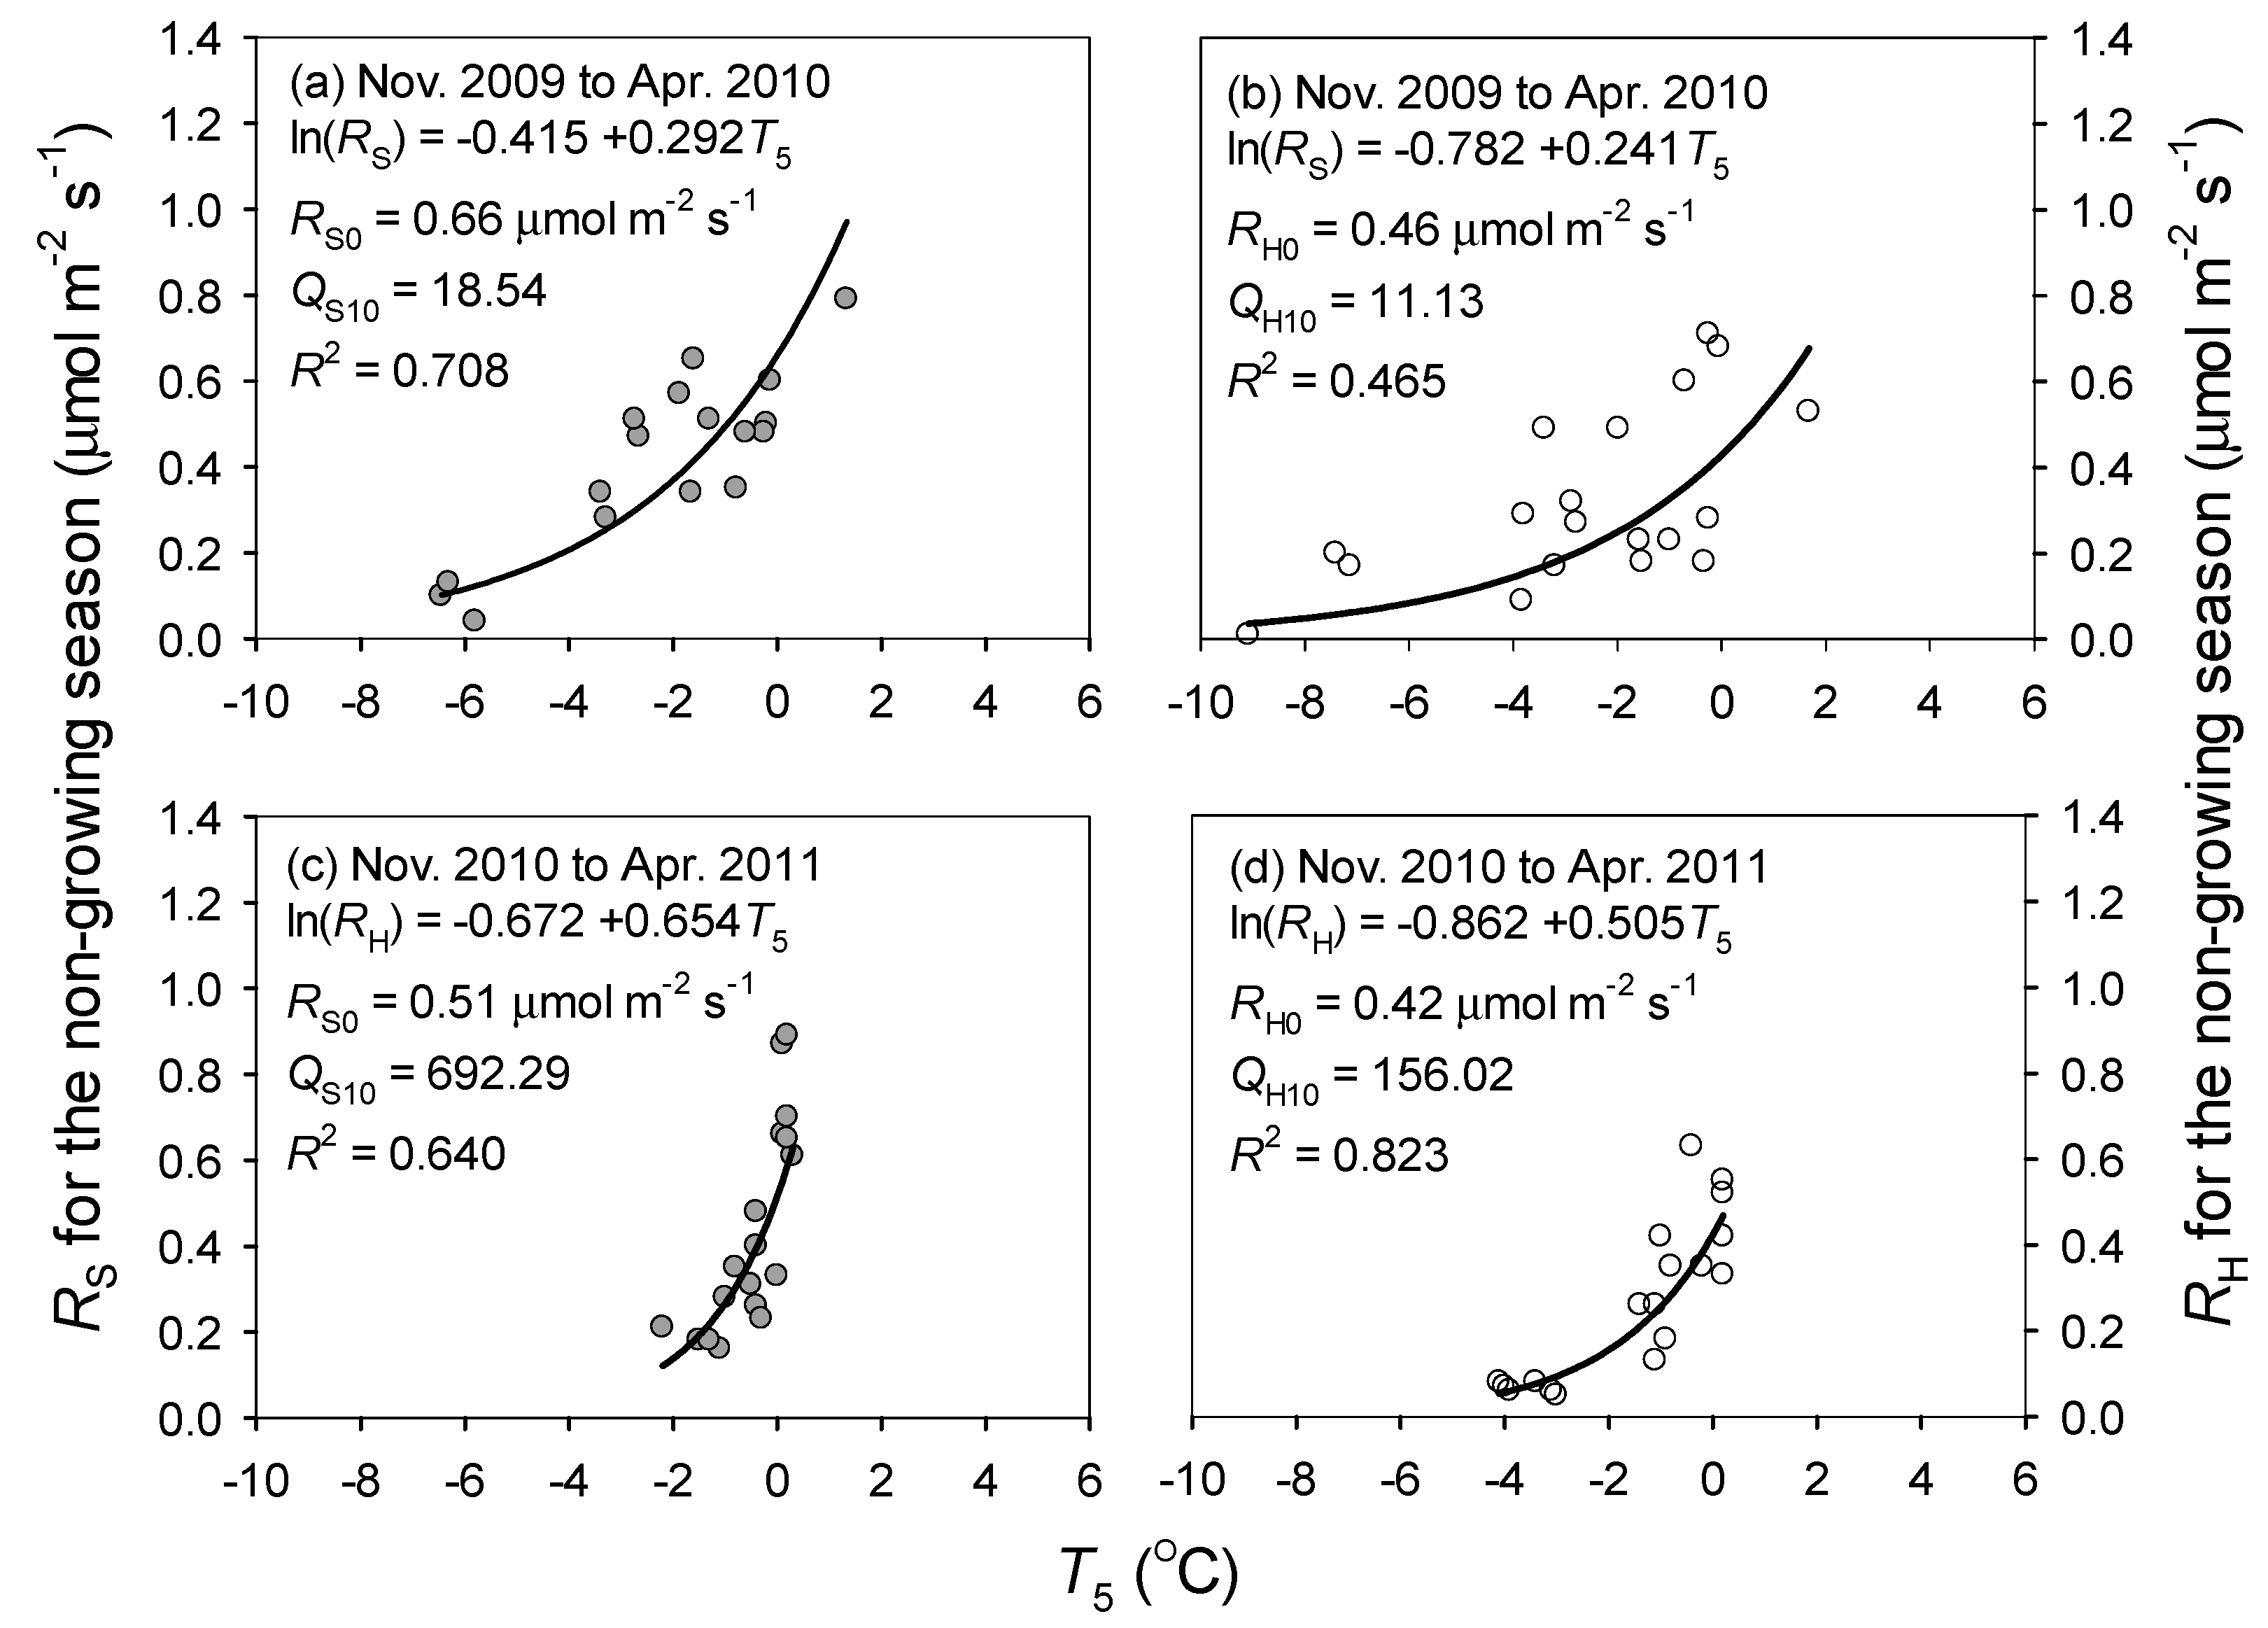
3.2. Responses of Soil Respiration to Soil Temperature and Water Content

Based on the log-transformed exponential model of observed RS and RH versus T5, the RS0 and RH0 (normalized respiration rate at 0 °C for RS and RH) varied between the two non-growing seasons, although RS0 was generally higher than RH0 (Figure 2). The RS0 was higher during the non-growing season between 2009 and 2010 (0.66 μmol m−2 s−1) than that during the following non-growing season (0.51 μmol m−2 s−1), while RH0 was comparable between the two non-growing seasons (0.46 versus 0.42 μmol m−2 s−1).The QS10 (Q10 for RS) and QH10 (Q10 for RH) were lower in the non-growing season between 2009 and 2010 than in the following non-growing season. The QS10 was lower than QH10 for both non-growing seasons (18.54 versus 11.13 for the former, and 742.48 versus 152.93 for the latter).
The RS0 and RH0 for the growing season (0.60–1.00 μmol m−2 s−1) were slightly higher than those for the non-growing season (0.42–0.66 μmol m−2 s−1), whereas QS10 and QH10 (2.34–3.06) were much lower than those for the non-growing season (11.13–692.29) (Figure 2 and Figure 3). The interannual differences in RS0 and RH0, as well as QS10 and QH10 for the growing season, were consistent with those for the non-growing season. For both growing seasons, RS0 was higher than RH0 and QS10 was larger than QH10.
For the growing season, the statistical models of ln(RS) and ln(RH) against T5 and SWC10 explained 82.5%–91.8% of the variability (Table 2). The RS and RH were positively correlated to soil temperature and its interactions with SWC10 in all plots for both years, while showed varying correlations to SWC10.

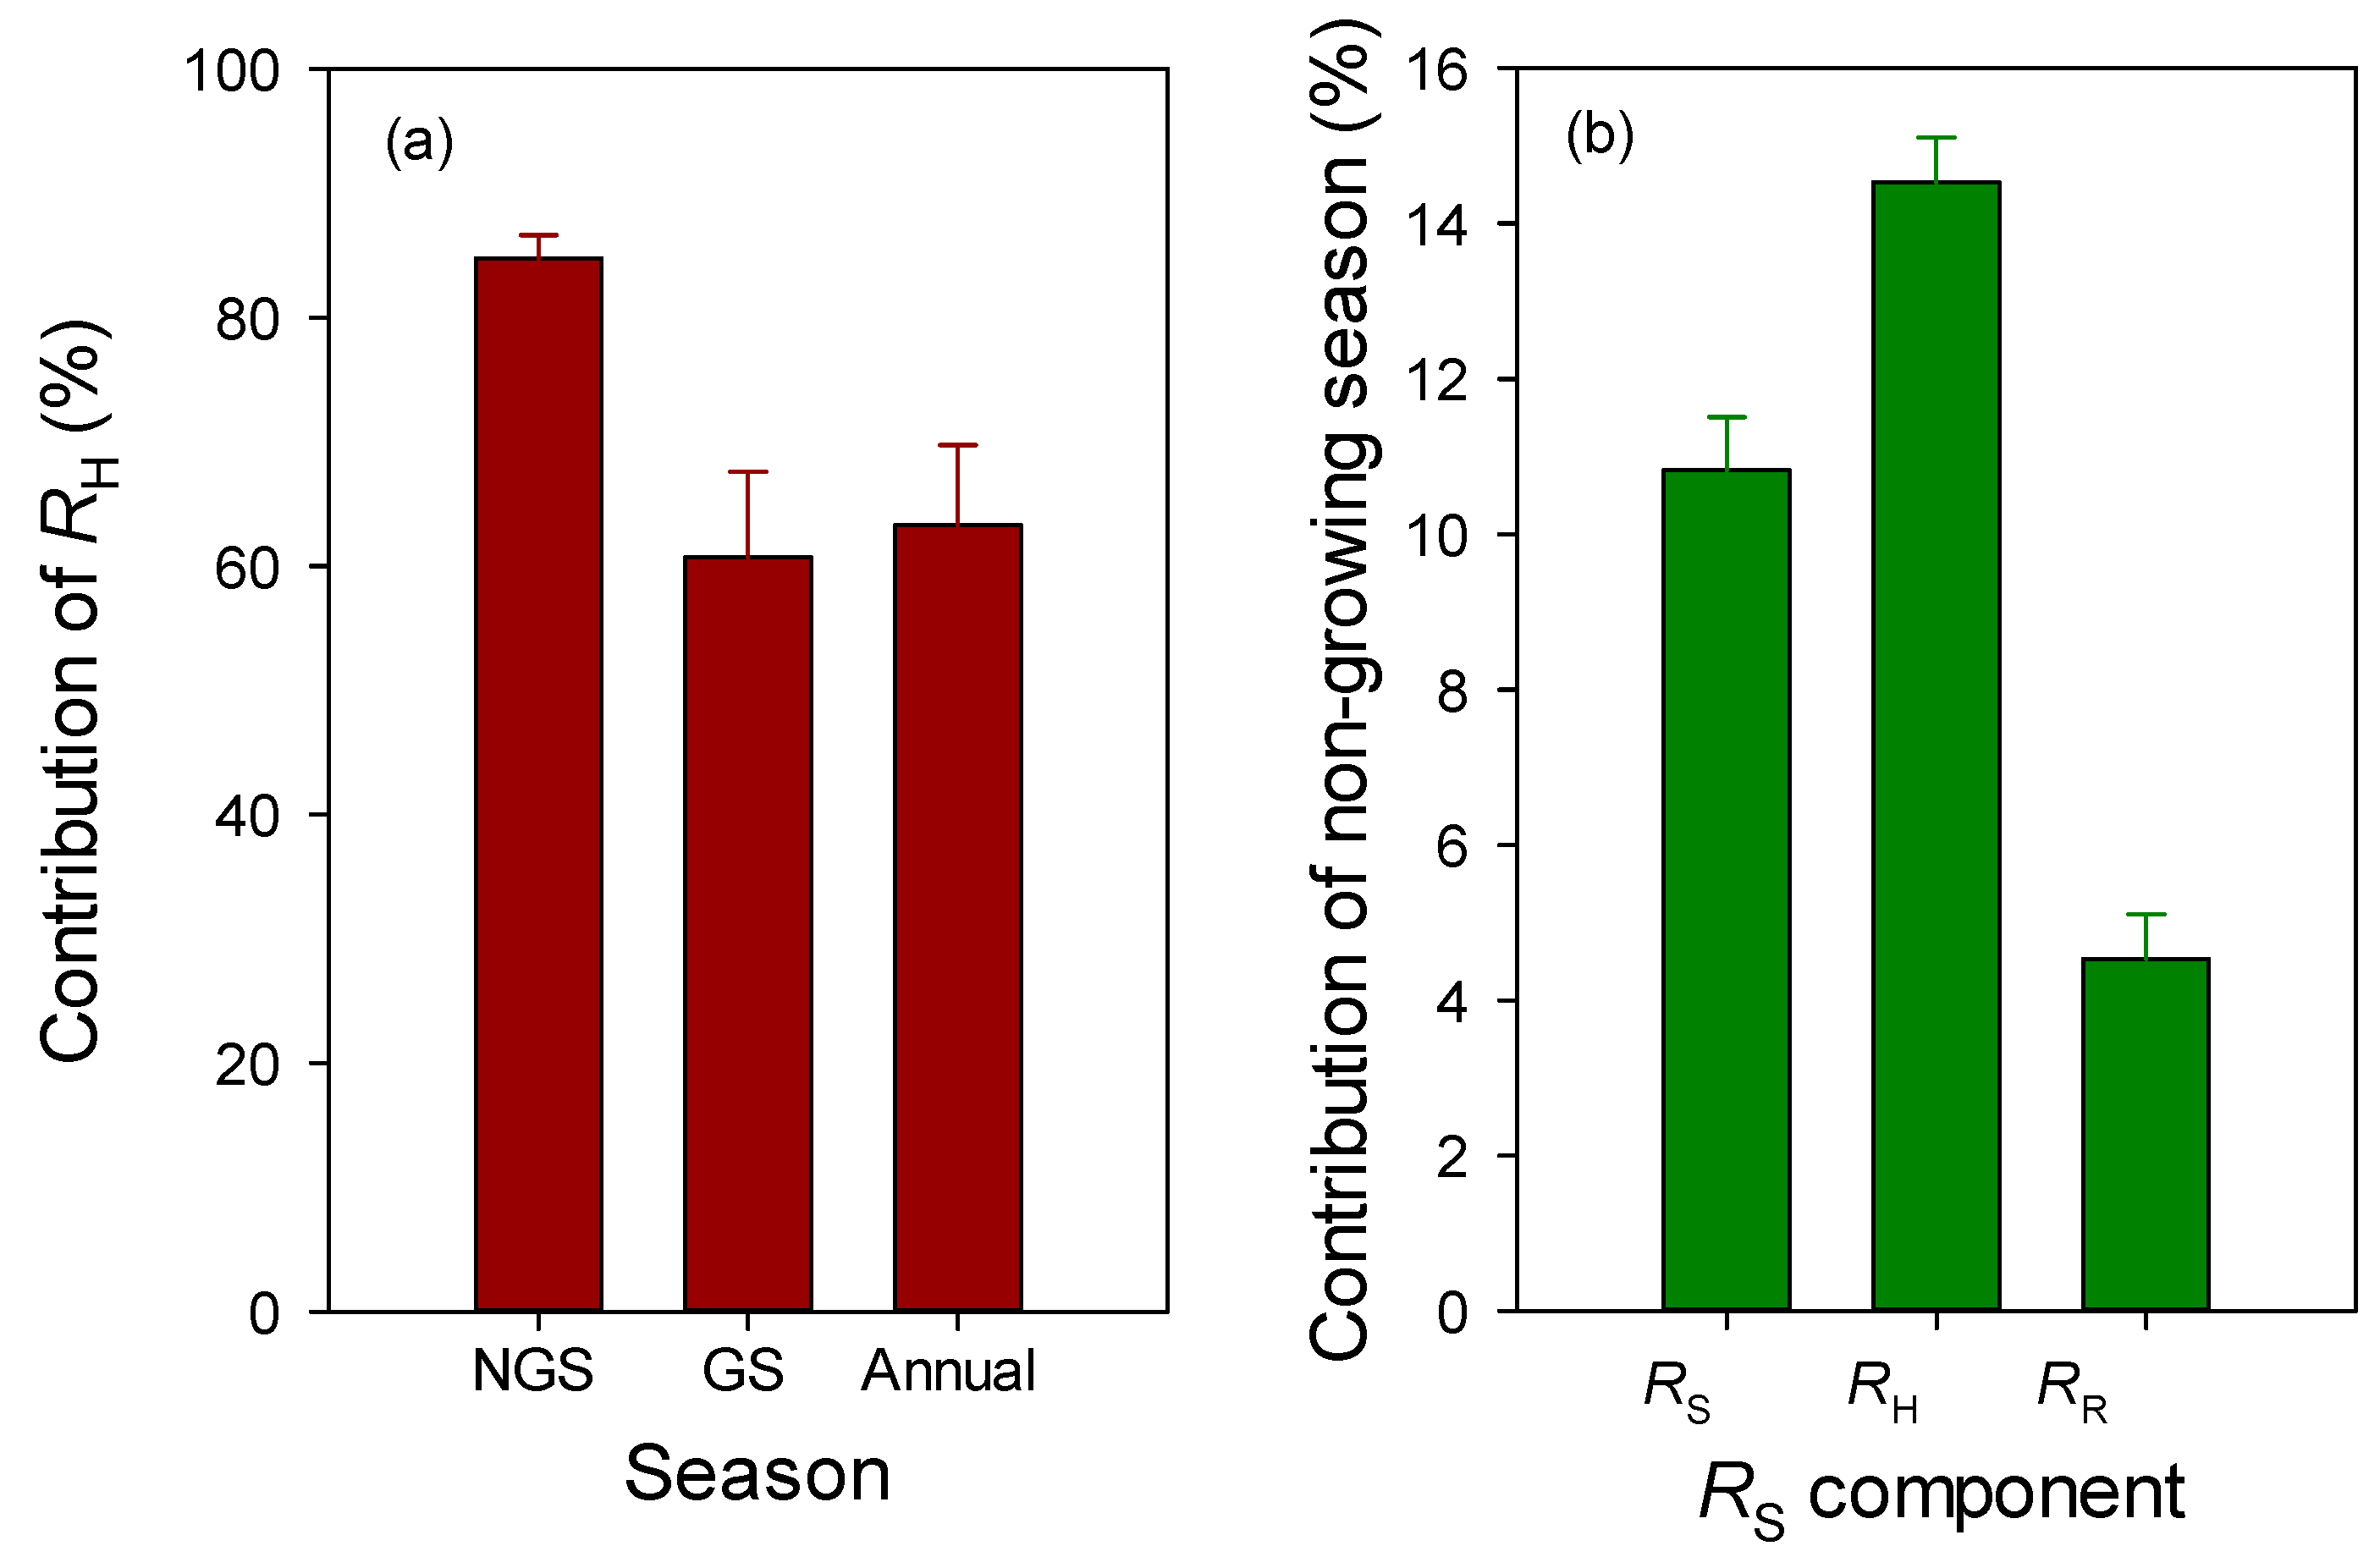
3.3. Contribution of Rhizospheric and Heterotrophic Respiration

The contributions of RH to RS change with integration period, with the values of 84.8%, 60.7%, and 63.3% for the non-growing season, growing season, and annual period, respectively (Figure 4a). The RH contribution for the non-growing season was relatively 40% higher than that for growing season.

3.4. Contribution of Non-Growing Season Soil Respiration

The cumulative RS, RH, and RR for the non-growing season range from 84 to 103 g C m−2, from 75 to 84 g C m−2, and from 9 to 19 g C m−2, respectively (Table 3). The mean non-growing season RS, RH, and RR were 94, 79, and 14 g C m−2, respectively. The mean annual RS, RH, and RR were 869, 547, and 321 g C m−2 year−1, respectively. The mean RS, RH, and RR for the annual and non-growing season were given in Table S2. Therefore, the non-growing season RS, RH, and RR contributed 10.8%, 14.5%, and 4.5% to the corresponding annual fluxes (Figure 4b). The non-growing season contribution of RH was twice that of RR.

3.5. Effects of Plot Trenching on Soil Respiration and Related Environmental Factors

During the growing season, T5 was 0.26 °C lower in the control plots than in the trenched plots (12.99 ± 1.22 °C versus 13.25 ± 1.36 °C; mean ± SD; p = 0.007),and the trenching effect increased SWC10 by 0.05 m3 m−3 (0.30 ± 0.03 m3 m−3 versus 0.35 ± 0.04 m3 m−3; p = 0.027). During the non-growing season, trenching significantly decreased T5 by 0.68 (−0.38 ± 0.35 °C versus −1.06 ± 0.60 °C; p = 0.011). However, corrections for differences in T5 and SWC10 did not significantly reduced the CO2 efflux of the growing season (484 ± 50 versus 468 ± 42 g C m−2 yr−1; p = 0.170).

4. Discussion

4.1. Response of Soil Respiration to Temperature

We found the seasonal variations of RS and RH were generally followed by that of T5, indicating a dominating role of temperature in respiration at the seasonal time scale. However, the different peak timing of RS and RH during the former growing season was a response to the lower mid-to-late summer PAR (Figure 1). This highlights the importance of a recent supply of assimilates directly to RR, but not to RH [11,50,51]. Recently, Zhang et al. [52] verified that changes in photosynthesis drive the seasonal soil respiration–temperature hysteresis relationship, with numerical models and 129 FLUXNET sites. These findings highlight a strong necessity of component partitioning of RS [8,11,28].
Our estimates in non-growing season RS (generally <0.8 μmol m−2 s−1) was well within the range of previous studies conducted in northern and subalpine forest ecosystems [24,33,53,54,55,56]. Higher rates (>0.6 μmol m−2 s−1) in a temperate mixed forest in Switzerland may be a result the high soil temperature (roughly above 3 °C) during the dormant season [27]. A lower dormant season RS in temperate forests (below 0.3 μmol m−2 s−1) of North China [18] and in a boreal black spruce forest in Canada [25] may be due to the lower soil temperature, which reached −10 °C at 2 cm depth [25] or 5 cm depth [18] in harsh winter. These results indicated that winter RS was mainly controlled by soil temperature as at the Maoershan site (Figure 2 and Figure 3).
We found that QS10 and QH10 in the non-growing season were between 11.13 and 692.29, but dropped to between 2.34 and 3.06 in the growing season. Numerous studies have demonstrated exceptionally high Q10 for the beneath-snow respiratory flux in cold-winter ecosystems. For instance, the QS10 and QH10 in the dormant season (all above 4) were higher than those in the growing season (often <2) in two forests in the Loess Plateau of China [29]. Although our Qs10 of 692.29 might be unreasonable from a biotic view, a much higher value (1.25 × 10⁶) was reported in a subalpine conifer forest [23]. It has been argued that the high temperature sensitivity could be attributable to the combined effects of exponential growth of snow molds, and the exponential response of their respiration rate to small changes in temperature [57].
Our QS10 was higher than QH10 in both non-growing season. There was a debate on which is higher for QS10 and QH10 in the literature [58,59]. Lower temperature sensitivity for RS versus RH was reported in a mixed beech forest in Switzerland during the dormant period [27], in a boreal black spruce plantation in Canada [60], and in an oak chronosequence in China [13]. However, we found that QS10 was more often higher than QH10 in the literature [12,14,25,29,61,62]. The winter higher QS10 compared with QH10 indicated a higher temperature sensitivity of roots than microbes. However, the apparent Q10 during the growing season may reflect the effect of plant phenological patterns [48,63,64].

4.2. Non-Growing Season and Annual Soil Respiration

Our mean annual RS (869 g C m−2 yr−1) was similar to that of the previous studies in broadleaved deciduous forests at the same site (781–813 g C m−2 yr−1) [38], as well as the mean of global temperate forests (829 ± 337 g C m−2 yr−1) [3]. Our mean accumulated RS for non-growing seasons (94 g C m−2, Table 3) was also well in the range of the reported values in temperate forests (27–132 g C m−2) [18,54,55,65,66,67]. Lower RS values during the non-growing seasons between 2009 and 2010 than those between 2010and 2011 were probably due to the corresponding lower soil temperature (1.6 versus −0.5 for T5; Figure 1a) [66]. We argue that the interannual variations in soil temperature and the corresponding RS were mainly due to the difference in DS before January, rather than the maximum DS (Figure 1b). Our non-growing season contribution to annual RS (10.8%) was at the low end of those in literature (6%–23%) [18,24,44,54,66,68,69,70]. However, the contribution of non-growing season RH to annual RH (14.5%) was over triple that of RR (4.5%). Using the non-growing season RS contribution to annual RS (10.8%), to scale growing season measurements, to the annual scale would introduce substantial biases in the annual RH (−33.70 g C m−2 yr−1 or −6.2%) and RR (15.70 g C m−2 yr−1 or 4.9%).

4.3. Contribution of Rhizospheric and Heterotrophic Respiration

Our annual RH contribution to RS (63.3%) was slightly higher than the global means of the temperate deciduous forests: 54% by Subke et al. [35] and ~50% by a recent meta-analysis [14]. Our higher RH contribution might be due to the relative higher SOC, as indicated by a positive correlation of RH with the SOC at the same site [28]. However, our estimates of RH contribution were much higher than those in the broadleaved deciduous forests at the same site (23%–38%) [28]. The discrepancy may be primarily due to different treatment of root decomposition effect.
Heterotrophic contribution varied with the seasons, which might reflect different controlling of RR and RH. The RH dominated RS (84.8%) in the non-growing season, but its contribution declined in the growing season (60.7%). Similar patterns were widely observed in other northern or subalpine forests [9,12,25,27,29,71]. For example, the contribution of RH to RS was lowest in the growing season (54% in an oak forest and 40% in a black locust plantation in the Loess Plateau, China), and it increased up to 88% and 94% during the dormant season [29]. The largest contribution of RH to RS was 70% during the dormant period, and as low as 41% during the summer in a mountain mixed temperate forest [27]. In a subalpine ponderosa pine plantation in the United States, the RH/RS ratio varied from 44% during the growing season to 84% during the non-growing season [71]. We found that using the RH contribution during the growing season to estimate the non-growing RH and RR would underestimate RH but overestimate RR by 22.51 g C m−2 yr−1, or 7%. The colder soil in the former winter had a higher RH contribution versus the latter (89.1% versus 81.3%), although the lower soil temperature suppressed the RS and its components (Table 3). Reduced winter RS was widely reported in snow removal experiments [24,54], and between years in natural conditions [66], but the partitioning of RS is rarely reported. The reduced total respiration but increased RH contribution indicates a higher temperature sensitivity of roots versus microbes. This is also supported by the higher QS10 versus QH10 (Figure 3). Therefore, a single value of RH contribution from growing season measurements should not be applied throughout an annual cycle [9].

4.4. Effects of Plot Trenching on Soil Respiration

The decomposition of dead roots in trenched subplots is one of the most important uncertainties in RS partitioning. Estimates of this effect in the literature have ranged from 2% to 54% [28,30,35,42,72], with the effect being the most pronounced within the first year after trenching, and declining to minimal levels after two years [26,73] or more [74,75]. The estimate of error introduced by the additional decay of trenched roots for the second year following trenching indicates that RH might be overestimated by as much as 20% in boreal forests [34] and 14% in temperate forests [64]. The root decomposition accounted for 23%–35% of the annual RS in a previous study at our site [28], which might be overcorrected due to (1) overestimation of coarse root biomass using allometric equations, which did not account for the declination of root biomass with increasing distance from the stump; and (2) ignoring the carbon input of fine root mortality in natural conditions [76,77]. These uncertainties in dead root decomposition and fine root mortality cautions future studies involving the trenching method [49,73,76,77].
To minimize the effect of root decomposition, we used the measurements in the third and fourth years after trenching, as done in some previous studies (e.g., [61,78]). However, measurements conducted many years after trenching might underestimate the RH/RS ratio, due to a lack of below-ground litter input in trenched subplots compared with control plots [35]. Furthermore, eliminating the priming effect of root inputs in trenched plots may decrease decomposition [79], and thus underestimate RH. Therefore, we did not exclude the root decomposition in the trenched plots. Accurate estimates of RH by trenching experiment need detailed carbon budgets in trenched plots [77].
Differences in soil moisture and temperature between control and trenched plots may be another potential artifact of the trenching experiment [28,49]. The increase in T5 by trenching treatment was due to the removal of understory vegetations, which enhances the light reception of the forest floor. However, the trenching effect on T5 reversed in the non-growing season, which might be attributed to the shallower snowpack or the disturbance introduced when measuring CO2 efflux. The increase of SWC10 (3% or 0.05 m3 m−3) by trenching might be caused by different soil drainage conditions and water uptake by trees between plots. A previous study reported that the effect of soil moisture was 16% in a pine forest in Sweden [73]. Nevertheless, RH and its contribution to RS, based on our plot-specific T5 and SWC10 data and the plot-treatment-specific respiration models, may not be largely influenced by these environmental changes from trenching, because the regression models and the driving variables had already accounted for those changes.

5. Conclusions

Soil rhizospheric and heterotrophic respiration in a temperate deciduous forest was partitioned by a trenching experiment throughout two years. The non-growing seasons’ QS10 and QH10 were both much higher than those in the growing season. Mean non-growing season RS, RH, and RR for the two years was 94, 79, and 14 g C m−2, respectively, which contributed 10.8%, 14.5%, and 4.5% to the corresponding annual fluxes (869, 547, and 321 g C m−2 yr−1, respectively). The contributions of RH to RS for the non-growing season, growing season, and annual period were 81.3%, 60.7%, and 63.3%, respectively. Using the fixed non-growing season contribution of RS to scale growing season measurements to the annual scale would introduce significant biases on annual RH (−34 g C m−2 yr−1 or −6%) and RR (16 g C m−2 yr−1 or 5%), and using the RH contribution measured in the growing season to partitioning RS in the non-growing season would overestimate RR by 23 g C m−2 yr−1 (7% of annual flux). We concluded that it was important to take non-growing season measurements on the partitioning of RS components in temperate forests.

Supplementary Materials

The following are available online at https://www.mdpi.com/1999-4907/10/1/8/s1: Table S1. Models of soil respiration from control plots (RS, μmol m−2 s−1) and trenched plots (RH, μmol m−2 s−1) against soil temperature at 5 cm depth (T5, °C) or 10 cm (T10, °C), and soil volumetric water content at 0–5 cm (SWC5, m3 m−3) or 0–10 cm (SWC10, m3 m−3) for the three plots during the non-growing (November 2010 to April 2011) and growing (May to October 2011) season, Table S2. Annual and non-growing season (NGS) total soil respiration (RS), heterotrophic respiration (RH), and rhizospheric respiration (RR) for each plot during the two climatic years.

Author Contributions

X.W. and Z.J. designed the experiments; Z.J. and X.W. performed field measurements; Z.J. and X.W. analyzed the data and wrote the paper.

Funding

This research was financially supported by the National Natural Science Foundation of China (30625010 and 41503071), the National Key Technology Research and Development Program of the Ministry of Science and Technology of China (No. 2011BAD37B01), and the Program for Changjiang Scholars and Innovative Research Team in University (IRT_15R09).

Acknowledgments

We are grateful to Chuankuan Wang for the help with the experimental design. We thank Yi Han for help with the field measurements. The Maoershan Forest Ecosystem Research Station provided field logistic support.

Conflicts of Interest

The authors declare no conflict of interest.

References

  1. Bond-Lamberty, B.; Thomson, A. Temperature-associated increases in the global soil respiration record. Nature 2010, 464, 579–582. [Google Scholar] [CrossRef] [PubMed]
  2. Hashimoto, S.; Carvalhais, N.; Ito, A.; Migliavacca, M.; Nishina, K.; Reichstein, M. Global spatiotemporal distribution of soil respiration modeled using a global database. Biogeosciences 2015, 12, 4121–4132. [Google Scholar] [CrossRef]
  3. Hursh, A.; Ballantyne, A.; Cooper, L.; Maneta, M.; Kimball, J.; Watts, J. The sensitivity of soil respiration to soil temperature, moisture, and carbon supply at the global scale. Glob. Chang. Biol. 2017, 23, 2090–2103. [Google Scholar] [CrossRef]
  4. Beer, C.; Reichstein, M.; Tomelleri, E.; Ciais, P.; Jung, M.; Carvalhais, N.; Rödenbeck, C.; Arain, M.A.; Baldocchi, D.; Bonan, G.B.; et al. Terrestrial gross carbon dioxide uptake: Global distribution and covariation with climate. Science 2010, 329, 834–838. [Google Scholar] [CrossRef]
  5. Bond-Lamberty, B.; Thomson, A. A global database of soil respiration data. Biogeosciences 2010, 7, 1915–1926. [Google Scholar] [CrossRef] [Green Version]
  6. Chen, S.; Huang, Y.; Xie, W.; Zou, J.; Lu, Y.; Hu, Z. A new estimate of global soil respiration from 1970 to 2008. Chin. Sci. Bull. 2013, 58, 4153–4160. [Google Scholar] [CrossRef] [Green Version]
  7. Zhao, Z.; Peng, C.; Yang, Q.; Meng, F.-R.; Song, X.; Chen, S.; Epule, T.E.; Li, P.; Zhu, Q. Model prediction of biome-specific global soil respiration from 1960 to 2012. Earth’s Future 2017, 5, 715–729. [Google Scholar] [CrossRef] [Green Version]
  8. Scott-Denton, L.E.; Rosenstiel, T.N.; Monson, R.K. Differential controls by climate and substrate over the heterotrophic and rhizospheric components of soil respiration. Glob. Chang. Biol. 2006, 12, 205–216. [Google Scholar] [CrossRef]
  9. Hanson, P.; Edwards, N.; Garten, C.; Andrews, J. Separating root and soil microbial contributions to soil respiration: A review of methods and observations. Biogeochemistry 2000, 48, 115–146. [Google Scholar] [CrossRef]
  10. Bond-Lamberty, B.; Wang, C.; Gower, S.T. A global relationship between the heterotrophic and autotrophic components of soil respiration? Glob. Chang. Biol. 2004, 10, 1756–1766. [Google Scholar] [CrossRef]
  11. Högberg, P.; Nordgren, A.; Buchmann, N.; Taylor, A.F.; Ekblad, A.; Högberg, M.N.; Nyberg, G.; Ottosson-Löfvenius, M.; Read, D.J. Large-scale forest girdling shows that current photosynthesis drives soil respiration. Nature 2001, 411, 789–792. [Google Scholar] [CrossRef] [PubMed]
  12. Savage, K.; Davidson, E.; Tang, J. Diel patterns of autotrophic and heterotrophic respiration among phenological stages. Glob. Chang. Biol. 2013, 19, 1151–1159. [Google Scholar] [CrossRef] [PubMed]
  13. Luan, J.; Liu, S.; Wang, J.; Zhu, X.; Shi, Z. Rhizospheric and heterotrophic respiration of a warm-temperate oak chronosequence in China. Soil Biol. Biochem. 2011, 43, 503–512. [Google Scholar] [CrossRef]
  14. Wang, W.; Chen, W.; Wang, S. Forest soil respiration and its heterotrophic and autotrophic components: Global patterns and responses to temperature and precipitation. Soil Biol. Biochem. 2010, 42, 1236–1244. [Google Scholar]
  15. Bond-Lamberty, B.; Bailey, V.L.; Chen, M.; Gough, C.M.; Vargas, R. Globally rising soil heterotrophic respiration over recent decades. Nature 2018, 560, 80–83. [Google Scholar] [CrossRef] [PubMed]
  16. Trumbore, S. Carbon respired by terrestrial ecosystems-recent progress and challenges. Glob. Chang. Biol. 2006, 12, 141–153. [Google Scholar] [CrossRef]
  17. Ryan, M.G.; Law, B.E. Interpreting, measuring, and modeling soil respiration. Biogeochemistry 2005, 73, 3–27. [Google Scholar] [CrossRef] [Green Version]
  18. Wang, W.; Peng, S.; Wang, T.; Fang, J. Winter soil CO2 efflux and its contribution to annual soil respiration in different ecosystems of a forest-steppe ecotone, north China. Soil Biol. Biochem. 2010, 42, 451–458. [Google Scholar] [CrossRef]
  19. Campbell, J.L.; Mitchell, M.J.; Groffman, P.M.; Christenson, L.M.; Hardy, J.P. Winter in northeastern North America: A critical period for ecological processes. Front. Ecol. Environ. 2005, 3, 314–322. [Google Scholar] [CrossRef]
  20. Sullivan, P.F.; Welker, J.M.; Arens, S.J.T.; Sveinbjörnsson, B. Continuous estimates of CO2 efflux from arctic and boreal soils during the snow-covered season in Alaska. J. Geophys. Res. 2008, 113, G04009. [Google Scholar] [CrossRef]
  21. Nobrega, S.; Grogan, P. Deeper snow enhances winter respiration from both plant-associated and bulk soil carbon pools in birch hummock tundra. Ecosystems 2007, 10, 419–431. [Google Scholar] [CrossRef]
  22. Brooks, P.D.; McKnight, D.; Elder, K. Carbon limitation of soil respiration under winter snowpacks: Potential feedbacks between growing season and winter carbon fluxes. Glob. Chang. Biol. 2004, 11, 231–238. [Google Scholar] [CrossRef]
  23. Monson, R.K.; Lipson, D.L.; Burns, S.P.; Turnipseed, A.A.; Delany, A.C.; Williams, M.W.; Schmidt, S.K. Winter forest soil respiration controlled by climate and microbial community composition. Nature 2006, 439, 711–714. [Google Scholar] [CrossRef]
  24. Wang, C.; Han, Y.; Chen, J.; Wang, X.; Zhang, Q.; Bond-Lamberty, B. Seasonality of soil CO2 efflux in a temperate forest: Biophysical effects of snowpack and spring freeze–thaw cycles. Agric. For. Meteorol. 2013, 177, 83–92. [Google Scholar] [CrossRef]
  25. Gaumont-Guay, D.; Black, T.A.; Barr, A.G.; Jassal, R.S.; Nesic, Z. Biophysical controls on rhizospheric and heterotrophic components of soil respiration in a boreal black spruce stand. Tree Physiol. 2008, 28, 161–171. [Google Scholar] [CrossRef] [PubMed] [Green Version]
  26. Lee, M.; Nakane, K.; Nakatsubo, T.; Koizumi, H. Seasonal changes in the contribution of root respiration to total soil respiration in a cool-temperate deciduous forest. Plant Soil 2003, 255, 311–318. [Google Scholar] [CrossRef]
  27. Ruehr, N.K.; Buchmann, N. Soil respiration fluxes in a temperate mixed forest: Seasonality and temperature sensitivities differ among microbial and root–rhizosphere respiration. Tree Physiol. 2010, 30, 165–176. [Google Scholar] [CrossRef]
  28. Wang, C.; Yang, J. Rhizospheric and heterotrophic components of soil respiration in six Chinese temperate forests. Glob. Chang. Biol. 2007, 13, 123–131. [Google Scholar] [CrossRef]
  29. Shi, W.Y.; Zhang, J.G.; Yan, M.J.; Yamanaka, N.; Du, S. Seasonal and diurnal dynamics of soil respiration fluxes in two typical forests on the semiarid Loess Plateau of China: Temperature sensitivities of autotrophs and heterotrophs and analyses of integrated driving factors. Soil Biol. Biochem. 2012, 52, 99–107. [Google Scholar] [CrossRef]
  30. Brown, R.; Markewitz, D. Soil heterotrophic respiration: Measuring and modeling seasonal variation and silvicultural impacts. For. Ecol. Manag. 2018, 430, 594–608. [Google Scholar] [CrossRef]
  31. Carbone, M.S.; Richardson, A.D.; Chen, M.; Davidson, E.A.; Hughes, H.; Savage, K.E.; Hollinger, D.Y. Constrained partitioning of autotrophic and heterotrophic respiration reduces model uncertainties of forest ecosystem carbon fluxes but not stocks. J. Geophys. Res. Biogeosci. 2016, 121, 2476–2492. [Google Scholar] [CrossRef]
  32. Tucker, C.; Young, J.; Williams, D.; Ogle, K. Process-based isotope partitioning of winter soil respiration in a subalpine ecosystem reveals importance of rhizospheric respiration. Biogeochemistry 2014, 121, 389–408. [Google Scholar] [CrossRef]
  33. Schindlbacher, A.; Zechmeister-Boltenstern, S.; Glatzel, G.; Jandl, R. Winter soil respiration from an Austrian mountain forest. Agric. For. Meteorol. 2007, 146, 205–215. [Google Scholar] [CrossRef]
  34. Bond-Lamberty, B.; Wang, C.; Gower, S.T. Contribution of root respiration to soil surface CO2 flux in a boreal black spruce chronosequence. Tree Physiol. 2004, 24, 1387–1395. [Google Scholar] [CrossRef] [PubMed]
  35. Subke, J.A.; Inglima, I.; Francesca Cotrufo, M. Trends and methodological impacts in soil CO2 efflux partitioning: A metaanalytical review. Glob. Chang. Biol. 2006, 12, 921–943. [Google Scholar] [CrossRef]
  36. Kuzyakov, Y. Sources of CO2 efflux from soil and review of partitioning methods. Soil Biol. Biochem. 2006, 38, 425–448. [Google Scholar] [CrossRef]
  37. Liu, F.; Wang, C.; Wang, X.; Zhang, J.; Zhang, Z.; Wang, J. Spatial patterns of biomass in the temperate broadleaved deciduous forest within the fetch of the Maoershan flux tower. Acta Ecol. Sin. 2016, 36, 6506–6519. [Google Scholar]
  38. Liu, Z.; Wang, C.; Chen, J.M.; Wang, X.; Jin, G. Empirical models for tracing seasonal changes in leaf area index in deciduous broadleaf forests by digital hemispherical photography. For. Ecol. Manag. 2015, 351, 67–77. [Google Scholar] [CrossRef]
  39. Liu, F.; Wang, C.; Wang, X. Monitoring temporal dynamics in leaf area index of the temperate broadleaved deciduous forest in Maoershan region with tower-based radiation measurements. Chin. J. Appl. Ecol. 2016, 27, 2409–2419. [Google Scholar]
  40. Kong, Q.; Wang, C.; Wang, X. Effects of detritus removal on soil carbon, nitrogen and phosphorus stoichiometry and related factors in a temperate deciduous forest in the Maoershan Mountain, China. Chin. J. Appl. Ecol. 2018, 29, 2173–2182. [Google Scholar]
  41. Jassal, R.S.; Black, T.A. Estimating heterotrophic and autotrophic soil respiration using small-area trenched plot technique: Theory and practice. Agric. For. Meteorol. 2006, 140, 193–202. [Google Scholar] [CrossRef]
  42. Wang, C.; Yang, J.; Zhang, Q. Soil respiration in six temperate forests in China. Glob. Chang. Biol. 2006, 12, 2103–2114. [Google Scholar] [CrossRef]
  43. Davidson, E.; Savage, K.; Verchot, L.; Navarro, R. Minimizing artifacts and biases in chamber-based measurements of soil respiration. Agric. For. Meteorol. 2002, 113, 21–37. [Google Scholar] [CrossRef]
  44. Groffman, P.M.; Hardy, J.P.; Driscoll, C.T.; Fahey, T.J. Snow depth, soil freezing, and fluxes of carbon dioxide, nitrous oxide and methane in a northern hardwood forest. Glob. Chang. Biol. 2006, 12, 1748–1760. [Google Scholar] [CrossRef] [Green Version]
  45. Xu, M.; Qi, Y. Soil-surface CO2 efflux and its spatial and temporal variations in a young ponderosa pine plantation in northern California. Glob. Chang. Biol. 2001, 7, 667–677. [Google Scholar] [CrossRef]
  46. Pumpanen, J.; Kolari, P.; Ilvesniemi, H.; Minkkinen, K.; Vesala, T.; Niinistö, S.; Lohila, A.; Larmola, T.; Morero, M.; Pihlatie, M.; et al. Comparison of different chamber techniques for measuring soil CO2 efflux. Agric. For. Meteorol. 2004, 123, 159–176. [Google Scholar] [CrossRef]
  47. Madsen, R.A.; Demetriades-Shah, T.H.; Garcia, R.L.; McDermitt, D.K. Soil CO2 Flux Measurements: Comparisons between the LI-COR LI-6400 and LI-8100; Technical Note; LI-COR Biosciences: Lincoln, NE, USA, 2004. [Google Scholar]
  48. Reinmann, A.B.; Templer, P.H. Increased soil respiration in response to experimentally reduced snow cover and increased soil freezing in a temperate deciduous forest. Biogeochemistry 2018, 140, 359–371. [Google Scholar] [CrossRef]
  49. Ngao, J.; Longdoz, B.; Granier, A.; Epron, D. Estimation of autotrophic and heterotrophic components of soil respiration by trenching is sensitive to corrections for root decomposition and changes in soil water content. Plant Soil 2007, 301, 99–110. [Google Scholar] [CrossRef]
  50. Moyano, F.E.; Kutsch, W.L.; Rebmann, C. Soil respiration fluxes in relation to photosynthetic activity in broad-leaf and needle-leaf forest stands. Agric. For. Meteorol. 2008, 148, 135–143. [Google Scholar] [CrossRef]
  51. Sampson, D.A.; Janssens, I.A.; Curiel yuste, J.; Ceulemans, R. Basal rates of soil respiration are correlated with photosynthesis in a mixed temperate forest. Glob. Chang. Biol. 2007, 13, 2008–2017. [Google Scholar] [CrossRef]
  52. Zhang, Q.; Phillips, R.P.; Manzoni, S.; Scott, R.L.; Oishi, A.C.; Finzi, A.; Daly, E.; Vargas, R.; Novick, K.A. Changes in photosynthesis and soil moisture drive the seasonal soil respiration-temperature hysteresis relationship. Agric. For. Meteorol. 2018, 259, 184–195. [Google Scholar] [CrossRef]
  53. Suzuki, S.; Ishizuka, S.; Kitamura, K.; Yamanoi, K.; Nakai, Y. Continuous estimation of winter carbon dioxide efflux from the snow surface in a deciduous broadleaf forest. J. Geophys. Res. 2006, 111, D17101. [Google Scholar] [CrossRef]
  54. Gao, D.; Hagedorn, F.; Zhang, L.; Liu, J.; Qu, G.; Sun, J.; Peng, B.; Fan, Z.; Zheng, J.; Jiang, P.; et al. Small and transient response of winter soil respiration and microbial communities to altered snow depth in a mid-temperate forest. Appl. Soil Ecol. 2018, 130, 40–49. [Google Scholar] [CrossRef]
  55. Hubbard, R.M.; Ryan, M.G.; Elder, K.; Rhoades, C.C. Seasonal patterns in soil surface CO2 flux under snow cover in 50 and 300 year old subalpine forests. Biogeochemistry 2005, 73, 93–107. [Google Scholar] [CrossRef]
  56. Du, E.; Zhou, Z.; Li, P.; Jiang, L.; Hu, X.; Fang, J. Winter soil respiration during soil-freezing process in a boreal forest in Northeast China. J. Plant Ecol. 2013, 6, 349–357. [Google Scholar] [CrossRef] [Green Version]
  57. Schmidt, S.; Wilson, K.; Monson, R.; Lipson, D. Exponential growth of “snow molds” at sub-zero temperatures: An explanation for high beneath-snow respiration rates and Q10 values. Biogeochemistry 2009, 95, 13–21. [Google Scholar] [CrossRef]
  58. Högberg, P. Is tree root respiration more sensitive than heterotrophic respiration to changes in soil temperature? New Phytol. 2010, 188, 9–10. [Google Scholar] [CrossRef]
  59. Luo, Y.; Zhou, X. Deconvolution analysis to quantify autotrophic and heterotrophic respiration and their temperature sensitivities. New Phytol. 2010, 188, 10–11. [Google Scholar] [CrossRef] [Green Version]
  60. Bond-Lamberty, B.; Bronson, D.; Bladyka, E.; Gower, S.T. A comparison of trenched plot techniques for partitioning soil respiration. Soil Biol. Biochem. 2011, 43, 2108–2114. [Google Scholar] [CrossRef]
  61. Boone, R.D.; Nadelhoffer, K.J.; Canary, J.D.; Kaye, J.P. Roots exert a strong influence on the temperature sensitivity of soil respiration. Nature 1998, 396, 570–572. [Google Scholar] [CrossRef]
  62. Jiang, L.; Shi, F.; Li, B.; Luo, Y.; Chen, J.; Chen, J. Separating rhizosphere respiration from total soil respiration in two larch plantations in northeastern China. Tree Physiol. 2005, 25, 1187–1195. [Google Scholar] [CrossRef] [PubMed] [Green Version]
  63. Curiel Yuste, J.; Janssens, I.A.; Carrara, A.; Ceulemans, R. Annual Q10 of soil respiration reflects plant phenological patterns as well as temperature sensitivity. Glob. Chang. Biol. 2004, 10, 161–169. [Google Scholar] [CrossRef]
  64. Davidson, E.A.; Janssens, I.A. Temperature sensitivity of soil carbon decomposition and feedbacks to climate change. Nature 2006, 440, 165–173. [Google Scholar] [CrossRef] [PubMed] [Green Version]
  65. McDowell, N.G.; Marshall, J.D.; Hooker, T.D.; Musselman, R. Estimating CO2 flux from snowpacks at three sites in the Rocky Mountains. Tree Physiol. 2000, 20, 745–753. [Google Scholar] [CrossRef] [PubMed]
  66. Ruehr, N.K.; Knohl, A.; Buchmann, N. Environmental variables controlling soil respiration on diurnal, seasonal and annual time-scales in a mixed mountain forest in Switzerland. Biogeochemistry 2010, 98, 153–170. [Google Scholar] [CrossRef]
  67. Mo, W.; Lee, M.S.; Uchida, M.; Inatomi, M.; Saigusa, N.; Mariko, S.; Koizumi, H. Seasonal and annual variations in soil respiration in a cool-temperate deciduous broad-leaved forest in Japan. Agric. For. Meteorol. 2005, 134, 81–94. [Google Scholar] [CrossRef]
  68. Kim, Y.; Ueyama, M.; Nakagawa, F.; Tsunogai, U.; Tanaka, N.; Harazono, Y. Assessment of winter fluxes of CO2 and CH4 in boreal forest soils of central Alaska estimated by the profile method and the chamber method: A diagnosis of methane emission and implications for the regional carbon budget. Tellus B 2007, 59, 223–233. [Google Scholar] [CrossRef]
  69. Wang, C.; Bond-Lamberty, B.; Gower, S.T. Soil surface CO2 flux in a boreal black spruce fire chronosequence. J. Geophys. Res. 2002, 108, 8224. [Google Scholar] [CrossRef]
  70. Vogel, J.G.; Valentine, D.W.; Ruess, R.W. Soil and root respiration in mature Alaskan black spruce forests that vary in soil organic matter decomposition rates. Can. J. For. Res. 2005, 35, 161–174. [Google Scholar] [CrossRef]
  71. Tang, J.; Misson, L.; Gershenson, A.; Cheng, W.; Goldstein, A.H. Continuous measurements of soil respiration with and without roots in a ponderosa pine plantation in the Sierra Nevada Mountains. Agric. For. Meteorol. 2005, 132, 212–227. [Google Scholar] [CrossRef]
  72. Saiz, G.; Byrne, K.A.; Butterbach-Bahl, K.; Kiese, R.; Blujdea, V.; Farrell, E.P. Stand age-related effects on soil respiration in a first rotation Sitka spruce chronosequence in central Ireland. Glob. Chang. Biol. 2006, 12, 1007–1020. [Google Scholar] [CrossRef]
  73. Comstedt, D.; Boström, B.; Ekblad, A. Autotrophic and heterotrophic soil respiration in a Norway spruce forest: Estimating the root decomposition and soil moisture effects in a trenching experiment. Biogeochemistry 2011, 104, 121–132. [Google Scholar] [CrossRef]
  74. Díaz-Pinés, E.; Schindlbacher, A.; Pfeffer, M.; Jandl, R.; Zechmeister-Boltenstern, S.; Rubio, A. Root trenching: A useful tool to estimate autotrophic soil respiration? A case study in an Austrian mountain forest. Eur. J. For. Res. 2010, 129, 101–109. [Google Scholar] [CrossRef]
  75. Epron, D.; Farque, L.; Lucot, E.; Badot, P.M. Soil CO2 efflux in a beech forest: The contribution of root respiration. Ann. For. Sci. 1999, 56, 289–295. [Google Scholar] [CrossRef]
  76. Varik, M.; Kukumägi, M.; Aosaar, J.; Becker, H.; Ostonen, I.; Lõhmus, K.; Uri, V. Carbon budgets in fertile silver birch (Betula pendula Roth) chronosequence stands. Ecol. Eng. 2015, 77, 284–296. [Google Scholar] [CrossRef]
  77. Kukumägi, M.; Ostonen, I.; Uri, V.; Helmisaari, H.S.; Kanal, A.; Kull, O.; Lõhmus, K. Variation of soil respiration and its components in hemiboreal Norway spruce stands of different ages. Plant Soil 2017, 414, 265–280. [Google Scholar] [CrossRef]
  78. Sulzman, E.W.; Brant, J.B.; Bowden, R.D.; Lajtha, K. Contribution of aboveground litter, belowground litter, and rhizosphere respiration to total soil CO2 efflux in an old growth coniferous forest. Biogeochemistry 2005, 73, 231–256. [Google Scholar] [CrossRef]
  79. Kuzyakov, Y. Priming effects: Interactions between living and dead organic matter. Soil Biol. Biochem. 2010, 42, 1363–1371. [Google Scholar] [CrossRef]
Figure 1. Seasonal dynamics of (a) daily air temperature at 16 m height (Ta), daily soil temperature at 5 cm depth (T5), and daily photosynthetically active radiation (PAR); (b) daily soil volumetric water content at 0–10 cm depth (SWC10), snow depth (DS), and (c) soil CO2 efflux (RS) and CO2 efflux from trenched plots (RH) from November 2009 to October 2011. The error bars are standard deviations of the three plots. The vertical dash lines in the figure indicate the end of the year, and the horizontal dash line is zero temperature.
Forests 10 00008 g001
Figure 2. Relationships between soil temperature at 5 cm depth (T5) and (a,c) soil CO2 effluxes (RS) and (b,d) CO2 efflux from trenched plots (RH) during the non-growing season. The RS0 and RH0 are normalized respiration rate at 0 °C for RS and RH, respectively, and QS10, QH10 are temperature sensitivities for RS and RH, respectively. All p-values of the regression models were <0.001.
Forests 10 00008 g002
Figure 3. Relationships between soil temperature at 5 cm depth (T5) and (a,c) soil CO2 effluxes (RS) and (b,d) CO2 efflux from trenched plots (RH) during the growing season. The RS0 and RH0 are normalized respiration rate at 0 °C for RS and RH, respectively, and QS10, QH10 are temperature sensitivities for RS and RH, respectively. All p-vales of the regression models were <0.001.
Forests 10 00008 g003
Figure 4. Contributions of the non-growing season to annual (climatic year) respiration for soil (RS), heterotrophic (RH), and rhizospheric (RR) respirations (a); the contribution of RH to RS for the non-growing season (NGS; from November to April), the growing season (GS; from May to October) and annual fluxes (b). The error bars are standard deviations of the three plots.
Forests 10 00008 g004
Table 1. Basic stand characteristics, soil organic carbon, and total nitrogen for the three plots.
Plot NumberBA
m2 m−2
Biomass
Mg ha−1
Litterfall
g m−2 yr−1
FRB
g m−2
FRN
g m−2
SOC
mg g−1
TN
mg g−1
SOC Density
Mg ha−1
TN Density
Mg ha−1
219.54155.09459.52330.33253.7397.519.8192.229.28
326.08147.04469.02237.82267.2856.867.5168.919.10
420.74142.36447.49304.34298.2750.686.6366.958.76
Basal area (BA) and biomass data were from 2010. Litterfall was the mean of five 1-m2 traps per plot [38,39] in 2010 and 2011. Fine root (diameter ≤ 2 mm) biomass (FRB) and fine root necromass (FRN) of the top 40 cm of soil were estimated by eight 10-cm diameter root cores per plot in the summer of 2008. Soil organic carbon (SOC) and total nitrogen (TN) of the top 20 cm were measured in 2016 [40].
Table 2. Models of soil respiration from control plots (RS, in μmol m−2 s−1) and trenched plots (RH, in μmol m−2 s−1) against soil temperature at 5 cm depth (T5, in °C), and soil volumetric water content of the top 10 cm (SWC10, in m3 m−3) for the three plots during the growing season (May to October) for 2010 and 2011.
YearVariablePlotabcdNadj.R2RMSE
2010RS20.440.044−0.8370.104720.8420.204
2010RS3−0.030.091720.8740.163
2010RS4−0.0870.0920.45720.8420.176
2010RH20.2810.077−1.181360.8270.222
2010RH3−0.1780.0640.032360.8500.151
2010RH4−0.2690.085360.8330.181
2011RS2−0.7150.1282.114720.8780.219
2011RS3−0.7230.1122.021720.8250.242
2011RS4−0.6480.1181.976720.8550.218
2011RH2−0.5020.111360.8600.237
2011RH3−0.8730.1041.654360.9180.158
2011RH4−0.5450.0970.051360.8490.227
The regression models are of the form ln(R) = a + b × T5 + c × SWC10 + d × T5 × SWC10, where ln is natural logarithm; R is RS or RH; and a, b, c, and d are significant coefficients (α = 0.05). N, adj. R2, and RMSE are sample size, adjusted determination coefficient, and root mean square error, respectively. All models are highly significant (p < 0.001).
Table 3. Cumulative soil surface CO2 fluxes (± standard deviation (SD)) in the control plot (RS), in the trenched plot (RH), and rhizospheric respiration (RR). The means ± SD of the three plots are given.
PeriodSeasonCumulative RS g C m−2Cumulative RH g C m−2Cumulative RR g C m−2
November 2009–April 2010Non-growing season83.96 ± 0.9974.80 ± 5.199.16 ± 0.82
May 2010–October 2010Growing season673.35 ± 29.26461.64 ± 136.25211.71 ± 27.75
Nov. 2009–October 2010Climatic year757.31 ± 29.96536.44 ± 141.44220.87 ± 28.56
November 2010–April 2011Non-growing season103.47 ± 5.3384.02 ± 9.9119.46 ± 3.42
May 2011–October 2011Growing season876.52 ± 127.96473.95 ± 211.10402.57 ± 59.49
November 2010–October 2011Climatic year979.99 ± 133.07557.97 ± 220.15422.02 ± 62.42
Annual mean868.65 ± 78.92547.20 ± 179.63307.14 ± 31.97

