Review

A Review: Individual Tree Species Classification Using Integrated Airborne LiDAR and Optical Imagery with a Focus on the Urban Environment

1
State Key Joint Laboratory of Environmental Simulation and Pollution Control, and School of Environment, Tsinghua University, Beijing 100084, China
2
Department of Natural Resources, Faculty of Geo-information Science and Earth Observation (ITC), University of Twente, P.O. Box 217, 7500 AE Enschede, The Netherlands
*
Author to whom correspondence should be addressed.
Forests 2019, 10(1), 1; https://doi.org/10.3390/f10010001
Submission received: 23 November 2018 / Revised: 16 December 2018 / Accepted: 18 December 2018 / Published: 20 December 2018

Abstract

:
With the significant progress of urbanization, cities and towns are suffering from air pollution, heat island effects, and other environmental problems. Urban vegetation, especially trees, plays a significant role in solving these ecological problems. To maximize services provided by vegetation, urban tree species should be properly selected and optimally arranged. Therefore, accurate classification of tree species in urban environments has become a major issue. In this paper, we reviewed the potential of light detection and ranging (LiDAR) data to improve the accuracy of urban tree species classification. In detail, we reviewed the studies using LiDAR data in urban tree species mapping, especially studies where LiDAR data was fused with optical imagery, through classification accuracy comparison, general workflow extraction, and discussion and summarizing of the specific contribution of LiDAR. It is concluded that combining LiDAR data in urban tree species identification could achieve better classification accuracy than using either dataset individually, and that such improvements are mainly due to finer segmentation, shadowing effect reduction, and refinement of classification rules based on LiDAR. Furthermore, some suggestions are given to improve the classification accuracy on a finer and larger species level, while also aiming to maintain classification costs.

1. Introduction

Rapid urbanization has become one of the most characteristic phenomena of modern times worldwide and has led to important social, economic and environmental consequences [1]. By 2011, over 50% of the world population lived in cities. The United Nations predicted that by 2050 about 86% of the developed world and 64% of the developing world will be urbanized [2]. With huge populations and dense artificial structures, urban areas have been suffering from air pollution, heat island effects, increased peak flow of rainwater runoff, and other environmental problems [3].
Trees, being an important component in urban ecosystems, act as a sustainable and unique solution to these problems. A healthy, properly-arranged and well-managed urban forest can provide both aesthetic views and many ecological benefits, but the magnitude of these services depends on the species composition, growth situation, and location context of urban vegetation [3,4,5]. For example, many studies have noted that trees can reduce air pollutants in direct and indirect ways [6,7]. Directly, trees absorb gaseous pollutants through leaf stoma and tree canopies intercept particulate pollutants in the air [7]. Indirectly, by shading while transpiring, trees can reduce the atmospheric temperature, thus lowering the rate of chemical reactions that produce secondary air pollutants [8]. However, the extent of the reduction in air pollutants is significantly related to tree species. Yang et al. examined the influence of urban trees on air quality in Beijing, China, using the Urban Forest Effects Model [9]. In their conclusion, the current tree species composition in Beijing is not ideal for air pollutant removal, since the dominant tree genera, including Populus, Robinia, and Salix, have high biogenic volatile organic compound (BVOC) emission rates. More specifically, Beckett et al. compared the ability to capture particulate pollutants of five urban tree species in Brighton, UK, and found that coniferous species captured more particles than broad-leaved species [10].
In brief, urban vegetation, particularly trees, plays important roles in adsorbing air pollutants such as ozone and sulfur dioxide, mitigating carbon dioxide, lowering urban temperature, and dampening peak flows [11,12]. To maximize these benefits, suitable urban tree species should be carefully selected and optimally arranged.
Urban tree species classification can provide fundamental information not only for subsequent urban vegetation biomass and carbon storage estimation [13,14], but also for further urban ecosystem assessment and future city planning and management. Conventionally, urban tree species composition information was collected by field surveys, which were highly time and labor consuming, and limited to the sample plot level [15]. With the rapid development of remote sensing technology and the appearance of classification algorithms for computers, dominant species identification at plot level and urban tree species composition prediction have been extensively undertaken based on optical imagery with excellent accuracy [16]. As the spatial and spectral resolutions of optical imagery have improved, separation and delineation of individual trees has become possible. Then, with the constant improvements of semi-automatic and automatic classifiers, individual tree species classification research have been conducted to meet the requirements for finer urban forest inventories. Recently, light detection and ranging (LiDAR) techniques have been identified to improve classification accuracy, because of their unique capability to detect the three-dimensional structure information of individual trees [17]. In brief, individual urban tree species classification has evolved with the developments of statistical methodology, computational capacities of hardware and software, and remote sensing technologies including LiDAR [18].
In this review, we first summarize the basic achievements and limitations of urban tree species classification research using optical remote sensing imagery, and then review the studies where LiDAR data was combined in classification to achieve better results. Furthermore, we compare the classification results in these studies using two accuracy indices and summarize a general workflow. In addition, we discuss the specific contribution of LiDAR data to improve the classification quality in every step of the workflow. Finally, we provide some future considerations for improving the classification accuracies in larger species groups or at finer species levels, hopefully to provide a reference for more accurate and finer urban tree species classification in China and other cities worldwide, to promote urban forest management and urban ecological assessments.

2. Urban Tree Species Classification from Optical Remote Sensing Imagery

Over the past several decades, remote sensing has become one of the most widely used geological observation technologies. It is a kind of long-distance and no-direct contact observation technology using sensors based on modern carrying systems to detect the electromagnetic waves emitted or reflected by ground objects, and then recording and storing the information for subsequent extraction, processing, analysis and application [19]. It has advanced abilities, such as large-scale synchronous observation, easy cycle repeatability, and good data quality, all of which have led to it being increasingly applied in forest resource monitoring and management [20]. The first applications of remote sensing technology in tree species classification was to manually interpret aerial photographs, but it was slow, expensive and highly dependent on researchers’ knowledge of tree species [21]. Then, with the significant developments in computer science, more algorithms have been devised and implemented to classify tree species from remote sensing imagery with higher efficiency.

2.1. Pixel-Based vs. Object-Based Classification

“Classification” relates to methods used to identify objects (such as tree species). In classification, features presenting the highest separability of the targeted objects are used to differentiate individual objects from others [22,23]. The most fundamental and commonly used feature is spectral information. Specifically, vegetation has unique spectral reflectance characteristics with strong absorption in red wavelengths and strong reflectance in near-infrared wavelengths [24], making it separable from other ground objects. Moreover, different tree species have different canopy structures (such as leaf shape, leaf and branch surface roughness, and leaf area density) that lead to finer interspecies differences in spectra reflectance [24], also known as spectral signature.
The pixel is the fundamental unit of remote sensing imagery, therefore traditional classification methods using remote sensing imagery are mostly pixel-based. Pixel-based classification analyzes the spectral signature of every pixel in remotely sensed imagery taken from targeted areas [25]. However, with the improvement in spatial resolution of remotely sensed imagery, the size of a single pixel has become gradually smaller than that of the target. This means the spectral data from an individual pixel cannot represent the characteristics of a whole target (such as a single tree) any more [26]. Moreover, problems also appear because the spectral resolution of remote sensors is getting finer. Many studies indicate that traditional pixel-based classification can produce salt-and-pepper noise in the classification output when using hyperspectral imagery, which contributes to inaccuracy [27,28]. Therefore, some researchers have tried to incorporate texture features into pixel-based classification to improve accuracy, resulting in some better results [29,30]. However, it is noted that improved classification based on texture features requires a predefined neighboring layout [31].
To overcome these problems, object-based classification has been proposed. Its basic units are image objects (or segments), rather than the single pixels of pixel-based classification [32]. With the recent development of software such as eCognition Professional and Feature Analyst [33], object-based classification has become more accessible and more generally used. In a general workflow, image objects are first generated through a segmentation procedure. Every object is composed of several spatially adjacent pixels. This segmentation based on homogeneity criteria is similar to the conceptual way in which humans organize and interpret the landscape, which is one of the strengths of object-based classification [34]. The segments are then classified using not only spectral signatures but also spatial, textural and contextual features. Environmental features such as elevation, slope and aspect are also used [35]. All these features can potentially improve classification accuracy. Many studies have confirmed the advantages mentioned above of object-based classification over pixel-based classification [33,36,37]. For example, Weih and Riggan compared the ability of both classification techniques to classify land-cover (13 categories in total, eight of which were major vegetation categories) in Garland County, Arkansas, USA, based on multi-temporal aerial images with high spatial resolution [37]. In their results, the overall accuracy (OA) of object-based classification was 82.0%, which was significantly better than pixel-based classification (OA 66.9%).

2.2. Development and Limitations

Over the past several decades, optical remote sensing imagery, with the abilities and advantages mentioned above, has been generally applied in mapping vegetation, land-cover and land-use in many areas. Using remote sensing data to classify tree species was initially attempted in natural forests based on moderate-resolution satellite images (such as Landsat TM and later ETM+) [38]. However, the low spatial resolution of these images limits the classification to group/cluster level with relatively low accuracy [39,40]. With the increase in spatial resolution of remote sensors, single trees have become visible in remotely sensed imagery, thus advancing tree species classification to individual tree level. Since the end of last century, many studies have used multispectral satellite images with high spatial resolution (such as IKONOS) in forest classification [41,42,43]. For example, Carleer and Wolff used IKONOS image to identify seven tree species groups in a forest in Brussels, Belgium, and achieved an OA of 82% [41]. While using the same IKONOS imagery to classify 21 tree species in a mixed forest in Hokkaido, Japan, Katoh only obtained an average accuracy of 62% [43]. In both studies, the pixel-based supervised maximum likelihood (ML) classifier was utilized, but different improvements were made: Carleer and Wolff collected remotely sensed imagery from summer and autumn to enrich spectral characteristics, while Katoh’s research referred to the tree crown projection map to strengthen the training process. In these studies, however, the relatively low spectral resolution could not satisfy a more detailed classification. Subsequently, optical remote sensing imagery with both high spatial and spectral resolution has been developed (such as AVIRIS) [44]. The dense sampling and narrow band measures of hyperspectral sensors to tree spectra provide valuable data for tree species classification [45]. For example, Clark et al. used hyperspectral imagery to classify seven tree species in a forest in California, USA, and a highest OA of 86% was achieved by an object-based linear discriminant analysis (LDA) classifier [46]. However, it is noted that, in this research, such high accuracy resulted from the fact that only seven canopy-emergent species were selected from the total of 21 species in the study area to better delineate crown objects.
Nevertheless, the unique urban environments pose specific challenges for tree species classification based on remotely sensed imagery. Compared to the trees in natural forests, trees in urban environments often exist as single trees or isolated groups, thus requiring finer spatial resolution to differentiate them as individual objects. Moreover, urban trees are gradually planted with the progress of urbanization and are strongly influenced by surrounding environmental settings such as streets, communities and factories. Consequently, different individual trees of the same species can have different ages, growing conditions, sizes and shapes, leading to severe within-species variability of tree spectral characteristics [47]. The biggest challenge is that urban areas are a mosaic of many vegetation types and man-made structures. Therefore, the obscuring and shadowing effects caused by nearby background features, such as imperious surfaces, roads and buildings, makes the precise segmentation and identification of urban tree species even more difficult [48].
Some studies have tested classification approaches based on optical remote sensing imagery to map urban tree species but have only achieved moderate results because of the challenges mentioned above. Sugumaran et al. made very early attempts using three sets of multispectral imagery with very high spatial resolution (4 m, 1 m and 25 cm) to roughly recognize oak trees from the whole urban climax forest in Columbia, USA [49]. They achieved a highest oak tree identification accuracy of 87.2% with 1 m resolution using a pixel-based ML classifier, and concluded that imagery with 1 m resolution is optimal to differentiate tree species and minimize shadowing effects. Then, in later research, Pu and Landry compared the ability of two sets of satellite multispectral imagery, IKONOS (4 m resolution) and WorldView-2 (2 m resolution), to classify six urban tree species in Florida, USA [50]. In their results, the highest OA was 62.39% (Kappa 0.506) using an object-based LDA classifier with all eight bands of the WorldView-2 imagery. Similar attempts have also been made using hyperspectral imagery. Xiao et al. used AVIRIS imagery in mapping of 16 common urban tree species in California, USA, and achieved an overall accuracy of 70% at the tree species level [24], while the species-specific results showed that classification accuracy of small-size tree species was relatively low due to the shadowing effect. Alonzo et al. also used AVIRIS imagery to discriminate 15 common urban tree species in California, USA, and achieved a higher OA of 86% (Kappa 0.85) with an object-based canonical discriminant analysis (CDA) classifier [51]. Similarly, they indicated that the accuracy results varied greatly with tree species, i.e., species with the lowest accuracies are those with smallest crown areas.
In general, remote sensing imagery has been gradually used to classify tree species in urban ecosystems, but the results are not as robust as those in natural forests. The limitation of optical remote sensing imagery to accurately map urban tree species is attributable to three major reasons: (1) the various surroundings of urban trees create a complicated background, thus increasing the complexity of classification; (2) overlapping and shadowing effects restrict the segmentation of individual trees or crowns, especially for small-size species; and, (3) the Hughes phenomenon [52], or the curse of dimensionality, that is, given a fixed sample size, the identification accuracy first increases then declines with the increase in spectral resolution due to increasing within-species spectral variation [53]. To meet the requirement for a finer and more accurate urban tree species classification, the spectral information from optical imagery is insufficient, and some other features, such as structural information, should be taken into consideration.

3. Urban Tree Species Classification from LiDAR Data

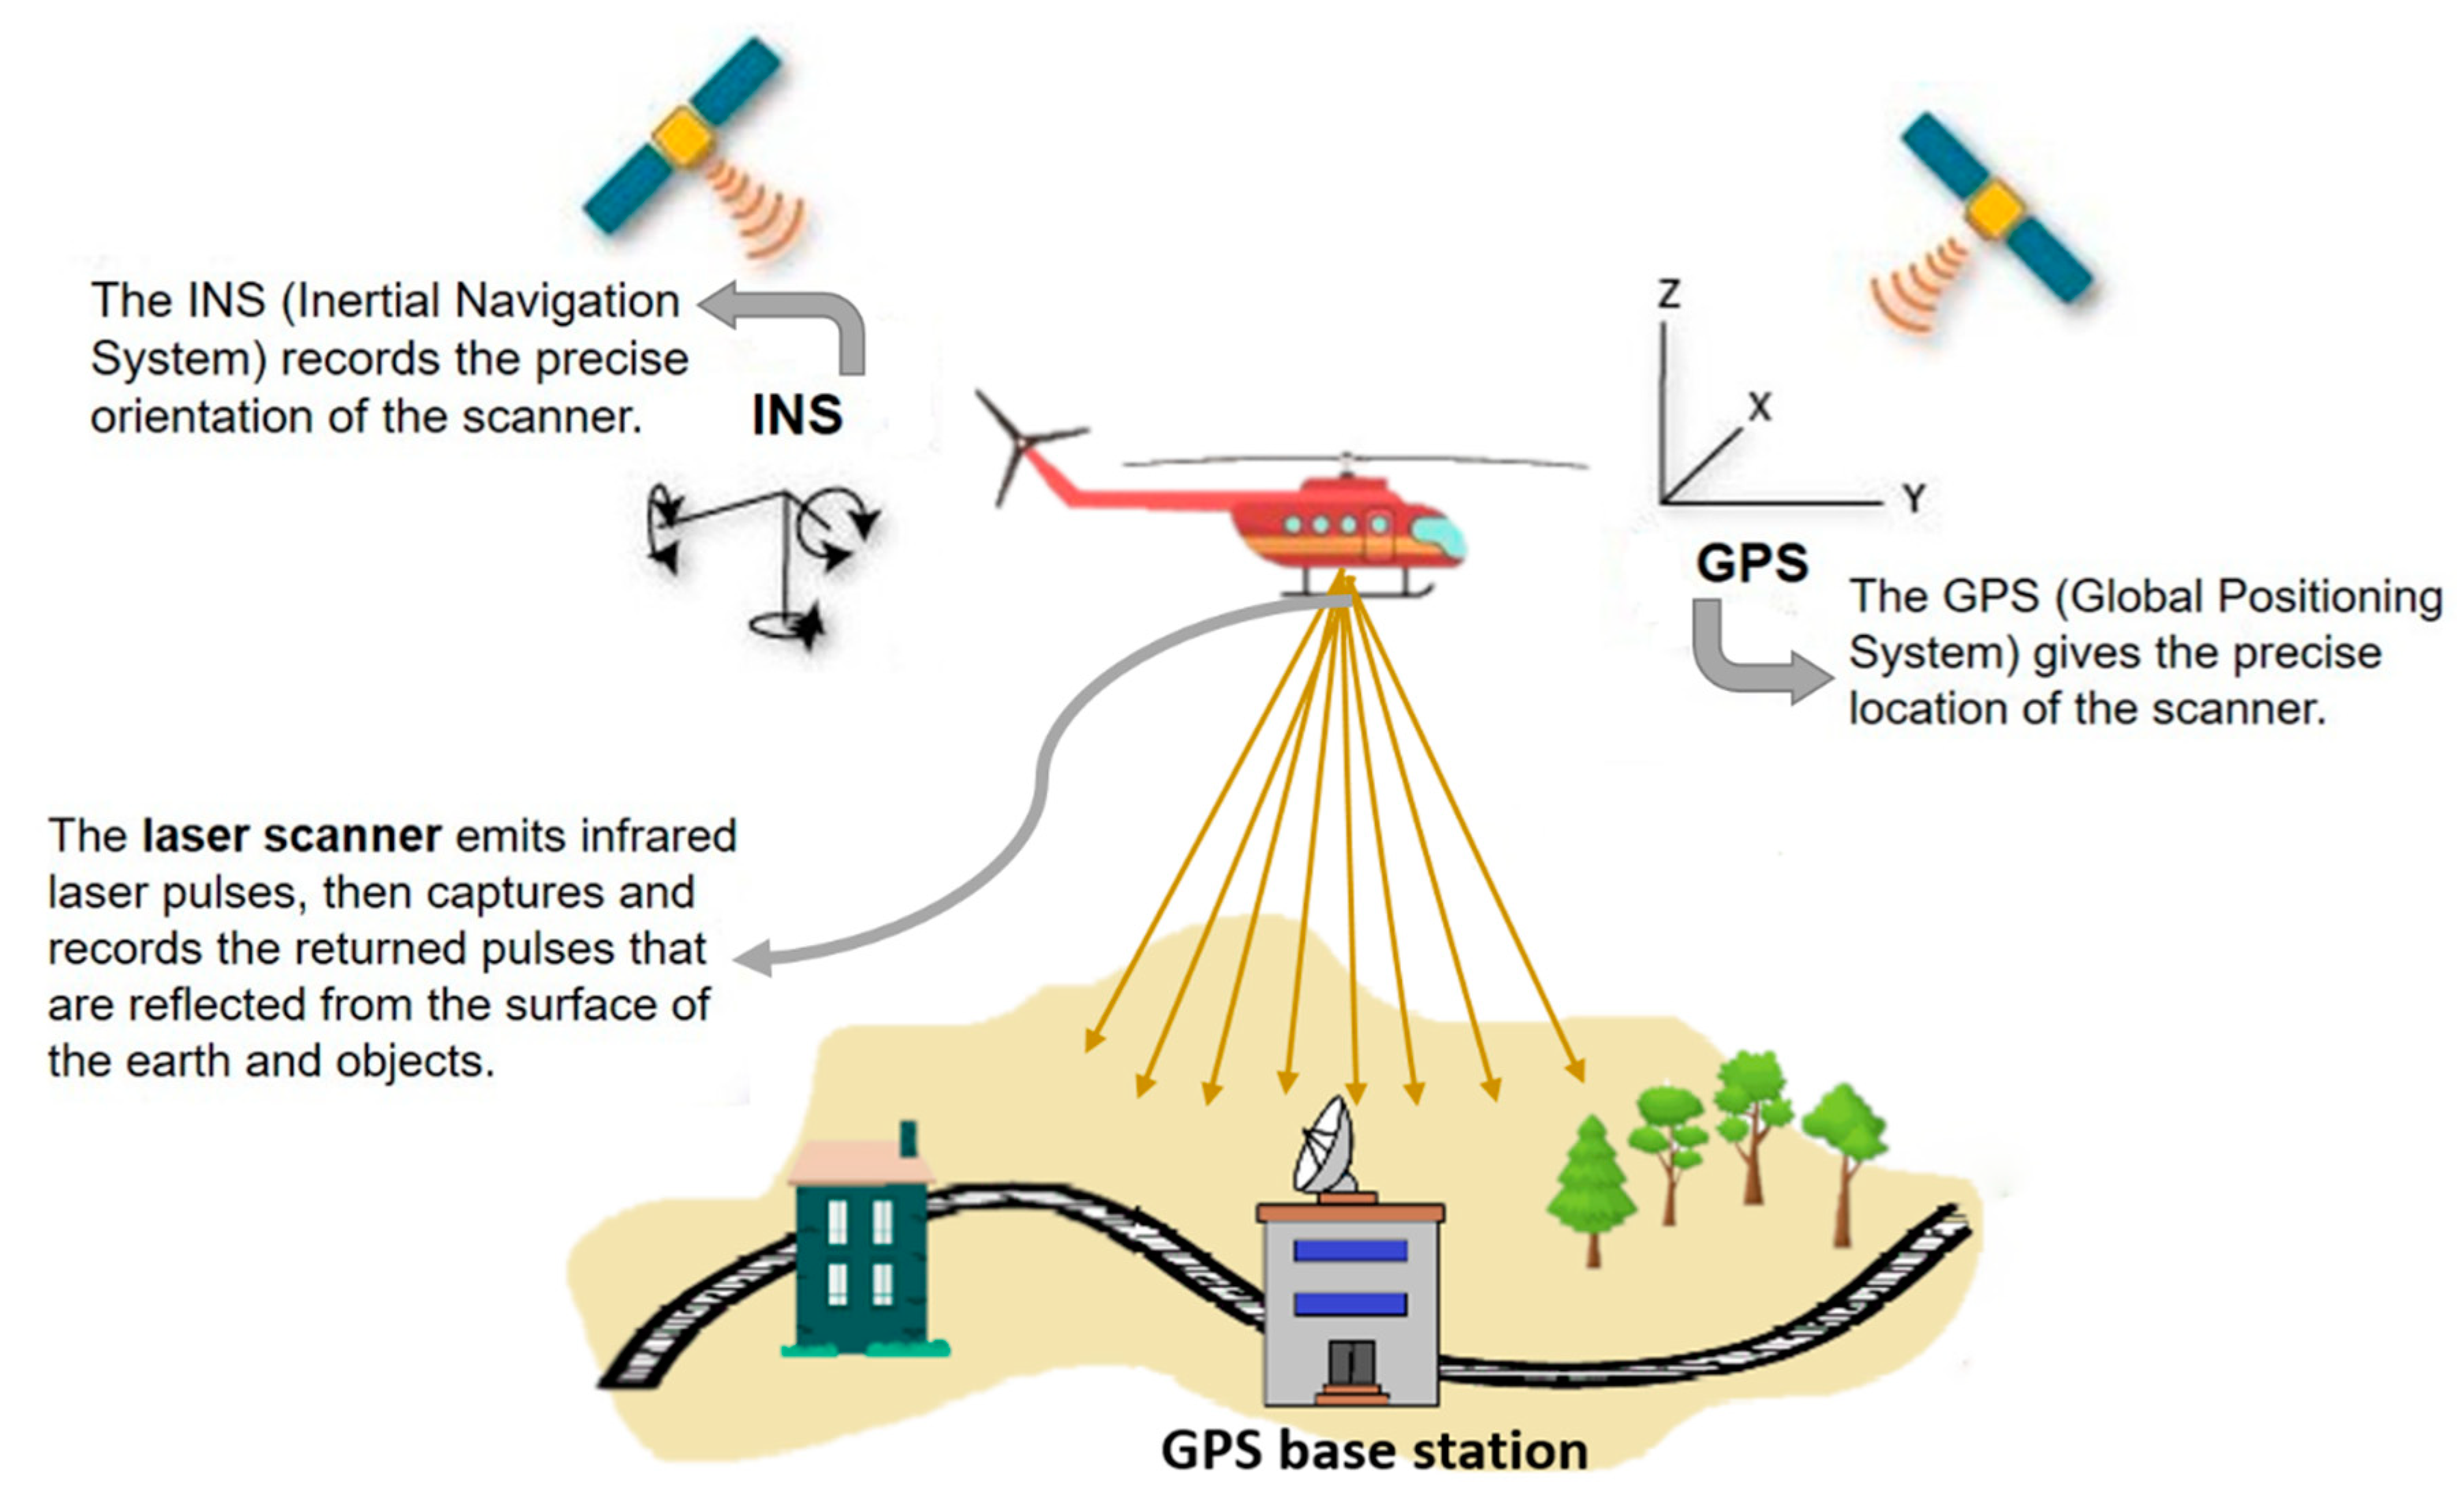
3.1. Introduction to LiDAR

LiDAR, or laser altimetry, is an advanced active remote sensing technology. It uses laser scanning to measure physical attributes such as height and elevation of the landscape, and obtains the three-dimensional geological coordinates of targeted objects, associated with the Global Positioning System (GPS) and the Inertial Navigation System (INS) [54]. The most basic data acquired by LiDAR systems is the distance between laser sensors and targets (Figure 1). Furthermore, LiDAR devices can record reflected energy of the targeted surface, and obtain features of the reflectance spectra such as amplitude, frequency and phase [17].
According to the carrying platforms, LiDAR systems are generally divided into the three major categories of space-borne, airborne and ground-based LiDAR [56]. With scanning from different heights based on different carriers, LiDAR systems can achieve all scales of geological observation and detection, and fulfill different levels of resolution requirements. Specifically, there are two major types of LiDAR data, which are point cloud data and waveform data. In forestry research, point cloud data are commonly used to generate forest structure parameters, such as tree height, diameter at breast height (DBH), and canopy volume calculated based on single-tree extraction and delineation [57]. In contrast, waveform LiDAR system collects the whole return signal and generates a complete waveform profile [58]. Waveform data can be applied not only to obtain distance information, but also to analyze the vertical distribution of targets, and deduce the structure and physical properties.
In general, LiDAR technology has the most prominent advantages of both high-resolution and large-scale detection, and measurement of three-dimensional geological data. Thus, it has become increasingly popular in ecological applications, such as remote sensing and mapping ground topography, measurement of 3D structures and functional parameters of forest canopies, classification of forest tree species, and prediction of aboveground biomass and other forest vertical attributes [59,60,61,62].

3.2. LiDAR in Urban Tree Species Classification

Given the limitations inherent in optical remote sensing imagery and the difficulties posed by unique urban environments, LiDAR has been valued for providing important complementary types of information, such as elevation data and structural features, that have the potential to improve tree species classification accuracy [63]. The initial attempts using LiDAR to classify tree species were in natural forest at the cluster/plot level with low point density [64]. With an increase in the point density, trees can be scanned and recognized by LiDAR at the individual tree level, which is crucial for classification of urban forests with sparse distribution and high spatial heterogeneity. However, LiDAR systems only emit laser pulses with very narrow bands, therefore, the spectral data collected is clearly insufficient for species identification [65]. For example, Brandtberg introduced an individual tree species classification using small footprint LiDAR data to identify three deciduous tree species in Virginia, USA, but only achieved a highest OA of 64% [65]. In a further attempt to classify 29 urban tree species, Alonzo et al. only achieved an OA of 32.9% using LiDAR data alone [66], which was even much lower than using hyperspectral imagery solely (OA 79.2%). To overcome such limitations on spectral information of LiDAR data, an increasing number of studies have been conducted on the fusion of LiDAR data and high-resolution optical imagery for urban tree species identification.

3.2.1. Urban Tree Species Classification through Image Fusion

“Fusion” is a common term in remote sensing research that refers to the combination of remote sensing data from multiple sources on different levels [67]. In the early stages of tree species classification studies, LiDAR data were only utilized through combination in very simple ways. The capability of LiDAR to “penetrate” through tree canopies (not actually through solid objects but through openings on the surfaces of each layer [17]) was noted for the precise elevation/height information it provides. It was extensively used to generate digital surface models (DSM) and digital terrain models (DTM) with high accuracy, and, then, to produce absolute height data for segmentations and classifications by subtracting DSM from DTM [63]. For example, in an urban tree species classification, Tigges et al. used two sets of LiDAR height models, DSM and DTM, to generate the absolute height distribution, which was then applied as a height threshold in optical image segmentation to separate canopy pixels from non-canopy pixels [68]. Similarly, in two urban forests of Washington, USA, Zhang et al. introduced LiDAR-derived height models into an object-based classification at the segmentation level [69]. Individual tree crown objects were segmented from the LiDAR-derived canopy height models (CHM) with auxiliary hyperspatial aerial imagery, and then projected onto the hyperspectral imagery to extract spectral features. In brief, LiDAR-extracted CHMs can be applied, independently or with the aid of passive optical imagery, to the segmentation procedure, thereby improving the subsequent classification of objects.
Gradually, LiDAR data have been combined with both multispectral and hyperspectral imagery in deeper ways to map tree species. Attempts were firstly made in natural forests. Holmgren et al. introduced airborne LiDAR data in an individual tree classification approach. Tree crown segments were generated from LiDAR point cloud data and then projected onto the multispectral imagery. In final classification, LiDAR-derived features (structural and intensity features) and multispectral features were combined to achieve the best OA of 96% [70]. Species-specific results also showed that LiDAR data was most efficient in identifying different coniferous tree species, e.g., pine and spruce trees. Ke et al. made further efforts by examining the influences of data fusion (LiDAR and multispectral data) on each procedure of classification [26]. It was confirmed in this research that the best results in terms of both segmentation quality and classification accuracy were achieved when integrated datasets were applied. It was also confirmed that segmentation quality has a direct influence on the final classification accuracy, therefore, the highest OA was acquired when airborne LiDAR data were combined in every step. Integrating LiDAR point cloud data into segmentations can exclude the pixels outside of the real crowns, thereby improving the spectral characteristics from crown objects and reducing the within-species spectral variations. Similar conclusions were achieved in Dalponte et al.’s research where airborne LiDAR data were respectively combined with two sets of optical imagery to classify eight tree groups in the Southern Alps, Italy [63]. The integration of LiDAR-extracted height features improved OA of classification based solely on hyperspectral and multispectral imagery by 8.9% and 10.5%, respectively.
With the great improvement in natural forest tree species classification based on combination with LiDAR data, similar attempts have begun to be conducted in urban environments. In a study to identify nine common urban tree classes in Iowa, Sugumaran and Voss firstly compared the segmentation quality with and without the aid of LiDAR data and confirmed that the LiDAR-derived elevation data notably helps to differentiate crown segments with nearby shadows, thus greatly improving the segmentation quality in urban contexts [71]. For the final classification, the combination of LiDAR data increased classification accuracy by 12% based on hyperspectral imagery alone. Such accuracy improvement based on the aid of LiDAR data was especially evident in smaller-size tree species such as saplings and shrubbery. In a following study, they made a further exploration to examine the seasonal effect of optical imagery on classification [72]. In their results, although the seasonal effects on the classification accuracy was not as significant as expected, LiDAR data still improved the OA by 19% for classification in both summer and autumn. However, it is worth noting that, in this research, the best classification accuracy was only 57% for seven tree species on a more specific species level, which means finer classification with higher accuracy is remains a challenge.
To fill this gap of classifying the enlarged species group, Zhang and Qiu developed a neuro-fuzzy approach, namely, adaptive Gaussian fuzzy learning vector quantization (AGFLVQ), to identify 40 main urban tree species in Texas, USA [73]. Despite of the large number of tree species, they still achieved an excellent OA of 68.8% due to the unique innovation of using individual treetops rather than crowns as objects to avoid occlusion and shading. Given that airborne LiDAR data were only utilized in DTM generation and individual tree detection for object segmentation, the classification results could be further improved if LiDAR-extracted features were incorporated in the future. Similarly, Alonzo et al. proposed a canonical discriminant analysis to map 29 common urban tree species in California [66]. The combination with LiDAR data (waveform data transferred into point cloud data) improved the OA from 79.2% using hyperspectral image alone to 83.4%. Moreover, they introduced a unique LiDAR-extracted structural feature, crown porosity, into the classification rules, and found this feature could improve the identification of tree species with larger but sparser crowns. In summary, most research proved that integration of optical remote sensing imagery and LiDAR data resulted in more accurate urban tree species mapping than using either of the data sources independently. This improvement in classification accuracies is particularly distinct for tree species with unique morphology or small crown sizes, for which LiDAR-derived structural data are helpful by delineating crown objects and enriching the classification hierarchy.
Combining LiDAR data with optical remote sensing imagery is the most common but definitely not the only fusion type in urban tree species classification. In a recent study, two sets of airborne LiDAR data were integrated to identify three main tree species groups in a forest in Finland [74]. It was determined that a smaller footprint may improve the signal-to-noise ratio of intensity measurement. Therefore, ALS50 data with a smaller footprint (17–18 cm) was combined with ALTM3100 data (25–28 cm) to enrich the data density of crown modeling and to refine the intensity feature extraction. Compared with classification using either LiDAR dataset independently, the fusion of two LiDAR datasets performed the best with an OA of 89.4%. Moreover, in a further comparison of individual LiDAR-extracted features, several rare but ecologically important species, such as Salix caprea, showed significantly high upper-intensity values, suggesting they could potentially be differentiated based on LiDAR-derived intensity features.

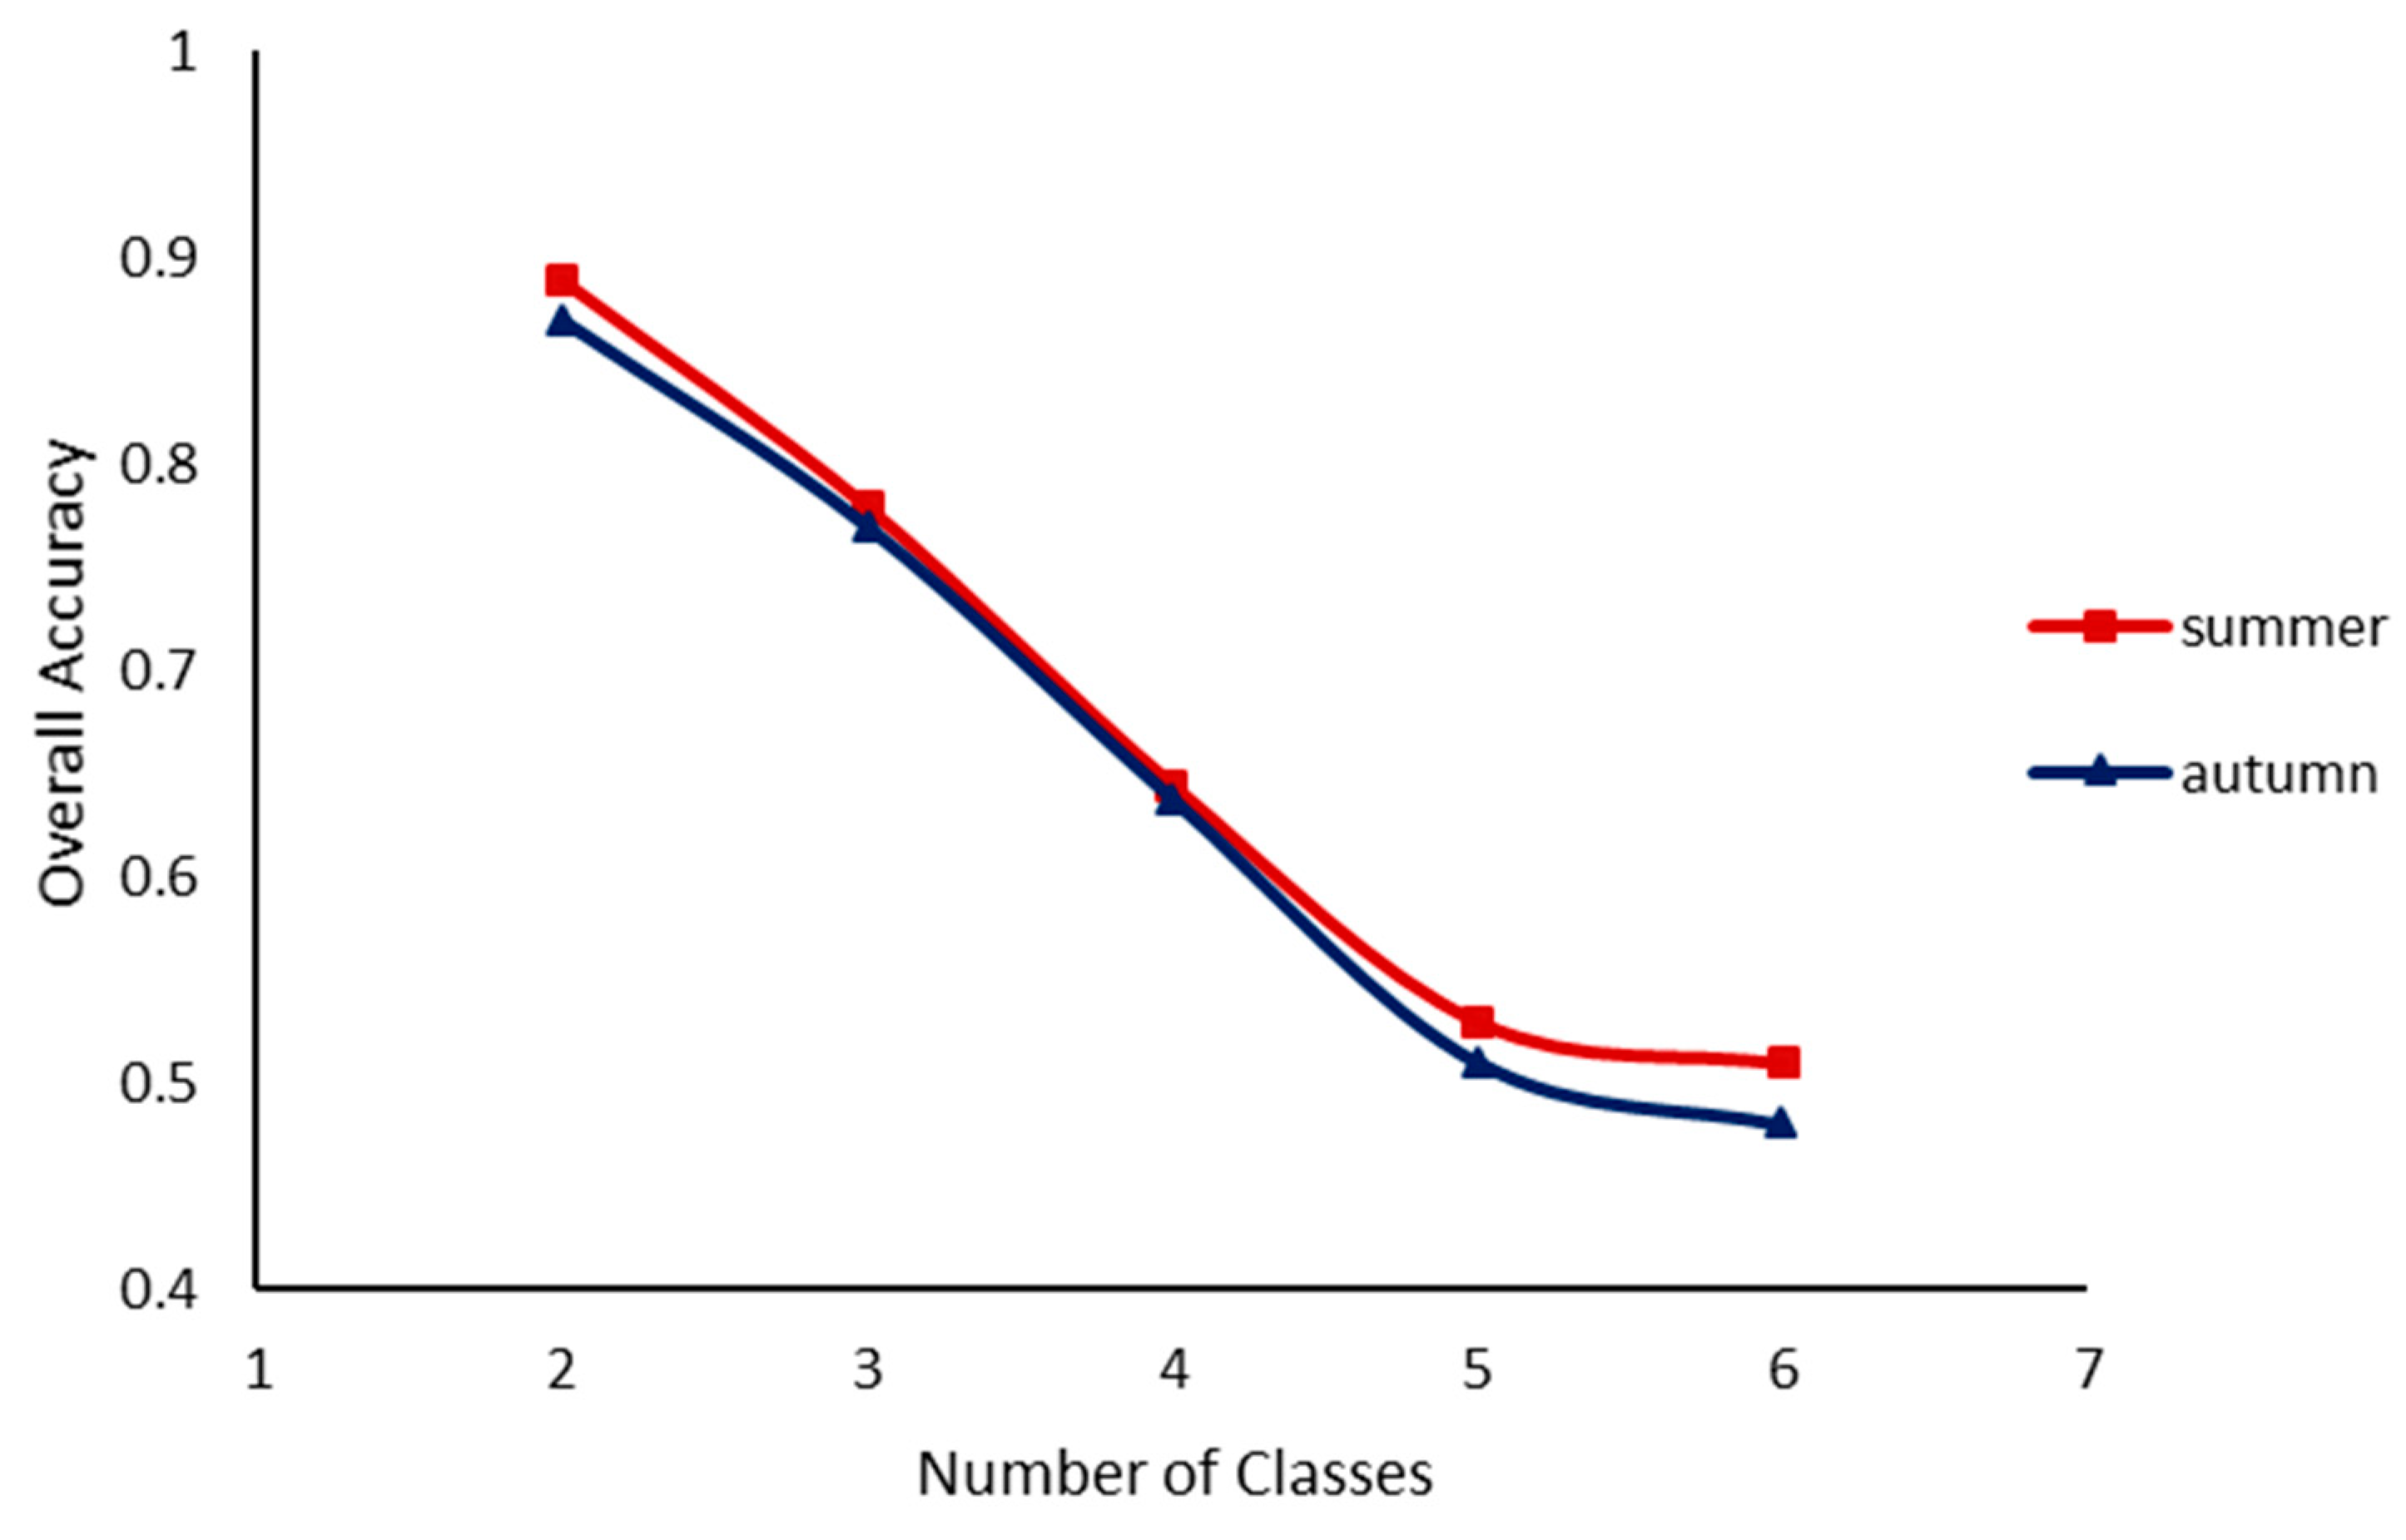
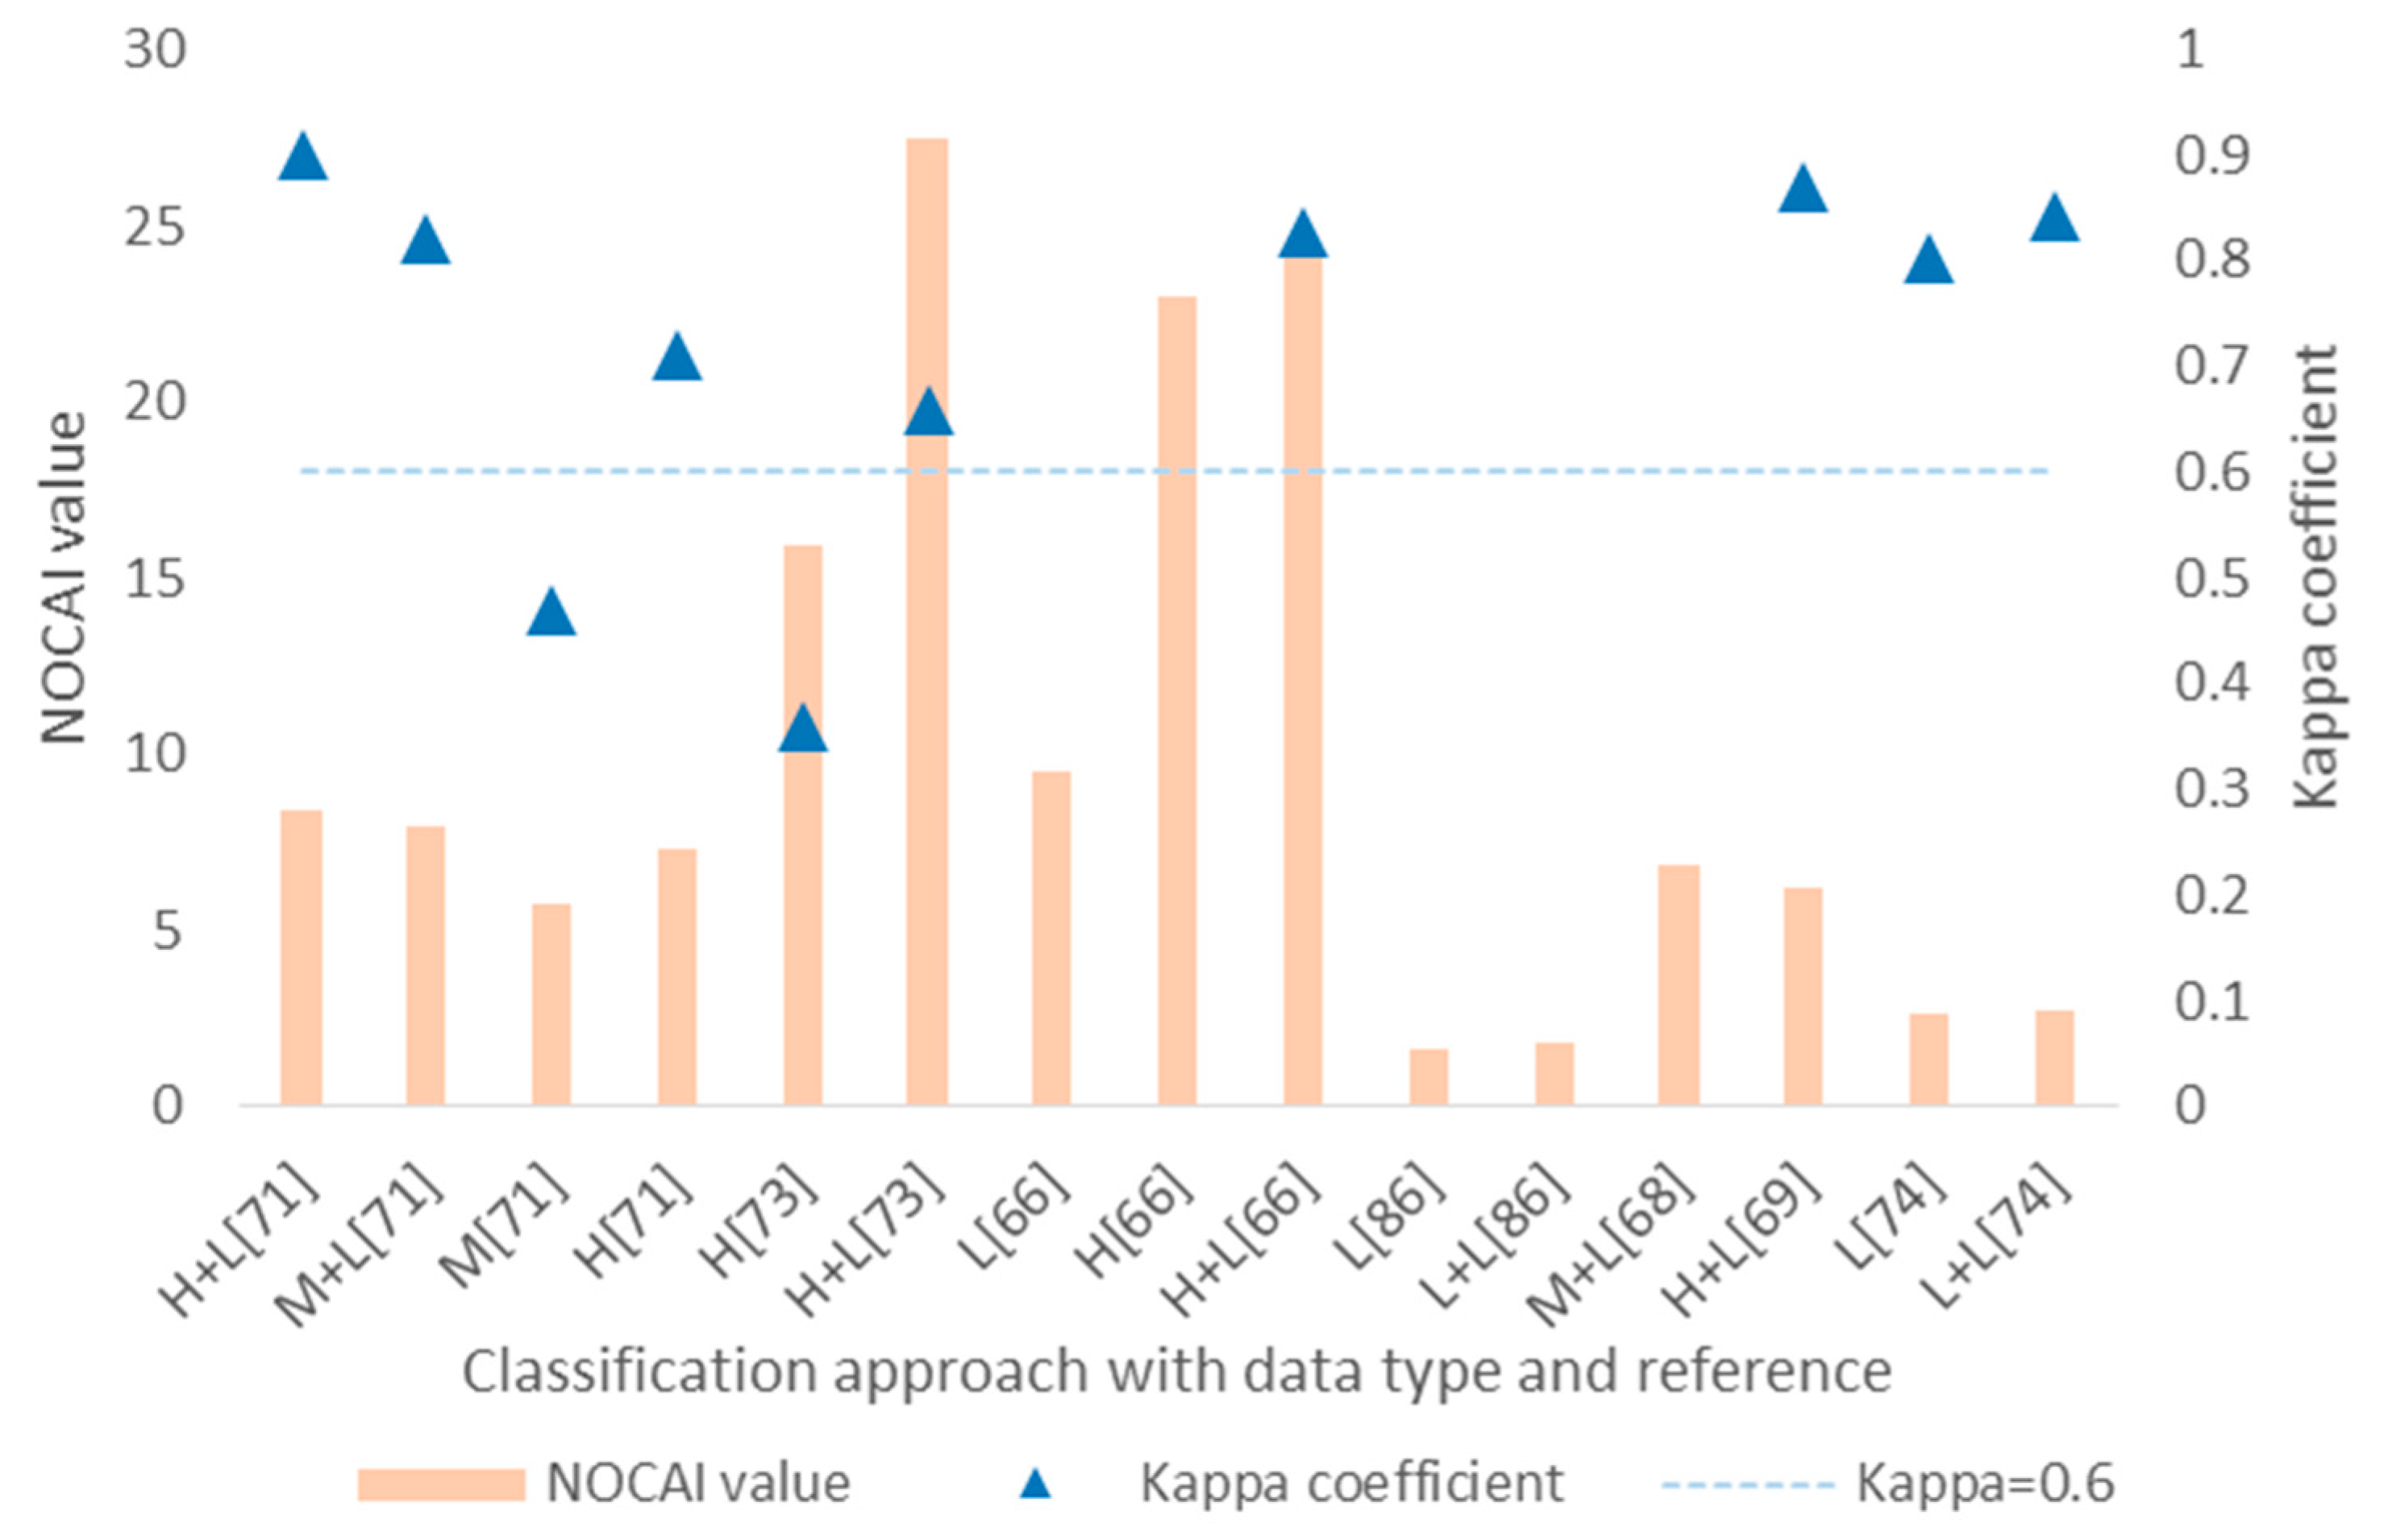
3.2.2. Accuracy Comparison of Urban Tree Species Classification

In the urban tree species classification studies reviewed above, each study proposed a specifically new approach and tested it in a particular urban environment. To quantify the classification ability of a proposed approach for comparison, a very intuitive index is overall accuracy, which is calculated from the number of trees correctly tagged relative to the total number of trees. Overall accuracy is easy to calculate and understand, however, it can be influenced by the number of species discriminated, seasons when data were collected, and sample sizes. It has been indicated in some research that overall accuracy declines with increase in classification complexity [72], e.g., the negative relationship between the number of tree classes classified and overall accuracy is shown in Figure 2, based on Mathew and Ramanathan’s study [72].
Kappa analysis has been believed to be a better statistical approach to represent the general classification ability. This discrete multivariate analysis utilizes every element in the confusion matrix and excludes accidental consistence and the influence of sample sizes, and thus is more suitable for the comparison of different classification approaches under similar sampling situations [75,76]. The kappa coefficient is calculated by Equation (1) [77].
K = N i = 1 m X i i i = 1 m X i + X + i N 2 i = 1 m X i + X + i
where N is the total number of samples; Xii is value on the diagonal of the confusion matrix; m is the number of classes/species; and Xi+ and X+i are the sum of values on the ith row and ith column respectively. Logically, the kappa coefficient ranges from −1 to 1 and higher values mean a better fit. There is a set of universally accepted guidelines for the kappa coefficient [78]: a kappa coefficient less than 0 indicates no agreement; 0–0.20 indicates slight agreement; 0.21–0.40, fair; 0.41–0.60, moderate; 0.61–0.80, substantial; and 0.81–1 indicates an almost perfect agreement. Generally, a classification approach with good overall accuracy also generates a high kappa coefficient. However, kappa values may be significantly lower than overall accuracy when the number of species to be classified is too small or when a dominant species with a huge sample size exists [79,80].
Another index proposed to quantify classification quality is the number of categories adjusted index (NOCAI). It excludes the influence of the number of tree species classified in the individual classification approach, and is thus suggested to be a more reasonable comparison index than overall accuracy. Specifically, NOCAI is calculated by Equation (2) [73].
NOCAI   value = overall   accuracy × 1 k × 100 %
where k is the number of tree species identified and 1/k is an expected accuracy that would be achieved when trees were all assigned to a random species [69]. Logically, the higher the NOCAI value, the better a classifier performs. In Figure 3, the kappa coefficient and NOCAI values are used to compare the classification quality of several of the typical urban tree species mapping approaches reviewed above based on the different remote sensing datasets (mainly LiDAR data).
According to the kappa coefficient comparison in Figure 3, most classification approaches combining passive optical imagery and LiDAR data achieved substantial identification quality, except for the approach proposed by Zhang and Qiu [73], while, according to the NOCAI values comparison, this approach performed the best because it classified a largest number of 40 urban tree species with a moderate overall accuracy. Moreover, NOCAI value comparison indicated that classification approaches combing multiple datasets generally performed better than using a single dataset, which is consistent with the perspective provided by many studies with overall accuracy and kappa results. It is worth noting that the comparison here was made to try showing the classification ability of methods proposed in different studies in a simple but quantitative way. However, such comparisons should be made carefully because classification results are not only related to the methods, but also influenced by many factors, including study sites and sampling situations, tree species selected, remote-sensed data quality, and sample information quality [69].

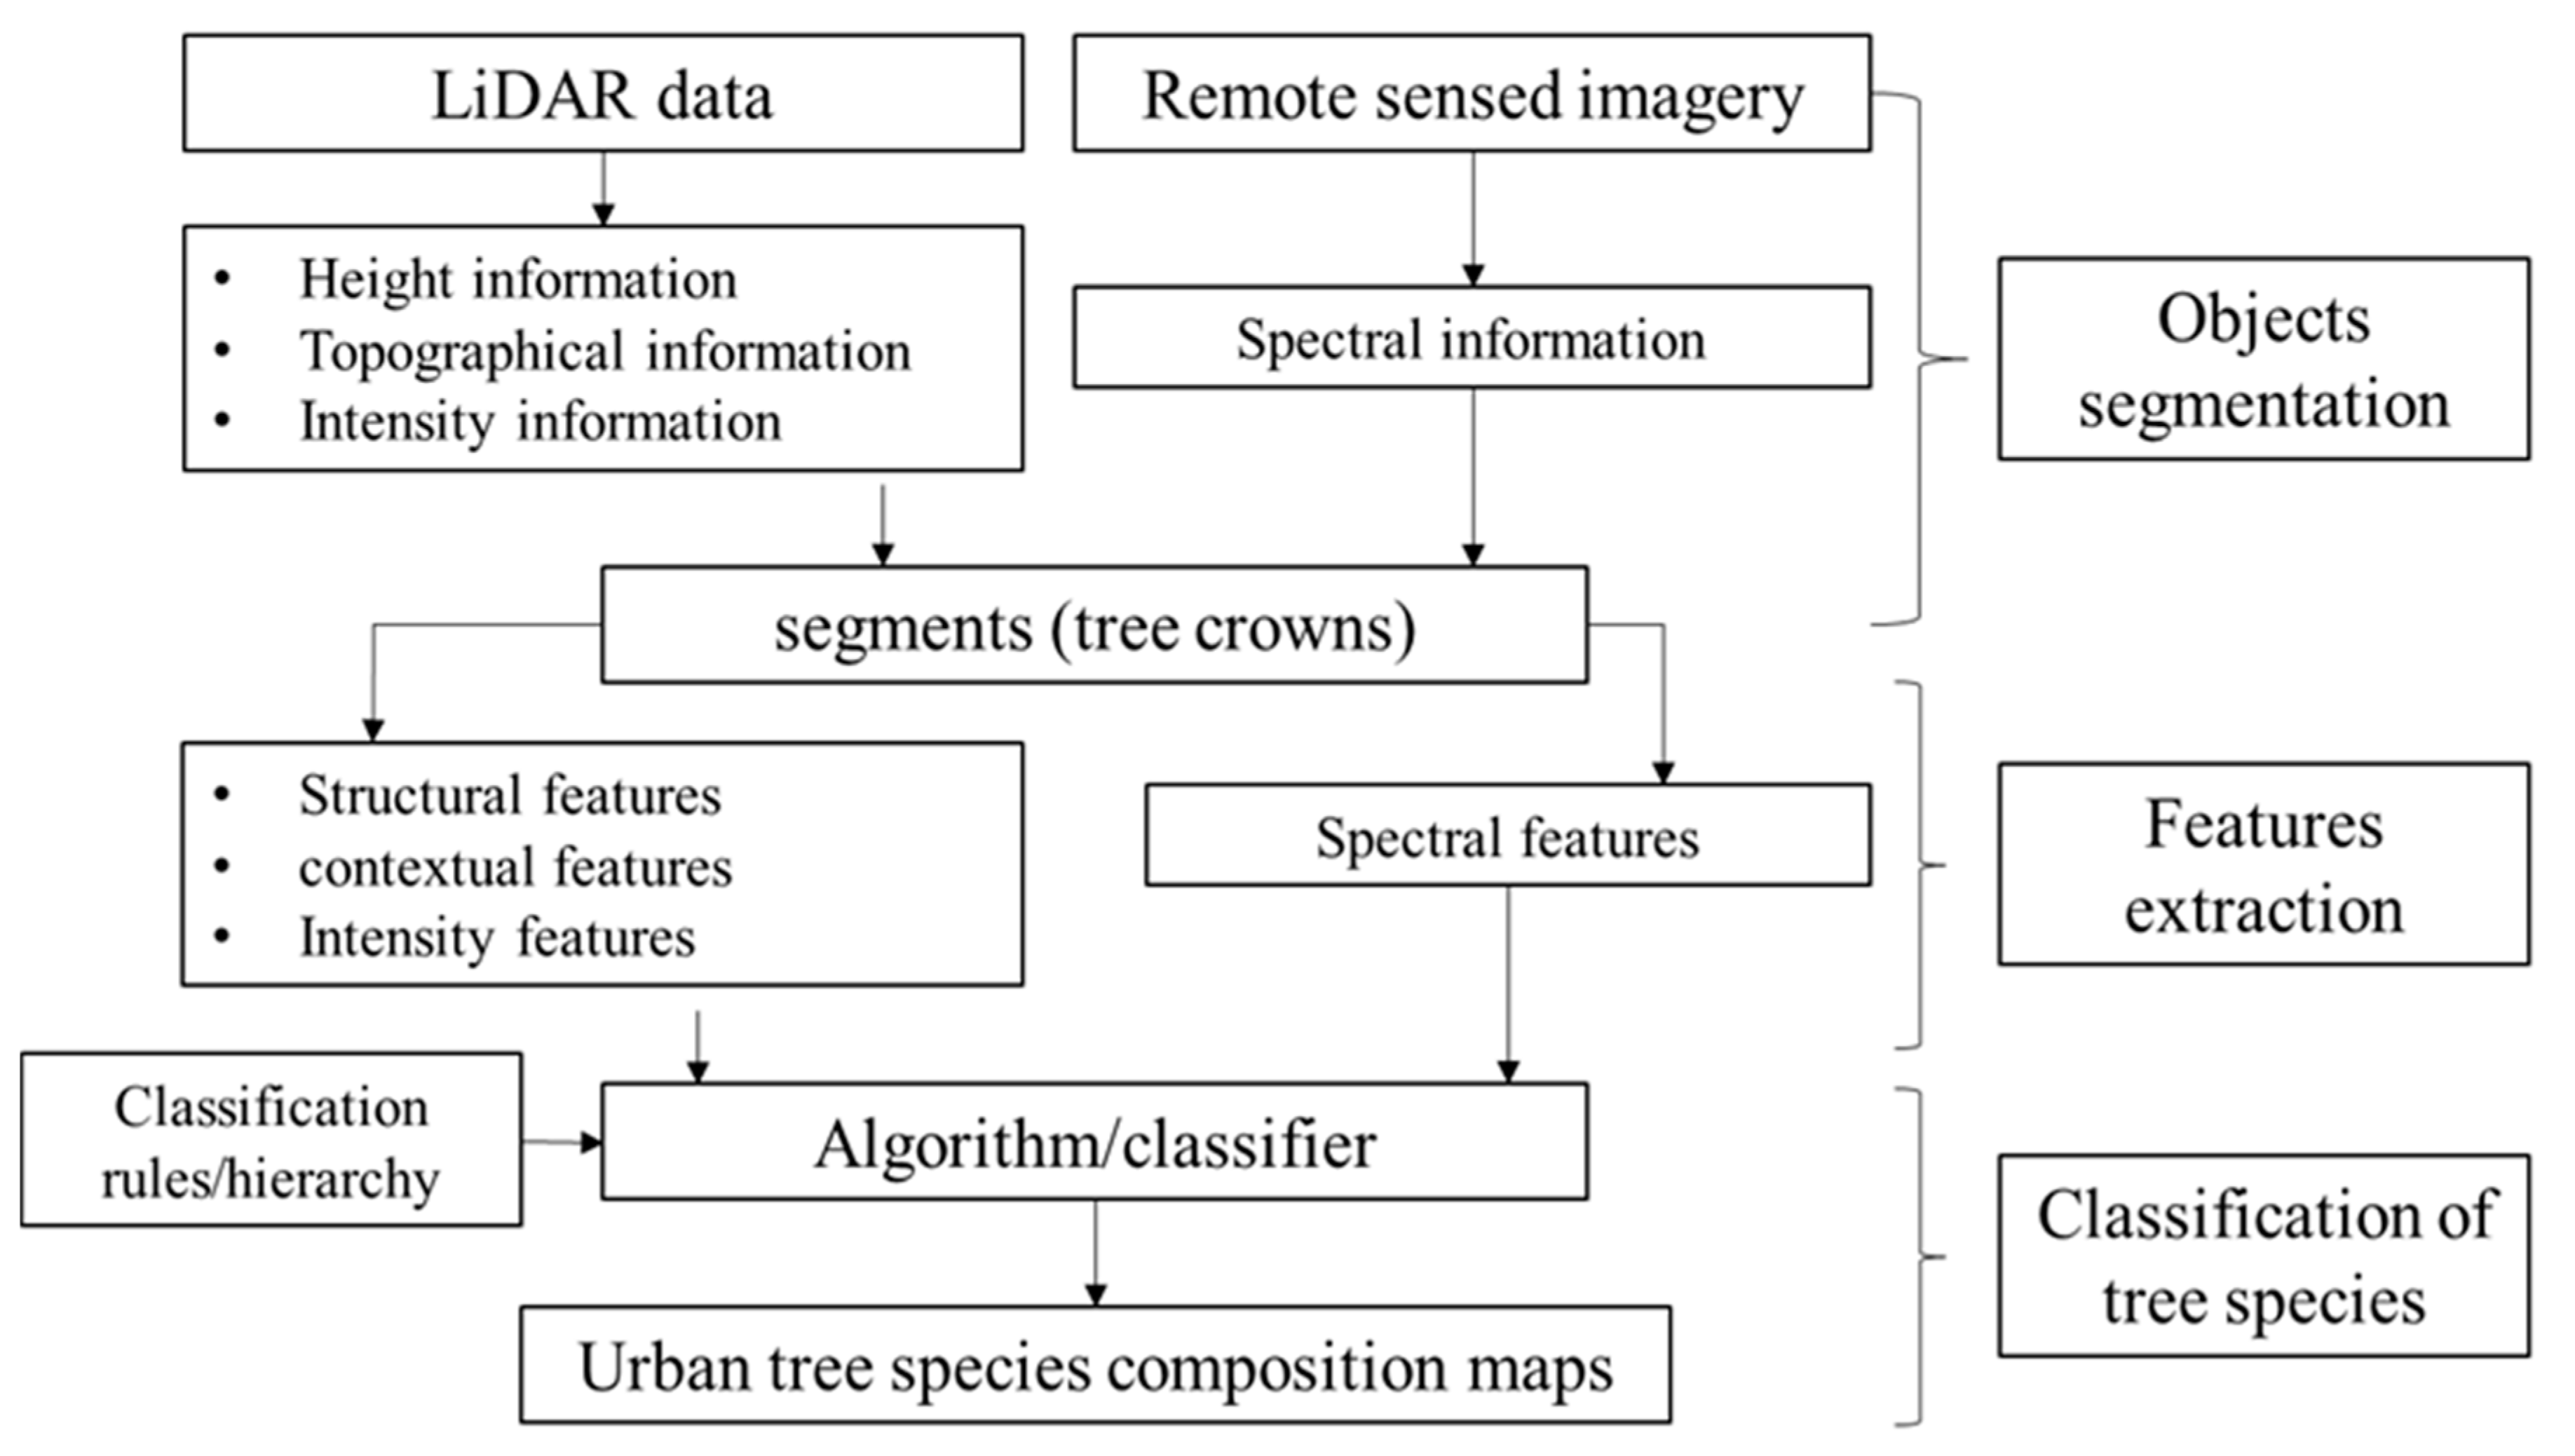
3.2.3. A General Workflow of Urban Tree Species Classification by Combining LiDAR Data

In the studies of urban tree species classification reviewed above, although the specific analysis principles or algorithm differs, the basic ideas and workflows are similar. Here summarizes a general workflow of urban tree species identification based on combination of multiple remotely sensed datasets, especially LiDAR data (Figure 4).
An object-based classification commonly consists of three steps: objects segmentation, features extraction, and species classification. Segmentation is to divide the whole image/layer into individual objects (such as single tree crowns or treetops in Zhang and Qiu’s study [73]) using information from different input datasets [26], such as LiDAR-derived height models, and spectral signatures from passive optical imagery. In the segmentation procedure, LiDAR point cloud data can either be used as height thresholds for optical imagery, or be independently used to delineate canopy areas and then projected onto the passive optical imagery for crown pixel selections and spectral signature extractions. Generally, crown segmentation is performed manually or with automated or semi-automatic algorithms. Then, from each segment/object, different types of features are extracted. Typical features from passive optical imagery includes vegetation indices, derivations of spectral characteristics, and textural features. LiDAR-extracted variables are usually statistically designed to describe the structures of tree crowns and even branches and leaves, including height distributions and intensity features related to the crown porosity [81]. With the development of remote sensing data and statistical methodologies, an increasing number of new and refined variables are being extracted and applied. However, some failures occurred when the number of parameters was too large compared to the size of the training sample dataset, which is known as the curse of dimensionality or the Hughes phenomenon. Therefore, feature reduction algorithms have been proposed. There are two kinds of feature reduction algorithms: feature extraction methods selecting a subset of original variables, and feature selection methods summarizing new variables from groups of related original variables [82]. After feature reduction, some features are selected and then integrated to build up a set of classification rules. Based on the identification rules/hierarchy and field sample data, a specific classifier will be selected to label every object with one of the pre-selected tree species. In the early stage, parametric classifiers are mostly used, such as linear discriminant analysis (LDA) [83], canonical discriminant analysis (CDA) [51], maximum likelihood (ML) [46] and spectral angle mapper (SAM) [44]. These classifiers are convenient and efficient, but they only allow a certain number of predictor variables and assume the input data fits certain distributions [18]. From the beginning of this century, non-parametric classifiers based on machine learning and decision trees have appeared as powerful alternatives. These classifiers, including support vector machine (SVM) [63], random forest (RF) [63], k-nearest neighbor (k-NN) [74], and neural networks, have no prior assumption for inputs and can adjust the number of variables with the size of training samples, and hence are more flexible and have become more popular.

3.3. Potential Contributions of LiDAR to Urban Tree Species Classification

Although LiDAR data have been indicated as being not suitable to accurately classify urban tree species when solely used, they have been proven to be capable of significantly improving the tree species classification quality when fused with optical remote sensing imagery, especially in urban forests with diverse species and high spatial heterogeneity. The ways in which LiDAR data have been combined, i.e., the contributions of LiDAR, in the reviewed approaches are summarized in Table 1.
To conclude, the contributions of LiDAR data to urban tree species classification are as follows. (1) In the very early stage of using LiDAR data to improve tree species classification, LiDAR data were only used as axillary information for spectral imagery. The ability of LiDAR to obtain high-resolution elevation data were valued to generate height models such as DEMs, DTMs, and digital height models (DHMs) that were used (as height masks or in other ways) in subsequent segmentation. (2) With increased point density, LiDAR sensors are able to detect small and discrete targets, thus improving the segmentation and classification of smaller-size and less-common tree species. (3) In the image segmentation step, structural, topographic, and intensity information derived from LiDAR data helps to separate overlapped objects and remove shadowing effects. For example, in Ke et al.’s research [26], based on profile/structural information derived from LiDAR data, the contrast between coniferous trees and neighboring deciduous trees is enhanced, thus improving the segmentation results. (4) In some studies [70], LiDAR data were used alone to produce segments that were then projected to optical images to extract spectral metrics. Based on unique structural characteristics (such as height distribution and crown width), LiDAR data can precisely delineate tree crowns and generate accurate objects. (5) With additional structural and intensity features, LiDAR data can greatly refine the classification hierarchy. For example, some researchers have pointed out that height metrics derived from LiDAR data helped enhance the interspecies variation because different tree species have different height attributes [26]. In addition, it is indicated that LiDAR intensity data extend the spectrum slightly into the infrared, because the wave length of the laser emitted by LiDAR is approximately 1050 nm [72]. (6) Some studies also showed that some large tree crowns with high porosity were classified more accurately using fused LiDAR data than with spectral images [66]. Higher porosity in crowns leads to higher within-species spectral variation, while the ability of a laser to pass through the openings in layers helps to distinguish objects from ground surfaces, thus reducing the variation within an object.

3.4. Future Considerations for LiDAR

It has been proved that LiDAR data can significantly improve the urban tree species classification accuracy when combined with optical remote sensing imagery. Although some specific approaches have been proposed and investigated in small sample sites, they still need to be validated in more and larger areas of urban forests before being put into practice. Moreover, so far, high classification OA has only been achieved when relatively small numbers of tree species are selected or the urban forests are roughly pre-defined into several classes/groups. However, in some megacities, such as New York and Beijing, the number of common tree species is generally over 30 [85].
To allow a finer tree species classification for these cities, approaches able to identify larger numbers of species at more detailed levels and with the same high accuracies should be developed. A potential research direction is to integrate different datasets in deeper and more complex ways. For example, seasonal effects can be taken into consideration. For now, the seasonal factor has mostly been studied for its influence on the data quality of LiDAR data or passive optical imagery, which thus influence the classification performance. Some researches indicated that spectral imagery taken in September before leaves change was most beneficial for tree species identification [49], while some indicated that October with “peak autumn colors” was the most ideal time to collect images [86]. Some studies, in which integrated hyperspectral imagery was taken in different seasons with LiDAR data, also concluded that, although there was little difference between the classification in summer and fall, results from the fall were more consistent [72]. However, identifying urban tree species with seasonal variations in the tree crown structure as a unique feature is still a brand-new research direction. In fact, seasonal changes of tree morphological characteristics reflect the inherent phenological attributes of different tree species. Moreover, these seasonal changes in tree structure can be accurately detected and differentiated by LiDAR sensors. Consequently, combining different datasets, especially LiDAR data, collected from different seasons to enrich the classification rules of phenological features appears a promising way to improve identification accuracy. For example, Kim et al. attempted to combine LiDAR data from both leaf-on and leaf-off seasons to classify 15 tree species in a natural forest [87]. The results proved that the highest accuracy was achieved using seasonally-combined data, but until now very few similar efforts have been made in complex urban environments.
Another factor worth noting in the practical application of urban tree species classification is the cost. It is generally realized that the higher the spatial and spectral resolutions and the denser the laser pulses, the more accurate the classification, while the more it will cost. In some studies [63], it is estimated that the approximate acquisition costs of data per hectare are USD 0.60 for GeoEye-1 satellite multispectral imagery (2 m), USD 11.50 for AISA Eagle hyperspectral imagery (1 m), USD 1.90 for low point density LiDAR data (0.48 points per m2), and USD 11.50 for high point density LiDAR data (8.6 points per m2). Therefore, maintaining high classification accuracy while reducing the cost as much as possible is an inevitable consideration in future research. A potential solution includes simultaneous collecting of high-resolution spectral imagery and LiDAR data during a single flight [88]. However, since the aerial spectral measurements depend on sunlight illumination, they require two to four times the time of LiDAR measurements [89]. Moreover, accurate co-registration of two different sets of data is hard to achieve. Therefore, a more feasible single-sensor option is multispectral airborne laser scanning (ALS), because it can provide point cloud data and spectral data at the same time, which can also simplify data processing [90]. Another example to control costs is to take full advantage of the remote sensing data that is freely available, e.g., data acquired by local administrations for other purposes, such as low point-density LiDAR terrain models for urban land-cover surveys. In addition, a newly-emerged robust tool to provide massive open data, and thus reduce data fees greatly, is the Global Ecosystem Dynamics Investigation (GEDI) LiDAR [91]. This was launched in December, 2018, by the National Aeronautics and Space Administration (NASA). It was installed on the International Space Station as the first space-borne LiDAR sensor to detect the 3D structures of the earth’s surface for forest management, carbon and water cycling processes, biodiversity and habitat research [92]. The GEDI LiDAR system consists of three lasers, each of which fires 242 times per second with 25 m footprints [93]. Although the footprint size of GEDI LiDAR is too large for urban tree species classification at the single-tree level, its importance for freely providing massive waveform LiDAR data, and especially information about vegetation canopy and the topography underneath, cannot be underestimated. With the possible breakthrough of fusing low-resolution GEDI LiDAR data with other remotely sensed datasets in the future, the target of mapping urban tree species with high accuracy and relatively low costs will be achieved. Furthermore, based on the globally collected GEDI LiDAR data, cities and towns can be combined or compared with neighboring rural areas to promote urban ecological studies.
When it comes to urban ecological research using (fused) LiDAR data in China, a non-negligible factor is relatively strict air traffic control. Under such restraints, on the one hand, Chinese high-resolution remote sensing satellites should be noted, such as Gaofen-1 with 2 m spatial resolution [94], and SuperView-101/102 with 0.5 m resolution [95]. To the best of our knowledge, there are few studies using remote sensing data from Chinese satellites in urban ecosystems. On the other hand, a promising alternative to aircraft-borne LiDAR systems is an unmanned aerial vehicle (UAV) LiDAR system that is easier to operate with lower costs and lower flying heights [96], and is thus more suitable for research in cities in China. However, it is noted that in some flight-restricted areas such as residential and commercial areas, UAV flights for scientific research purposes still need to be approved by local military and civil aviation departments. Recently, UAV LiDAR has been used to map forest canopies in natural forests and to classify land-cover in urban environments [97,98]. However, very little research has been conducted using UAV LiDAR to identify tree species. In summary, it is expected that more and more Chinese high-resolution satellites should be utilized and combined with LiDAR data, especially that acquired by UAVs, for urban ecological research in China.

4. Conclusions

With rapid urbanization worldwide, urban areas are facing with more and more environmental problems. Urban forests and trees have great potential to prevent or mitigate these problems to some extent. To maximize their ecological benefits, suitable tree species should be selected with proper distribution patterns. Therefore, studies of classification of urban tree species, especially to improve classification accuracy, have been conducted over the past several decades. Recently, LiDAR technology has been valued for its unique abilities to detect 3D structural information, which is a potent supplement to traditional classification based on optical remote-sensed imagery. LiDAR data have been proven in many studies to be capable of significantly improving tree species classification accuracy when fused with optical remote-sensed imagery, especially in urban forests with diverse species and high spatial heterogeneity. Specifically, a general workflow using LiDAR data to identify tree species includes three major steps: image segmentation, feature extraction, and species classification. In each step, LiDAR data have provided significant contributions, including removing shadowing effects, enhancing classification rules, and delineating less-common species and trees with unique morphologies. Considering practical applications in the future, research into tree species classification should improve accuracy with larger and finer species compositions, while controlling cost. To fulfill these requirements, approaches and algorithms fusing different remote sensing datasets in deeper ways should be developed, and multiple sources of remote-sensed data, e.g., GEDI LiDAR data, multispectral ALS data, and UAV-based LiDAR data, should be integrated into classification attempts.

Author Contributions

K.W. was involved in the whole study (literature research, data collection and analysis, and writing the manuscript); X.L. supervised the entire research, revised drafts of the paper, and polished the English; T.W. supervised the preliminary research, revised drafts of the paper, and polished the English.

Funding

This research was funded by [National Natural Science Foundation of China (NSFC)] project grant number [41671183].

Acknowledgments

This research was funded by the NSFC project (No. 41671183). Support has also been provided by Zhaoxue Tian, Yuke Zhang, and Xiaofei Liu from School of Environment, Tsinghua University. The authors would also like to thank Yifang Shi and Xi Zhu from ITC, University of Twente for their support. Finally, we kindly thank the anonymous reviewers who helped us improve this paper.

Conflicts of Interest

The authors declare no conflict of interest.

References

  1. Strongina, M. Social and Economic Problems of Urbanization (Survey of the Literature). Probl. Econ. 1974, 17, 23–43. [Google Scholar] [CrossRef]
  2. UN Habitat. Cities and Climate Change: Global Report on Human Settlements 2011; Earthscan: London, UK, 2011. [Google Scholar]
  3. Escobedo, F.J.; Nowak, D.J. Spatial heterogeneity and air pollution removal by an urban forest. Landsc. Urban Plan. 2009, 90, 102–110. [Google Scholar] [CrossRef]
  4. Mccarthy, H.R.; Pataki, D.E. Drivers of variability in water use of native and non-native urban trees in the greater Los Angeles area. Urban Ecosyst. 2010, 13, 393–414. [Google Scholar] [CrossRef] [Green Version]
  5. Manning, W.J. Plants in urban ecosystems: Essential role of urban forests in urban metabolism and succession toward sustainability. Int. J. Sustain. Dev. World Ecol. 2008, 15, 362–370. [Google Scholar] [CrossRef]
  6. Nowak, D.J. Air pollution removal by Chicago’s urban forest. In Chicago’s Urban forest Ecosystem: Results of the Chicago Urban forest Climate Project; Mcpherson, E.G., Nowak, D.J., Rowntree, R.A., Eds.; USDA Forest Service: Radnor, PA, USA, 1994; pp. 63–81. [Google Scholar]
  7. Beckett, K.P.; Freer-Smith, P.H.; Taylor, G. Urban woodlands: Their role in reducing the effects of particulate pollution. Environ. Pollut. 1998, 99, 347–360. [Google Scholar] [CrossRef]
  8. Akbari, H.; Pomerantz, M.; Taha, H. Cool surfaces and shade trees to reduce energy use and improve air quality in urban areas. Sol. Energy 2001, 70, 295–310. [Google Scholar] [CrossRef]
  9. Yang, J.; Mcbride, J.; Zhou, J.; Sun, Z. The urban forest in Beijing and its role in air pollution reduction. Urban For. Urban Green. 2005, 3, 65–78. [Google Scholar] [CrossRef]
  10. Beckett, K.P.; Freer-Smith, P.; Taylor, G. Effective tree species for local air-quality management. J. Arboric. 2000, 26, 12–19. [Google Scholar]
  11. Xiao, Q.; Mcpherson, E.G. Rainfall interception by Santa Monica’s municipal urban forest. Urban Ecosyst. 2002, 6, 291–302. [Google Scholar] [CrossRef]
  12. Akbari, H.; Konopacki, S. Calculating energy-saving potentials of heat-island reduction strategies. Energy Policy 2005, 33, 721–756. [Google Scholar] [CrossRef]
  13. Kirby, K.R.; Potvin, C. Variation in carbon storage among tree species: Implications for the management of a small-scale carbon sink project. For. Ecol. Manag. 2007, 246, 208–221. [Google Scholar] [CrossRef] [Green Version]
  14. Jenkins, J.C.; Chojnacky, D.C.; Heath, L.S.; Birdsey, R.A. National-scale biomass estimators for United States tree species. For. Sci. 2003, 49, 12–35. [Google Scholar]
  15. Duro, D.C.; Coops, N.C.; Wulder, M.A.; Han, T. Development of a large area biodiversity monitoring system driven by remote sensing. Prog. Phys. Geogr. 2007, 31, 235–260. [Google Scholar] [CrossRef]
  16. Zhang, K.; Hu, B. Individual Urban Tree Species Classification Using Very High Spatial Resolution Airborne Multi-Spectral Imagery Using Longitudinal Profiles. Remote Sens. 2012, 4, 1741–1757. [Google Scholar] [CrossRef] [Green Version]
  17. Lefsky, M.A.; Cohen, W.B.; Parker, G.G.; Harding, D.J. Lidar Remote Sensing for Ecosystem Studies. Bioscience 2002, 52, 19–30. [Google Scholar] [CrossRef]
  18. Fassnacht, F.E.; Latifi, H.; Stereńczak, K.; Modzelewska, A.; Lefsky, M.; Waser, L.T.; Straub, C.; Ghosh, A. Review of studies on tree species classification from remotely sensed data. Remote Sens. Environ. 2016, 186, 64–87. [Google Scholar] [CrossRef]
  19. Swain, P.H.; Davis, S.M. Remote Sensing: The Quantitative Approach. IEEE Trans. Pattern Anal. Mach. Intell. 1981, 6, 713–714. [Google Scholar] [CrossRef]
  20. Wulder, M. Optical remote-sensing techniques for the assessment of forest inventory and biophysical parameters. Prog. Phys. Geogr. 1998, 22, 449. [Google Scholar] [CrossRef]
  21. Heller, R.C.; Doverspike, G.E.; Aldrich, R.C. Identification of Tree Species on Large-scale Panchromatic and Color Aerial Photographs; Forest Service: Beltsville, MD, USA, 1964; Volume 261.
  22. Franklin, S.E.; Wulder, M.A.; Gerylo, G.R. Texture analysis of IKONOS panchromatic data for Douglas-fir forest age class separability in British Columbia. Int. J. Remote Sens. 2001, 22, 2627–2632. [Google Scholar] [CrossRef]
  23. Brandtberg, T. Individual tree-based species classification in high spatial resolution aerial images of forests using fuzzy sets. Fuzzy Sets and Systems. Fuzzy Sets Syst. 2002, 132, 371–387. [Google Scholar] [CrossRef]
  24. Xiao, Q.; Ustin, S.L.; Mcpherson, E.G. Using AVIRIS data and multiple-masking techniques to map urban forest tree species. Int. J. Remote Sens. 2004, 25, 5637–5654. [Google Scholar] [CrossRef] [Green Version]
  25. Enderle, D.; Weih, R.C., Jr. Integrating supervised and unsupervised classification methods to develop a more accurate land cover classification. Ark. Acad. Sci. 2005, 59, 65–73. [Google Scholar]
  26. Ke, Y.; Quackenbush, L.J.; Im, J. Synergistic use of QuickBird multispectral imagery and LIDAR data for object-based forest species classification. Remote Sens. Environ. 2010, 114, 1141–1154. [Google Scholar] [CrossRef]
  27. Jong, S.M.D.; Hornstra, T.; Maas, H.G. An Integrated Spatial and Spectral Approach to the Classification of Mediterranean Land Cover Types: The SSC Method. Int. J. Appl. Earth Obs. Geoinf. 2001, 3, 176–183. [Google Scholar] [CrossRef]
  28. Gao, Y.; Mas, J.F. A Comparison of the Performance of Pixel Based and Object Based Classifications over Images with Various Spatial Resolutions. Online J. Earth Sci. 2014, 2, 27–35. [Google Scholar]
  29. Treitz, P.; Howarth, P. Integrating spectral, spatial, and terrain variables for forest ecosystem classification. Photogramm. Eng. Remote Sens. 2000, 66, 305–318. [Google Scholar]
  30. Franklin, S.E. Using spatial cooccurrence texture to increase forest structure and species composition classification accuracy. Photogramm. Eng. Remote Sens. 2001, 67, 849–855. [Google Scholar]
  31. Zhang, C.; Wulder, M.A. Geostatistical and texture analysis of airborne-acquired images used in forest classification. Int. J. Remote Sens. 2004, 25, 859–865. [Google Scholar] [CrossRef]
  32. Blaschke, T. Object based image analysis for remote sensing. ISPRS J. Photogramm. Remote Sens. 2010, 65, 2–16. [Google Scholar] [CrossRef]
  33. Opitz, D.; Blundell, S. Object recognition and image segmentation: The Feature Analyst® approach. In Object-Based Image Analysis; Springer: Berlin/Heidelberg, Germany, 2008; pp. 153–167. [Google Scholar]
  34. Blaschke, T.; Lang, S.; Hay, G.J. Object-Based Image Analysis: Spatical Concepts for Knowledge-Driven Remote Sensing Applications; Blaschke, T., Lang, S., Hay, G.J., Eds.; Springer Science & Business Media: Berlin, Germany, 2008; pp. 2–16. [Google Scholar]
  35. Yu, Q.; Gong, P.; Clinton, N.; Biging, G.; Kelly, M.; Schirokauer, D. Object-based Detailed Vegetation Classification with Airborne High Spatial Resolution Remote Sensing Imagery. Photogramm. Eng. Remote Sens. 2006, 72, 799–811. [Google Scholar] [CrossRef]
  36. Hay, G.; Castilla, G. Object-based image analysis: Strengths, weaknesses, opportunities and threats (SWOT). In Proceedings of the 1st International Conference on OBIA: The International Archives of the Pthotogrammetry, Remote Sensing and Spatial Information Sciences, Salzburg, Austria, 4–5 July 2006; pp. 4–5. [Google Scholar]
  37. Weih, R.C.; Riggan, N.D. Object-based classification vs. Pixel-based classification: Comparitive importance of multi-resolution imagery. In Proceedings of the International Archives of the Photogrammetry, Remote Sensing & Spatial Information Sciences, Orlando, FL, USA, 6–18 November 2010; p. C7. [Google Scholar]
  38. Brockhaus, J.A.; Khorram, S. A comparison of SPOT and Landsat-TM data for use in conducting inventories of forest resources. Int. J. Remote Sens. 1992, 13, 3035–3043. [Google Scholar] [CrossRef]
  39. Rogan, J.; Miller, J. Land-Cover Change Monitoring with Classification Trees Using Landsat TM and Ancillary Data. Photogramm. Eng. Remote Sens. 2003, 69, 793–804. [Google Scholar] [CrossRef]
  40. Salovaara, K.J.; Thessler, S.; Malik, R.N.; Tuomisto, H. Classification of Amazonian primary rain forest vegetation using Landsat ETM+ satellite imagery. Remote Sens. Environ. 2005, 97, 39–51. [Google Scholar] [CrossRef]
  41. Carleer, A.; Wolff, E. Exploitation of Very High Resolution Satellite Data for Tree Species Identification. Photogramm. Eng. Remote Sens. 2004, 70, 135–140. [Google Scholar] [CrossRef]
  42. Johansen, K.; Phinn, S. Mapping Structural Parameters and Species Composition of Riparian Vegetation Using IKONOS and Landsat ETM+ Data in Australian Tropical Savannahs. Photogramm. Eng. Remote Sens. 2006, 72, 71–80. [Google Scholar] [CrossRef]
  43. Katoh, M. Classifying tree species in a northern mixed forest using high-resolution IKONOS data. J. For. Res. 2004, 9, 7–14. [Google Scholar] [CrossRef]
  44. Buddenbaum, H.; Schlerf, M.; Hill, J. Classification of coniferous tree species and age classes using hyperspectral data and geostatistical methods. Int. J. Remote Sens. 2005, 26, 5453–5465. [Google Scholar] [CrossRef]
  45. Rocchini, D.; Balkenhol, N.; Carter, G.A.; Foody, G.M.; Gillespie, T.W.; He, K.S.; Kark, S.; Levin, N.; Lucas, K.; Luoto, M. Remotely sensed spectral heterogeneity as a proxy of species diversity: Recent advances and open challenges. Ecol. Inform. 2010, 5, 318–329. [Google Scholar] [CrossRef]
  46. Clark, M.L.; Roberts, D.A.; Clark, D.B. Hyperspectral discrimination of tropical rain forest tree species at leaf to crown scales. Remote Sens. Environ. 2005, 96, 375–398. [Google Scholar] [CrossRef]
  47. Gong, P.; Howarth, P.J. The use of structural information for improving land-cover classification accuracies at the rural-urban fringe. Photogramm. Eng. Remote Sens. 1990, 56, 67–73. [Google Scholar]
  48. Gong, P.; Howarth, P.J. An Assessment of Some Factors Influencing Multispectral Land-Cover Classification. Photogramm. Eng. Remote Sens. 1990, 56, 597–603. [Google Scholar]
  49. Sugumaran, R.; Pavuluri, M.K.; Zerr, D. The use of high-resolution imagery for identification of urban climax forest species using traditional and rule-based classification approach. IEEE Trans. Geosci. Remote Sens. 2003, 41, 1933–1939. [Google Scholar] [CrossRef]
  50. Pu, R.; Landry, S. A comparative analysis of high spatial resolution IKONOS and WorldView-2 imagery for mapping urban tree species. Remote Sens. Environ. 2012, 124, 516–533. [Google Scholar] [CrossRef]
  51. Alonzo, M.; Roth, K.; Roberts, D. Identifying Santa Barbara’s urban tree species from AVIRIS imagery using canonical discriminant analysis. Remote Sens. Lett. 2013, 4, 513–521. [Google Scholar] [CrossRef]
  52. Hughes, G. On the mean accuracy of statistical pattern recognizers. Inf. Theory IEEE Trans. 1968, 14, 55–63. [Google Scholar] [CrossRef]
  53. Boschetti, M.; Boschetti, L.; Oliveri, S.; Casati, L.; Canova, I. Tree species mapping with Airborne hyper-spectral MIVIS data: The Ticino Park study case. Int. J. Remote Sens. 2007, 28, 1251–1261. [Google Scholar] [CrossRef]
  54. Bachman, C.G. Laser Radar Systems and Techniques; Artech House Inc.: Dedham, MA, USA, 1979; pp. 57–58. [Google Scholar]
  55. Geospatial Modeling & Visualization. Available online: http://gmv.cast.uark.edu/scanning-2/airborne-laser-scanning/ (accessed on 11 September 2018).
  56. Guo, Q.H.; Liu, J.; Tao, S.L.; Xue, B.L.; Le, L.I.; Guangcai, X.U.; Wenkai, L.I.; Fangfang, W.U.; Yumei, L.I.; Chen, L.H. Perspectives and prospects of LiDAR in forest ecosystem monitoring and modeling. Chin. Sci. Bull. 2014, 59, 459. (In Chinese) [Google Scholar] [CrossRef]
  57. Lim, K.; Treitz, P.; Wulder, M.; Stonge, B.; Flood, M. LiDAR remote sensing of forest structure. Prog. Phys. Geogr. 2003, 27, 88–106. [Google Scholar] [CrossRef]
  58. Reitberger, J.; Krzystek, P.; Stilla, U. Analysis of full waveform LIDAR data for the classification of deciduous and coniferous trees. Int. J. Remote Sens. 2008, 29, 1407–1431. [Google Scholar] [CrossRef]
  59. Drake, J.B.; Dubayah, R.O.; Clark, D.B.; Knox, R.G.; Blair, J.B.; Hofton, M.A.; Chazdon, R.L.; Weishampel, J.F.; Prince, S. Estimation of tropical forest structural characteristics using large-footprint lidar. Remote Sens. Environ. 2002, 79, 305–319. [Google Scholar] [CrossRef]
  60. Drake, J.B.; Knox, R.G.; Dubayah, R.O.; Clark, D.B.; Condit, R.; Blair, J.B.; Hofton, M. Above-ground biomass estimation in closed canopy Neotropical forests using lidar remote sensing: Factors affecting the generality of relationships. Glob. Ecol. Biogeogr. 2010, 12, 147–159. [Google Scholar] [CrossRef]
  61. Lefsky, M.A.; Cohen, W.B.; Acker, S.A.; Parker, G.G.; Spies, T.A.; Harding, D. Lidar Remote Sensing of the Canopy Structure and Biophysical Properties of Douglas-Fir Western Hemlock Forests. Remote Sens. Environ. 1999, 70, 339–361. [Google Scholar] [CrossRef]
  62. Maltamo, M.; Packalen, P.; Yu, X.; Eerikainen, K.; Hyyppa, J.; Pitkanen, J. Identifying and quantifying structural characteristics of heterogeneous boreal forests using laser scanner data. For. Ecol. Manag. 2005, 216, 41–50. [Google Scholar] [CrossRef]
  63. Dalponte, M.; Bruzzone, L.; Gianelle, D. Tree species classification in the Southern Alps based on the fusion of very high geometrical resolution multispectral/hyperspectral images and LiDAR data. Remote Sens. Environ. 2012, 123, 258–270. [Google Scholar] [CrossRef]
  64. Hollaus, M.; Mücke, W.; Höfle, B.; Dorigo, W.; Pfeifer, N.; Wagner, W.; Bauerhansl, C.; Regner, B. Tree species classification based on full-waveform airborne laser scanning data. In Proceedings of the Silvilaser, College Station, TX, USA, 14–16 October 2009; pp. 54–62. [Google Scholar]
  65. Brandtberg, T. Classifying individual tree species under leaf-off and leaf-on conditions using airborne lidar. ISPRS J. Photogramm. Remote Sens. 2007, 61, 325–340. [Google Scholar] [CrossRef]
  66. Alonzo, M.; Bookhagen, B.; Roberts, D.A. Urban tree species mapping using hyperspectral and lidar data fusion. Remote Sens. Environ. 2014, 148, 70–83. [Google Scholar] [CrossRef]
  67. Pohl, C.; Genderen, J.L.V. Review article Multisensor image fusion in remote sensing: Concepts, methods and applications. Int. J. Remote Sens. 1998, 19, 823–854. [Google Scholar] [CrossRef] [Green Version]
  68. Tigges, J.; Lakes, T.; Hostert, P. Urban vegetation classification: Benefits of multitemporal RapidEye satellite data. Remote Sens. Environ. 2013, 136, 66–75. [Google Scholar] [CrossRef]
  69. Zhang, Z.; Kazakova, A.; Moskal, L.; Styers, D. Object-Based Tree Species Classification in Urban Ecosystems Using LiDAR and Hyperspectral Data. Forests 2016, 7, 122. [Google Scholar] [CrossRef]
  70. Holmgren, J.; Persson, Å.; Söderman, U. Species identification of individual trees by combining high resolution LiDAR data with multi-spectral images. Int. J. Remote Sens. 2008, 29, 1537–1552. [Google Scholar] [CrossRef]
  71. Sugumaran, R.; Voss, M. Object-Oriented Classification of LIDAR-Fused Hyperspectral Imagery for Tree Species Identification in an Urban Environment. In Proceedings of the Urban Remote Sensing Joint Event, Paris, France, 11–13 April 2007; pp. 1–6. [Google Scholar]
  72. Matthew, V.; Ramanathan, S. Seasonal Effect on Tree Species Classification in an Urban Environment Using Hyperspectral Data, LiDAR, and an Object-Oriented Approach. Sensors 2008, 8, 3020–3036. [Google Scholar]
  73. Zhang, C.; Qiu, F. Mapping Individual Tree Species in an Urban Forest Using Airborne Lidar Data and Hyperspectral Imagery. Photogramm. Eng. Remote Sens. 2012, 78, 1079–1087. [Google Scholar] [CrossRef]
  74. Korpela, I.; Ørka, H.O.; Maltamo, M.; Tokola, T.; Hyyppä, J. Tree species classification using airborne LiDAR—Effects of stand and tree parameters, downsizing of training set, intensity normalization, and sensor type. Silva Fenn. 2010, 44, 319–339. [Google Scholar] [CrossRef]
  75. Congalton, R.G. A Quantitative Method to Test for Consistency and Correctness in Photointerpretation. Photogramm. Eng. Remote Sens. 1983, 49, 69–74. [Google Scholar]
  76. Liu, X.H.; Skidmore, A.K.; Oosten, H.V. Integration of classification methods for improvement of land-cover map accuracy. ISPRS J. Photogramm. Remote Sens. 2002, 56, 257–268. [Google Scholar] [CrossRef] [Green Version]
  77. Cohen, J. A coefficient of agreement for nominal scales. Educ. Psychol. Meas. 1960, 20, 37–46. [Google Scholar] [CrossRef]
  78. Landis, J.R.; Koch, G.G. The measurement of observer agreement for categorical data. Biometrics 1977, 33, 159–174. [Google Scholar] [CrossRef] [PubMed]
  79. Strijbos, J.W.; Martens, R.; Prins, F.; Jochems, W. Content analysis: What are they talking about? Comput. Educ. 2006, 46, 29–48. [Google Scholar] [CrossRef] [Green Version]
  80. Viera, A.J.; Garrett, J.M. Understanding interobserver agreement: The kappa statistic. Fam. Med. 2005, 37, 360–363. [Google Scholar]
  81. Shi, Y.; Skidmore, A.K.; Wang, T.; Holzwarth, S.; Heiden, U.; Pinnel, N.; Zhu, X.; Heurich, M. Tree species classification using plant functional traits from LiDAR and hyperspectral data. Int. J. Appl. Earth Obs. Geoinf. 2018, 73, 207–219. [Google Scholar] [CrossRef]
  82. Ghosh, A.; Fassnacht, F.E.; Joshi, P.K.; Koch, B. A framework for mapping tree species combining hyperspectral and LiDAR data: Role of selected classifiers and sensor across three spatial scales. Int. J. Appl. Earth Obs. Geoinf. 2014, 26, 49–63. [Google Scholar] [CrossRef]
  83. Holmgren, J.; Persson, Å. Identifying species of individual trees using airborne laser scanner. Remote Sens. Environ. 2004, 90, 415–423. [Google Scholar] [CrossRef]
  84. Liu, L.; Coops, N.C.; Aven, N.W.; Pang, Y. Mapping urban tree species using integrated airborne hyperspectral and LiDAR remote sensing data. Remote Sens. Environ. 2017, 200, 170–182. [Google Scholar] [CrossRef]
  85. Currie, D.J.; Paquin, V. Large-scale biogeographical patterns of species richness of trees. Nature 1987, 329, 326–327. [Google Scholar] [CrossRef]
  86. Key, T.; Warner, T.A.; Mcgraw, J.B.; Fajvan, M.A. A Comparison of Multispectral and Multitemporal Information in High Spatial Resolution Imagery for Classification of Individual Tree Species in a Temperate Hardwood Forest. Remote Sens. Environ. 2001, 75, 100–112. [Google Scholar] [CrossRef]
  87. Kim, S.Y.; Mcgaughey, R.J.; Andersen, H.E.; Schreuder, G. Tree species differentiation using intensity data derived from leaf-on and leaf-off airborne laser scanner data. Remote Sens. Environ. 2009, 113, 1575–1586. [Google Scholar] [CrossRef]
  88. Jones, T.G.; Coops, N.C.; Sharma, T. Assessing the utility of airborne hyperspectral and LiDAR data for species distribution mapping in the coastal Pacific Northwest, Canada. Remote Sens. Environ. 2010, 114, 2841–2852. [Google Scholar] [CrossRef]
  89. Korpela, I.; Ørka, H.O.; Hyyppä, J.; Heikkinen, V.; Tokola, T. Range and AGC normalization in airborne discrete-return LiDAR intensity data for forest canopies. Isprs J. Photogramm. Remote Sens. 2010, 65, 369–379. [Google Scholar] [CrossRef]
  90. Yu, X.; Hyyppä, J.; Litkey, P.; Kaartinen, H.; Vastaranta, M.; Holopainen, M. Single-Sensor Solution to Tree Species Classification Using Multispectral Airborne Laser Scanning. Remote Sens. 2017, 9, 108. [Google Scholar] [CrossRef]
  91. Babcock, C.; Finley, A.O.; Cook, B.D.; Weiskittel, A.; Woodall, C.W. Modeling forest biomass and growth: Coupling long-term inventory and LiDAR data. Remote Sens. Environ. 2016, 182, 1–12. [Google Scholar] [CrossRef] [Green Version]
  92. Dubayah, R.; Goetz, S.J.; Blair, J.B.; Fatoyinbo, T.E.; Hansen, M.; Healey, S.P.; Hofton, M.A.; Hurtt, G.C.; Kellner, J.; Luthcke, S.B. The Global Ecosystem Dynamics Investigation. In Proceedings of the AGU Fall Meeting, San Francisco, CA, USA, 15–19 December 2014; p. 07. [Google Scholar]
  93. Neeck, S.P.; Volz, S.M. NASA Earth Science Flight Program. In Proceedings of the SPIE Sensors, Systems, and Next-Generation Satellites XVI, Edinburgh, UK, 24–27 September 2012; p. 85330E. [Google Scholar]
  94. Fu, B.; Wang, Y.; Campbell, A.; Li, Y.; Zhang, B.; Yin, S.; Xing, Z.; Jin, X. Comparison of object-based and pixel-based Random Forest algorithm for wetland vegetation mapping using high spatial resolution GF-1 and SAR data. Ecol. Indic. 2017, 73, 105–117. [Google Scholar] [CrossRef]
  95. Qiao, X.; Li, L.L.; Li, D.; Gan, Y.L.; Hou, A.Y. Application of Machine Learning in Urban Greenery Land Cover Extraction. Int. Arch. Photogramm. Remote Sens. Spat. Inf. Sci. 2018, 42, 1409–1413. [Google Scholar] [CrossRef]
  96. Wallace, L.; Lucieer, A.; Turner, D.; Watson, C. Error assessment and mitigation for hyper-temporal UAV-borne LiDAR surveys of forest inventory. In Proceedings of the 11th International Conference on LiDAR Applications for Assessing Forest Ecosystems, Tasmania, Australia, 16–20 October 2011; pp. 1–13. [Google Scholar]
  97. Feng, Q.; Liu, J.; Gong, J. UAV Remote Sensing for Urban Vegetation Mapping Using Random Forest and Texture Analysis. Remote Sens. 2015, 7, 1074–1094. [Google Scholar] [CrossRef] [Green Version]
  98. Wallace, L. Assessing the stability of canopy maps produced from UAV-LiDAR data. In Proceedings of the 2013 IEEE International Geoscience and Remote Sensing Symposium (IGARSS), Melbourne, Australia, 21–26 July 2013; Volume 1, pp. 3879–3882. [Google Scholar]
Figure 1. Graphic depicting an airborne light detection and ranging (LiDAR) system. Figure adapted and modified from [55].
Forests 10 00001 g001
Figure 2. Relationship between number of species/groups and overall accuracy in two seasons. Figure adapted and modified from [72].
Forests 10 00001 g002
Figure 3. Comparison of classification accuracy using the kappa coefficient and number of categories adjusted index (NOCAI) value, where the form of “A+B” represents the combination of different datasets; H, M and L represent hyperspectral, multispectral and LiDAR data, respectively; the studies of methods of data combination and classification results are cited in the square brackets.
Forests 10 00001 g003
Figure 4. An illustration of the general urban tree species classification workflow.
Forests 10 00001 g004
Table 1. Summary of contributions of LiDAR in tree species classification.
Contribution of LiDAR DataOverall AccuracyCitation
Image SegmentationFeature Extractionwith LiDARwithout LiDAR
LiDAR-derived height models as threshold for image segmentation-85.5%-[68]
LiDAR-derived CHM to delineate tree crowns-88.9%-[69]
Crown segments derived from LiDAR point cloud dataHeight distribution
Canopy shape
Proportion of pulse types
Intensity of returns
96%91%[70]
Segmentation based on LiDAR-derived layers: DEM, DSM, height and intensityTopography
Height
Intensity
94%89%[26]
-Height features83%74.1%[63]
Segments created using LiDAR layers: elevation and intensity;
LiDAR-derived DEM as reference for geometrical correction
Classification rules based on elevation 81%93%[71]
Individual segments isolated on the LiDAR-derived CHM then overlay on AVIRIS imageStructural features: crown heights, crown widths, intensity, crown porosity83.4%79.2%[66]
DTM derivation;
Individual tree detection;
Crown delineation
-68.8%-[73]
Treetop positioning;
Crown segments based on LiDAR point cloud data
Structural features: heights, intensity90.8%-[74]
Non-tree area mask derived based on vertical structure from LiDAR;
Crown outlining and treetop positioning from LiDAR CHM
Crown shape
Laser point distribution
Laser return intensity
51.1%70%[84]

