Article

Interpretable Heart Disease Prediction: Optimizing Machine Learning Models via Metaheuristic Ivy Algorithm


1
School of Mechanical Engineering, Chongqing University of Technology, Banan, Chongqing 400054, China
2
Nantong Public Transportation Group Co., Ltd., Nantong 226000, China
3
Chongqing Institute of Green and Intelligent Technology, Chinese Academy of Sciences, Chongqing 400714, China
4
China Three Gorges Construction Engineering Group Co., Ltd., No. 288 North Tianfu Avenue, Chengdu 610041, China
*
Authors to whom correspondence should be addressed.
Algorithms 2026, 19(9), 788; https://doi.org/10.3390/a19090788
Submission received: 5 June 2026 / Revised: 12 August 2026 / Accepted: 3 September 2026 / Published: 14 September 2026
(This article belongs to the Special Issue Computational Intelligence and Nature Inspired Algorithms)

Abstract

Cardiovascular diseases remain a major global health burden, making the development of accurate and interpretable prediction models important for clinical decision support. In this study, the metaheuristic Ivy Algorithm was employed to perform two-stage hyperparameter optimization for five machine learning classifiers, namely ID3, SVM, RF, XGBoost, and LightGBM. The proposed framework was evaluated on the publicly available Cleveland and Statlog heart disease datasets using outer stratified 10-fold cross-validation. The results showed that IVYA-based optimization improved the predictive performance of all five classifiers to varying degrees. Among them, IVYA-LightGBM achieved the best overall performance, with mean AUC, Accuracy, Precision, Recall, and F1-score values of 0.945, 0.907, 0.931, 0.864, and 0.893, respectively. Paired Wilcoxon signed-rank tests based on the fold-wise results indicated that the improvements in AUC were statistically significant in most model–dataset comparisons. In addition, under consistent experimental settings, IVYA was compared with five widely used metaheuristic optimization algorithms and achieved the highest AUC, Recall, and F1-score, while requiring the shortest average runtime. To enhance model interpretability, SHAP analysis was further incorporated to quantify the contributions of different clinical features to the model predictions and improve the transparency of the prediction process. Overall, IVYA-LightGBM achieved a favorable balance among predictive performance, computational efficiency, and interpretability. Nevertheless, further validation on larger and more diverse clinical datasets is required before practical clinical application.

1. Introduction

According to the World Health Organization, an estimated 19.8 million people died from cardiovascular diseases in 2022, accounting for approximately 32% of all global deaths [1]. The high incidence and uncertain progression of cardiovascular diseases make early diagnosis and timely intervention essential for improving patient outcomes [2,3]. More broadly, chronic disease management is increasingly shifting toward prevention, early detection, integrated care, and continuous monitoring of non-communicable diseases [4,5].
Machine learning and related intelligent technologies have demonstrated broad applicability in real-world environments and are increasingly being used to address a wide range of complex practical problems [6,7]. In particular, machine learning has shown considerable potential in healthcare by providing data-driven approaches to disease prediction, diagnosis, and prognosis [8,9,10]. Related intelligent modeling methods have also been applied to brain research [11,12], vascular intervention [13,14], disease-severity assessment [15], and cardiac rhythm screening [16], further demonstrating their broad applicability to biomedical engineering and clinical decision support.
Recent advances in artificial intelligence have stimulated extensive research on heart disease prediction [17,18,19]. Mohan et al. [20] improved predictive accuracy by identifying influential features, highlighting the importance of feature selection, while Javid et al. [21] showed that voting ensembles integrating machine learning and deep learning models could improve prognostic accuracy.
Among supervised learning approaches, Lamir et al. [22] reported an accuracy of 91% for Random Forest on the UCI heart disease dataset. Venkatesh et al. [23] proposed MBASVM, whose two variants achieved recall values of 92% and 87% on the Cleveland dataset. After ANOVA F-test-based feature selection and grid-search optimization, Dubey et al. [24] reported an accuracy of 89% for SVM on Cleveland and 91% for both logistic regression and naive Bayes on Statlog. Teja and Rayalu [25] evaluated multiple classifiers on a merged heart disease dataset, with k-nearest neighbors and random forest (RF) achieving the highest accuracy of approximately 91%.
Ensemble learning has also been widely investigated. Datta et al. [26] combined NB, SVM, KNN, and XGBoost for early coronary heart disease prediction. Khan et al. [27] developed the EnsCVDD-Net and BlCVDD-Net architectures, with BlCVDD-Net achieving an Accuracy and F1-score of 0.91 on the CDC dataset. Wu et al. [28] proposed SDKABL, which achieved more than 91% in Accuracy, Precision, Recall, and F1-score and an area under the receiver operating characteristic (ROC) curve (AUC) of 92% on Cleveland, as well as an AUC of 89% on Framingham. Maach et al. [29] developed a majority-voting ensemble that achieved an accuracy of 88.12% on the Z-Alizadeh Sani dataset.
Deep learning methods have likewise shown considerable potential in predictive analytics and clinical decision support [30,31,32]. Almulihi et al. [33] reported an accuracy of 89.76% for a CNN–LSTM model on Cleveland, whereas Alghamdi et al. [34] combined an autoencoder with DenseNet and reported an accuracy of 99.67%. García-Ordás et al. [35] achieved approximately 90% Precision and an improvement of about 4.4% over several existing methods. Arooj et al. [36] obtained an Accuracy of 91.7%, a Precision of 88.9%, and a Recall of 82.8% using a deep convolutional neural network.
In parallel, intelligent optimization, multi-agent reasoning, and advanced explainable artificial intelligence methods have become increasingly prominent in clinical decision-support research. Cao et al. [37] combined feature-selection strategies with an improved particle swarm optimizer for XGBoost, achieving an Accuracy of 74.7% and an AUC of 80.8%. Hong et al. [38] proposed ArgMed-Agents, whose GPT-4 implementation achieved accuracies of 83.3% and 81.6% on MedQA and PubMedQA, respectively. Žlahtič et al. [39] introduced Data Canyons, an interactive white-box approach that received an average interpretability rating of 8.8 out of 10. Although metaheuristic algorithms have been widely applied to hyperparameter optimization for heart disease prediction, existing studies have mainly focused on predictive performance, while systematic evaluations of search efficiency, computational cost, model stability under limited-sample settings, and interpretability remain relatively limited. Metaheuristic optimization generally requires the repeated training and evaluation of numerous candidate configurations, whereas direct exploration of a high-dimensional hyperparameter space may increase the computational burden and make parameter selection more sensitive to small validation partitions.
Based on these considerations, we hypothesize that staged metaheuristic hyperparameter optimization improves the predictive performance and stability of machine learning models for heart disease prediction while maintaining computational efficiency under limited-sample settings. Accordingly, this study aims to develop and systematically evaluate an IVYA-based two-stage hyperparameter optimization framework for heart disease prediction in terms of predictive performance, model stability, computational efficiency, and interpretability.
The main contribution of this study is the development of a heart disease prediction framework that balances predictive performance, computational efficiency, and interpretability. Specifically, IVYA-based staged hyperparameter optimization is applied to five machine learning models, namely ID3, SVM, RF, XGBoost, and LightGBM, and systematically evaluated on the Cleveland and Statlog heart disease datasets using outer stratified 10-fold cross-validation. In addition, paired Wilcoxon signed-rank tests are employed to assess the statistical significance of the performance differences before and after optimization. Based on the evaluation results, the best-performing model is selected as the base model for subsequent experiments, with the aim of supporting accurate and stable early heart disease identification. On this basis, the IVYA-based two-stage hyperparameter optimization strategy is compared with direct joint optimization and five commonly used metaheuristic algorithms in terms of predictive performance, performance stability, and computational efficiency. Finally, SHAP analysis is applied to interpret the prediction process of the selected model and reveal the contributions of different clinical features to its predictions, thereby improving the transparency and interpretability of the model.

2. Materials and Methods

This study presents a two-stage hyperparameter optimization framework based on IVYA and integrates five well-established machine learning algorithms to systematically evaluate their predictive performance. The primary objective is to identify the best-performing model through a standardized experimental procedure. The evaluation was conducted on two publicly available heart disease datasets, namely the Cleveland and Statlog datasets. All experiments were implemented in Python 3.10 and executed on a workstation equipped with an NVIDIA GeForce RTX 4060 GPU.

2.1. Data Preprocessing

The Cleveland and Statlog datasets each contain 13 input variables comprising demographic characteristics and clinical measurements, together with one binary target variable indicating the presence or absence of heart disease. In the Cleveland dataset, the features Ca and Thal have 4 and 2 missing values, respectively. Given the small number of missing values, mean imputation was applied to address them. The original target variable comprised five classes (0, 1, 2, 3, 4). Since this study focuses solely on the presence or absence of heart disease, labels 1, 2, 3, and 4 were recoded as 1 (disease present), while 0 was retained as no disease. The Statlog dataset contains no missing values and therefore required no imputation.
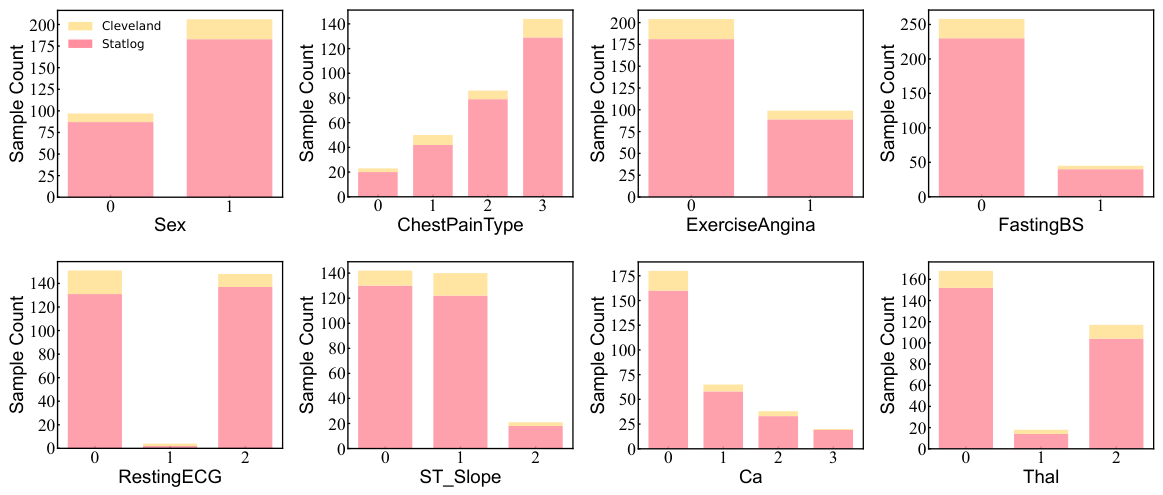
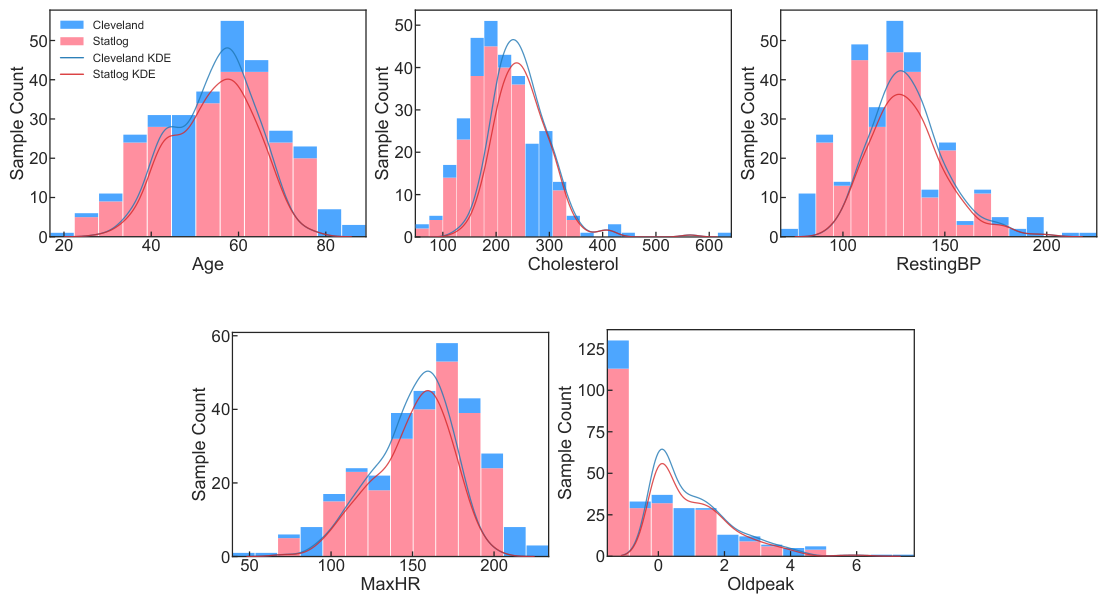
For subsequent analysis, the categorical predictors in both datasets were retained and treated as categorical variables. Table 1 summarizes the 14 attributes included in both datasets. To provide a clearer understanding of the data distribution, Figure 1 presents histograms of the categorical variables, whereas Figure 2 displays histograms and kernel density estimate (KDE) curves for the continuous variables. It should be noted that the Cleveland and Statlog datasets share highly similar feature schemas and clinical variable definitions. Therefore, the use of these two datasets was intended to evaluate the reproducibility and stability of the proposed IVYA-based optimization framework within a comparable feature space.

2.2. Ivy Algorithm

The Ivy Algorithm, proposed by Ghasemi et al. in 2024 [40], is a nature-inspired metaheuristic optimization algorithm that simulates the growth, climbing, and spreading behaviors of ivy plants. The selection of IVYA in this study was motivated by the characteristics of the machine learning hyperparameter optimization problem, which involves bounded search spaces containing both continuous and discrete variables, as well as a non-differentiable and potentially multimodal objective function. Through guidance from promising neighboring individuals and stochastic position updates, IVYA combines global exploration with local exploitation, which can help reduce premature convergence and improve the search for promising hyperparameter configurations. In addition, compared with evolutionary algorithms that require explicitly designed crossover, mutation, and selection operators, IVYA has a relatively simple search structure and requires fewer algorithm-specific operations. Typically, the main components of IVYA are as follows:
  • Organized and structured population growth.
  • The growth of ivy serves as a natural strategy to compete for sunlight resources.
  • Ivy expansion and adaptation illustrate its survival strategies.
The algorithm treats the ivy plant community as a population, where the position of each ivy individual represents a potential value for the decision variables of the problem. In the search space, the initial population positions are determined by random generation, as shown in Equation (1):
I i = I min + rand ( 1 , D ) ( I max I min )
In this, I i denotes the position vector of the i-th ivy individual, while I min and I max specify the boundaries of the search space. rand denotes a D-dimensional vector drawn from a uniform distribution, and ⊙ represents the Hadamard (element-wise) product.
To simulate the variation in the growth rate of ivy, the change in its growth rate G v is modeled based on the differential equation in Equation (2).
d G v ( t ) d t = ψ · G v ( t ) · φ ( G v ( t ) )
In the IVYA, this differential equation is converted into a difference equation in the discrete-time system as shown in Equation (3):
Δ G v i ( t + 1 ) = rand 2 · N ( 1 , D ) Δ G v i ( t )
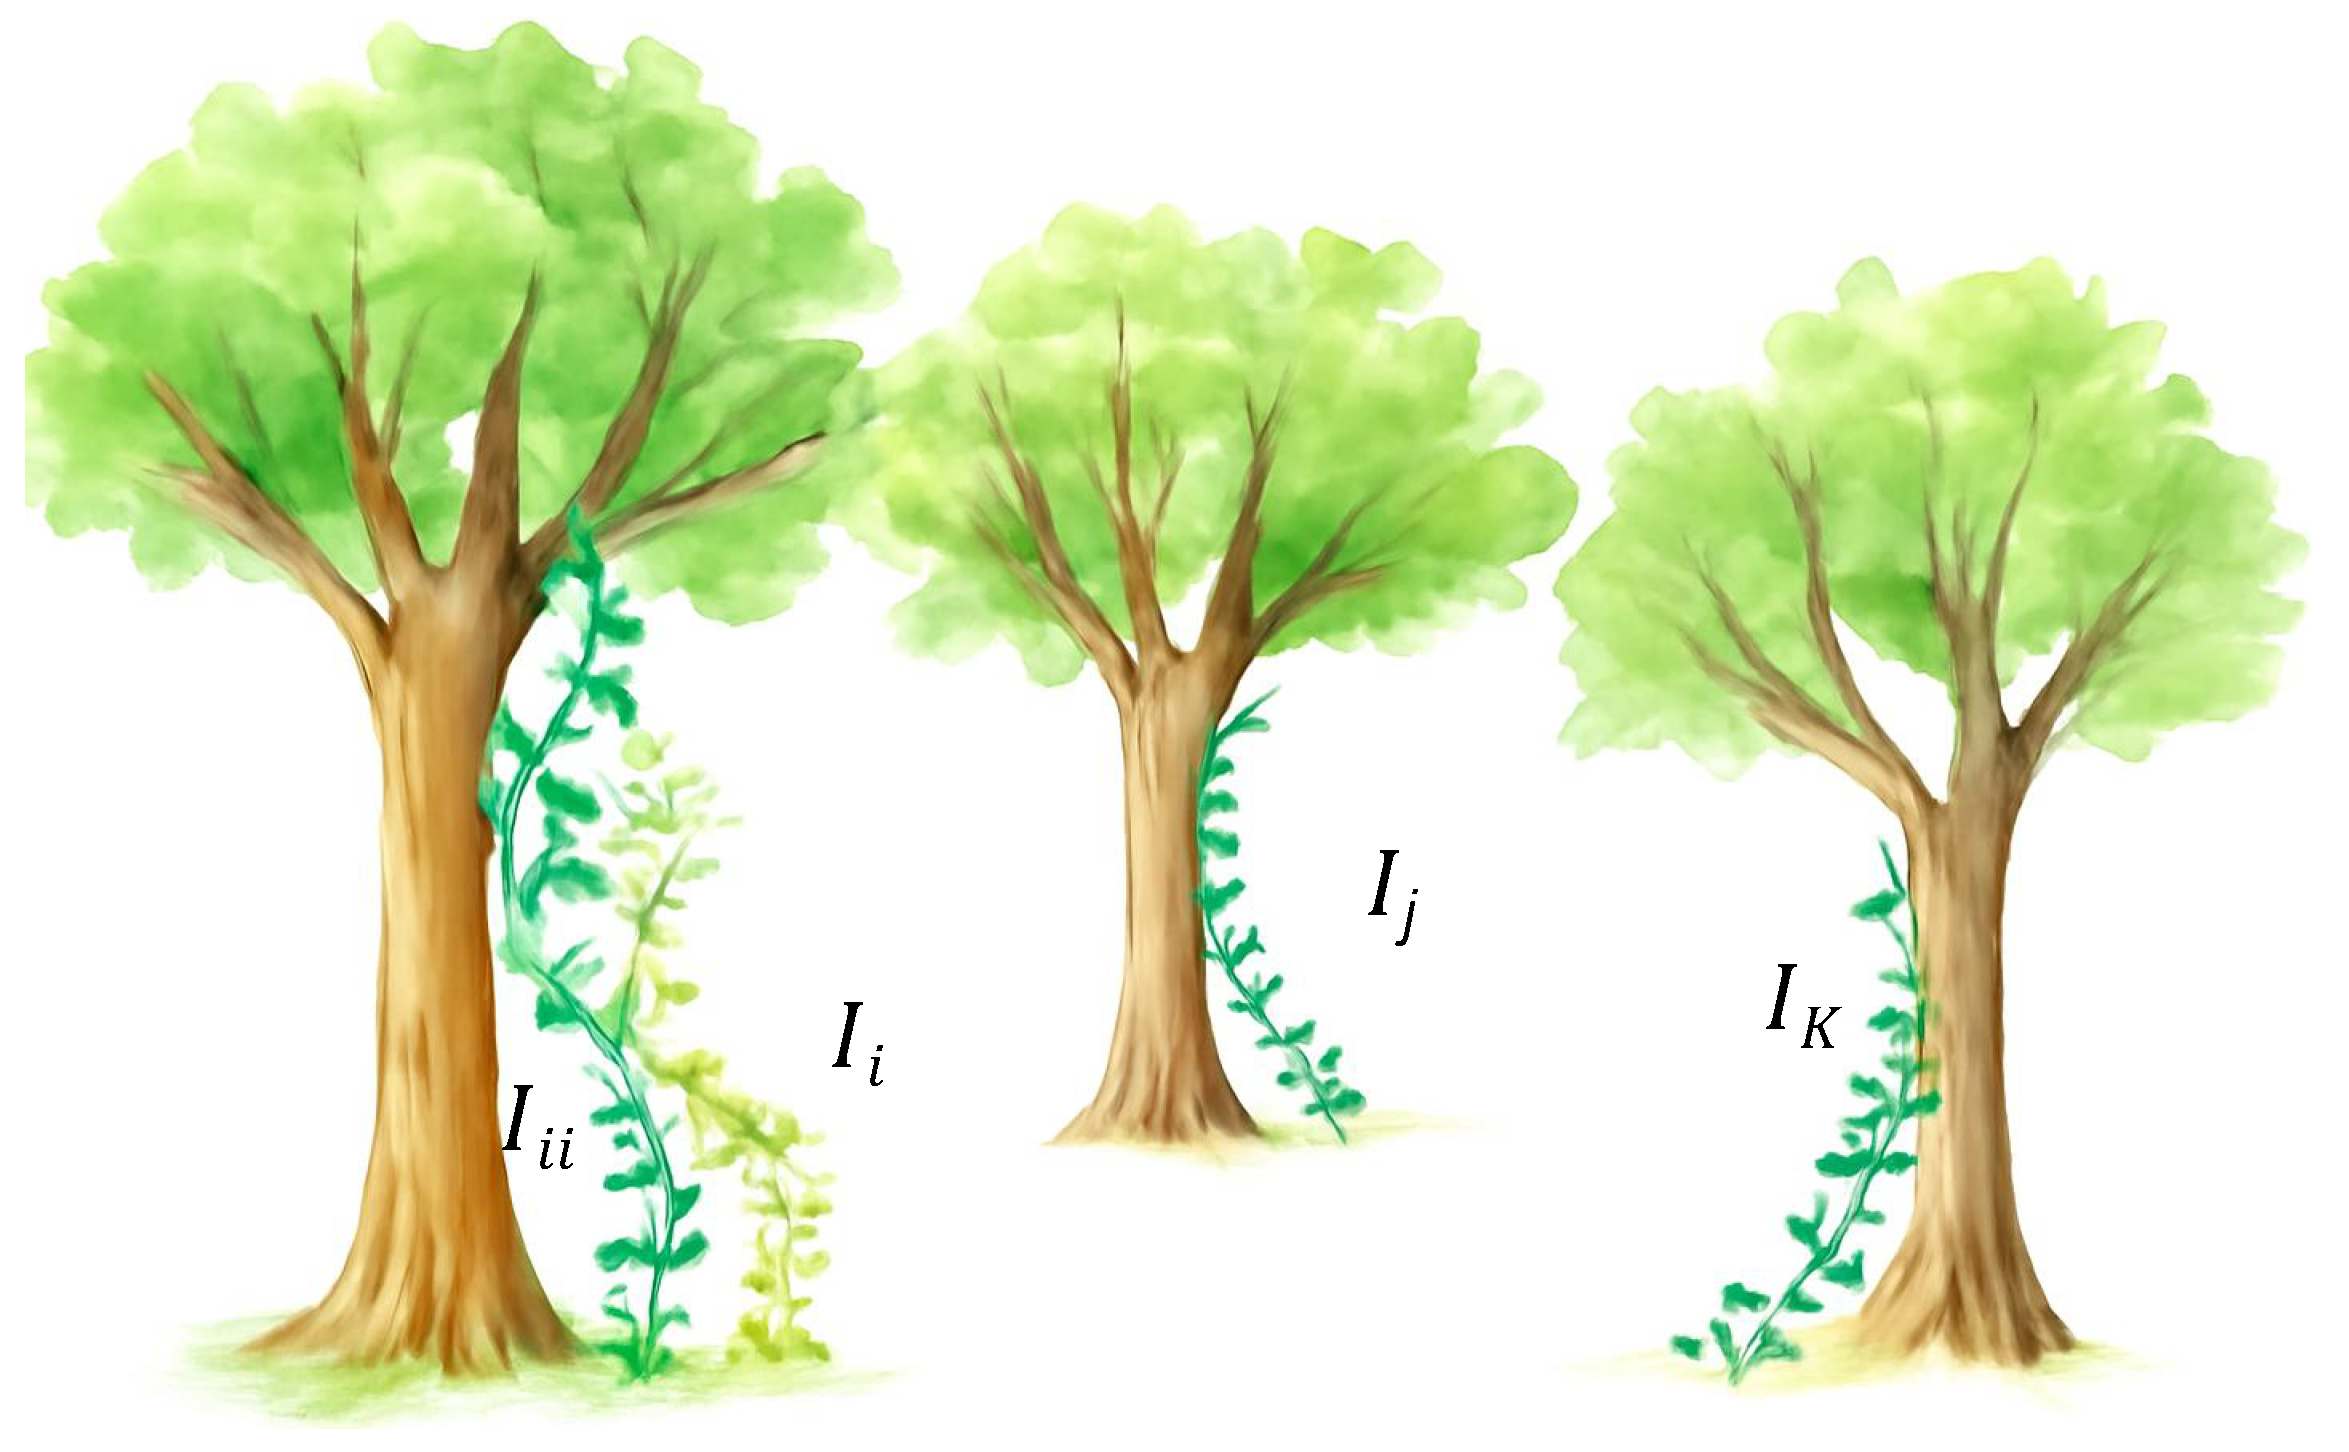
In this formulation, Δ G v i ( t ) and Δ G v i ( t + 1 ) denote the variation in growth rate across successive iterations t and t + 1 . The variable rand follows a uniform distribution over [0,1], while rand 2 indicates a stochastic variable defined by a specific probability density function. Additionally, N ( 1 , D ) represents a D-dimensional random vector drawn from a standard Gaussian distribution. During the optimization procedure, the i-th ivy agent I i updates its position by selecting the neighbor I t i that achieves the maximum fitness value within the population. If I i = I j S (where I j S is the sorted population member), then I i = I j 1 S ; if I i = I b e s t , then I i = I i i . Equations (4) and (5) describe the process of individual I i moving towards the light source under the guidance of I i i , while Figure 3 illustrates a schematic of the individual during this guided process.
I i n e w = I i + N ( 1 , D ) ( I t i I i ) + N ( 1 , D ) Δ G v i , i = 1 , 2 , , N p o p
with
Δ G v i = I i ( I max I min ) , Iter = 1 ; rand 2 · ( N ( 1 , D ) Δ G v i ) , Iter > 1 .
where | N ( 1 , D ) | is the vector obtained by taking the absolute value of each component of N ( 1 , D ) , and ⊘ represents the Hadamard division.
After moving towards the nearest key neighbor, the ivy individual attempts to move closer to the best individual in the population, as shown in Equation (6):
I i n e w = I B e s t rand ( 1 , D ) + N ( 1 , D ) Δ G v i
Subsequently, the new growth rate is computed based on Equation (7).
Δ G v i n e w = I i n e w ( I max I min ) .

2.3. Machine Learning Algorithms

SVM functions by seeking a hyperplane that maximizes class separation, making it an effective classification method. Its robustness on small datasets and in high-dimensional settings, along with kernel-based extensions, makes it a versatile tool for both linear and nonlinear classification.
LightGBM, a gradient boosting system introduced by Microsoft in 2017, employs histogram-based computation and a leaf-wise growth strategy for decision trees, resulting in faster training speeds and lower memory consumption. It is commonly used in large-scale data modeling and industrial applications.
XGBoost extends the gradient boosting framework by incorporating efficient computation, regularization, and mechanisms for overfitting control. It constructs strong learners through the weighted integration of iteratively trained weak classifiers, such as CART trees. It improves on computational efficiency, regularization, and overfitting prevention, making it a commonly used algorithm in data science competitions like Kaggle.
RF is an ensemble approach grounded in the bagging concept. It trains numerous decision trees on randomly drawn samples and combines their outputs through voting or averaging. This strategy helps curb the overfitting seen with a lone decision tree and yields solid generalization and robustness.
ID3 represents an early form of decision tree learning, where the tree is built recursively by selecting attributes that maximize information gain at each split. Its advantages include a clear structure and ease of interpretation.

2.4. Methodology

This study employed an IVYA-based two-stage hyperparameter optimization framework in combination with five classical machine learning models, namely SVM, RF, ID3, XGBoost, and LightGBM, to systematically evaluate their performance in heart disease prediction. Given that the Cleveland and Statlog datasets are widely used benchmark datasets with relatively limited sample sizes, stratified 10-fold cross-validation was adopted to make full use of the available observations, reduce the dependence of the results on a single random train–test split, and preserve the class distribution across the folds.
For each outer cross-validation fold, the held-out fold, corresponding to approximately 10% of the complete dataset, was reserved exclusively for final testing, while the remaining 90% of the data constituted the outer training set. The outer training set was further divided into an inner training set and an inner validation set using a stratified 85:15 ratio to preserve the class distribution. Candidate models were fitted using the inner training set, whereas the inner validation set was used for fitness evaluation, hyperparameter selection, and early-stopping decisions.
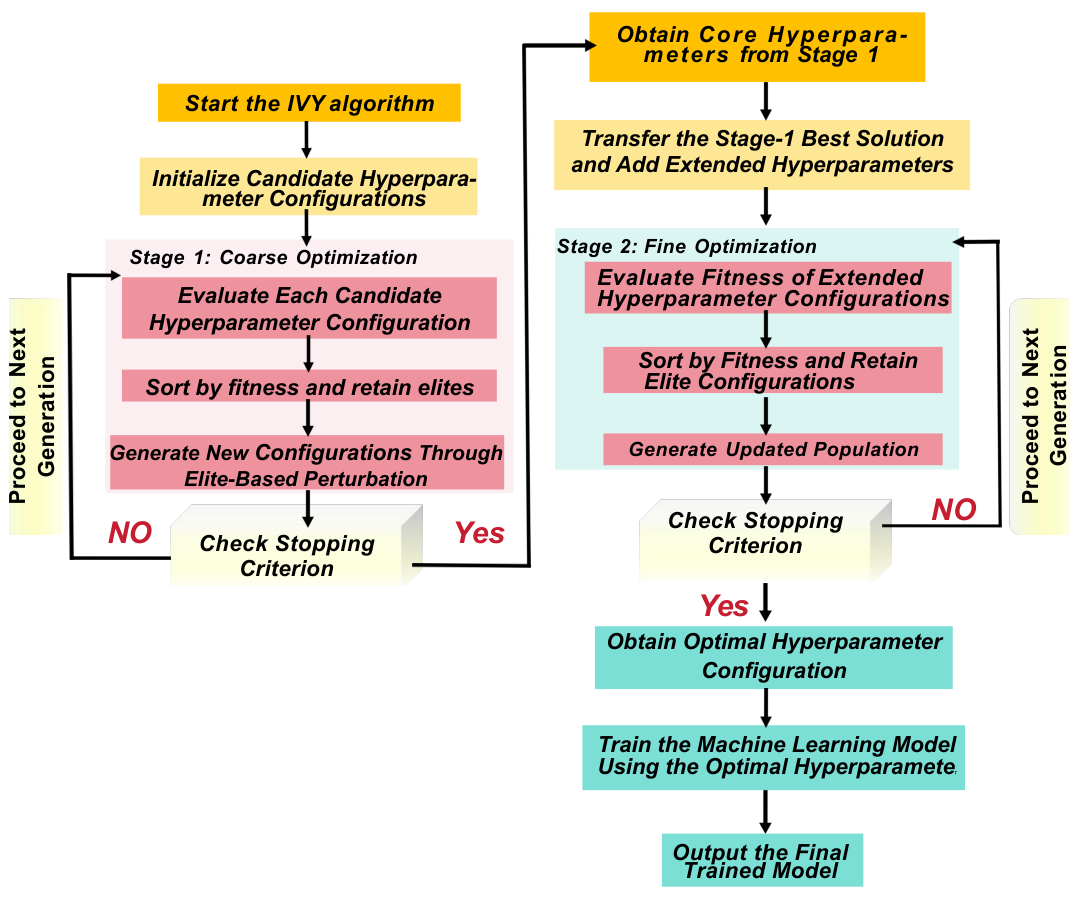
The proposed hyperparameter optimization procedure consisted of two successive stages. In the first stage, each individual in the IVYA population represented a candidate configuration of the core hyperparameters of the corresponding machine learning model. These parameters were optimized through a coarse-grained search to identify a promising region associated with an appropriate level of model complexity. The selected core hyperparameters varied across the models. Specifically, SVM mainly involved penalty and kernel-related parameters; RF involved the number of estimators, tree depth, and splitting constraints; and XGBoost and LightGBM involved learning-related and tree-structure parameters, such as the learning rate, maximum tree depth, and leaf-related settings.The fitness of each candidate hyperparameter configuration was evaluated on the inner validation set using a weighted composite score defined as Fitness = 0.50 AUC + 0.20 F 1 + 0.15 Precision + 0.15 Recall . AUC was assigned the largest weight to prioritize the overall threshold-independent discriminative ability of the model, while F1-score, Precision, and Recall were incorporated to account for classification balance, positive predictive reliability, and the identification of positive cases, respectively. Through iterative fitness evaluation, elite retention, and population updating, Stage 1 identified an optimal core hyperparameter configuration for subsequent refinement.
In the second stage, the optimal core hyperparameters obtained from Stage 1 were transferred to the initial Stage-2 population. Additional model-specific hyperparameters, including feature-subsampling ratios, sample-subsampling ratios, regularization coefficients, and other extended parameters, were initialized within their predefined search ranges. IVYA then iteratively evaluated and updated the expanded candidate configurations, allowing both the core and extended hyperparameters to be jointly refined. This staged strategy was designed to initiate the expanded search from a promising region, thereby potentially reducing the difficulty of direct high-dimensional optimization while preserving the ability to further explore the complete hyperparameter space. The detailed workflow of the proposed two-stage hyperparameter optimization framework is illustrated in Figure 4.
To avoid unnecessary iterations after the search had stabilized, a unified early-stopping criterion was applied to both IVYA optimization stages. Specifically, if the global best fitness failed to improve by more than 1 × 10 6 for 50 consecutive generations, the current optimization stage was terminated, and the best hyperparameter configuration identified during the search history was retained. After the optimal hyperparameters had been determined, the corresponding model was refitted using the complete outer training set and subsequently evaluated on the outer test fold.
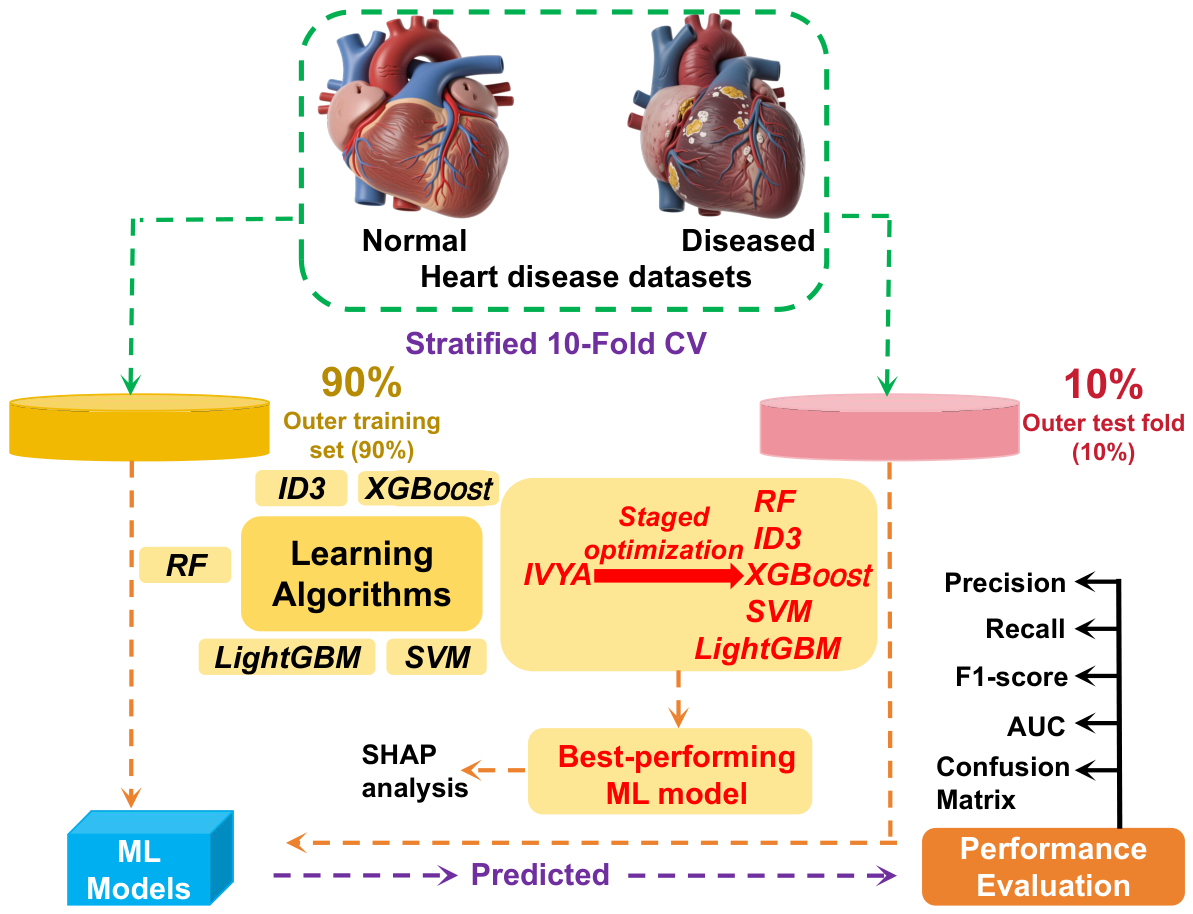
All models were assessed using the same outer stratified 10-fold cross-validation partitions. The final AUC, Accuracy, Precision, Recall, and F1-score values were reported as the mean ± standard deviation across the outer test folds. Confusion matrices were used to further characterize classification errors, while SHAP analysis was applied to examine the contribution of individual clinical variables to the model predictions. The overall framework of the IVYA-based heart disease prediction approach is illustrated in Figure 5.

3. Experimental

3.1. Performance Evaluation Metrics

This study evaluates the model’s performance using several metrics. Accuracy , as shown in Equation (8), represents the overall prediction effectiveness and is calculated as the ratio of correctly identified instances to the total number of instances.
A c c u r a c y = T N + T P F N + F P + T N + T P
where T P is the number of true positives (heart disease patients correctly identified), T N is the number of true negatives (healthy individuals correctly identified), F P is the number of false positives (healthy individuals misclassified as diseased), and F N is the number of false negatives (heart disease patients misclassified as healthy).
Precision , shown in Equation (9), measures the proportion of true positives among all predicted positives.
P r e c i s i o n = T P F P + T P
Recall , or sensitivity, in Equation (10), measures the model’s ability to identify true positives, with a higher recall indicating fewer missed diagnoses.
R e c a l l = T P F N + T P
The F 1-score provides a more balanced evaluation metric; it is the harmonic mean of Precision and Recall , as shown in Equation (11).
F 1 = 2 · R e c a l l · P r e c i s i o n R e c a l l + P r e c i s i o n
The AUC evaluates classification performance, with higher values indicating better differentiation between disease and healthy cases.

3.2. Experimental Results

This section presents the evaluation results of five widely used machine learning models (RF, XGBoost, LightGBM, ID3, and SVM) optimized through the IVYA. The assessment was conducted on two publicly available datasets using stratified 10-fold cross-validation. To enable a fair comparison, model performance was measured with standard metrics, including Accuracy, Precision, Recall, F1-score, and AUC. In addition, SHAP-based interpretability analysis was applied to IVYA-LightGBM to investigate its global decision-making patterns.
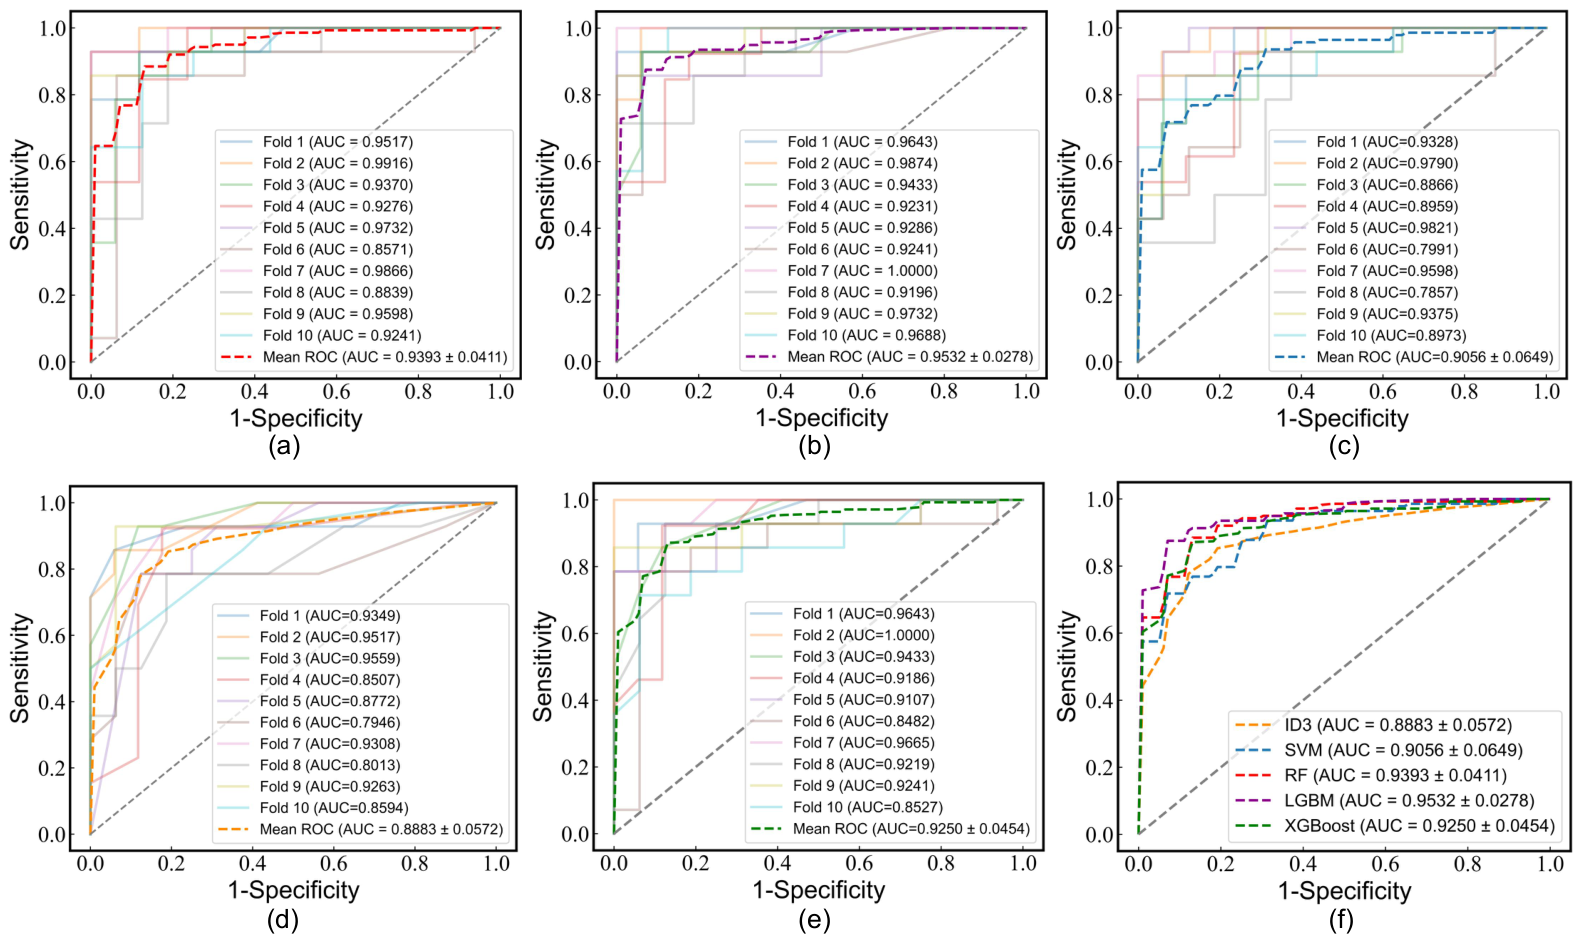
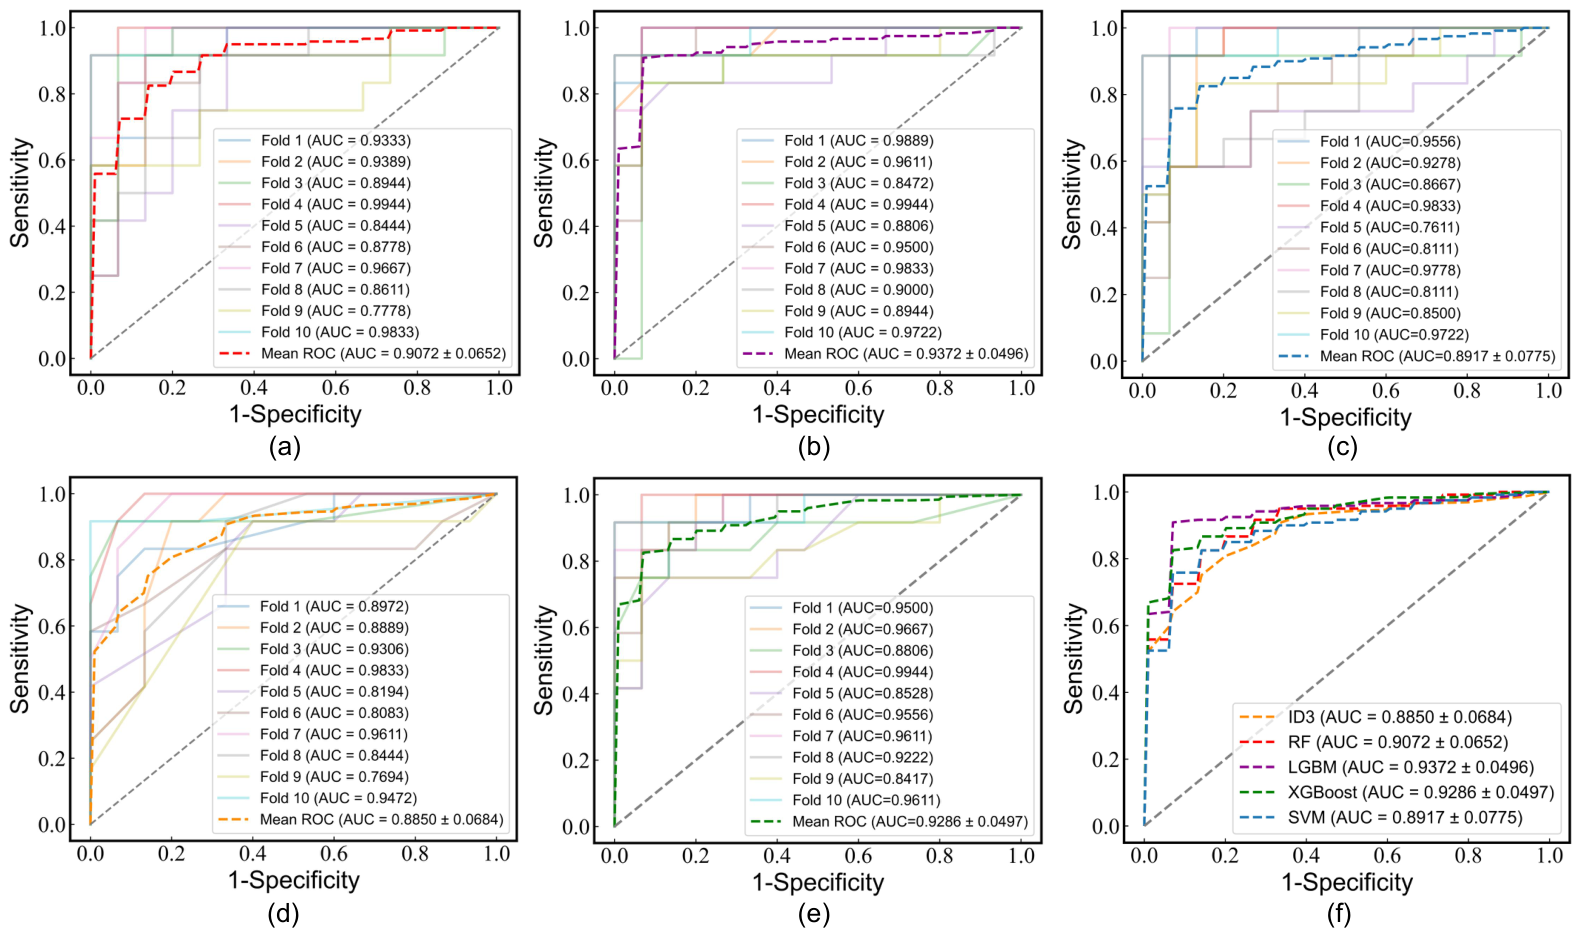
Figure 6a–e and Figure 7a–e depict the fold-wise ROC curves of the five IVYA-optimized models on the Cleveland and Statlog datasets, respectively. As shown in Figure 6f and Figure 7f, IVYA-LightGBM achieved the highest mean AUC among the five models on both datasets, reaching 0.953 on Cleveland and 0.937 on Statlog.
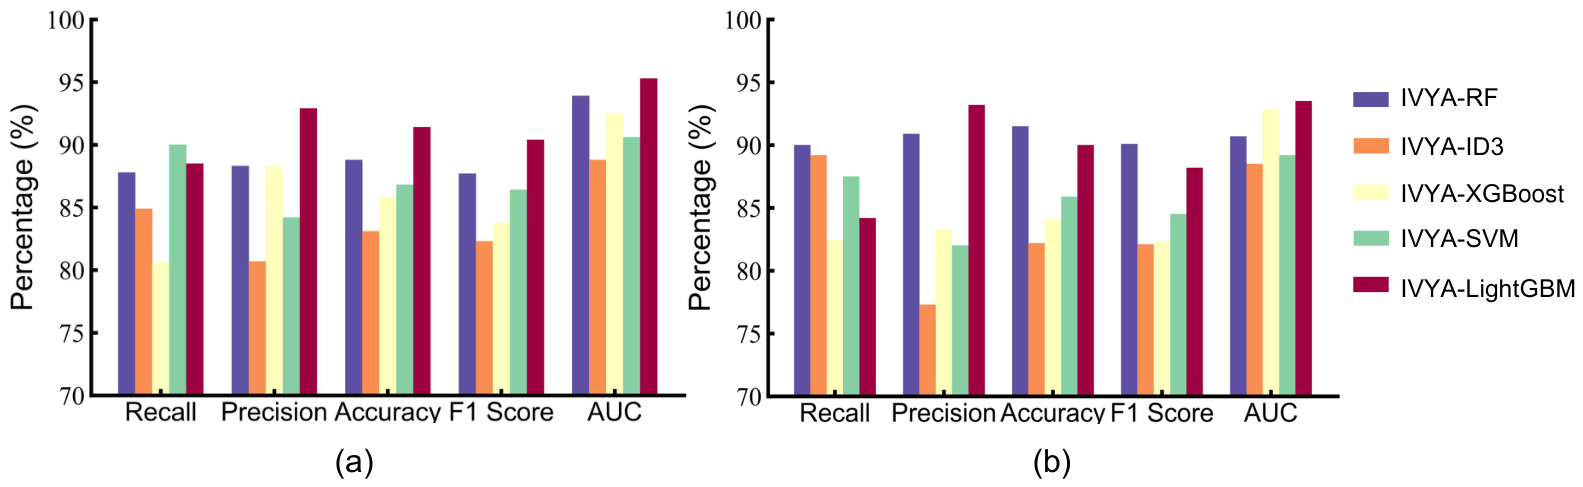
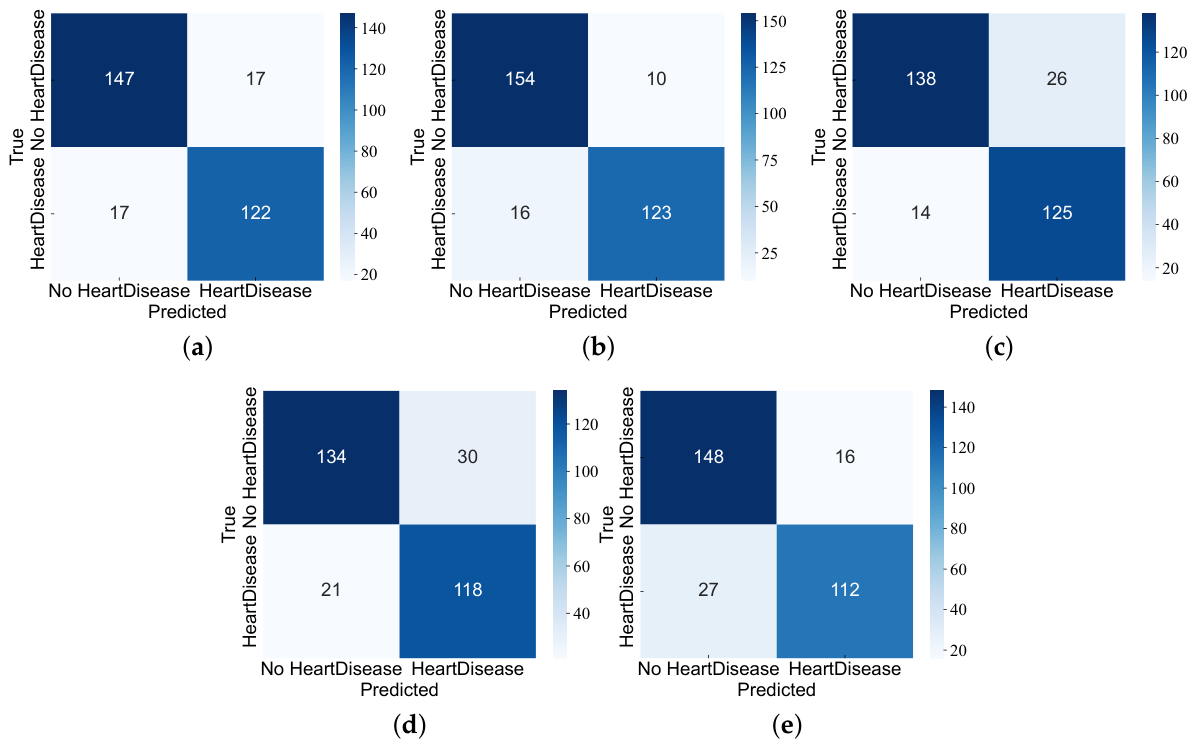
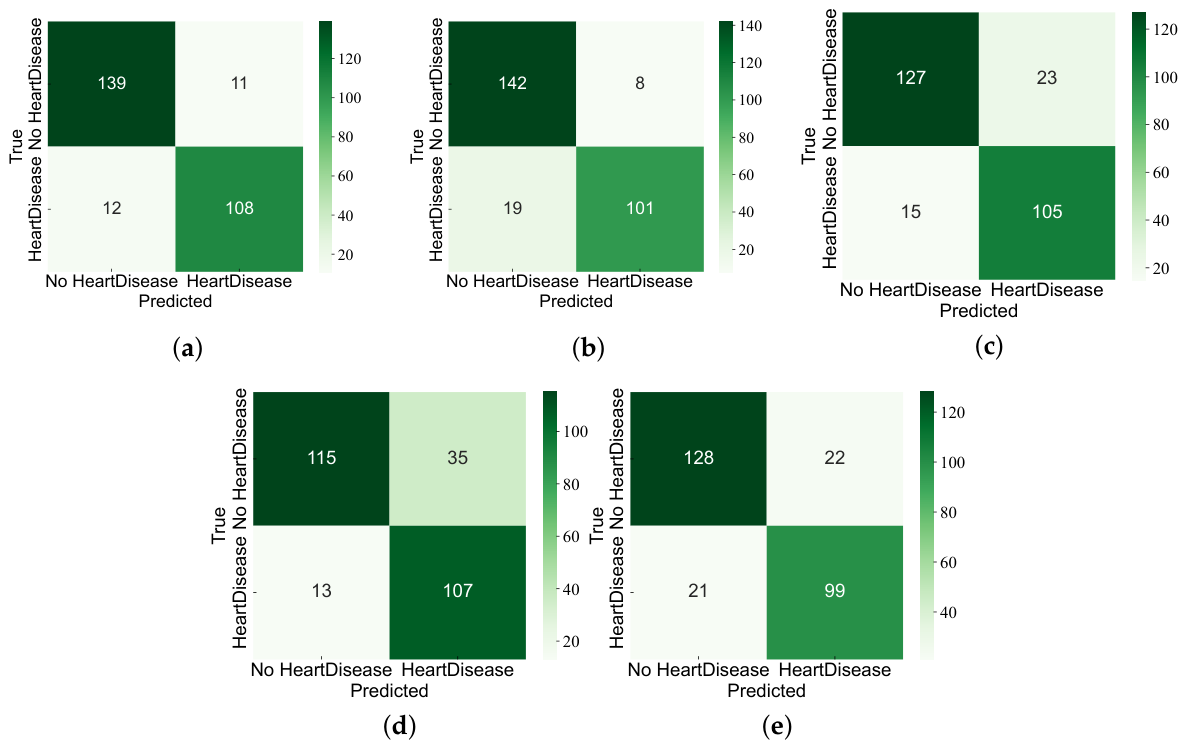
The overall performance evaluation results for the two datasets are presented in Figure 8a,b, while Figure 9a–e and Figure 10a–e show the corresponding confusion matrices for the Cleveland and Statlog datasets, respectively. The quantitative training and testing results are summarized in Table 2 and Table 3, with all metrics reported as the mean ± standard deviation across the 10 folds. Overall, the training performance was generally higher than the testing performance, although the differences were relatively limited for most models. The training–testing AUC gaps ranged from approximately 1.6 to 5.3 percentage points across the two datasets. For IVYA-LightGBM, the AUC gaps were only 2.0 percentage points on Cleveland and 1.6 percentage points on Statlog, while the corresponding Accuracy and F1-score gaps ranged from approximately 2.6 to 3.5 percentage points. These results indicate that IVYA-LightGBM maintained strong predictive performance on unseen samples without exhibiting obvious severe overfitting. In contrast, the relatively low and similar training and testing performance of IVYA-ID3, particularly on the Cleveland dataset, suggests limited model capacity and a possible tendency toward underfitting.
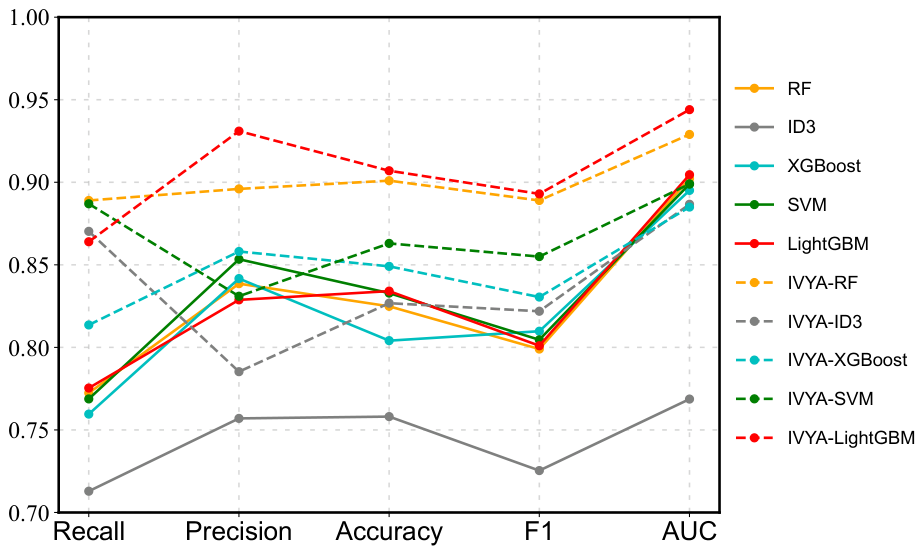
As shown in Figure 11, the average testing performance of the models before and after IVYA optimization was further compared across the two datasets, and the corresponding numerical results are summarized in Table 4. The overall results were calculated from the 20 held-out fold-specific results obtained across the Cleveland and Statlog datasets, with 10 folds from each dataset, and are reported as the mean ± standard deviation. Overall, IVYA-based optimization improved the predictive performance of the evaluated classifiers to varying degrees. Among them, IVYA-LightGBM achieved the best overall testing performance, with an average AUC of 94.5%, indicating a strong ability to discriminate between diseased and healthy individuals. Compared with the baseline LightGBM model, IVYA-LightGBM improved Accuracy, AUC, Recall, Precision, and F1-score by approximately 7, 4, 9, 10, and 9 percentage points, respectively. At the individual dataset level, its testing AUC reached 95.3 ± 2.78 % on the Cleveland dataset and 93.7 ± 4.96 % on the Statlog dataset, demonstrating relatively consistent discriminative performance across the two benchmark datasets.
Beyond these descriptive comparisons, paired Wilcoxon signed-rank tests were conducted using the fold-wise ROC–AUC values to determine whether the observed improvements were statistically significant. As shown in Table 5, all five IVYA-optimized models achieved statistically significant ROC–AUC improvements on the Cleveland dataset ( p < 0.05 ). The largest improvement was observed for ID3 ( Δ ROC–AUC = 0.1179 ), followed by LightGBM ( Δ ROC–AUC = 0.0483 ). On the Statlog dataset, statistically significant improvements were obtained for RF, ID3, XGBoost, and LightGBM, with ID3 again showing the largest increase ( Δ ROC–AUC = 0.1174 ). For SVM, the ROC–AUC increased only slightly from 0.889 to 0.892, corresponding to a mean improvement of 0.0026. This difference approached but did not reach statistical significance ( p = 0.0566 ), which may be associated with the relatively strong baseline performance of SVM on the Statlog dataset, the limited remaining room for improvement, and fold-to-fold variability under small-sample partitions.
Overall, nine of the ten model–dataset comparisons demonstrated statistically significant positive improvements, indicating that IVYA generally enhanced the discriminative performance of the evaluated classifiers, although the magnitude of improvement varied across models and datasets. IVYA-LightGBM achieved the highest absolute AUC and the most balanced overall performance across the evaluated metrics. Moreover, its ROC–AUC improvement was statistically significant on both datasets. Considering its predictive performance, cross-dataset consistency, and statistical evidence of improvement, LightGBM was therefore selected as the base model for the subsequent experiments.
The effectiveness of the proposed two-stage hyperparameter optimization strategy was first assessed by comparing it with the direct joint optimization of all hyperparameters (IVYA-Full). Both strategies were evaluated under consistent experimental settings, including identical data partitions, objective functions, population sizes, and hyperparameter search ranges. As shown in Table 6, IVYA-Two-stage achieved higher AUC, Accuracy, Precision, Recall, and F1-score than IVYA-Full, while requiring less runtime and exhibiting lower overall performance variability. These results suggest that the staged optimization strategy provides a more stable and efficient search process than the direct simultaneous optimization of all hyperparameters.
To further clarify the optimization results, Table 7 summarizes the predefined search spaces and the fold-specific optimized ranges of the LightGBM hyperparameters across the Cleveland and Statlog datasets. The optimized values are reported as the minimum–maximum ranges obtained independently from the 20 outer-fold observations, with 10 folds from each dataset. The results show that the selected hyperparameters generally remained within the interior of the predefined search spaces rather than consistently converging to their boundaries, indicating that the search process was not evidently constrained by overly narrow parameter limits. In particular, the optimized learning rate ranged from 0.0262 to 0.0650, while the maximum tree depth and number of leaves ranged from 4 to 6 and from 12 to 32, respectively. The sampling and regularization parameters also varied across folds, reflecting the fold-specific adjustment of model complexity and regularization strength.
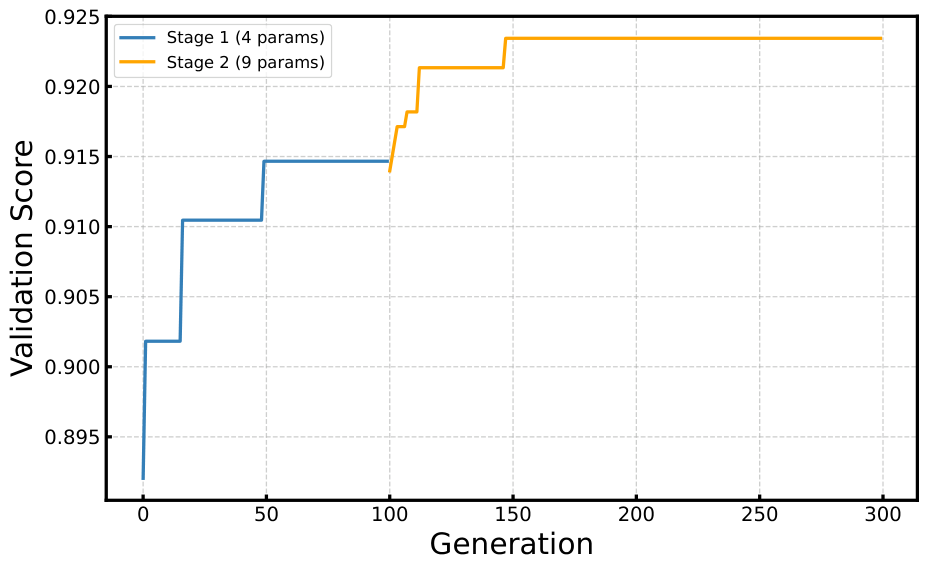
As a representative example, Figure 12 illustrates the convergence behavior of IVYA-Two-stage on the Cleveland dataset. During Stage 1, four core hyperparameters were optimized, namely the learning rate, number of leaves, maximum tree depth, and minimum number of samples per leaf. The validation score increased rapidly and stabilized after approximately 50 iterations, indicating that the coarse-search stage successfully identified a promising parameter region. Based on the solution obtained in Stage 1, five additional hyperparameters, namely feature_fraction, bagging_fraction, lambda_l1, lambda_l2, and min_gain_to_split, were introduced in Stage 2. The validation score continued to improve before gradually stabilizing, suggesting that the second stage further refined the model configuration by jointly adjusting the core, sampling, and regularization parameters.
The competitiveness of IVYA was evaluated against five widely used metaheuristic optimization algorithms, namely the Grey Wolf Optimizer (GWO), Particle Swarm Optimization (PSO), Whale Optimization Algorithm (WOA), Genetic Algorithm (GA), and Harris Hawks Optimization (HHO). All algorithms were applied to the same LightGBM model under identical experimental settings and evaluated using AUC, Accuracy, Precision, Recall, F1-score, and runtime. As shown in Table 8, IVYA achieved the highest AUC, Recall, and F1-score values of 94.5%, 86.4%, and 89.3%, respectively. It also achieved an Accuracy of 90.7%, tying with PSO for the highest value, while maintaining a competitive Precision of 93.1%. In addition, the mean runtime for one complete 10-fold experiment, averaged across the Cleveland and Statlog datasets, was 3.23 min, which was shorter than that of all the other optimization algorithms. These results suggest that IVYA provides a favorable overall balance between predictive performance and computational efficiency for LightGBM hyperparameter optimization.
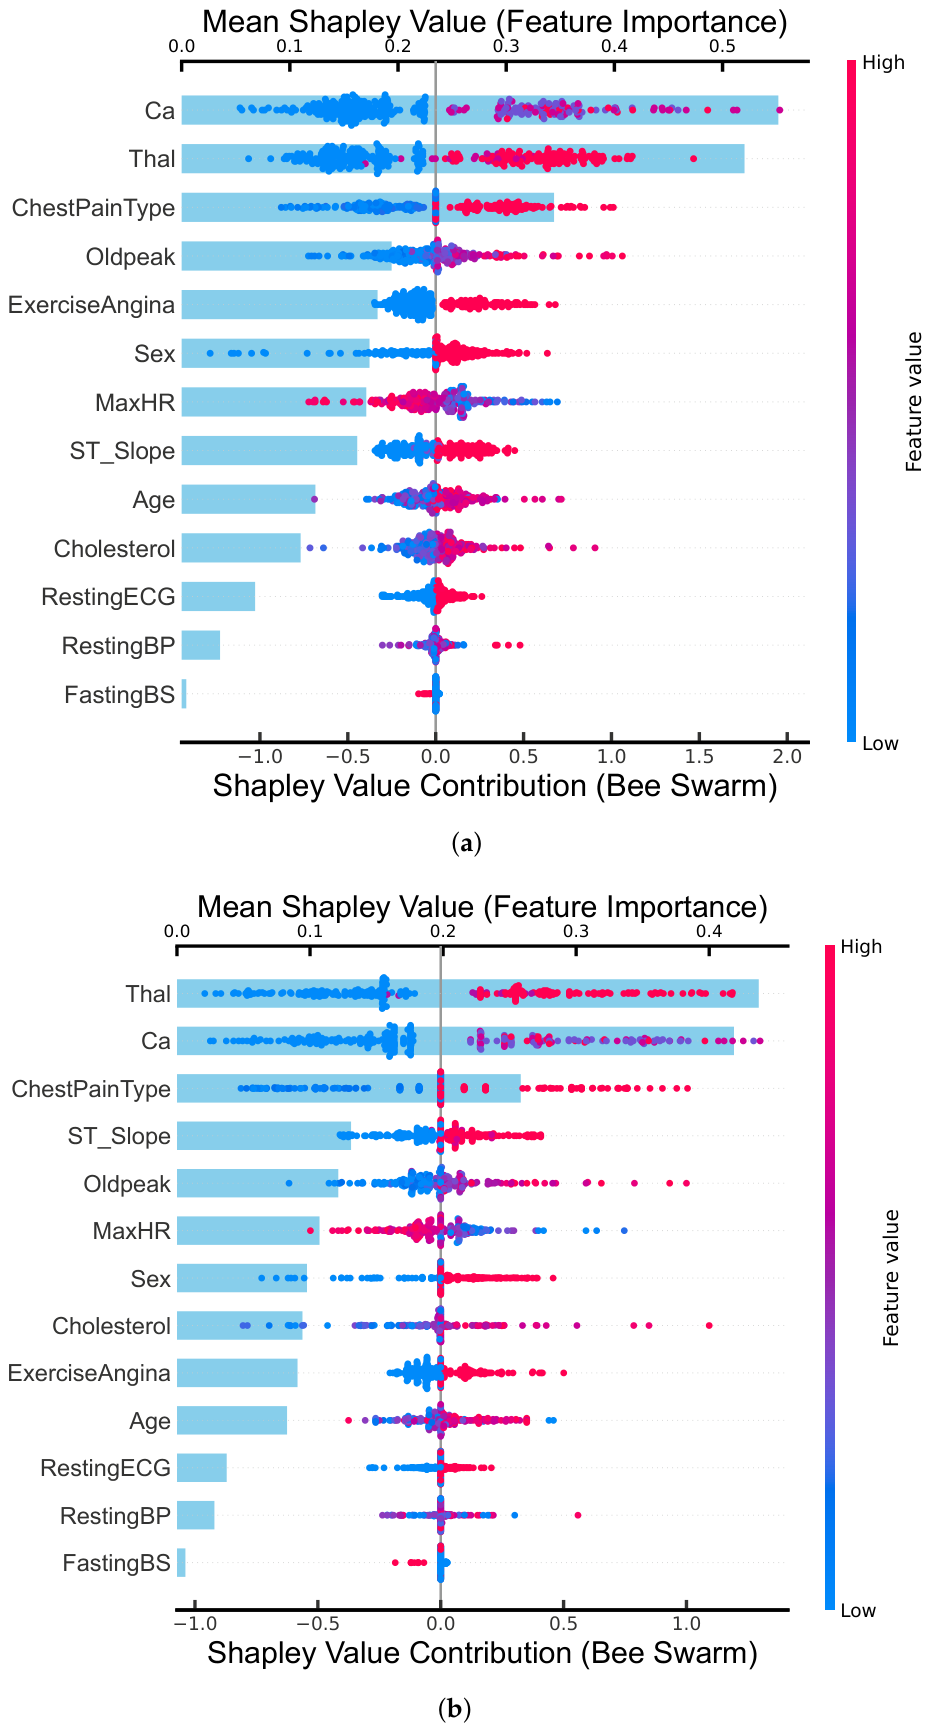
After establishing the predictive competitiveness of IVYA-LightGBM, SHAP-based interpretability analysis was performed to investigate the decision-making rationale of the best-performing model, as shown in Figure 13a,b. The results identified Ca, Thal, and ChestPainType as the three most influential predictors across the two datasets. The consistently high importance of these features suggests that the model learned similar predictive patterns across the two datasets. Moreover, the identified predictors are broadly consistent with established clinical knowledge. This analysis enhances the transparency of IVYA-LightGBM and demonstrates its potential to provide interpretable decision-support information for heart disease prediction.

4. Discussion and Conclusions

In this study, the metaheuristic IVYA was employed to perform staged hyperparameter optimization for multiple machine learning models, with the aim of improving the automated identification of heart-disease-positive cases from structured clinical data. The proposed framework may assist clinicians in identifying potentially high-risk individuals at an earlier stage and provide supporting information for subsequent examinations, referrals, and interventions. For use in clinical decision support systems, a predictive model should not only achieve high predictive accuracy but also demonstrate adequate interpretability, stability, and computational efficiency. Overall, the results indicate that IVYA-LightGBM achieved a favorable balance among predictive performance, model stability, interpretability, and computational efficiency.
The experimental results showed that IVYA-based hyperparameter optimization improved the overall predictive performance of all five baseline machine learning models to varying degrees. Among the evaluated models, IVYA-LightGBM achieved the best overall performance across the Cleveland and Statlog datasets, with mean AUC, Accuracy, Precision, Recall, and F1-score values of 94.5% ± 4.10%, 90.7% ± 4.63%, 93.1% ± 7.07%, 86.4% ± 6.70%, and 89.3% ± 5.34%, respectively. Compared with the unoptimized LightGBM model, the optimized model showed clear improvements across all evaluation metrics. In addition, the standard deviations of several metrics were reduced after optimization. For example, the standard deviation of Accuracy decreased from 7.38% to 4.63%, while that of Recall decreased from 10.47% to 6.70%. These findings indicate that IVYA optimization not only improved the average predictive performance but also reduced overall performance variability across the 20 model–dataset fold observations. Such stability is particularly important for small medical datasets, for which model performance can be sensitive to data partitioning and hyperparameter configuration.The paired Wilcoxon signed-rank tests further showed that the AUC improvements were statistically significant in nine of the ten model–dataset comparisons, with the only non-significant result observed for SVM on the Statlog dataset.
As summarized in Table 9, IVYA-LightGBM also demonstrated competitive overall performance compared with recent heart disease prediction studies, particularly in terms of Accuracy, Precision, F1-score, and AUC, although the comparison should be interpreted cautiously because of differences in datasets and experimental protocols.
The comparison with direct joint optimization further supports the effectiveness of the proposed staged search strategy. The two-stage procedure improved the overall AUC from 93.70% to 94.50% and reduced the average runtime from 4.19 to 3.23 min, corresponding to a reduction of approximately 22.9%. It also reduced the standard deviations of all evaluated metrics. These findings suggest that first identifying a promising region for the core hyperparameters and subsequently refining the sampling and regularization parameters may provide a more stable and computationally efficient search process than optimizing all parameters simultaneously.
The comparison with GWO, PSO, WOA, GA, and HHO further demonstrated the competitiveness of IVYA. It achieved the highest AUC, Recall, and F1-score, tied with PSO for the highest Accuracy, and required the shortest runtime. Nevertheless, IVYA did not outperform every alternative algorithm on every individual metric; therefore, its advantage should be interpreted as a favorable overall balance between predictive performance and computational efficiency rather than absolute superiority across all measures.
SHAP analysis identified Ca, Thal, and ChestPainType as highly influential predictors in both datasets. The cross-dataset consistency of these features provides some evidence that IVYA-LightGBM captured similar predictive patterns across the two benchmark datasets. The SHAP results also provide feature-level information regarding how individual variables contribute to the model output, thereby improving the transparency of the prediction process. Nevertheless, SHAP values describe model-based associations and should not be interpreted as evidence of causal clinical effects.
Nevertheless, this study has several limitations. First, the present investigation was retrospective and did not evaluate probability calibration, subgroup fairness, temporal stability, or the actual effects of the model on clinical decision-making and patient outcomes. Therefore, the model output should not replace comprehensive clinical judgment. Final decisions should still be based on patients’ symptoms, medical history, physical examination findings, and other diagnostic results. In particular, the mean Recall of the proposed model was 86.4%, indicating that some positive cases may still be missed under the current classification threshold.
Several challenges may also arise during practical deployment. First, variable definitions, measurement units, examination procedures, and coding standards may differ across hospitals; therefore, model inputs must be standardized and appropriately mapped to local electronic health record systems. Second, differences in patient characteristics, disease prevalence, missing-data patterns, and examination equipment across medical institutions may lead to data distribution shifts, thereby reducing predictive performance in new clinical environments. In addition, real-world clinical data frequently contain missing values, outliers, delayed entries, and coding errors, and the simple mean-imputation strategy adopted in this study may be insufficient to address the complex missing-data mechanisms encountered in routine clinical practice. Although the comparison between the training sets and the corresponding held-out test folds did not indicate obvious severe overfitting, this conclusion was still based on internal cross-validation. Moreover, the limited sample size, performance variability across folds, and repeated model optimization mean that the risks of overfitting or underfitting cannot be completely excluded. These limitations should be carefully considered when interpreting the present findings and assessing their potential clinical applicability.
In summary, by employing an IVYA-based two-stage optimization framework, this study improved the predictive performance and stability of multiple machine learning models while maintaining computational efficiency. Among the evaluated models, IVYA-LightGBM achieved the best overall performance, with a mean AUC of 94.5%, indicating a strong ability to discriminate between individuals with and without heart disease. In addition, SHAP analysis was used to examine the contributions of different features to the model predictions, thereby providing additional information for understanding the model’s decision-making process. Nevertheless, prospective external validation, probability calibration, and further evaluation in larger, multicenter, and more diverse clinical populations are required to assess its generalizability, stability, and practical clinical value before routine clinical implementation.

Author Contributions

Conceptualization: Conceptualization: Y.J. and Z.Z.; Methodology: Y.J., Z.Z. and Z.D.; Formal analysis and investigation: Y.J., H.J. and C.L.; Process the results of the experiment: Y.J., R.L., J.X. and Z.D.; Writing—draft preparation: Y.J.; Writing—review and editing: Y.P. All authors have read and agreed to the published version of the manuscript.

Funding

This work was supported by the Young Project of Science and Technology Research Program of Chongqing Education Commission of China (KJQN202501166) and by the Chongqing Municipal Human Resources and Social Security Bureau (CSTB2025YCJH-KYXM0046). In addition, this paper was supported by the Innovative Research Group of Chongqing Municipal Education Commission (CXQT19026) and the Cooperative Project between Chinese Academy of Sciences and University in Chongqing (HZ2021011).

Institutional Review Board Statement

Not applicable.

Informed Consent Statement

Not applicable.

Data Availability Statement

The datasets used in this study are all publicly available. If needed, please contact the author via email for further access.

Acknowledgments

We thank the Chongqing Municipal Education Commission, the Chinese Academy of Sciences, the Chongqing Human Resources and Social Security Bureau, and Chongqing University of Technology for their financial support.

Conflicts of Interest

The authors declare no conflict of interest.

References

  1. World Health Organization. Cardiovascular Diseases (CVDs). Available online: https://www.who.int/news-room/fact-sheets/detail/cardiovascular-diseases-(cvds) (accessed on 31 July 2026).
  2. Chang, V.; Bhavani, V.R.; Xu, A.Q.; Hossain, M.A. An artificial intelligence model for heart disease detection using machine learning algorithms. Healthc. Anal. 2022, 2, 100016. [Google Scholar] [CrossRef] [Scilit]
  3. Reddy, K.V.V.; Elamvazuthi, I.; Aziz, A.A.; Paramasivam, S.; Chua, H.N.; Pranavanand, S. Heart disease risk prediction using machine learning classifiers with attribute evaluators. Appl. Sci. 2021, 11, 8352. [Google Scholar] [CrossRef] [Scilit]
  4. Sun, P.; Wan, Z.; Liu, Y. Towards Comprehensive Chronic Disease Control: Prevention, Early Detection, and Integrated Management. Med. Bull. 2026, 2, 20–33. [Google Scholar] [CrossRef] [Scilit]
  5. Wang, X.; Xiao, H.; Zhao, Y.; Li, P.; Hu, X.; Qiu, X.; Luo, C.; Luo, J.; Wang, K.; Gu, W.; et al. Toward Omni Healthcare: Wearable Technologies for Noncommunicable Disease Dynamic Monitoring. Med. Bull. 2026, 2, 5–19. [Google Scholar] [CrossRef] [Scilit]
  6. Heydari, M.S.; Kolivand, M.; Al-Azzawi, M.; Kolivand, H. Intelligent augmented reality application for personalised rhinoplasty using machine learning. Intell. Robot. 2025, 5, 355–377. [Google Scholar] [CrossRef] [Scilit]
  7. DeFazio, D.; Mehta, H.; Wang, M.; Yang, P.; Blackburn, J.; Zhang, S. Vision language models can parse floor plan maps. Robot. Learn. 2025, 2, 11. [Google Scholar] [CrossRef] [Scilit]
  8. Baghdadi, N.A.; Farghaly Abdelaliem, S.M.; Malki, A.; Gad, I.; Ewis, A.; Atlam, E. Advanced machine learning techniques for cardiovascular disease early detection and diagnosis. J. Big Data 2023, 10, 144. [Google Scholar] [CrossRef] [Scilit]
  9. Mao, Z.; Suzuki, S.; Nabae, H.; Miyagawa, S.; Suzumori, K.; Maeda, S. Machine learning-enhanced soft robotic system inspired by rectal functions to investigate fecal incontinence. Bio-Des. Manuf. 2025, 8, 482–494. [Google Scholar] [CrossRef] [Scilit]
  10. Peng, Y.; Wang, Y.; Hu, F.; He, M.; Mao, Z.; Huang, X.; Ding, J. Predictive modeling of flexible EHD pumps using Kolmogorov–Arnold Networks. Biomim. Intell. Robot. 2024, 4, 100184. [Google Scholar] [CrossRef] [Scilit]
  11. Zhu, P.; Yu, M.; Wu, M.; Yang, Y. Advanced flexible brain-computer interfaces and devices for the exploration of neural dynamics. Brain-X 2024, 2, e70009. [Google Scholar] [CrossRef] [Scilit]
  12. Peng, Y.; Jiang, Y.; Zuo, Z.; Gu, S.; Wang, Z.; Tian, Z. A rehabilitation design concept based on brain–computer interface and McKibben artificial muscle. Healthc. Rehabil. 2026, 2, 100066. [Google Scholar] [CrossRef] [Scilit]
  13. Peng, Y.; Liu, X.; Chan, K.F.; Song, X.; Zhang, L. Robotic-Assisted Endovascular Embolization: Progress and Future Perspectives. SmartBot 2025, 1, e12009. [Google Scholar] [CrossRef] [Scilit]
  14. Ke, X.; Li, S.; Zhang, T.; Zhong, Y.; Li, S.; Zhang, S.; Chai, Z.; Pu, M.; Zong, Z.; Yong, H.; et al. Small-scale magnetic soft robots for medical applications: From laboratory to clinical use. SmartBot 2026, e70042. [Google Scholar] [CrossRef] [Scilit]
  15. Shang, C.; Huang, M.; Yu, S. bDWPLO-FKNN: A Novel Machine Learning Model for Predicting COVID-19 Severity Using Differential Weibull Polar Lights Optimizer. J. Bionic Eng. 2025, 22, 3188–3208. [Google Scholar] [CrossRef] [Scilit]
  16. Khan, S.U.R.; Khan, Z. Detection of Abnormal Cardiac Rhythms Using Feature Fusion Technique with Heart Sound Spectrograms. J. Bionic Eng. 2025, 22, 2030–2049. [Google Scholar] [CrossRef] [Scilit]
  17. Kumar, S.; Thakur, B. Heart disease prediction using a stacked ensemble learning approach. SN Comput. Sci. 2024, 6, 3. [Google Scholar] [CrossRef] [Scilit]
  18. Olawade, D.B.; Soladoye, A.A.; Omodunbi, B.A.; Aderinto, N.; Adeyanju, I.A. Comparative analysis of machine learning models for coronary artery disease prediction with optimized feature selection. Int. J. Cardiol. 2025, 436, 133443. [Google Scholar] [CrossRef] [Scilit] [PubMed]
  19. Hossain, M.I.; Maruf, M.H.; Khan, M.A.R.; Prity, F.S.; Fatema, S.; Ejaz, M.S.; Khan, M.A.S. Heart disease prediction using distinct artificial intelligence techniques: Performance analysis and comparison. Iran J. Comput. Sci. 2023, 6, 397–417. [Google Scholar] [CrossRef] [Scilit]
  20. Mohan, S.; Thirumalai, C.; Srivastava, G. Effective heart disease prediction using hybrid machine learning techniques. IEEE Access 2019, 7, 81542–81554. [Google Scholar] [CrossRef] [Scilit]
  21. Javid, I.; Alsaedi, A.K.Z.; Ghazali, R. Enhanced accuracy of heart disease prediction using machine learning and recurrent neural networks ensemble majority voting method. Int. J. Adv. Comput. Sci. Appl. 2020, 11, 540–551. [Google Scholar] [CrossRef] [Scilit]
  22. Lamir, A.A.; Razzagzadeh, S.; Rezaei, Z. A Comprehensive Machine Learning Framework for Heart Disease Prediction: Performance Evaluation and Future Perspectives. arXiv 2025, arXiv:2505.09969. [Google Scholar]
  23. Venkatesh, R.; Anantharajan, S.; Gunasekaran, S. Multi-gradient boosted adaptive SVM-based prediction of heart disease. Int. J. Comput. Commun. Control 2023, 18, 4994. [Google Scholar] [CrossRef] [Scilit]
  24. Dubey, A.K.; Choudhary, K.; Sharma, R. Predicting Heart Disease Based on Influential Features with Machine Learning. Intell. Autom. Soft Comput. 2021, 30, 929–943. [Google Scholar] [CrossRef] [Scilit]
  25. Teja, M.D.; Rayalu, G.M. Optimizing heart disease diagnosis with advanced machine learning models: A comparison of predictive performance. BMC Cardiovasc. Disord. 2025, 25, 212. [Google Scholar] [CrossRef] [Scilit] [PubMed]
  26. Datta, C.; Senapati, R. An improved cardiovascular disease prediction model using ensembling of diverse machine learning classifiers. In Proceedings of the 2023 OITS International Conference on Information Technology (OCIT); IEEE: New York, NY, USA, 2023; pp. 329–333. [Google Scholar]
  27. Khan, H.; Javaid, N.; Bashir, T.; Akbar, M.; Alrajeh, N.; Aslam, S. Heart disease prediction using novel ensemble and blending based cardiovascular disease detection networks: EnsCVDD-Net and BlCVDD-Net. IEEE Access 2024, 12, 109230–109254. [Google Scholar] [CrossRef] [Scilit]
  28. Wu, Y.; Xia, Z.; Feng, Z.; Huang, M.; Liu, H.; Zhang, Y. Forecasting heart disease risk with a stacking-based ensemble machine learning method. Electronics 2024, 13, 3996. [Google Scholar] [CrossRef] [Scilit]
  29. Maach, A.; Elalami, J.; Elalami, N.; Mazoudi, E.H.E. An intelligent decision support ensemble voting model for coronary artery disease prediction in smart healthcare monitoring environments. arXiv 2022, arXiv:2210.14906. [Google Scholar]
  30. Lau, S.L.H.; Lim, J.; Chong, E.K.P.; Wang, X. Single-pixel image reconstruction based on block compressive sensing and convolutional neural network. Int. J. Hydromechatron. 2023, 6, 258–273. [Google Scholar] [CrossRef] [Scilit]
  31. Hudson, M.; Chaudhary, N.I.; Johnson, M.I. Eye movements and emotional memory images (EMIs): Unravelling the path to adult health from childhood adversity. Healthc. Rehabil. 2025, 1, 100037. [Google Scholar] [CrossRef] [Scilit]
  32. Cong, S.; Wang, H.; Zhou, Y.; Wang, Z.; Yao, X.; Yang, C. Comprehensive review of Transformer-based models in neuroscience, neurology, and psychiatry. Brain-X 2024, 2, e57. [Google Scholar] [CrossRef] [Scilit]
  33. Almulihi, A.; Saleh, H.; Hussien, A.M.; Mostafa, S.; El-Sappagh, S.; Alnowaiser, K.; Ali, A.M.A.; Refaat Hassan, M. Ensemble learning based on hybrid deep learning model for heart disease early prediction. Diagnostics 2022, 12, 3215. [Google Scholar] [CrossRef] [Scilit] [PubMed]
  34. Alghamdi, N.S.; Zakariah, M.; Shankar, A.; Viriyasitavat, W. Heart disease prediction using autoencoder and DenseNet architecture. Egypt. Inform. J. 2024, 28, 100559. [Google Scholar] [CrossRef] [Scilit]
  35. García-Ordás, M.T.; Bayón-Gutiérrez, M.; Benavides, C.; Aveleira-Mata, J.; Benítez-Andrades, J.A. Heart disease risk prediction using deep learning techniques with feature augmentation. Multimed. Tools Appl. 2023, 82, 31759–31773. [Google Scholar] [CrossRef] [Scilit]
  36. Arooj, S.; Rehman, S.U.; Imran, A.; Almuhaimeed, A.; Alzahrani, A.K.; Alzahrani, A.D. A deep convolutional neural network for the early detection of heart disease. Biomedicines 2022, 10, 2796. [Google Scholar] [CrossRef] [Scilit] [PubMed]
  37. Cao, K.; Liu, C.; Yang, S.; Zhang, Y.; Li, L.; Jung, H.; Zhang, S. Prediction of cardiovascular disease based on multiple feature selection and improved PSO–XGBoost model. Sci. Rep. 2025, 15, 12406. [Google Scholar] [CrossRef] [Scilit] [PubMed]
  38. Hong, S.; Xiao, L.; Zhang, X.; Chen, J. ArgMed-Agents: Explainable clinical decision reasoning with LLM discusion via argumentation schemes. arXiv 2024, arXiv:2403.06294. [Google Scholar]
  39. Žlahtič, B.; Završnik, J.; Blažun Vošner, H.; Kokol, P.; Šuran, D.; Završnik, T. Agile machine learning model development using Data Canyons in medicine: A step towards explainable artificial intelligence and flexible expert-based model improvement. Appl. Sci. 2023, 13, 8329. [Google Scholar] [CrossRef] [Scilit]
  40. Ghasemi, M.; Zare, M.; Trojovský, P.; Rao, R.V.; Trojovská, E.; Kandasamy, V. Optimization based on the smart behavior of plants with its engineering applications: Ivy algorithm. Knowl.-Based Syst. 2024, 295, 111850. [Google Scholar] [CrossRef] [Scilit]
  41. Miao, K.H.; Miao, J.H. Coronary heart disease diagnosis using deep neural networks. Int. J. Adv. Comput. Sci. Appl. 2018, 9, 1–8. [Google Scholar] [CrossRef] [Scilit]
  42. Osei-Nkwantabisa, A.S.; Ntumy, R. Classification and Prediction of Heart Diseases using Machine Learning Algorithms. arXiv 2024, arXiv:2409.03697. [Google Scholar]
  43. Majumder, A.B.; Gupta, S.; Singh, D.; Acharya, B.; Gerogiannis, V.C.; Kanavos, A.; Pintelas, P. Heart disease prediction using concatenated hybrid ensemble classifiers. Algorithms 2023, 16, 538. [Google Scholar] [CrossRef] [Scilit]
  44. Akella, A.; Akella, S. Machine learning algorithms for predicting coronary artery disease: Efforts toward an open source solution. Future Sci. OA 2021, 7, FSO698. [Google Scholar] [CrossRef] [Scilit] [PubMed]
  45. Hossain, M.M.; Ali, M.S.; Ahmed, M.M.; Rakib, M.R.H.; Kona, M.A.; Afrin, S.; Islam, M.K.; Ahsan, M.M.; Raj, S.M.R.H.; Rahman, M.H. Cardiovascular disease identification using a hybrid CNN–LSTM model with explainable AI. Inform. Med. Unlocked 2023, 42, 101370. [Google Scholar] [CrossRef] [Scilit]
  46. Niu, S.; Zhou, Y.; Li, Z.; Huang, S.; Zhou, Y. An improved grey wolf optimization algorithm for heart disease prediction. In Advanced Intelligent Technologies and Sustainable Society; Springer: Singapore, 2024; pp. 527–542. [Google Scholar]
Figure 1. Distribution of categorical attributes in the heart disease datasets (Cleveland and Statlog).
Algorithms 19 00788 g001
Figure 2. Histograms with Kernel Density Estimate (KDE) curves for continuous variables in the heart disease datasets (Cleveland and Statlog).
Algorithms 19 00788 g002
Figure 3. The i-th member of the ivy population I i chooses its closest and most vital neighbor I i i .
Algorithms 19 00788 g003
Figure 4. Workflow of the proposed IVYA-based two-stage hyperparameter optimization framework for machine learning models.
Algorithms 19 00788 g004
Figure 5. Overall experimental framework for heart disease prediction using IVYA-optimized machine learning models.
Algorithms 19 00788 g005
Figure 6. ROC curves of IVYA-optimized models on the Cleveland heart disease dataset: (a) RF; (b) LightGBM; (c) SVM; (d) ID3; (e) XGBoost; and (f) mean ROC curves of the five models.
Algorithms 19 00788 g006
Figure 7. ROC curves of IVYA-optimized models on the Statlog heart disease dataset: (a) RF; (b) LightGBM; (c) SVM; (d) ID3; (e) XGBoost; and (f) mean ROC curves of the five models.
Algorithms 19 00788 g007
Figure 8. Performance evaluation results of IVYA-optimized models: (a) Cleveland dataset; (b) Statlog dataset.
Algorithms 19 00788 g008
Figure 9. Confusion matrices of IVYA-optimized models on the Cleveland heart disease dataset: (a) RF; (b) LightGBM; (c) SVM; (d) ID3; (e) XGBoost.
Algorithms 19 00788 g009
Figure 10. Confusion matrices of IVYA-optimized models on the Statlog heart disease dataset: (a) RF; (b) LightGBM; (c) SVM; (d) ID3; (e) XGBoost.
Algorithms 19 00788 g010
Figure 11. Comparative performance of models before and after IVYA optimization.
Algorithms 19 00788 g011
Figure 12. IVYA-LightGBM Hyperparameter Optimization Curve on the Cleveland Dataset.
Algorithms 19 00788 g012
Figure 13. SHAP integrated interpretability results of the IVYA-LightGBM model: (a) Cleveland dataset; (b) Statlog dataset.
Algorithms 19 00788 g013
Table 1. Feature Overview of the Cleveland and Statlog Heart Disease Datasets.
No.DatasetsFeatureDescriptionRange
1C/SAgeAge (years)29–77
2C/SSexGender type0: Female
1: Male
3C/SChestPainTypeTypes of chest pain0: Typical
1: Atypical
2: Non-anginal
3: Asymptomatic
4C/SMaxHRMax heart rate71–202
5C/SFastingBSFasting blood sugar > 120 mg/dL0: False
1: True
6C/SOldpeakST depression0–6.2
7C/SRestingBPBlood pressure (resting) (mmHg)94–200
8C/SST_SlopeThe slope of the peak exercise ST segment0: Upsloping
1: Flat
2: Downsloping
9C/SExercise AnginaExercise-induced angina0: No
1: Yes
10C/SCholesterolSerum cholesterol (mg/dL)126–564
11C/SRestingECGResting ECG results0: Normal
1: ST–T abnormality
2: Left ventricular
2: hypertrophy
12C/SCaNumber of vessels0–3
13C/SThalThallium stress test0: Normal
1: Fixed defect
2: Reversible defect
14C/SHeartDiseaseTarget variable0: No Heart disease
1: Heart disease
Note: C = Cleveland dataset; S = Statlog dataset.
Table 2. Comparative training performance results of five IVYA-optimized machine learning models.
DatasetsIVYA-
Models
Recall (%)Precision (%)Accuracy (%)F1 Score (%)AUC (%)
ClevelandRF 91.9 ± 5.32 89.5 ± 5.43 91.4 ± 3.18 90.7 ± 3.74 96.7 ± 3.08
ID3 82.3 ± 6.71 82.1 ± 6.32 83.7 ± 4.12 82.2 ± 4.35 92.3 ± 4.02
XGBoost 86.4 ± 6.12 93.4 ± 6.75 90.9 ± 3.58 89.8 ± 4.66 95.5 ± 3.15
SVM 92.7 ± 4.36 87.2 ± 4.73 90.4 ± 3.15 89.9 ± 3.36 94.8 ± 4.29
LightGBM 91.9 ± 4.37 95.8 ± 5.42 94.4 ± 3.59 93.8 ± 4.63 97.3 ± 2.56
StatlogRF 94.3 ± 6.38 92.6 ± 4.76 93.9 ± 5.12 93.4 ± 3.25 95.8 ± 3.29
ID3 91.1 ± 5.76 84.8 ± 6.17 88.4 ± 5.68 87.8 ± 6.63 93.2 ± 4.61
XGBoost 84.8 ± 5.47 89.3 ± 3.42 88.4 ± 4.78 87.0 ± 5.21 96.1 ± 3.18
SVM 92.4 ± 5.27 85.2 ± 3.56 88.9 ± 4.13 88.6 ± 5.07 94.5 ± 5.16
LightGBM 89.5 ± 4.34 94.0 ± 4.16 92.6 ± 3.13 91.7 ± 3.26 95.3 ± 3.75
Note: Training results are reported as mean ± standard deviation across the 10 training folds.
Table 3. Comparative testing performance of five IVYA-optimized machine learning models under 10-fold cross-validation.
DatasetsIVYA-
Models
Recall (%)Precision (%)Accuracy (%)F1 Score (%)AUC (%)
ClevelandRF 87.8 ± 7.61 88.3 ± 7.63 88.8 ± 5.03 87.7 ± 5.56 93.9 ± 4.11
ID3 84.9 ± 8.25 80.7 ± 7.18 83.1 ± 3.73 82.3 ± 4.45 88.8 ± 5.72
XGBoost 80.6 ± 8.34 88.3 ± 7.99 85.8 ± 5.49 83.8 ± 5.81 92.5 ± 4.54
SVM 90.0 ± 5.27 84.2 ± 6.85 86.8 ± 4.06 86.4 ± 4.29 90.6 ± 6.49
LightGBM 88.5 ± 6.82 92.9 ± 7.67 91.4 ± 5.39 90.4 ± 6.12 95.3 ± 2.78
StatlogRF 90.0 ± 10.24 90.9 ± 5.44 91.5 ± 5.58 90.1 ± 6.69 90.7 ± 6.52
ID3 89.2 ± 8.91 77.3 ± 8.04 82.2 ± 7.46 82.1 ± 8.29 88.5 ± 6.84
XGBoost 82.5 ± 9.66 83.3 ± 5.38 84.1 ± 6.94 82.3 ± 7.30 92.9 ± 4.97
SVM 87.5 ± 8.96 82.0 ± 4.78 85.9 ± 5.82 84.5 ± 6.56 89.2 ± 7.75
LightGBM 84.2 ± 5.83 93.2 ± 6.42 90.0 ± 3.58 88.2 ± 4.14 93.7 ± 4.96
Note: Testing results are reported as mean ± standard deviation across the 10 held-out folds.
Table 4. Performance comparison of models before and after IVYA optimization averaged across the Cleveland and Statlog datasets.
IVYA
Usage
ModelsRecall (%)Precision (%)Accuracy (%)F1 Score (%)AUC (%)
YesRF 88.9 ± 9.09 89.6 ± 6.75 90.1 ± 5.48 88.9 ± 6.27 92.3 ± 5.68
ID3 87.0 ± 8.85 79.0 ± 7.81 82.7 ± 5.91 82.2 ± 6.65 88.7 ± 6.31
XGBoost 81.6 ± 9.07 85.8 ± 7.26 84.9 ± 6.31 83.1 ± 6.64 92.7 ± 4.76
SVM 88.7 ± 7.46 83.1 ± 6.01 86.3 ± 5.04 85.5 ± 5.62 89.9 ± 7.18
LightGBM 86.4 ± 6.70 93.1 ± 7.07 90.7 ± 4.63 89.3 ± 5.34 94.5 ± 4.10
NoRF 77.2 ± 9.94 83.9 ± 10.87 82.5 ± 7.06 79.9 ± 8.16 90.2 ± 6.14
ID3 71.3 ± 10.83 75.7 ± 9.86 75.1 ± 7.81 72.5 ± 8.58 76.9 ± 7.15
XGBoost 76.0 ± 11.64 84.2 ± 10.83 80.4 ± 6.97 81.0 ± 8.73 89.5 ± 6.32
SVM 76.3 ± 10.65 84.9 ± 9.58 82.5 ± 6.84 79.9 ± 8.28 89.5 ± 6.27
LightGBM 77.5 ± 10.47 82.9 ± 11.64 83.4 ± 7.38 80.1 ± 8.39 90.5 ± 5.39
Note: Overall results were calculated from the 20 held-out fold-specific results obtained across the Cleveland and Statlog datasets (10 folds per dataset) and are reported as mean ± standard deviation.
Table 5. Statistical comparison of ROC–AUC between the baseline and IVYA-optimized models on the Cleveland and Statlog datasets using paired Wilcoxon signed-rank tests on fold-wise values ( n = 10 ).
DatasetModelROC–AUC (Baseline)ROC–AUC (IVYA)Δ ROC–AUC p -Value
ClevelandRF 0.9149 ± 0.0444 0.9393 ± 0.0411 + 0.0244 0.0447 *
ID3 0.7704 ± 0.0461 0.8883 ± 0.0572 + 0.1179 0.0020 *
XGBoost 0.9079 ± 0.0415 0.9250 ± 0.0454 + 0.0171 0.0342 *
SVM 0.9009 ± 0.0553 0.9056 ± 0.0649 + 0.0047 0.0039 *
LightGBM 0.9049 ± 0.0445 0.9532 ± 0.0278 + 0.0483 0.0039 *
StatlogRF 0.8891 ± 0.0723 0.9072 ± 0.0652 + 0.0181 0.0273 *
ID3 0.7676 ± 0.0899 0.8850 ± 0.0684 + 0.1174 0.0039 *
XGBoost 0.8821 ± 0.0770 0.9286 ± 0.0497 + 0.0465 0.0098 *
SVM 0.8891 ± 0.0689 0.8917 ± 0.0775 + 0.0026 0.0566
LightGBM 0.9051 ± 0.0619 0.9372 ± 0.0496 + 0.0321 0.0117 *
Note: Results are reported as the mean ± standard deviation across the ten paired outer test folds. Δ ROC–AUC denotes the mean ROC–AUC of the IVYA-optimized model minus that of the corresponding baseline model. Two-sided paired Wilcoxon signed-rank tests were performed using fold-wise results obtained from identical stratified 10-fold cross-validation partitions. * indicates statistical significance at p < 0.05 .
Table 6. Performance comparison of different IVYA hyperparameter optimization strategies averaged across the Cleveland and Statlog datasets.
Optimization
Strategy
  AUC (%)  Accuracy (%)  Precision (%)  Recall (%)  F1 Score (%)Runtime
(min)
IVYA-Full 93.7 ± 4.72 90.4 ± 6.55 90.6 ± 8.68 85.5 ± 8.36 88.0 ± 7.04 4.19
IVYA-Two-stage 94.5 ± 4.10 90.7 ± 4.63 93.1 ± 7.07 86.4 ± 6.70 89.3 ± 5.34 3.23
Note: Results are reported as mean ± standard deviation. IVYA-Full denotes the direct joint optimization of all hyperparameters, whereas IVYA-Two-stage denotes the proposed staged optimization strategy.
Table 7. Search spaces and IVYA-optimized ranges of LightGBM hyperparameters across the Cleveland and Statlog datasets.
HyperparameterSearch SpaceIVYA-Optimized Range
learning_rate [ 0.01 , 0.20 ] 0.0262 0.0650
num_leaves [ 7 , 63 ] 12–32
max_depth [ 3 , 10 ] 4–6
min_data_in_leaf [ 5 , 80 ] 16–48
feature_fraction [ 0.50 , 1.00 ] 0.6807 0.8748
bagging_fraction [ 0.50 , 1.00 ] 0.6876 0.8500
lambda_l1 [ 0 , 8 ] 0– 2.0922
lambda_l2 [ 0 , 12 ] 0– 5.3117
min_gain_to_split [ 0 , 5 ] 0– 2.7228
Note: The optimized values are reported as the minimum–maximum ranges of the fold-specific optimal hyperparameters obtained independently by IVYA across the 20 fold-specific results from the Cleveland and Statlog datasets, with 10 folds from each dataset. The learning rate was optimized in logarithmic space and is presented on its original scale.
Table 8. Performance comparison of LightGBM with different optimization algorithms.
Optimization
Algorithm
 AUC (%)Accuracy (%)Precision (%)Recall (%)F1 Score (%)Runtime (min)
GWO 93.7 ± 4.20 90.0 ± 3.92 92.0 ± 6.73 82.5 ± 8.54 87.8 ± 5.15 6.21
PSO 93.5 ± 5.13 90.7 ± 4.70 94.0 ± 8.86 85.8 ± 6.86 89.2 ± 4.96 4.74
WOA 92.2 ± 5.13 90.4 ± 4.35 94.8 ± 5.82 83.3 ± 7.87 88.3 ± 5.75 5.75
GA 92.9 ± 4.29 89.6 ± 5.47 91.1 ± 8.58 85.8 ± 8.83 88.0 ± 6.29 5.36
HHO 93.6 ± 5.09 90.0 ± 3.92 92.4 ± 5.84 85.0 ± 8.61 88.2 ± 5.12 6.14
IVYA 94.5 ± 4.10 90.7 ± 4.63 93.1 ± 7.07 86.4 ± 6.70 89.3 ± 5.34 3.23
Table 9. Comparison of the proposed method with related heart disease prediction studies.
ResearcherDatasetModelRecallAccuracyPrecisionF1 ScoreAUC
Miao et al. [41]ClevelandDNN0.9350.8360.7910.8570.892
Osei-Nkwantabisa et al. [42]MergedANN0.7400.7400.7800.760
Majumder et al. [43]ClevelandHybrid ensemble0.8710.8690.8180.843
Akella et al. [44]ClevelandGLM0.8000.8760.8200.8790.883
Hossain et al. [45]Kaggle CVDHybrid CNN–LSTM0.7200.7420.8180.7660.740
Cao et al. [37]CardiovascularMFS-DLPSO-XGBoost0.7140.7470.7630.7360.808
Niu et al. [46]ClevelandACGWO-BP0.8800.8680.8540.8700.863
Proposed MethodCleveland + StatlogIVYA-LightGBM0.8640.9070.9310.8930.945
Note: “Merged” denotes the combined heart disease dataset comprising the Cleveland, Hungarian, Switzerland, Long Beach VA, and Statlog datasets. The results reported in the related studies were obtained using different datasets, preprocessing procedures, sampling strategies, and validation protocols. Therefore, the comparison provides methodological and performance context rather than a strictly controlled head-to-head evaluation.
Disclaimer/Publisher’s Note: The statements, opinions and data contained in all publications are solely those of the individual author(s) and contributor(s) and not of MDPI and/or the editor(s). MDPI and/or the editor(s) disclaim responsibility for any injury to people or property resulting from any ideas, methods, instructions or products referred to in the content.