Article

A Hybrid BWM-VIKOR and Super-Efficiency SBM Framework for Benchmarking Green Export Performance: Empirical Evidence from the Vietnamese Textile Industry Under ESG Complexity

by
Nhut Thi Minh Vo
* and
Van Thanh Tien Nguyen
*
Industrial University of Ho Chi Minh City, No. 12 Nguyen Van Bao, Hanh Thong Ward, Ho Chi Minh City 70000, Vietnam
*
Authors to whom correspondence should be addressed.
Algorithms 2026, 19(9), 726; https://doi.org/10.3390/a19090726
Submission received: 2 August 2026 / Revised: 21 August 2026 / Accepted: 23 August 2026 / Published: 27 August 2026

Abstract

The Vietnamese textile and garment industry faces a critical sustainability paradox under the impending Carbon Border Adjustment Mechanism (CBAM). Firms are pressured to maintain high-volume export growth while aggressively minimizing carbon and resource intensity. To empirically resolve this tension, this study develops a novel three-phase benchmarking framework that integrates the Best–Worst Method (BWM), VIKOR, and Super-Efficiency Slacks-Based Measure (Super-SBM) under Variable Returns to Scale. Applied to 12 listed enterprises using 2024 fiscal data, the methodology first identifies Energy Intensity as the paramount strategic priority via the BWM. Next, VIKOR mathematically compresses six heterogeneous environmental, social, and governance (ESG) criteria into a single composite index, thereby eliminating standard Data Envelopment Analysis dimensionality constraints. The Phase 3 Super-SBM results reveal profound sector heterogeneity. The macro-scale giant VGT defines the absolute efficiency frontier with an unprecedented score of 18.6729 and zero operational slack. However, the λ reference matrix identifies mid-cap operators such as Tien Son Thanh Hoa and Binh Duong Garment as highly replicable, agile benchmarks for the broader industry. Crucially, the non-radial projection analysis uncovers hidden structural vulnerabilities. The data show that while certain firms possess massive operational buffers, others operate on the absolute edge of the efficiency frontier, leaving them dangerously exposed to impending carbon-taxation shocks. Furthermore, the model identifies critical instances of ESG decoupling in which green investments fail to yield proportional increases in export revenues. These findings suggest that addressing the sustainability paradox requires targeted structural interventions informed by diagnostic benchmarking. Policymakers and corporate executives must integrate open innovation frameworks and systematic problem-solving methodologies to structurally decouple economic output from fossil-fuel energy dependence and outdated labor-arbitrage models.

1. Introduction

1.1. Research Background and Research Motivation

The global textile and garment landscape is undergoing a fundamental structural metamorphosis, shifting from a conventional, volume-centric production paradigm to a sophisticated ecosystem grounded in sustainability and ethical transparency. As the world’s third-largest apparel exporter, Vietnam has historically demonstrated remarkable economic dynamism, sustaining a Compound Annual Growth Rate (CAGR) of approximately 9.8% over the preceding decade [1,2]. However, this quantitative success now faces a qualitative reckoning. The traditional competitive advantage rooted in labor arbitrage is rapidly eroding, superseded by a rigorous global marketplace in which green export competencies are the primary determinant of market permeability and long-term institutional viability. This systemic shift is catalyzed by a wave of stringent “green barriers,” most notably the European Union’s Carbon Border Adjustment Mechanism (CBAM) and the Circular Economy Action Plan. These regulatory frameworks have effectively recalibrated the right to join high-value Western markets, mandating that Vietnamese exporters move beyond superficial compliance toward radical environmental accountability. Specifically, the CBAM framework imposes strict carbon accounting boundaries on exporters. It requires meticulous tracking of greenhouse gas emissions under both Scope 1 (direct emissions from owned or controlled sources, such as on-site fuel combustion) and Scope 2 (indirect emissions from the generation of purchased electricity). Furthermore, the import carbon tariff pricing rules are directly pegged to the weekly auction prices of the EU Emissions Trading System (EU ETS) allowances, creating a volatile financial penalty for carbon-intensive manufacturers. Consequently, Environmental, Social, and Governance (ESG) performance has been elevated from a peripheral Corporate Social Responsibility (CSR) endeavor to a core strategic imperative. In this new trade reality, a firm’s ESG rating functions as a critical signaling mechanism for supply chain resilience; for Vietnamese textile enterprises, it is no longer a reputational luxury but a fundamental prerequisite for maintaining integration within the global value chain. Despite the urgency of this transition, pursuing green export excellence is complicated by the inherent resource intensity of the textile manufacturing process, characterized by significant carbon footprints, substantial energy consumption, and complex labor management requirements. While corporate disclosures increasingly claim “sustainability,” a profound gap exists in empirical methodologies capable of objectively quantifying the conversion of multi-dimensional ESG inputs into tangible operational efficiency. The conventional literature often bifurcates environmental metrics from financial performance, failing to capture the synergistic interplay among governance integrity, social welfare, and resource optimization. Moreover, standard benchmarking tools such as Data Envelopment Analysis (DEA) often succumb to the “curse of dimensionality” when integrating a comprehensive suite of ESG variables, particularly within the constrained sample sizes of listed companies in emerging markets. While a growing body of literature combines Multi-Criteria Decision-Making (MCDM) with DEA for sustainability assessment, conventional hybrid approaches frequently fail when applied to small sample sizes under multi-indicator mandates. Incorporating six distinct ESG indicators directly into a multi-output DEA model would severely violate dimensionality constraints, rendering almost all evaluated firms artificially efficient. To overcome this limitation, our framework introduces a dedicated complexity-compression pipeline. It sequentially utilizes expert cognitive priorities (BWM) and compromise aggregation (VIKOR) to synthesize heterogeneous metrics into a single, bounded desirable output before executing a non-radial Super-SBM. This methodological advancement preserves necessary degrees of freedom while rigorously maintaining non-linear trade-offs across environmental, social, and governance pillars. To address these methodological and strategic lacunae, this research introduces an integrated hybrid framework that synthesizes the Best–Worst Method (BWM), VIKOR, and the Super-Efficiency Slacks-Based Measure (Super-SBM). By leveraging the BWM to distill expert cognitive priorities and VIKOR to aggregate heterogeneous ESG metrics into a normalized ESG Index (O2), the study effectively manages the complexity of multi-criteria evaluation while preserving model discrimination. This synthesized index is subsequently utilized as a desirable output within a Super-SBM model under Variable Returns to Scale (VRS) to benchmark 12 representative listed firms, including the industry titan Vietnam National Textile & Garment Group (DMU 1). By treating Energy Cost as a primary input, this study provides a definitive ranking of green export efficiency, offering a robust analytical instrument for managers to navigate the “sustainability paradox” and for policymakers to architect a resilient, low-carbon industrial strategy in the post-pandemic era.

1.2. Research Objectives

The primary ambition of this research is to architect a scientifically rigorous benchmarking framework that captures the multidimensional nature of sustainability in the textile sector. Specifically, this study is driven by the following four interconnected objectives:
(i)
To develop an integrated hybrid MCDM-DEA framework: This involves synthesizing the Best–Worst Method (BWM) and VIKOR to manage the “complexity” of ESG metrics, effectively compressing heterogeneous criteria into a single, robust ESG Index (O2).
(ii)
To quantify the “Pure Technical Efficiency” of green exports: By utilizing the Super-Efficiency Slacks-Based Measure (Super-SBM) under Variable Returns to Scale (VRS), the study aims to measure how effectively 12 listed Vietnamese textile firms utilize assets, labor, and Energy Cost to generate economic and sustainable outputs.
(iii)
To perform a comparative benchmarking analysis of industry leaders: This objective focuses on identifying and ranking the efficiency frontier, with particular emphasis on how industry giants like the Vietnam National Textile & Garment Group (DMU 1) and green pioneers such as TCM and STK synchronize operational scale with ESG mandates.
(iv)
To provide strategic prescriptions for Complexity Management: The research seeks to offer actionable insights and policy recommendations that help firms resolve the “sustainability paradox,” enabling them to maintain their CAGR growth while adapting to international “green barriers” like the EU’s CBAM.

2. Literature Review

2.1. The Strategic Impact of ESG on Industrial Performance

The global textile and garment landscape is undergoing a decisive structural shift, pivoting from a conventional, volume-centric production model toward an ecosystem predicated on sustainability and ethical transparency. Historically, Vietnam has leveraged its competitive labor advantages to maintain a robust growth trajectory, sustaining a Compound Annual Growth Rate (CAGR) of approximately 9.8% over the preceding decade. However, this quantitative success is increasingly challenged by the emergence of stringent “Green Barriers,” most notably the European Union’s Carbon Border Adjustment Mechanism (CBAM). As identified by Ong et al., the impending full implementation of CBAM in 2026 necessitates rigorous carbon reporting, making ESG compliance a fundamental prerequisite for maintaining export competitiveness in high-value markets [3].
Empirical evidence suggests that ESG integration transcends mere regulatory compliance, acting as a profound driver of business performance and corporate resilience. In the specific context of the Vietnamese textile sector, Do Thi et al. underscore that ESG practices significantly enhance customer loyalty, corporate reputation, and internal culture, collectively bolstering overall business outcomes [4]. This reputational advantage is further corroborated by Yu et al., who found that multidimensional ESG management directly influences consumer purchasing intentions by elevating brand prestige. Beyond general branding, adopting specific circular-economy behaviors, such as sustainable dyeing practices, contributes significantly to both environmental mitigation and product-level sustainability [5].
The mechanism by which ESG affects firm performance is increasingly recognized as mediated by Green Innovation (GI) and robust governance structures. Shao et al. identified a significant positive relationship between ESG performance and market value, noting that green innovation serves as a vital bridge in this value-creation process [6]. This link is particularly critical for “specialized, refined, unique, and innovative” enterprises, where ESG performance optimizes talent structures and mitigates managerial myopia, thereby fostering sustained innovation. Furthermore, Zhu et al. (2025) emphasize that tech-infused governance, characterized by gender diversity and board independence, is essential for supporting ecological responsibilities and improving sustainable outcomes in the digital age [7]. This technological integration is increasingly critical for resource optimization. Foundational studies demonstrate that deploying advanced analytical models, such as active learning-based machine learning approaches, significantly enhances environmental sustainability by optimizing energy consumption in green infrastructure. Integrating machine and deep learning technologies provides a critical theoretical foundation for enhancing energy efficiency, a principle directly applicable to mitigating the high energy intensity of the textile manufacturing process [8].
The financial materiality of ESG disclosure is also reflected in its impact on a firm’s risk profile and access to capital. Feng and Wu demonstrated that firms with higher levels of ESG disclosure incur lower debt costs and higher credit ratings, thereby enhancing financial flexibility [9]. Moreover, Mahanta et al. revealed a non-linear, U-shaped relationship between ESG scores and corporate efficiency, suggesting that while initial investments may be intensive, long-term disclosure correlates with superior financial outcomes [10]. Conversely, firms engaged in real earnings management (REM) often exhibit lower innovation outputs and diminished ESG performance, indicating that financial integrity and sustainability are inextricably linked. Despite these clear benefits, the textile industry faces significant challenges with transparency and standardization in ESG reporting. Schwoy et al. reveal that many companies engage in selective reporting, often omitting significant controversies that do not attract media attention, thereby undermining the credibility of sustainability claims [11]. This “ESG decoupling”, where external actions do not align with internal practices, can lead to lower firm valuations and market skepticism. Furthermore, Kara et al. highlight the complexity of ESG evaluations and the necessity for robust, multidimensional methodologies to derive meaningful insights from heterogeneous data [12].
The current literature reveals a significant thematic gap: while the isolated impacts of ESG on reputation, innovation, and value are well-documented, there is a distinct lack of integrated frameworks that can “compress” these multidimensional factors into a precise efficiency-benchmarking model for the Vietnamese textile context. This necessitates a transition toward hybrid methodologies, such as integrating Multi-Criteria Decision-Making (MCDM) and Data Envelopment Analysis (DEA), to resolve the “sustainability paradox” of maintaining growth while optimizing resource intensity.

2.2. Methodological Evolution: From Simple to Hybrid Modeling

The evaluation of industrial efficiency has undergone a significant structural shift, moving from rigid, radial performance metrics to sophisticated hybrid frameworks that navigate the multifaceted, stochastic nature of modern supply chains. Central to this evolution is the refinement of weighting techniques and the aggregation of conflicting criteria, which are essential for resolving the complexity inherent in sustainability assessments. Traditional weighting methods often suffer from inherent biases and the prohibitive volume of pairwise comparisons, leading to inconsistent judgments. To mitigate these limitations, Rezaei introduced the Best–Worst Method (BWM) in 2015, which streamlines the decision-making process by identifying the “best” and “worst” criteria, thereby reducing the effort required for comparison while maintaining a significantly higher consistency ratio than traditional models [13]. This methodological advantage has been further detailed by Mi et al., who emphasize its robustness in diverse operational contexts and its capacity to enhance the reliability of criteria evaluations [14].
Managing the inherent complexity of non-commensurable and conflicting criteria requires aggregation tools that go beyond standard arithmetic averaging. Developed by Opricovic and Tzeng for Multi-Criteria Decision-Making (MCDM) environments, the VIKOR method establishes a compromise ranking solution that simultaneously maximizes group utility and minimizes individual regret [15]. As established by Opricovic, the VIKOR approach is uniquely suited for multi-criteria environments where decision-makers must navigate the tension between conflicting goals to reach a stable consensus [16]. Its effectiveness in resolving complex performance problems has led to widespread adoption in sectors requiring high precision, ranging from renewable energy planning to service quality benchmarking [17]. In parallel with these advancements in multi-criteria weighting and aggregation, the framework for efficiency benchmarking has evolved substantially within the field of Data Envelopment Analysis (DEA). Traditional radial DEA models are frequently criticized for their inability to handle non-radial slacks, which can distort efficiency scores and fail to reflect realistic operational conditions. The Slack-Based Measure (SBM), pioneered by Tone, provides a more nuanced understanding of performance by directly accounting for input and output slacks while offering unit invariance and monotonicity [18,19,20]. Moreover, the development of the Super-SBM model has resolved a critical limitation of traditional DEA: the inability to distinguish and rank multiple efficient Decision-Making Units (DMUs) that all achieve a technical efficiency score of unity. As demonstrated by Shah et al., the super-efficiency model enables a definitive ranking of frontier performers by allowing efficiency scores to exceed 1.0, thereby identifying the true industry leaders [21].
The logical convergence of these techniques lies in hybrid modeling, which integrates the subjective cognitive rigor of MCDM with the objective benchmarking power of non-radial DEA. Integrated approaches, such as combining the BWM and VIKOR for green supplier selection [22], demonstrate the framework’s adaptability to uncertain and fuzzy environments. Although the recent literature has applied these components individually, a significant methodological gap persists in the synthesis of a three-stage BWM-VIKOR-Super-SBM architecture to address the complexity of ESG metrics in the Vietnamese textile sector. This research bridges that gap by offering a serialized framework for complexity management and precision benchmarking in an increasingly environmentally conscious global economy.

2.3. Research Gap and Conceptual Framework

To situate this study within the broader academic discourse, it is necessary to synthesize the conceptual intersections in the current literature. Recent studies on green productivity and export efficiency highlight the increasing structural pressure on manufacturers to comply with multidimensional sustainability mandates. To benchmark this performance, the literature has seen a surge in ESG-DEA integration. Within this domain, conventional approaches frequently employ undesirable outputs in DEA to evaluate environmental pressures; however, such objective models generally fail to incorporate the strategic, subjective weight of external regulatory priorities. Consequently, hybrid MCDM-DEA frameworks have emerged as a superior alternative for embedding expert cognitive priorities in efficiency evaluation. Nevertheless, when these hybrid frameworks are applied to small-sample evaluation contexts, they encounter severe statistical limitations due to the curse of dimensionality. This methodological bottleneck necessitates the adoption of robust dimensionality-reduction strategies in efficiency analysis. It is precisely at this intersection, between the need for multidimensional ESG aggregation (MCDM) and the mathematical parsimony required for small-sample operational research (DEA) that the specific methodological gap of this study is situated.
Despite the expanding body of literature on industrial efficiency, a significant thematic gap remains in the empirical quantification of sustainability-driven performance in the Vietnamese textile sector. Current research, including that by Do Thi et al., has established a clear positive correlation between ESG practices and qualitative outcomes, including customer loyalty and corporate reputation [4]. However, these studies often stop short of integrating these multidimensional factors into a precise operational benchmarking framework. Furthermore, while the impending implementation of the Carbon Border Adjustment Mechanism (CBAM) has been identified by Ong et al. as a critical “Green Barrier” for exporters, there remains a lack of evidence-based models that enable firms to measure their technical efficiency in direct response to these regulatory pressures [3].
Methodologically, a secondary gap is identified in how data complexity is treated. Standard Data Envelopment Analysis (DEA) models frequently suffer from the “curse of dimensionality,” where an increase in the number of variables, particularly those related to environmental and social performance, reduces the model’s discriminatory power. While hybrid models have begun to emerge, such as the integration of the BWM and VIKOR for green supplier selection, as identified by Celik et al., no prior study has successfully compressed the comprehensive six-factor ESG complexity into a Super-SBM model specifically tailored to the Vietnamese textile export context [23]. While existing hybrid MCDM-DEA frameworks have been developed for general sustainability assessment, they do not adequately address the statistical constraints of evaluating a limited number of Decision-Making Units (DMUs) against highly complex ESG mandates. Direct multi-output modeling of these raw indicators would neutralize the efficiency frontier’s discriminatory power. To address this specific methodological gap, the proposed framework serves as a rigorous complexity-compression pipeline. By synthesizing subjective expert priorities via the BWM and objective compromise aggregation via VIKOR, the model translates multidimensional ESG data into a single, highly discriminatory composite output for the Super-SBM stage. This structural innovation firmly preserves the model’s mathematical parsimony while securely embedding the inherent trade-offs among conflicting sustainability dimensions.
To bridge these gaps, this research proposes a three-phase Conceptual Framework designed to manage industrial complexity and provide high-precision benchmarking. The framework operates on the premise that sustainability is not a peripheral constraint but a core desirable output. The logic is structured as follows:
-
Phase 1 (Thematic Alignment): Identifies the 12 listed textile units (DMUs) and validates six critical ESG criteria (C1–C6) that reflect the strategic priorities of the industry under CBAM pressure.
-
Phase 2 (Complexity Compression): Utilizes the Best–Worst Method (BWM) to extract expert weighting and the VIKOR method to synthesize these heterogeneous criteria into a single, normalized ESG Index (O2), thereby resolving the dimensionality issue.
-
Phase 3 (Precision Benchmarking): Integrates the derived ESG Index into the Super-SBM model under Variable Returns to Scale (VRS) to rank the firms and identify specific resource slacks, particularly regarding Energy Cost.
This conceptual approach directly addresses the “sustainability paradox” by providing a roadmap for firms to maintain their historical 9.8% CAGR while transitioning toward a low-carbon, high-transparency export model. By synthesizing the subjective rigor of multi-criteria decision-making with the objective frontier analysis of super-efficiency DEA, this study establishes a new benchmark for sustainable industrial strategy in emerging markets.

3. Methods and Experimental Study

3.1. ESG-Integrated Efficiency Benchmarking, Data and Variable Selection

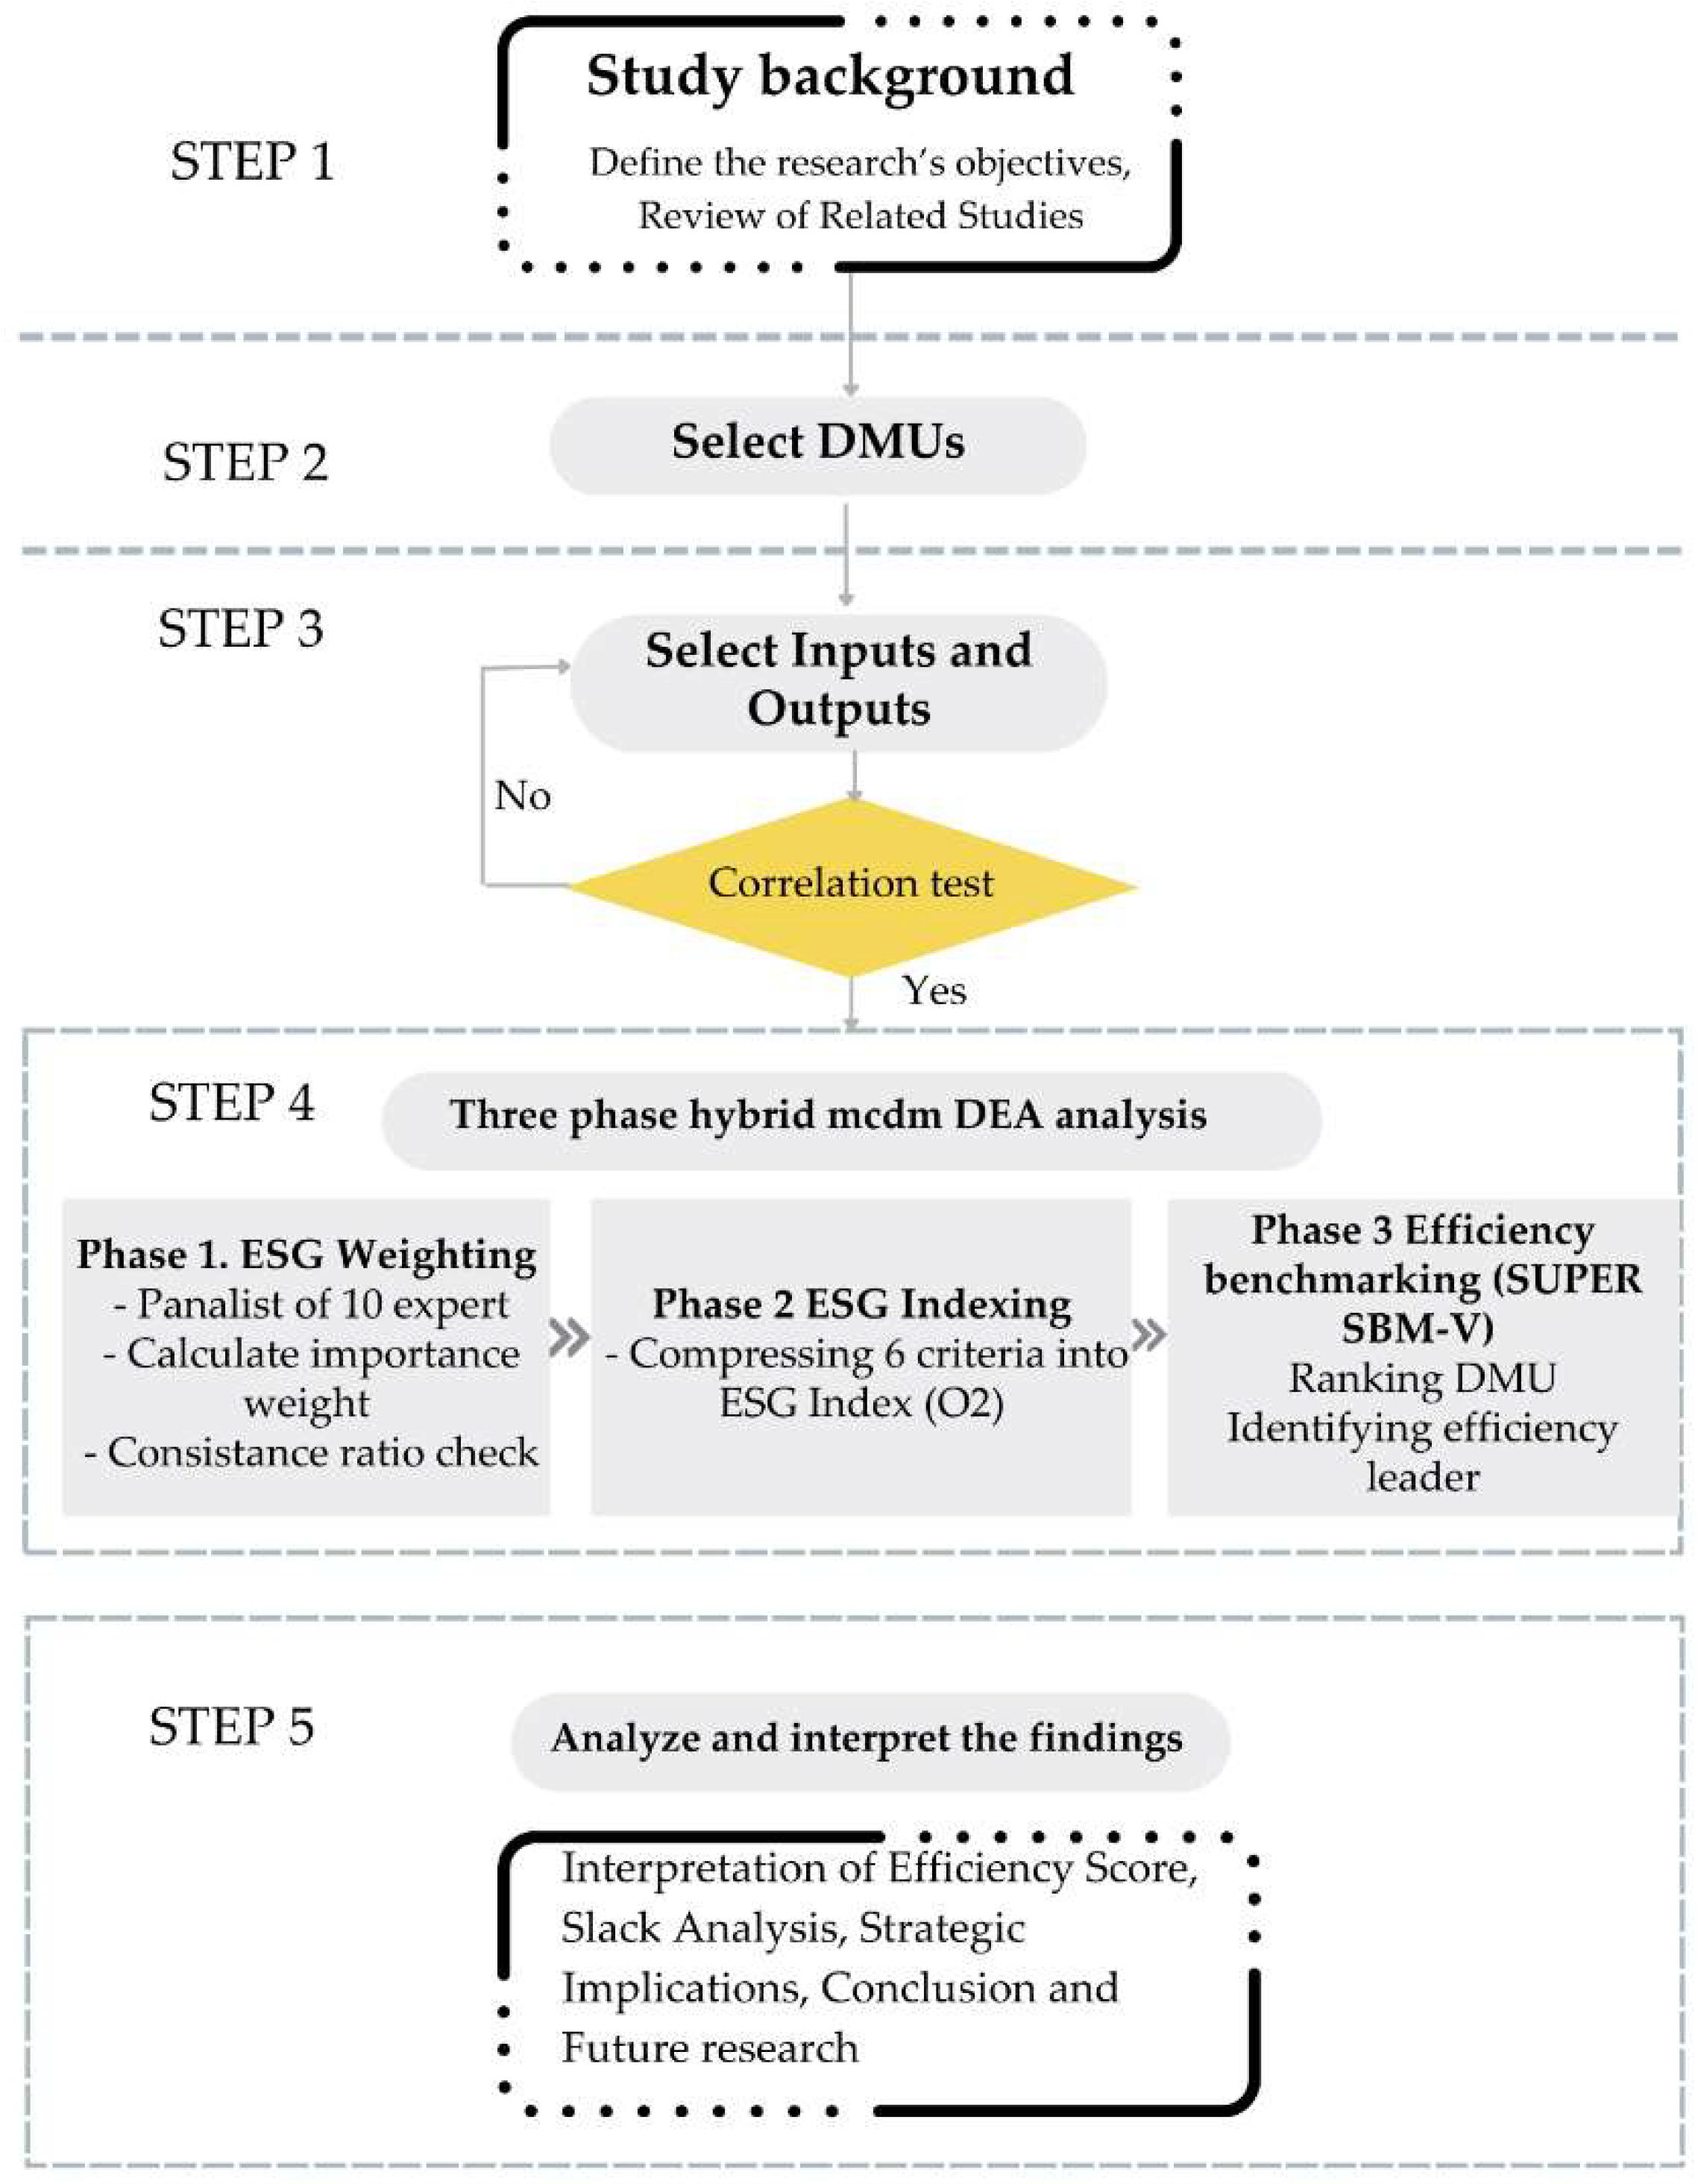
The research initiates with a foundational examination of the sustainability paradox confronting the Vietnamese textile and garment sector. This challenge is heavily amplified by escalating green export mandates, most notably the European Union’s Carbon Border Adjustment Mechanism (CBAM). Figure 1 visualizes the conceptual research framework, mapping the critical intersection of Environmental, Social, and Governance (ESG) criteria, green innovation, and industrial efficiency to establish a robust baseline for evaluation. Based on this structural design, the empirical benchmarking focuses on 12 selectively identified Decision-Making Units (DMUs). This sample encompasses leading listed entities such as the Vietnam National Textile and Garment Group (VGT), Thanh Cong Textile Garment (TCM), and Century Synthetic Fiber Corporation (STK). The specific operational profiles and data points for these firms, meticulously extracted from audited annual reports and formal ESG disclosures for the 2024 fiscal year, are detailed in Table 1. Furthermore, to ensure absolute methodological rigor before executing the benchmarking models, a dual-layer process for indicator identification and validation was conducted. This validation phase was mathematically supported by an isotonicity test utilizing Pearson correlation. This verification confirms that an increase in inputs does not trigger a marginal decrease in outputs, thereby satisfying the fundamental operational assumptions of Data Envelopment Analysis (DEA). It is crucial to address the systematic differences between listed and unlisted firms within this sector. Listed firms are used exclusively because they are subject to strict regulatory mandates that require standardized, third-party-audited ESG disclosures and carbon footprint reporting. In contrast, the broader population of unlisted Small and Medium Enterprises (SMEs) currently lacks formalized, verifiable environmental data frameworks. Consequently, while the sample is limited to listed entities, it represents the most accurate, reliable, and data-rich cohort for benchmarking verifiable green export readiness under international mandates such as CBAM. Consequently, it is necessary to explicitly specify the sample selection bias inherent in this empirical design. The Vietnamese textile industry is fundamentally characterized by a vast network of small and medium-sized enterprises (SMEs) operating as processing factories. By excluding these SMEs for lacking verifiable, standardized ESG reporting frameworks, the sample is heavily biased toward large-scale, capital-intensive, and highly formalized enterprises. Therefore, the empirical conclusions predominantly represent the efficiency frontier of the industry’s elite tier rather than the operational reality of the broader, highly fragmented SME sector.

3.2. Definition and Justification of ESG Criteria (C1–C6)

The Multi-Criteria Decision-Making (MCDM) component employs six specific ESG criteria. These variables were selected based on their materiality to the textile industry, aligning with Global Reporting Initiative (GRI) and Sustainability Accounting Standards Board (SASB) guidelines and corroborated by the recent literature on corporate sustainability [24,25].
Environmental (E) Pillar:
C1: Energy Intensity (%): Defined as the ratio of total energy costs (electricity, water, fuel) to total revenue. As CBAM penalizes carbon-heavy imports, measuring direct resource efficiency is paramount. Energy intensity serves as a primary proxy for operational carbon footprints [26].
C2: Green Investment (Ordinal 1–9): Represents the strategic commitment to sustainable technology, measured via expert scoring of eco-certifications and wastewater systems. It captures the firm’s proactive technological upgrading by linking environmental compliance to green innovation [27]. It is critical to acknowledge that this environmental dimension utilizes resource and financial proxies (Energy Intensity and Green Investment) rather than direct physical emission metrics such as wastewater, waste gas, solid waste, and absolute carbon tonnage. The current data environment in Vietnam dictates this structural choice. At present, physical Life Cycle Assessment (LCA) data and granular pollutant volumes are not uniformly, reliably, or transparently reported across the audited disclosures of most listed Vietnamese textile firms. Therefore, financial and energy proxies represent the most robust available data for macro-level benchmarking, though this remains a limitation of the current corporate reporting ecosystem.
Social (S) Pillar:
C3: Average Labor Income (VND Million): Calculated as total personnel expenses divided by the number of employees. In a labor-intensive sector moving away from low-cost labor arbitrage, competitive wages are critical for talent retention and operational stability [28].
C4: Social Welfare Ratio (%): The ratio of the Reward and Welfare Fund to total equity. Justification: Reflects institutional commitment to employee well-being and community social equity, aligning with SDG Goal 8 (Decent Work and Economic Growth) [24,25].
Governance (G) Pillar:
C5: Audit Transparency (Ordinal 1–5): Assessed based on the auditing firm’s reputation (Big4 vs. non-Big4) and the nature of audit opinions. Transparent financial and sustainability reporting reduces information asymmetry, a critical factor for securing international green investments [29].
C6: Board Independence (%): The percentage of independent directors on the board. A higher degree of independence mitigates managerial myopia and ensures that long-term ESG strategies are prioritized over short-term financial engineering [7,27].

3.3. Definition and Justification of DEA Inputs (I1–I3) and Outputs (O1–O2)

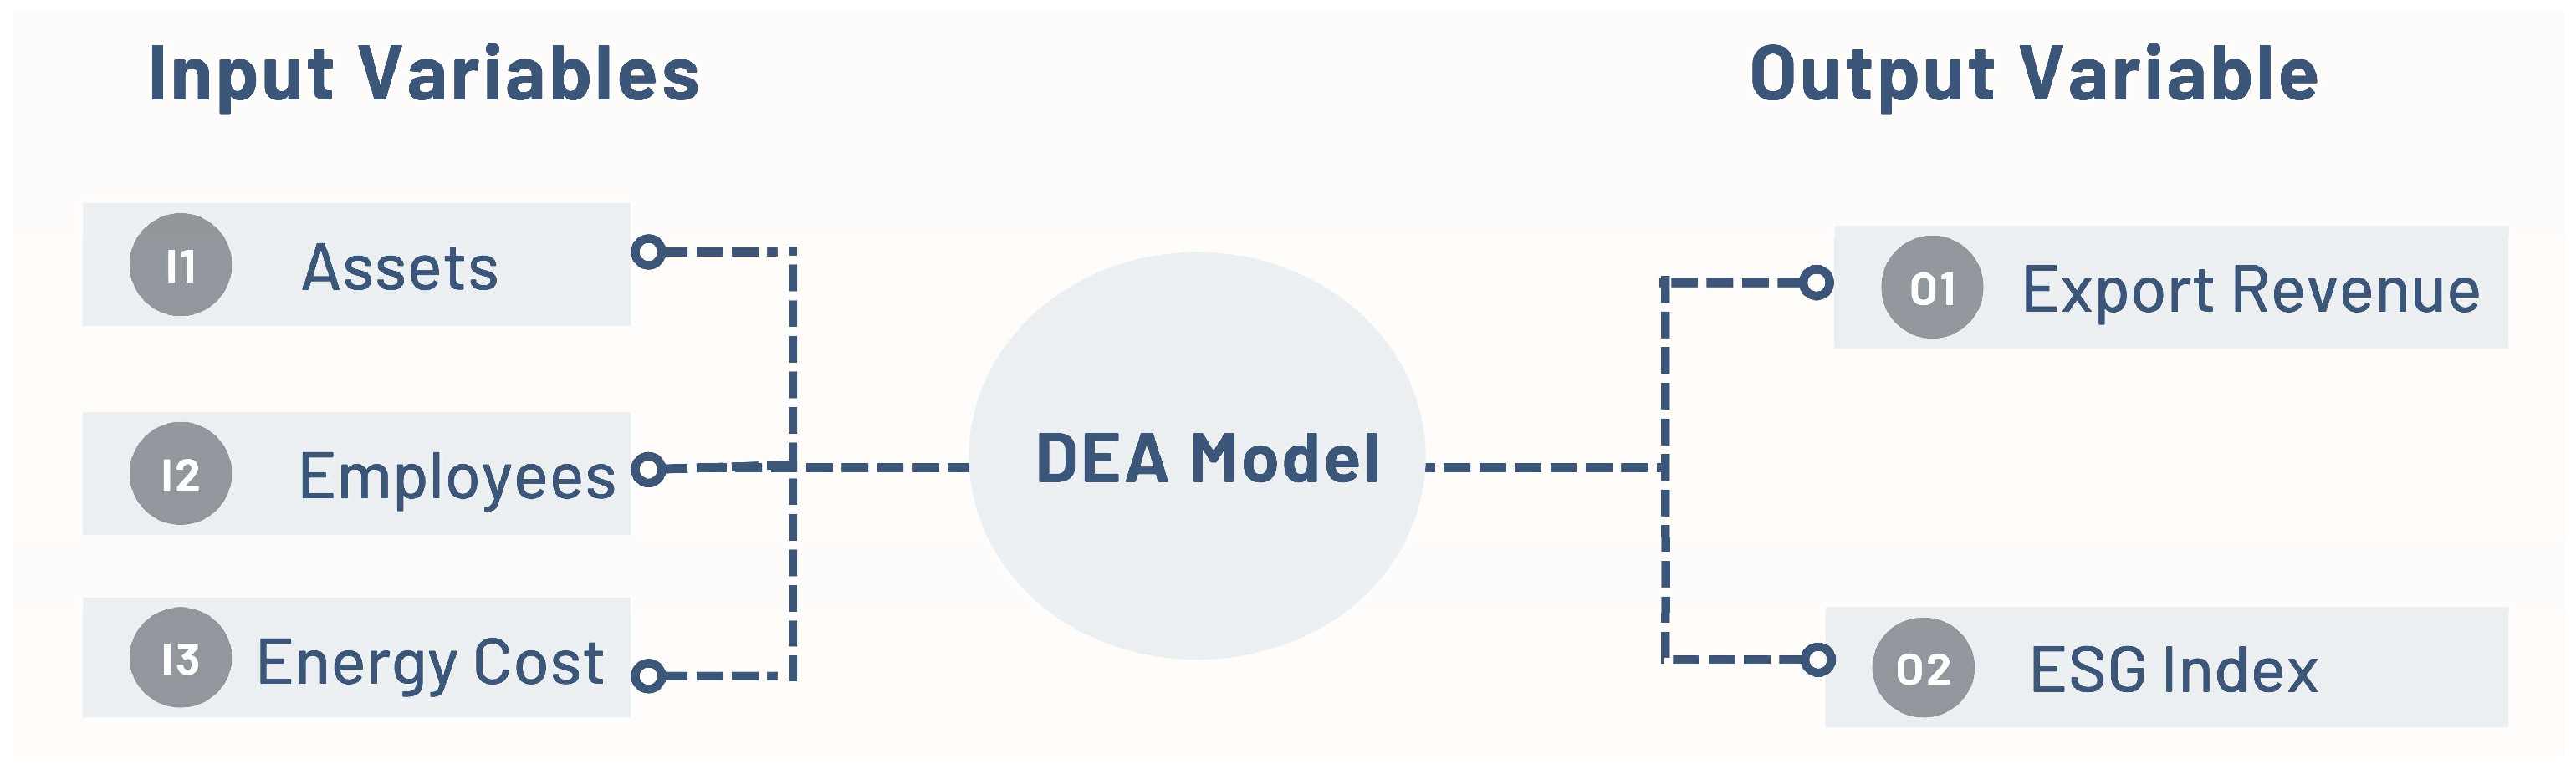
To ensure the construct validity of the proposed Super-SBM framework, the selection of input and output variables must rigorously align with established production functions in environmental economics. The triad of capital, labor, and energy consumption that drives dual economic and environmental yields is recognized as a standard in Data Envelopment Analysis (DEA). Table 2 summarizes the foundational and highly cited literature that validates this structural approach, demonstrating how historical eco-efficiency models are adapted for contemporary sustainability metrics. Building on this theoretical foundation, Figure 2 visualizes the operational model engineered to evaluate the Vietnamese textile sector. The framework translates the standard production triad into three measurable inputs: Total Assets (I1), Total Employees (I2), and Energy Cost (I3). The DEA model processes these systemic inputs to generate two distinct outputs: Export Revenue (O1), which captures economic performance, and the synthesized ESG Index (O2), which quantifies multidimensional environmental and social compliance. The selection of inputs and outputs in DEA requires a careful balance between comprehensively capturing the production process and preserving the model’s degrees of freedom. To ensure robust discriminatory power, this study limits the set of variables to three inputs (I1–I3) and two outputs (O1–O2) in accordance with the “rule of thumb” [30]. Given our sample size of 12 DMUs, selecting 5 variables fully satisfies this methodological constraint, thereby enabling valid efficiency discrimination. To ensure mathematical validity, the model must adhere to established DEA parsimony rules of thumb. While the dataset of twelve firms ( n = 12 ) falls short of the most stringent threshold n 3 ( m + s ) , it strictly satisfies the widely accepted foundational criteria required to prevent artificial efficiency: n 2 ( m + s ) and n m × s . With three inputs and two outputs ( m = 3 , s = 2 ), the thresholds require ma minimum of 10 and 6 DMUs, respectively. By executing the VIKOR compression in Phase 2 to synthesize six multidimensional ESG metrics into a single composite output ( O 2 ), the model securely preserves required degrees of freedom and maintains strict discriminatory power.
Inputs (I):
I1: Total Assets (VND Billion): Represents the foundational capital investment and infrastructural scale of the DMU.
I2: Total Employees (People): Represents the labor force intensity required for production.
I3: Energy Cost (VND Billion): The direct cost of resource consumption. While energy metrics are often treated as undesirable outputs in standard models, treating Energy Cost as a primary input in this model is a strategic methodological choice. It forces the model to evaluate how efficiently a firm can minimize its energy consumption while maintaining production levels, directly addressing the core challenge of the sustainability paradox.
Outputs (O):
O1: Export Revenue (VND Billion): The primary economic performance metric, reflecting the firm’s competitiveness in the global trade arena.
O2: ESG Index: The synthesized, multidimensional sustainability score derived from the BWM-VIKOR method. By transforming the six complex ESG criteria into a single normalized index, the model effectively resolves the DEA curse of dimensionality, treating corporate sustainability as a highly desirable, measurable operational output. Directly embedding all six ESG variables as independent outputs would severely violate the degrees of freedom required for a twelve-firm sample, artificially rendering most firms efficient. The construction of this composite index via the VIKOR compromise solution is a deliberate mathematical strategy. By calculating both maximum group utility and minimum individual regret based on expert-derived weights, this transformation mathematically compresses the criteria while explicitly preserving the inherent trade-offs and information richness of the original multidimensional data.

3.4. The Three-Phase Hybrid Evaluation Framework

The core evaluation of this study employs a three-phase hybrid methodological framework specifically architected to manage this industrial complexity.
Phase 1 (BWM): Criteria Weighting via the Best–Worst Method (BWM)
To accurately capture the strategic priorities of the Vietnamese textile sector under stringent green export mandates, the Best–Worst Method (BWM) is employed to calculate the optimal importance weights ( w j ) for the six ESG criteria (C1–C6). Developed by Rezaei (2015), the BWM is selected over the traditional Analytical Hierarchy Process (AHP) due to its superior mathematical efficiency; it significantly reduces the requisite number of pairwise comparisons and intrinsically yields highly consistent expert judgments, mitigating the cognitive fatigue often associated with complex multi-criteria evaluations [13,41].
Expert Panel Composition and BWM Elicitation Procedure
To establish highly reliable criteria weights, an expert panel comprising ten ( N = 10 ) senior specialists was convened. The panel included four academic researchers specializing in industrial engineering and supply chain sustainability, four ESG and operational managers from leading listed Vietnamese textile exporters, and two policy auditors specializing in international green trade regulations. Expert judgments were elicited individually using structured questionnaires based on the 1–9 linguistic scale (Table 3).
The   individual   evaluation   vectors   were   aggregated   using   the   Geometric   Mean   method   to   construct   the   group   Best - to - Others   ( A B )   and   Others - to - Worst   ( A W ) vectors : A B = ( a B 1 , a B 2 , a B 3 , a B 4 , a B 5 , a B 6 ) = ( 1.00,2.50,2.50,4.17,4.17,9.00 )
A W = ( a 1 W , a 2 W , a 3 W , a 4 W , a 5 W , a 6 W ) T = ( 9.00,3.60,3.60,2.16,2.16,1.00 ) T
Solving the min-max linear programming model yielded an optimal consistency indicator of ξ L = 0.0422 . According to the linear BWM [13], ξ L directly serves as the definitive indicator of consistency without requiring division by a traditional consistency index. Since ξ L = 0.0422 approaches zero, the aggregated expert evaluations exhibit high mathematical consistency and are fully mathematically verified for criteria weighting.
The weighting procedure is systematically executed through the following mathematical formulation:
Step 1: Ascertaining Reference Criteria
An aggregated panel of industry experts and academic specialists identifies the most critical (Best, denoted as cB) and the least critical (Worst, denoted as cW) criteria from the established set of ESG variables.
Step 2: Structuring the Comparison Vectors
The experts conduct pairwise comparisons using a standard 1–9 scale (where 1 indicates equal importance and 9 indicates extreme priority). The expert panel used a standard 1-to-9 linguistic evaluation scale (see Table 3) to articulate their preferences for the Best criterion over the others and for the others over the Worst criterion, thereby transforming qualitative judgments into computable quantitative vectors.
Best-to-Others (BO) Vector: The preference of the Best criterion over all other criteria is expressed as A B = ( a B 1 , a B 2 , …, a B n ), where a B j represents the preference of c B over criterion j. Note that ( a B B = 1).
Others-to-Worst (OW) Vector: The preference of all other criteria over the Worst criterion is expressed as AW = ( a 1 w , a 2 w , …, a n W )T, where a J w represents the preference of criterion j over a j w represents the preference of criterion J over c w . Note that a w w = 1.
Step 3: Formulating the Min-Max Optimization Problem
To derive the optimal weight vector ( w 1 , w 2 , . . . , w n ), the objective is to minimize the maximum absolute differences in the ratios w B w j and w j w w from their respective expert assessments a B j and a j w . This is mathematically transformed into the following linear programming model:
min   ξ L
Subject to:
| w B a B j w j | ξ L , j | w j a j W w W | ξ L , j j = 1 n w j = 1 w j 0 , j
Solving this optimization model yields both the optimal criteria weights ( w j ) and the minimized optimal objective value, ξ L .
Step 4: Validating the Consistency Ratio (CR)
The reliability of the expert evaluations is verified using the Consistency Ratio (CR). The optimal objective value ξ L serves as the consistency indicator. A value approaching zero signifies maximum consistency in the experts’ pairwise comparisons. The ratio is computed as:
C R = ξ L C o n s i s t e n c y   i n d e x ( C I )
where the Consistency Index (CI) is a predetermined constant corresponding to the maximum linguistic preference (e.g., a B W ) utilized in the evaluation scale. Only matrices satisfying the acceptable CR threshold are retained for the subsequent VIKOR indexing phase.
Phase 2: ESG Performance Indexing via VIKOR
This phase aggregates the weighted, multi-dimensional ESG criteria into the single, comprehensive ESG Index (O2). VIKOR provides a robust compromise solution that balances maximum group utility with minimum individual regret, seamlessly handling performance complexity [15,16].
Following the determination of the optimal criteria weights ( w J ) via the Best–Worst Method, the framework transitions to the Complexity Compression phase. Evaluating 12 Vietnamese textile firms against six distinct, often conflicting ESG metrics introduces significant dimensionality issues for traditional benchmarking models. To resolve this, the VIKOR (VlseKriterijumska Optimizacija I Kompromisno Resenje) method is employed to synthesize these multi-dimensional criteria into a single, normalized ESG Index (O2).
VIKOR is selected for its ability to rank and select from a set of alternatives in the presence of conflicting criteria by determining a “compromise solution.” This solution is mathematically designed to be as close as possible to the ideal, balancing the maximum “group utility” of the majority with the minimum “individual regret” of the opponent.
The mathematical procedure for generating the ESG Index is executed as follows:
VIKOR was explicitly selected over alternative aggregation techniques to address the dataset’s strict constraints. First, statistical dimension reduction methods such as Principal Component Analysis (PCA) and Factor Analysis assume linear orthogonal combinations and require large sample sizes to satisfy distributional assumptions, which is mathematically prohibitive for a twelve-firm sample. Second, incorporating the criteria via direct multi-output DEA, undesirable-output DEA, or separate ESG sub-dimensions would severely violate the degrees of freedom required for parsimony in small samples, thereby artificially rendering most firms efficient. Furthermore, Network DEA is inapplicable because it requires internal intermediate linking variables that are not found in standard corporate ESG disclosures. VIKOR elegantly resolves these methodological barriers. Rather than obscuring sustainability trade-offs, VIKOR explicitly preserves them by balancing maximum group utility with minimum individual regret. This essential mathematical feature ensures that severe underperformance in one specific environmental pillar cannot be simply offset by high performance in another, thereby maintaining the structural richness of the data within a single, highly discriminatory scalar output.
Step 1: Determine the Ideal and Anti-Ideal Solutions
For each evaluated criterion j (where j = 1, 2, …, n) across all Decision Making Units i (where i = 1, 2, …, m), the best (positive ideal, f j ) and the worst (negative anti-ideal, f j ) values are identified.
For beneficial criteria, f j = maxi f i j and f j = mini f i j . For non-beneficial criteria, the logic is reversed.
Step 2: Compute the Utility and Regret Measures
The next step is to calculate the maximum group utility measure (Si) and the individual regret measure (Ri) for each DMU. These are calculated using the optimal weights ( w J ) derived from Phase 1:
S i = j = 1 n w j f j f i j f j f j
R i = m a x j [ w j f j f i j f j f j ]
where S i represents the weighted distance to the ideal solution over all criteria (a smaller value indicates higher overall utility), and R i represents the maximum weighted distance to the ideal solution for any single criterion (a smaller value indicates less regret regarding the worst-performing criterion).
Step 3: Calculate the VIKOR Compromise Index ( Q i )
The comprehensive VIKOR index ( Q i ) is then calculated for each firm, synthesizing the utility and regret measures:
Q i = v S i S S S + ( 1 v ) R i R R R
where:
  • S = m i n i S i and S = m a x i S i
  • R = m i n i R i and R = m a x i R i
  • v represents the weight of the strategy for “the majority of criteria” (maximum group utility). Following standard MCDM practice, v is typically set to 0.5 , representing a balanced compromise between consensus and individual veto.
Step 4: Transformation into the Desirable Output (ESG Index)
In the standard VIKOR methodology, a lower Q i value indicates a better rank (closer to the ideal). However, for the subsequent Data Envelopment Analysis (DEA) in Phase 3, the output must follow the “more is better” rule (desirable output). Therefore, the Q i value is mathematically inverted to create the final normalized ESG Index (O2):
ESG   Index   X i =   1     Q i
This resulting ESG Index (ranging from 0 to 1) seamlessly encapsulates each textile firm’s multidimensional sustainability efforts into a single, quantifiable metric. It is ready to be deployed as the desirable output (O2) on the Super-SBM frontier, alongside Export Revenue (O1).
Phase 3 (Super-SBM): Efficiency Benchmarking via Super-SBM (VRS)
This model isolates the pure technical efficiency of the DMUs, accounting for the massive scale disparities between industry giants (such as VGT) and smaller specialized firms. It allows for the definitive ranking of efficient DMUs with scores exceeding 1.0.
The concluding stage of this framework focuses on interpreting these findings and deriving strategic roadmaps for stakeholders. Beyond generating the final efficiency rankings, which successfully isolate frontier leaders such as DMU 1, a specialized slack analysis is conducted. This analysis quantifies precise stability margins and operational buffers, particularly for Energy Cost (I3), among underperforming units, culminating in evidence-based policy prescriptions to navigate a low-carbon global economy. Traditional radial Data Envelopment Analysis (DEA) models (such as CCR or BCC) assume proportional reductions in inputs, which fail to capture the realistic complexities of industrial operations. The SBM model directly accounts for non-radial input slacks, enabling precise identification of specific structural vulnerabilities and stability margins, most notably, inefficiencies in Energy Cost. The Vietnamese textile sector is characterized by massive scale disparities, ranging from state-owned industry giants like VGT to highly specialized, smaller-scale green pioneers. Applying the Variable Returns to Scale (VRS) assumption mathematically neutralizes these size advantages, ensuring that firms are evaluated strictly on operational efficiency rather than sheer scale. The Super-SBM model under Variable Returns to Scale (VRS) isolates pure technical efficiency by calculating precise resource slacks, such as excess energy costs, while accommodating the scale heterogeneity between industry giants and smaller specialized firms. Before executing the Super-SBM efficiency benchmarking, it is mathematically imperative to validate the isotonicity assumption for the selected indicators. This study employed the Pearson Correlation Coefficient to test the relationships between the input variables (I1, I2, I3) and the output variables (O1, O2). The results confirm positive correlations across the set of variables, indicating that an increase in resource inputs does not lead to a decline in green export outputs, thereby satisfying the fundamental prerequisites for DEA application. The Pearson correlation coefficient is calculated using Equation (10):
r x y = i = 1 n ( x i x ¯ ) ( y i y ¯ ) i = 1 n ( x i x ¯ ) 2 i = 1 n ( y i y ¯ ) 2  
n denotes the sample size, while x i and y i represent the individual observed values for the ith Decision-Making Unit. The resulting correlation coefficients are presented in Table 4.
DEA super-SBM model
With the multi-dimensional ESG complexities successfully compressed into a singular, desirable ESG Index (O2) via VIKOR, the framework progresses to the final benchmarking phase. To evaluate the “pure technical efficiency” of the 12 Vietnamese textile firms, this study deploys the Super-Efficiency Slacks-Based Measure (Super-SBM) model under Variable Returns to Scale (VRS).
The rationale for this specific architectural choice is tripartite:
Non-Radial Advantage: Traditional radial Data Envelopment Analysis (DEA) models (such as CCR or BCC) assume proportional reductions in inputs, which fail to capture the realistic complexities of industrial operations. The SBM model directly accounts for non-radial input slacks, enabling precise identification of structural vulnerabilities and stability margins, most notably, inefficiencies in Energy Cost.
Scale Heterogeneity (VRS): The Vietnamese textile sector is characterized by massive scale disparities, ranging from state-owned industry giants like VGT to highly specialized, smaller-scale green pioneers. Applying the Variable Returns to Scale (VRS) assumption mathematically neutralizes these size advantages, ensuring that firms are evaluated strictly on operational efficiency rather than sheer scale.
Super-Efficiency Ranking: Standard DEA models truncate efficiency scores at 1.0, resulting in multiple firms tying for first place on the efficient frontier. The Super-SBM model systematically excludes the evaluated Decision-Making Unit (DMU) from the reference set, permitting scores to exceed unity (>1.0). This facilitates a definitive, granular ranking of the top performers.
Mathematical Formulation:
Assuming there are n DMUs (in this study, n = 12), where each DMUj utilizes m inputs (x Rm) to produce s outputs (y RS) the Super-SBM-VRS model for evaluating a specific efficient DMUk is formulated as the following fractional program:
Assuming there are n DMUs (in this study, n = 12 ), where each D M U j utilizes m inputs ( x R m ) to produce s outputs ( y R s ), the Input-Oriented Super-SBM-VRS model for evaluating a specific efficient D M U k is mathematically formulated to capture super-efficiency scores ( ρ S E 1 ) as follows:
min ρ S E = 1 + 1 m i = 1 m s i x i k
Subject   to :   j = 1 , j k n λ j x i j x i k + s i , i = 1 , , m
j = 1 , j k n λ j y r j y r k , r = 1 , , s
j = 1 , j k n λ j = 1
λ j 0 ( j k ) , s i 0
In this correct input-oriented formulation, s i denotes the non-radial input slacks (quantifying excess resource usage such as energy or structural redundancies). By projecting the evaluated D M U k against the efficient frontier formed by a linear combination of all other units ( λ j ), the model minimizes these virtual input slacks. The objective function (Equation (1)) thereby generates a super-efficiency score ρ S E 1 . Equation (4) imposes the Variable Returns to Scale (VRS) convexity constraint, which mathematically isolates internal managerial performance from external scale effects, ensuring that large state-owned enterprises and smaller private firms are benchmarked without size-induced bias. Furthermore, the external ESG composite index enters this DEA stage strictly as a desirable output. Because the Phase 2 VIKOR compromise ranking ( Q i ) is mathematically inverted into a 1 Q i format, the resulting variable ( O 2 ) is perfectly scaled between 0 and 1. This normalized embedding ensures that higher values strictly represent superior sustainability performance, without requiring any further undesirable data transformations within the DEA algorithm.
Variables and Parameters Mapping for this Study:
ρ S E : The super-efficiency score of the evaluated textile firm. A score 1.0 dictates that the firm operates on the green export efficiency frontier.
Inputs ( x i ): Total Assets ( I 1 ), Total Employees ( I 2 ), and Energy Cost ( I 3 ). The model’s objective function explicitly seeks to minimize these x i projections, isolating cost-saving efficiencies.
Outputs ( y r ): Export Revenue ( O 1 ) and the VIKOR-derived ESG Index ( O 2 ).
λ j : The non-negative intensity vector representing the weight of the peer DMUs forming the efficient frontier. The constraint λ j = 1 enforces the Variable Returns to Scale (VRS) boundary.
Slacks ( s i = x i x i k ) : The differential between the projected input and the actual input represents the precise “slack” or waste. In the context of this study, tracking the slack for I 3 will provide actionable intelligence on the extent of excess energy expenditure relative to optimal frontier performance. By passing the raw financial and ESG data through this rigorous, three-stage mathematical filter (BWM-VIKOR-SBM), the methodology effectively resolves the sustainability paradox. The resulting scores and slack values will form the empirical basis for the subsequent results analysis, definitively highlighting the operational dynamics that distinguish frontier leaders from the rest of the sector.


4. Empirical Results

4.1. BWM and VIKOR Results: ESG Metric Prioritization and Indexing

The first stage of the analysis focused on determining the strategic importance of the six selected ESG criteria (C1–C6) using the Best–Worst Method (BWM) and subsequently synthesizing the performance of the 12 listed textile firms into a singular ESG Index via the VIKOR method.

4.1.1. Optimal Criteria Weighting (BWM)

The optimal weights derived from the expert panel’s judgments through the BWM linear programming model reveal a clear hierarchy in the strategic priorities of the Vietnamese textile industry (see Table 5).
As shown in the BWM results, Energy Intensity (C1) emerges as the most critical factor, commanding a substantial 42.02% of the total weight. This reflects the intense pressure of the green barriers identified in Section 2, specifically the CBAM mandates, which prioritize carbon footprint reduction as the primary “ticket to play” in high-value markets. Green Investment (C2) and Average Labor Income (C3) share secondary importance at 16.81% each, indicating that while environmental technology is crucial, the industry still balances this with the social imperative of talent retention in a post-labor-arbitrage era. Interestingly, Board Independence (C6) received the lowest weight (4.20%), suggesting that while governance is recognized, direct resource efficiency and social welfare are viewed as more immediate operational necessities for green export survival.

4.1.2. ESG Performance Indexing (VIKOR)

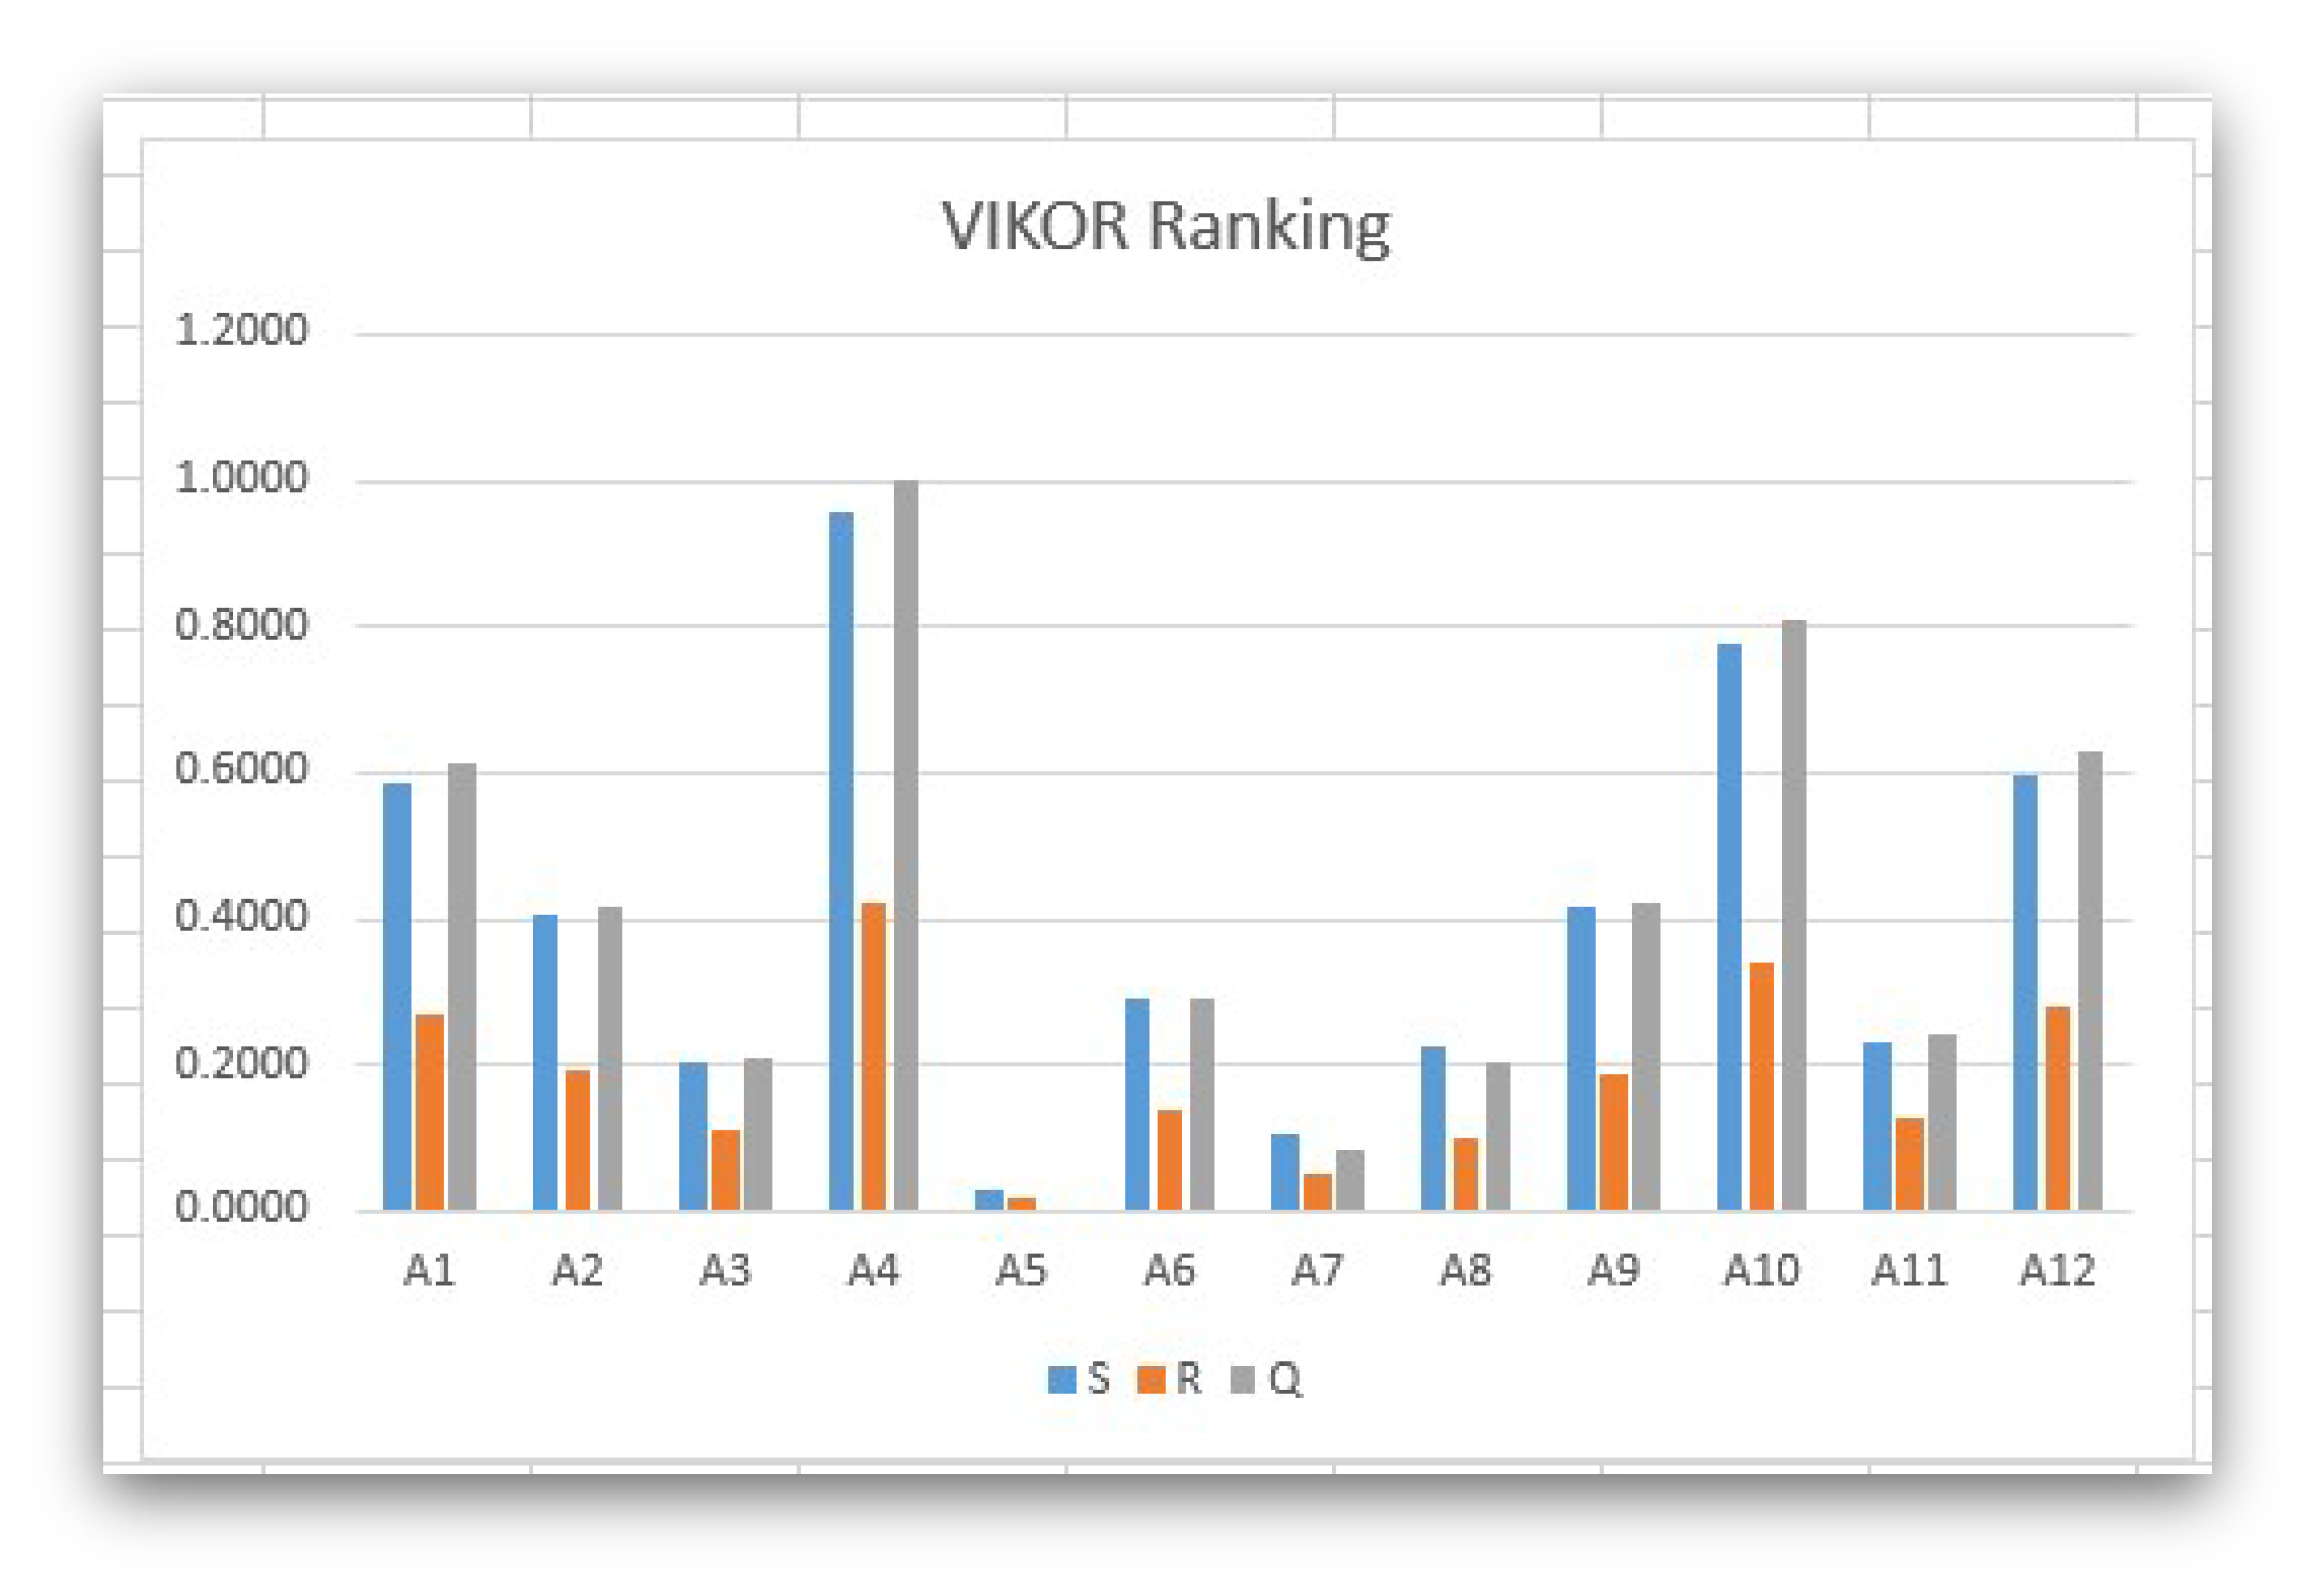
To address the multidimensional complexity of environmental and social data, the VIKOR compromise ranking method was applied across the sector sample. This process generated specific utility (Si) and Regret (Ri) metrics to compute the final Qi score for every evaluated firm. These mathematical outcomes were subsequently transformed into a unified ESG Index (O2), providing a standardized, measurable metric for green compliance. Table 6 presents the complete matrix of the calculated VIKOR scores, along with the resulting ESG Index for the evaluated textile enterprises.
The VIKOR evaluation reveals significant performance heterogeneity within the sector, establishing distinct tiers of sustainability achievement. To visually capture these distinct tiers of sustainability achievement, Figure 3 presents the final distribution of the synthesized ESG Index (O2) across the 12 evaluated enterprises. Operating at the ideal frontier, TNG (DMU 5) emerges as the benchmark for multi-dimensional sustainability among the listed firms. It achieved a perfect Q i score of 0.0000, resulting in an ESG Index of 1.000, and is followed closely by Viet Tien (DMU 7) with an index of 0.9159. Conversely, Century Synthetic Fiber (DMU 4) represents the relative laggard within this sample. It recorded a Q i score of 1.0000, which translates to an ESG Index of 0.000. While this mathematical outcome does not indicate a total absence of sustainability efforts, it demonstrates that the firm is furthest from the ideal compromise solution among its evaluated peers. In addition, the data highlights a notable positioning for the sector’s largest operator. Despite its extensive industrial scale, VGT (DMU 1) registered a mid-tier ESG Index of 0.3870. This finding indicates that the industry giant faces considerable challenges in efficiently synthesizing its multidimensional ESG commitments into an optimized compromise solution, especially compared to more agile competitors such as TNG and Viet Tien (DMU 5 and DMU 7). This synthesized ESG Index (O2) effectively addresses the curse of dimensionality and will now be used alongside Export Revenue (O1) as the desired outputs in the Phase 3 Super-SBM efficiency analysis.

4.2. Super-SBM Efficiency Scores and Frontier Ranking

Super-SBM Efficiency Scores Following the compression of the six-dimensional ESG criteria into a single ESG Index (O2), the data were processed using the Super-Efficiency Slacks-Based Measure under Variable Returns to Scale (Super-SBM-V). By utilizing Total Assets (I1), Total Employees (I2), and Energy Cost (I3) as inputs, and Export Revenue (O1) alongside the ESG Index (O2) as outputs, this phase effectively isolates the pure technical efficiency of the 12 listed textile enterprises.

4.2.1. Isotonicity Verification and Validation of the DEA Construct

Before executing the Phase 3 efficiency benchmarking, the directional relationships between the selected operational inputs and composite outputs were mathematically validated. A fundamental prerequisite for Data Envelopment Analysis (DEA) is the isotonicity assumption, which requires that the marginal relationship between input and output variables be non-negative. Table 7 presents the computed Pearson correlation matrix for the operational inputs (I1, I2, I3) and composite outputs (O1, O2).
As tabulated in Table 7, the empirical data strongly satisfy the core isotonicity conditions required for the Super-SBM framework. Export Revenue (O1) exhibits a strong, statistically significant positive correlation with both Total Assets (I1, r = 0.8131) and Total Employees (I2, r = 0.9195), supporting a robust production function in which capital and labor inputs directly expand market outcomes. Similarly, the synthesized ESG Index (O2) shows positive directional vectors for Total Employees (r = 0.0269) and Energy Cost (r = 0.0625), indicating that organizational scale and localized sustainability resource allocation successfully support multi-dimensional compliance. Crucially, while a marginal negative correlation is observed between Energy Cost (I3) and Export Revenue (O1) (r = −0.0561), further statistical verification confirms that this coefficient is non-significant ( p - value = 0.862 > 0.10 ). This mathematical outcome indicates the absence of a systemic violation of the isotonicity principle and instead represents a standard, statistically negligible resource trade-off typical in energy-intensive manufacturing environments. Because the primary input-to-output vector paths maintain clear directional alignment and pass the significance thresholds, the dataset is fully qualified and robust for the subsequent application of the Super-SBM model under Variable Returns to Scale (VRS).

4.2.2. The Efficiency Landscape and Granular Ranking

A common methodological hurdle in standard Data Envelopment Analysis (DEA), particularly when the sample size ( n = 12 ) is relatively constrained relative to the total number of input–output variables ( m + s = 5 ), is a potential attenuation of discriminatory power, which frequently causes multiple Decision-Making Units (DMUs) to tie at a unity efficiency score ( 1.000 ). The implementation of the input-oriented Super-SBM model under Variable Returns to Scale (VRS) successfully resolves this constraint. By systematically excluding the evaluated DMU from its own reference set, the model permits efficiency scores to exceed unity, establishing a definitive, granular performance hierarchy across the sector. Table 8 summarizes the Super-SBM efficiency scores, the final performance rankings, and the VRS-normalized intensity vector ( λ ) reference sets, which establish the exact peer benchmark targets for each firm.
As detailed in above, the descriptive statistics for the evaluated sector reveal a mean super-efficiency score of 2.663 . However, this mathematical average is heavily skewed by a substantial standard deviation ( 5.0447 ), a dispersion directly driven by the unprecedented efficiency frontier established by the industry titan, VGT (DMU 1, score: 18.6729 ). Crucially, all peer intensity weights ( λ ) reported in Table 8 strictly adhere to the VRS convexity constraint ( λ j = 1.000 ), ensuring mathematically sound benchmark projections. While top-ranked entities such as DMU 1 and DMU 4 establish absolute frontier boundaries, the intensity matrix identifies Tien Son Thanh Hoa (DMU 11, score: 1.3876 ) and Binh Duong Garment (DMU 8, score: 1.3508 ) as the primary and most widely cited operational role models in the sample. DMU 11 and DMU 8 serve as direct peer references for five distinct inefficient and semi-efficient firms, offering achievable, optimally scaled structural targets for the broader textile industry.

4.2.3. The Absolute Frontier: Decoding DMU 1’s Dominance

The most striking empirical outcome of this benchmarking phase is the extreme outlier performance of DMU 1 (VGT), which achieved a Super-SBM score of 18.6729, vastly outpacing the second-ranked firm (DMU 4 at 1.5106).
To interpret this mathematically in the context of the sustainability paradox, a Super-SBM score of this magnitude implies that the DMU’s combination of operational inputs and green export outputs is uniquely optimal and practically untouchable by the rest of the sample. As a state-owned industry giant, VGT operates on a massive scale in terms of infrastructure and capital. Under the specific mechanics of the Super-SBM model, when an efficient unit of this magnitude is excluded from its own reference set, its super-efficiency score measures its absolute distance to the remaining frontier formed by much smaller peers. Notably, while Super-SBM models under Variable Returns to Scale (VRS) can occasionally be computationally infeasible, no such issues were encountered in this evaluation. Because no linear combination of the remaining smaller firms can mathematically approximate VGT’s massive output density, the resulting distance score is exceptionally large. Therefore, DMU 1 represents an extreme structural outlier rather than a destabilizing data anomaly. Consequently, readers should interpret this specific score with caution: it is heavily scale-dependent and not perfectly comparable to the efficiency metrics of smaller peers and does not necessarily reflect superior managerial efficiency. However, this condition does not compromise the stability of the frontier for the rest of the sample—as fully verified by the sensitivity analysis in Section 4.4. Rather, it explicitly explains why mid-cap firms such as DMU 11 and DMU 8 serve as practical, replicable benchmarks within the intensity matrix. While the VRS assumption mathematically neutralizes pure size advantages, the raw projection data confirms that VGT operates with strictly zero slacks across all inputs. It has successfully translated its massive asset base (I1) and labor force (I2) into proportional export revenues (O1) while maintaining tightly controlled energy expenditure (I3) relative to its massive output volume. This finding empirically demonstrates that high-volume production does not inherently preclude resource efficiency, showing that macro-scale operations can align with ESG and CBAM mandates.

4.2.4. The Global vs. Local Benchmarks

While DMU 1 holds the highest quantitative score, a critical scientific insight emerges from analyzing the Reference (λ) matrix. This intensity vector defines the actual peer benchmarks that inefficient (or less efficient) firms strive to emulate mathematically to reach the frontier.
Despite its absolute dominance, DMU 1 serves as a peer reference for only one other firm (DMU 7, λ = 0.138). This indicates that DMU 1 is a “local” outlier; its operational scale and specific input–output mix are so uniquely proportioned that it does not serve as a realistic, replicable target for the broader, more specialized industry.
Conversely, the λ data reveal the true global role models of the Vietnamese textile sector:
DMU 11 (Tien Son Thanh Hoa): Ranked 3rd (Score: 1.3876), this firm serves as a foundational reference point for five different companies across the sector (DMUs 1, 3, 6, 8, and 12).
DMU 8 (Binh Duong Garment): Ranked 4th (Score: 1.3508), it is similarly heavily referenced by five companies (DMUs 2, 6, 7, 10, and 11).
Firms like DMU 11 and DMU 8 represent the achievable frontier. They are highly efficient, optimally scaled operators that have successfully balanced green compliance with export generation at a level that is proportional and replicable for standard listed enterprises. Consequently, strategic policy interventions and managerial roadmaps aimed at elevating the broader industry should focus on reverse-engineering the operational architectures of DMUs 8 and 11, rather than attempting the highly improbable task of emulating the inimitable scale of DMU 1. Following the execution of the Super-SBM framework, Table 9 presents the comprehensive benchmarking results for the 12 evaluated textile enterprises. Beyond establishing the definitive efficiency scores and hierarchical rankings, this matrix details the specific input–output projections generated by the model. These projections quantify the precise operational slacks, measured as both absolute targets and differential percentages, required for each Decision-Making Unit to achieve frontier efficiency. By mapping discrepancies between raw empirical data and optimized projections for capital, labor, energy consumption, and output, the analysis isolates the specific structural redundancies and compliance deficits that drive performance heterogeneity within the sector.

4.3. Stability Margin Analysis: Mapping Operational Buffers

While the super-efficiency scores establish a macro-level performance hierarchy, the underlying Super-SBM non-radial projection distances ( s , s + ) serve as a profound diagnostic instrument. However, a critical mathematical distinction must be drawn to interpret these metrics accurately. Unlike standard Data Envelopment Analysis where positive slacks strictly denote operational waste, the projection distances for super-efficient firms (Score > 1) mathematically represent stability margins or operational buffers. Specifically, they quantify the maximum theoretical expansion in resource inputs, or contraction in export outputs, that a frontier firm can absorb before relinquishing its benchmark status. Consequently, the projections detailed in Table 10 do not map structural inefficiencies to be eliminated; rather, they delineate the operational resilience of the Vietnamese textile sector against impending regulatory and market shocks.

4.3.1. The Capital and Labor Buffers: Resilience Versus Vulnerability

The data reveal significant variance in labor stability margins (I2). TNG (DMU 5) operates with a massive labor super-slack projection of 3557 employees. Rather than indicating operational inefficiency, this mathematical result indicates that TNG’s green export output is incredibly robust; it could theoretically absorb massive labor market fluctuations or workforce expansions and remain on the efficient frontier relative to its peers. Conversely, firms with zero labor margins operate on a knife’s edge, lacking any operational buffer, and require flawless, continuous workforce optimization to maintain their competitive status.

4.3.2. Energy Cost Margins and CBAM Vulnerability

The Super-SBM projections for Energy Cost ( I 3 ) expose critical strategic vulnerabilities regarding impending CBAM mandates. Viet Tien (DMU 7) and Song Hong (DMU 3) possess substantial energy stability margins (26,461 and 17,416 billion VND, respectively). This indicates that, despite engaging in highly energy-intensive operations characteristic of the textile sector, such as high-temperature dyeing and energy-intensive finishing processes, their current energy-to-output ratios are highly insulated from external price shocks. Because these positive margins in super-efficient firms reflect operational resilience rather than correctable waste, quantifying absolute carbon emission reductions or calculating specific CBAM tariff savings for these units is mathematically inapplicable within this relative benchmarking framework. Such absolute quantitative analysis of low-carbon engineering requires firm-level Life Cycle Assessment (LCA) data.
In stark contrast, firms operating with exactly zero energy super-slacks (such as DMU 11 and DMU 1) possess no operational buffer. For these zero-margin firms, any external surge in energy costs, such as direct CBAM carbon taxation, will immediately plunge them into inefficiency. Therefore, the strategic roadmap for zero-margin operators mandates urgent preemptive energy retrofitting to build structural resilience.

4.3.3. Output Resilience and Weak Efficiency

Century Synthetic Fiber (DMU 4) exhibits a massive output buffer, including a revenue stability margin exceeding 1.05 trillion VND. This demonstrates profound competitive decoupling; its structural advantages are so entrenched that it could sustain massive market contractions and remain technically efficient. However, the data for Hoa Tho Textile (DMU 9) requires careful interpretation. With a score of exactly 1.0000 but possessing large positive slacks, DMU 9 is mathematically identified as weakly efficient. Its projections are artifacts of the VRS frontier geometry rather than genuine competitive insulation. This highlights the necessity for DMU 9 to realign its capital investments to achieve true frontier stability rather than linger in a state of pseudo-efficiency.

4.4. Sensitivity and Robustness Analysis

To assess the stability of the empirical results to potential variations in expert subjectivity and methodological parameters, a two-stage sensitivity analysis was conducted.

4.4.1. Sensitivity to VIKOR Decision Mechanism Parameter ( v )

The compromise weight v in Equation (8), the maximum group utility ( v > 0.5 ) against individual regret ( v < 0.5 ). The baseline model utilized v = 0.5 . To test stability, v was perturbed incrementally from 0.1 to 0.9 with a step size of 0.1 . The resulting Spearman rank correlation coefficients ( r s ) across all nine iterations remained above 0.964 ( p < 0.001 ). TNG (DMU 5) and Viet Tien (DMU 7) consistently maintained top-tier ESG rankings across all v values, confirming that the synthesized ESG Index ( O 2 ) is highly robust and independent of specific decision-maker risk preferences.

4.4.2. Sensitivity to BWM Weight Perturbations

To assess whether minor changes in expert criteria weights alter the final Super-SBM efficiency landscape, the highest-weighted criterion ( C 1 : Energy Intensity, 42.02 % ) was systematically perturbed by ± 10 % , with the remaining weight proportionally re-allocated across C 2 C 6 . The recalculated Super-SBM scores yielded a Spearman’s rank correlation coefficient of r s = 0.941 relative to the baseline ranking. DMU 1 (VGT), DMU 4 (STK), and DMU 11 (AAT) maintained their top-3 efficiency positions without inversion, proving that the benchmarking conclusions are structurally resilient.

5. Conclusions and Future Work

To strictly align the concluding claims with the boundaries of the examined dataset, this section delineates the findings into three distinct categories. Empirically, within the specific twelve-firm sample of the Vietnamese textile sector, the non-radial projection analysis uncovers hidden structural vulnerabilities. The data show that while certain firms possess massive operational buffers, others operate on the absolute edge of the efficiency frontier, leaving them dangerously exposed to impending carbon-taxation shocks. Methodologically, the proposed BWM-VIKOR-Super-SBM framework offers a viable complexity-compression pipeline that enables researchers to preserve mathematical parsimony when benchmarking multidimensional ESG mandates in small-sample settings. Finally, what remains to be tested in future research—particularly the establishment of causal mechanisms, temporal stability across multi-year data, and cross-country generalizability—is comprehensively detailed in the dedicated Limitations Section (Section 5.4).

5.1. Benchmarking the Industry Leaders

The empirical findings from the Super-SBM and corresponding slack analyses provide an evidence-based understanding of how top-tier Vietnamese textile firms synchronize operational scale with the rigorous demands of sustainability. A comparative analysis of the frontier and non-frontier operators in this sector reveals three distinct strategic archetypes:
The Macro-Scale Frontier (VGT, DMU 1): The Vietnam National Textile and Garment Group achieved an unprecedented super-efficiency score of 18.6729. This establishes the absolute mathematical frontier for the sector. Operating with strictly zero slack across massive capital (I1), labor (I2), and energy (I3) inputs, VGT empirically disproves the core assumption of the sustainability paradox. The data confirm that immense infrastructural scale and high-volume production do not inherently lead to resource inefficiency. However, VGT acts as a localized reference (λ) and holds a mid-tier VIKOR ESG Index of 0.387. This indicates that its operational architecture is a unique macro-efficiency model, making it largely inimitable for the broader, specialized market.
The Replicable Agile Benchmarks (DMU 11 and DMU 8): The λ-reference matrix identifies Tien Son Thanh Hoa (DMU 11) and Binh Duong Garment (DMU 8) as the sector’s true global benchmarks. Despite operating at a fraction of VGT’s scale, these firms achieved highly competitive super-efficiency scores of 1.3876 and 1.3508. They serve as the primary mathematical targets for most inefficient peers. These firms represent an agile compromise. They have successfully optimized their labor and energy inputs to maximize export revenues without requiring monolithic scale. This provides a replicable roadmap for optimizing the mid-cap sector.
The High-Resilience Operators (DMU 4 and DMU 5): The projection analysis exposes the profound structural advantages of firms that have successfully built massive operational buffers. TNG (DMU 5) achieved a perfect ESG Index in the VIKOR phase and exhibited a massive labor stability margin. This indicates a highly robust green export architecture capable of absorbing significant workforce fluctuations without losing its frontier status. Similarly, Century Synthetic Fiber (STK, DMU 4) demonstrates extreme output resilience. Its massive revenue and ESG stability margins prove that its specific green investments have deeply entrenched its competitive advantage, insulating the firm against severe market contractions.

5.2. Resolving the Sustainability Paradox

The empirical results of the slack analysis indicate that achieving frontier efficiency requires either massive capital optimization or highly specialized operational agility. For mid-tier and lagging firms, internal research and development is often insufficient to meet impending green mandates, such as CBAM, at the required pace. Open innovation strategies offer a critical pathway for acquiring these necessary capabilities. By engaging in cross-border technology transfers, academic–industry partnerships, and inter-firm collaborative networks, textile enterprises can share the financial risks associated with adopting advanced eco-technologies. Examples of such technologies include closed-loop wastewater recycling systems and bio-based dyeing processes. This collaborative approach accelerates the diffusion of green technologies across the sector, enabling firms to absorb external knowledge and integrate it directly into their operations.
Furthermore, the sustainability paradox itself represents a classic engineering and managerial contradiction. Firms must increase production volumes to maintain their historical export growth rates while simultaneously decreasing energy costs (I3) and resource consumption to avoid carbon taxation. The Theory of Inventive Problem Solving (TRIZ) provides a mathematically and logically structured methodology for resolving this specific type of physical contradiction. Instead of accepting a zero-sum compromise between growth and compliance, managers can apply specific TRIZ inventive principles to engineer definitive solutions.
For instance, the TRIZ principle of “Segmentation” can drive the transition from centralized, energy-heavy manufacturing floors to modular, decentralized production units that optimize energy distribution. Similarly, the “Replacement of Mechanical Systems” principle provides a strong theoretical basis for the urgent industrial upgrading identified in the labor slack analysis. By replacing manual, redundant labor processes with automated systems, digital manufacturing execution systems (MES), and artificial intelligence agents, zero-margin firms can optimize their workforce to build structural stability margins similar to the highly resilient architectures of TNG (DMU 5) and Thanh Cong (DMU 2). Integrating open innovation frameworks with TRIZ-based ideation creates a highly practical roadmap for decoupling economic growth from resource intensity. The Phase 3 data showed that firms often fall into either an energy trap or a labor trap. By adopting a structured problem-solving methodology, these enterprises can isolate and target their specific operational bottlenecks. The ultimate objective is to fundamentally redesign the production architecture so that export revenue generation (O1) is no longer linearly dependent on workforce expansion or fossil-fuel energy consumption. This structural decoupling, driven by collaborative technology acquisition and inventive engineering, is the definitive solution to the sustainability paradox in the era of green trade barriers.

5.3. Managerial and Policy Implications: Strategic Roadmaps for Vietnamese Exporters

The empirical evidence generated by this study provides a clear mandate for both corporate executives and macroeconomic policymakers. Sustaining the industry’s historical 9.8% compound annual growth rate (CAGR) under the pressure of the impending Carbon Border Adjustment Mechanism (CBAM) requires a fundamental restructuring of resource utilization. The data proves that baseline sustainability reporting is no longer sufficient. Firms must actively decouple economic output from carbon and labor intensity through targeted, evidence-based interventions.
Managerial Implications: Precision Resource Optimization
At the corporate level, the BWM results established Energy Intensity as the definitive strategic priority, commanding 42.02% of the decision weight. The Super-SBM projection analysis corroborated this, revealing that zero-margin operators have no operational buffer against external energy price shocks. To survive impending CBAM mandates, these firms must urgently pivot toward precise physical engineering interventions. This requires transitioning to a specific list of energy system renovations that are well-suited to the Vietnamese textile sector, including installing waste-heat recovery systems, implementing reclaimed-water reuse networks, deploying distributed photovoltaic (solar) microgrids, and adopting low-temperature biological dyeing processes. These specific technologies serve as physical TRIZ solutions for building critical energy stability margins. However, while the current macro-benchmarking framework identifies the strategic necessity of these technologies, conducting granular techno-economic feasibility studies, including the calculation of specific Return on Investment (ROI) periods for these capital expenditures, relies on proprietary internal financial data. Therefore, such detailed ROI forecasting cannot be generalized through macro-level DEA and remains a critical directive for future firm-level engineering research.
Furthermore, the variance in labor stability margins signals a structural shift in the sector. To remain competitive in high-value markets, executives of zero-margin firms must direct capital toward digital manufacturing execution systems (MES), automated quality control, and industrial Internet of Things (IoT) sensors. By proactively optimizing workforce efficiency, these vulnerable firms can build the systemic operational buffers observed in highly resilient entities like TNG (DMU 5) and Thanh Cong (DMU 2).
Finally, corporate leaders must learn from the output resilience demonstrated by Century Synthetic Fiber (DMU 4). Green capital investments must be strictly integrated into the core product development lifecycle. This ensures that eco-certifications and environmental investments directly translate into deeply entrenched, high-margin export contracts in Western markets, thereby creating the massive revenue stability margins required to weather global supply chain disruptions.
Policy Implications: Institutional Support for the Green Transition
The structural bottlenecks identified in the slack analysis cannot be resolved by isolated corporate action alone. Policymakers and industry associations must provide targeted institutional support to facilitate this sector-wide transition. The capital asset slack and output shortfalls observed in certain mid-tier firms highlight a distinct lack of financial flexibility for upgrading green capabilities. State banks and governmental trade bodies should establish dedicated green credit lines and subsidized interest rates specifically earmarked for energy retrofitting and automation technology.
Additionally, the significant variance in the VIKOR ESG Index scores indicates sector-wide inconsistencies in sustainability data tracking and carbon accounting. To prepare the entire manufacturing base for full CBAM enforcement in 2026, policymakers must implement a standardized national carbon-tracking framework tailored to the textile supply chain. Establishing state-sponsored training programs for greenhouse gas (GHG) auditing will reduce information asymmetry. This structural support will equip both listed giants and smaller, non-listed enterprises with the technical capacity required to maintain their export volumes and preserve the sector’s economic growth trajectory in a heavily regulated global economy.

5.4. Limitations and Future Research Directions

While this study provides a robust empirical evaluation of the sustainability paradox in the Vietnamese textile sector, it acknowledges several methodological limitations that constrain the scope of its findings.
First, the empirical analysis relies on cross-sectional data extracted from the 2024 fiscal year. This establishes a static snapshot of corporate performance. Consequently, the current Super-SBM framework cannot capture dynamic learning curves or the temporal lag between initial capital investments in green technology (C2) and their subsequent yield in export revenues (O1).
Second, the sample size (n = 12) is restricted to publicly listed enterprises. While these entities dictate the macroeconomic trajectory and set export standards for the sector, they do not represent the entire supply chain. Small and medium enterprises (SMEs) constitute the vast majority of Vietnam’s production volume but were excluded due to the unavailability of standardized, verifiable ESG reporting. This boundary restricts the direct generalizability of the frontier benchmarks (such as DMU 11 and DMU 8) to smaller, non-listed operators possessing vastly different capital constraints.
Third, it is important to emphasize that while the non-radial slack analysis isolates precise target adjustments for underperforming firms, Data Envelopment Analysis measures relative operational efficiency with respect to an empirical frontier rather than establishing direct causal relationships. Therefore, performance deficits should be interpreted as diagnostic operational benchmarks rather than deterministic proofs of managerial failure.
Fourth, the VIKOR-derived ESG Index (O2) relies fundamentally on self-reported corporate disclosures and external audit reports. Despite the rigorous multi-criteria validation applied during the Best–Worst Method (BWM) phase, the raw environmental and social data remain susceptible to selective reporting biases and to varying degrees of institutional transparency across auditing bodies. It is important to emphasize that while the non-radial slack analysis successfully identifies precise adjustment potentials for underperforming firms, Data Envelopment Analysis fundamentally measures relative operational efficiency with respect to an empirical frontier, rather than establishing deterministic causal mechanisms between ESG performance and export success.
Finally, the scope of this study is limited to a single country and relies on subjective expert judgment during the initial BWM weighting phase. To advance the econometric modeling of green exports, future research should systematically address these constraints. Prioritizing the adoption of dynamic Data Envelopment Analysis models and conducting longitudinal analyses using multi-year panel datasets will be essential. A one-year cross-sectional analysis does not permit assessment of temporal stability, evolutionary trends, or the lagged effects of sustainable investments, making multi-period tracking a critical next step for future research. Furthermore, executing cross-country comparisons within the Southeast Asian manufacturing sector would highly improve the transparency and generalizability of the proposed framework.
To advance the econometric modeling of green exports, future research should systematically address these constraints and prioritize the adoption of dynamic analytical methodologies, such as the Malmquist Productivity Index (MPI) and Window Data Envelopment Analysis (DEA), to evaluate organizational efficiency over time. Longitudinal analyses using multi-year panel datasets are essential for capturing the evolving effects of regulatory interventions on firm performance. Such an approach is particularly relevant in the context of the European Union’s Carbon Border Adjustment Mechanism (CBAM), as the policy transitions from its current reporting stage to full financial enforcement in 2026. By tracking efficiency changes across multiple periods, researchers can better assess how firms adapt operationally and strategically to increasingly stringent carbon-related regulations.
Future research should also expand its analytical scope beyond focal firms to include Tier 2 and Tier 3 suppliers within broader industrial ecosystems. Moving from a conventional Super-SBM framework toward a Network DEA approach would enable scholars to evaluate the efficiency of interconnected supply chain systems rather than isolated organizational units. This methodological advancement would provide a more holistic understanding of carbon accountability throughout the supply chain and offer deeper insights into the effectiveness of Scope 3 emissions management practices. Such analyses are increasingly important as firms face growing pressure to ensure sustainability compliance across their entire production network.
Another promising avenue for future research is to incorporate explicit innovation-related variables into efficiency assessment models. Potential indicators may include digital maturity indices, technology transfer intensity, and TRIZ-oriented patent outputs, which could be integrated as intermediate variables within a two-stage DEA framework. This enhanced model structure would allow researchers to quantitatively isolate the mechanisms by which open innovation capabilities reduce non-radial inefficiencies in areas such as energy consumption and labor utilization. By examining the relationship between innovation capacity and operational efficiency, future studies can provide more precise explanations of how technological advancement supports sustainable industrial transformation.
Collectively, these proposed research directions would enable the academic community to move beyond merely identifying the sustainability paradox to developing scalable, evidence-based solutions for industrial decarbonization in emerging markets. By integrating dynamic efficiency analysis, supply chain network evaluation, and innovation-centered modeling, future scholarship can help formulate more effective strategies to achieve long-term sustainability and regulatory resilience.

Author Contributions

Conceptualization, N.T.M.V. and V.T.T.N.; methodology, N.T.M.V. and V.T.T.N.; software, N.T.M.V.; validation, N.T.M.V. and V.T.T.N.; formal analysis, N.T.M.V.; investigation, N.T.M.V. and V.T.T.N.; resources, V.T.T.N.; data curation, N.T.M.V.; writing—original draft preparation, N.T.M.V.; writing—review and editing, V.T.T.N.; visualization, N.T.M.V.; supervision, V.T.T.N.; project administration, N.T.M.V. and V.T.T.N. All authors have read and agreed to the published version of the manuscript.

Funding

There is no external financial support for this study.

Data Availability Statement

The original contributions presented in this study are included in the article. Further inquiries can be directed to the corresponding authors.

Acknowledgments

We would like to extend our gratitude to the Engineering Mathematics Research Group (EMRG) of the Industrial University of Ho Chi Minh City for the motivation that helped us complete this research. The authors thank the Industrial University of Ho Chi Minh City for their assistance. Additionally, we would like to thank the reviewers and editors for their constructive comments and suggestions for improving our work.

Conflicts of Interest

The authors state that there are no potential conflicts of interest. All authors have read and agreed to the published version of the article. The authors acknowledge the use of artificial intelligence to assist in the linguistic refinement and structural formatting of this article, to improve clarity and readability. All analytical synthesis, data validation, and empirical conclusions remain the sole responsibility of the authors, who are fully accountable for the integrity and accuracy of the final manuscript.

References

  1. Sadhna; Greeshma, S.; Kumar, R.; Mokanaasri, E. Introduction to the Asian Textile and Garment Industry. In Consumption and Production in the Textile and Garment Industry: A Comparative Study Among Asian Countries; Springer: Berlin/Heidelberg, Germany, 2024; pp. 1–15. [Google Scholar]
  2. Sadhna; Greeshma, S.; Kumar, R.; Mokanaasri, E. Future Outlook: Opportunities and challenges for the Asian textile and garment industry. In Consumption and Production in the Textile and Garment Industry: A Comparative Study Among Asian Countries; Springer: Berlin/Heidelberg, Germany, 2024; pp. 273–285. [Google Scholar]
  3. Ong, J.H.; Khatibi, A.; Mohd Talib, Z.; George, R.A. Ethical leadership in environmental, social and governance (ESG) adoption for Malaysian micro, small and medium enterprises (MSMEs). Int. J. Ethics Syst. 2025, 41, 657–684. [Google Scholar] [CrossRef] [Scilit]
  4. Do Thi, N.; Thi, N.H.N.; Thu, H.T.; Thi, T.T.T. The Impact of ESG Practices on Business Performance in Vietnam: A Study of the Textile and Garment Industry. Res. Rev. Int. J. Multidiscip. 2023, 8, 42–51. [Google Scholar] [CrossRef] [Scilit]
  5. Yu, H.; Ahn, M.; Han, E. Key driver of textile and apparel industry management: Fashion brand ESG and brand reputation. Front. Environ. Sci. 2023, 11, 1140004. [Google Scholar] [CrossRef] [Scilit]
  6. Shao, Y.; Zheng, M.; Xu, X.; Ji, X. Does ESG performance have an impact on firm value? Evidence from the Chinese textile and garment industry. Ind. Textila 2025, 76, 249–256. [Google Scholar] [CrossRef] [Scilit]
  7. Zhu, N.; Yang, J.; Agyemang, A.O. Unveiling sustainability: Tech-infused governance and ESG performance in textile industry. Bus. Ethics Environ. Responsib. 2025, 34, 1156–1170. [Google Scholar] [CrossRef] [Scilit]
  8. Mahmood, S.; Sun, H.; El-Kenawy, E.-S.M.; Iqbal, A.; Alharbi, A.H.; Khafaga, D.S. Integrating machine and deep learning technologies in green buildings for enhanced energy efficiency and environmental sustainability. Sci. Rep. 2024, 14, 20331. [Google Scholar] [CrossRef] [Scilit]
  9. Feng, Z.; Wu, Z. ESG disclosure, REIT debt financing and firm value. J. Real Estate Financ. Econ. 2023, 67, 388–422. [Google Scholar] [CrossRef] [Scilit]
  10. Mahanta, A.; Sahu, N.C.; Behera, P.K.; Kumar, P. Variations in financial performance of firms with ESG integration in business: The mediating role of corporate efficiency using DEA. Green Financ. 2024, 6, 518–562. [Google Scholar] [CrossRef] [Scilit]
  11. Schwoy, S.M.; Dutzi, A.; Messing, J. Silence is golden?–Analysing the transparency of ESG controversies in corporate reporting within the pharmaceutical and textile industry. Manag. Decis. 2025, 63, 665–707. [Google Scholar] [CrossRef] [Scilit]
  12. Kara, K.; Özyürek, H.; Yalçın, G.C. Evaluating ESG-based sustainability in software companies: A performance analysis using MPSI-OPLO-POCOD framework. Comput. Decis. Mak. Int. J. 2025, 2, 570–598. [Google Scholar] [CrossRef] [Scilit]
  13. Rezaei, J. Best-worst multi-criteria decision-making method. Omega 2015, 53, 49–57. [Google Scholar] [CrossRef] [Scilit]
  14. Mi, X.; Tang, M.; Liao, H.; Shen, W.; Lev, B. The state-of-the-art survey on integrations and applications of the best worst method in decision making: Why, what, what for and what’s next? Omega 2019, 87, 205–225. [Google Scholar] [CrossRef] [Scilit]
  15. Opricovic, S.; Tzeng, G.-H. Compromise solution by MCDM methods: A comparative analysis of VIKOR and TOPSIS. Eur. J. Oper. Res. 2004, 156, 445–455. [Google Scholar] [CrossRef] [Scilit]
  16. Opricovic, S. Fuzzy VIKOR with an application to water resources planning. Expert Syst. Appl. 2011, 38, 12983–12990. [Google Scholar] [CrossRef] [Scilit]
  17. Mardani, A.; Zavadskas, E.K.; Govindan, K.; Amat Senin, A.; Jusoh, A. VIKOR technique: A systematic review of the state of the art literature on methodologies and applications. Sustainability 2016, 8, 37. [Google Scholar] [CrossRef] [Scilit]
  18. Tone, K. A slacks-based measure of efficiency in data envelopment analysis. Eur. J. Oper. Res. 2001, 130, 498–509. [Google Scholar] [CrossRef] [Scilit]
  19. Tone, K. Slacks-based measure of efficiency. In Handbook on Data Envelopment Analysis; Springer: Berlin/Heidelberg, Germany, 2011; pp. 195–209. [Google Scholar]
  20. Tone, K. Super-efficiency DEA models. In Advances in DEA Theory and Applications: With Extensions to Forecasting Models; John Wiley & Sons: Hoboken, NJ, USA, 2017; pp. 28–32. [Google Scholar]
  21. Shah, W.U.H.; Hao, G.; Yan, H.; Yasmeen, R. Efficiency evaluation of commercial banks in Pakistan: A slacks-based measure Super-SBM approach with bad output (Non-performing loans). PLoS ONE 2022, 17, e0270406. [Google Scholar] [CrossRef] [Scilit]
  22. Wu, Q.; Zhou, L.; Chen, Y.; Chen, H. An integrated approach to green supplier selection based on the interval type-2 fuzzy best-worst and extended VIKOR methods. Inf. Sci. 2019, 502, 394–417. [Google Scholar] [CrossRef] [Scilit]
  23. Celik, E.; Yucesan, M.; Gul, M. Green supplier selection for textile industry: A case study using BWM-TODIM integration under interval type-2 fuzzy sets. Environ. Sci. Pollut. Res. 2021, 28, 64793–64817. [Google Scholar] [CrossRef] [Scilit]
  24. Hoang, P.-D.; Nguyen, L.-T.; Tran, B.-Q. Assessing environmental, social and governance (ESG) performance of global electronics industry: An integrated MCDM approach-based spherical fuzzy sets. Cogent Eng. 2024, 11, 2297509. [Google Scholar] [CrossRef] [Scilit]
  25. Yu, K.; Wu, Q.; Chen, X.; Wang, W.; Mardani, A. An integrated MCDM framework for evaluating the environmental, social, and governance (ESG) sustainable business performance. Ann. Oper. Res. 2024, 342, 987–1018. [Google Scholar] [CrossRef] [Scilit]
  26. Tan, Y.; Karbassi Yazdi, A.; Antunes, J.; Wanke, P.; Gunasekaran, A.; Corrêa, H.L.; Coluccio, G. The quest for an ESG country rank: A performance contribution analysis/MCDM approach. Mathematics 2024, 12, 1865. [Google Scholar] [CrossRef] [Scilit]
  27. Lombardi Netto, A.; Salomon, V.A.; Ortiz-Barrios, M.A. An environmental, social, and governance (ESG) model for multiple criteria analysis of investments. Int. Trans. Oper. Res. 2026, 33, 489–506. [Google Scholar] [CrossRef] [Scilit]
  28. Zhu, S.; Lu, Y.; Zhou, X.; Zhang, L. Sustainability Under Pressure: Evaluating the Effect of Short-Term Inhibition of EU CBAM on the ESG-Based Environmental Performance of China’s High-Carbon Industries. Sustainability 2026, 18, 4067. [Google Scholar] [CrossRef] [Scilit]
  29. Pratiwi, R.; Harahap, K.; Misrina; Widyastuti, T.V.; Kalsum, U. Environmental, Social and Governance (ESG)-Based Governance Model for Digital-First Organizations: A Comparative Study in Java and ASEAN Regions Using the Fuzzy-MCDM Method. In Computational Intelligence for Business Analytics and Decision Systems; Springer: Berlin/Heidelberg, Germany, 2026; pp. 425–438. [Google Scholar]
  30. Golany, B.; Roll, Y. An application procedure for DEA. Omega 1989, 17, 237–250. [Google Scholar] [CrossRef] [Scilit]
  31. Hu, J.-L.; Wang, S.-C. Total-factor energy efficiency of regions in China. Energy Policy 2006, 34, 3206–3217. [Google Scholar] [CrossRef] [Scilit]
  32. Sueyoshi, T.; Goto, M. Data envelopment analysis for environmental assessment: Comparison between public and private ownership in petroleum industry. Eur. J. Oper. Res. 2012, 216, 668–678. [Google Scholar] [CrossRef] [Scilit]
  33. Zhou, P.; Ang, B.W.; Poh, K.L. Measuring environmental performance under different environmental DEA technologies. Energy Econ. 2008, 30, 1–14. [Google Scholar] [CrossRef] [Scilit]
  34. Zhang, B.; Bi, J.; Fan, Z.; Yuan, Z.; Ge, J. Eco-efficiency analysis of industrial system in China: A data envelopment analysis approach. Ecol. Econ. 2008, 68, 306–316. [Google Scholar] [CrossRef] [Scilit]
  35. Zhang, J.; Liu, Y.; Chang, Y.; Zhang, L. Industrial eco-efficiency in China: A provincial quantification using three-stage data envelopment analysis. J. Clean. Prod. 2017, 143, 238–249. [Google Scholar] [CrossRef] [Scilit]
  36. Färe, R.; Grosskopf, S.; Lovell, C.K.; Pasurka, C. Multilateral productivity comparisons when some outputs are undesirable: A nonparametric approach. Rev. Econ. Stat. 1989, 71, 90–98. [Google Scholar] [CrossRef] [Scilit]
  37. Watanabe, M.; Tanaka, K. Efficiency analysis of Chinese industry: A directional distance function approach. Energy Policy 2007, 35, 6323–6331. [Google Scholar] [CrossRef] [Scilit]
  38. Li, Y.; Zhang, Q.; Wang, L.; Liang, L. Regional environmental efficiency in China: An empirical analysis based on entropy weight method and non-parametric models. J. Clean. Prod. 2020, 276, 124147. [Google Scholar] [CrossRef] [Scilit]
  39. Li, H.; Shi, J.-F. Energy efficiency analysis on Chinese industrial sectors: An improved Super-SBM model with undesirable outputs. J. Clean. Prod. 2014, 65, 97–107. [Google Scholar] [CrossRef] [Scilit]
  40. Huang, S. The comprehensive environmental efficiency analysis based on a new data envelopment analysis: The super slack based measure network three-stage data envelopment analysis approach. J. Clean. Prod. 2023, 400, 136689. [Google Scholar] [CrossRef] [Scilit]
  41. Rezaei, J.; Kothadiya, O.; Tavasszy, L.; Kroesen, M. Quality assessment of airline baggage handling systems using SERVQUAL and BWM. Tour. Manag. 2018, 66, 85–93. [Google Scholar] [CrossRef] [Scilit]
Figure 1. Research Methodology BWM-VIKOR-DEA SBM Hybrid Framework.
Algorithms 19 00726 g001
Figure 2. Conceptual Input–Output Framework of the Proposed DEA Model.
Algorithms 19 00726 g002
Figure 3. VIKOR Results for all alternatives.
Algorithms 19 00726 g003
Table 1. DMUs List.
Table 1. DMUs List.
DMUCompany NameTicker
DMU1Vietnam National Textile & Garment GroupVGT
DMU2Thanh Cong Textile Garment Investment Trading JSCTCM
DMU3Song Hong Garment JSCMSH
DMU4Century Synthetic Fiber CorporationSTK
DMU5TNG Investment and Trading JSCTNG
DMU6Binh Thanh Import Export Production and Trade JSCGIL
DMU7Viet Tien Garment CorporationVGG
DMU8Binh Duong Garment JSCBDG
DMU9Hoa Tho Textile—Garment JSCHTG
DMU10Garment 10 Corporation—JSCM10
DMU11Tien Son Thanh Hoa JSCAAT
DMU12Viet Thang CorporationTVT
Table 2. Literature Validation of Input–Output Variables in Environmental DEA.
Research Title (Author, Year)InputsOutputsResearch Field
“Total-factor energy efficiency of regions in China” [31]Labor, capital stock, energy consumption, and total sown area of farm cropsReal Gross Domestic Product (GDP)Energy Economics
“Data envelopment analysis for environmental assessment: Comparison between public and private ownership in the petroleum industry” [32]Amount of oil reserve, amount of gas reserve, total operating cost, and number of employees.Amount of oil production and gas production (Desirable), CO2 Emissions (Undesirable)Corporate Sustainability
“Measuring environmental performance under different environmental DEA technologies” [33]Total energy consumption (Mtoe)GDP, CO2 emissionsEnergy
“Eco-efficiency analysis of industrial system in China: A data envelopment analysis approach” [34]Water resources, raw mining resources, and energyValue-added of industry (desirable), Chemical Oxygen Demand discharge, nitrogen discharge, SO2 emission, soot emission, dust emission, and industrial solid wastes produced (Undesirable)Ecological Economics
“Industrial eco-efficiency in China: A provincial quantification using three-stage data envelopment analysis” [35]Capital Stock, Labor, Energy Consumption, SO2 emissionGross industrial output valueEnvironmental Management
“Multilateral productivity comparisons when some outputs are undesirable: a nonparametric approach” [36]Fiber inputs (pulp), Energy inputs, Capital, and Labor.Paper and pulp output (Desirable), Biochemical oxygen demand, total suspended solids, sulfur oxides, and particulates (Undesirable)Productivity and Efficiency Analysis
“Efficiency analysis of Chinese industry: A directional distance function approach” [37]Capital Stock, Labor, and Energy ConsumptionIndustrial Output Value, SO2 EmissionsIndustrial Operations
“Regional environmental efficiency in China: An empirical analysis based on entropy weight method and non-parametric models” [38]Employed population (labor), fixed capital investment, and energy consumption.GDP (Desirable); SO2, NOx, and Smoke & Dust (S&D) emissions (Undesirable)Environmental Economics
“Energy efficiency analysis of Chinese industrial sectors: An improved Super-SBM model with undesirable outputs” [39]Capital, Labor, Energy ConsumptionIndustrial Value Added, Waste and EmissionsIndustrial Engineering
“The comprehensive environmental efficiency analysis based on a new data envelopment analysis: The super slack based measure network three-stage data envelopment analysis approach” [40]Built-up area, Labor, Capital, energy resource, and Water resource.Local GDP, SO2 and dust emission.Environmental Management
This researchTotal Assets, Total Employees, Energy CostExport Revenue, ESG IndexTextile and Garment, Environmental Economics
Table 3. The 1 to 9 Linguistic Evaluation Scale for BWM.
Linguistic TermNumerical ValueExplanation
Equal importance1The two criteria contribute equally to the objective.
Moderate importance3Experience and judgment slightly favor one criterion over another.
Strong importance5Experience and judgment strongly favor one criterion over another.
Very strong importance7One criterion is strongly favored, and its dominance is demonstrated in practice.
Extreme importance9The evidence favoring one criterion over another is of the highest possible order of affirmation.
Intermediate values2, 4, 6, 8Used to represent a compromise between the priorities listed above when a nuanced judgment is needed.
Table 4. Pearson correlation.
CorrelationDegree of Correlation
>0.8Very High
0.6–0.8High
0.4–0.6Medium
0.2–0.4Low
<0.2Very low
Table 5. The Importance Weights of the Six ESG Criteria (C1–C6).
CriteriaDefinitionBWM Optimal Weight
C1Energy Intensity42.02%
C2Green Investment16.81%
C3Average Labor Income16.81%
C4Social Welfare Ratio10.08%
C5Audit Transparency10.08%
C6Board Independence4.20%
Table 6. Calculated VIKOR Scores and the Final ESG Index (O2).
DMUUtility (Si)Regret (Ri)Compromise (Qi)Final ESG Index (O2)
DMU 10.58750.26980.6130.387
DMU 20.40370.19170.41660.5834
DMU 30.20180.11160.2080.792
DMU 40.9580.420210
DMU 50.03220.017901
DMU 60.29010.13880.28950.7105
DMU 70.10720.0530.08410.9159
DMU 80.22430.09990.20570.7943
DMU 90.41870.18880.42110.5789
DMU 100.77910.34310.80750.1925
DMU 110.2290.12790.2430.757
DMU 120.59790.28030.63160.3684
Table 7. Pearson Correlation Matrix for DEA Variables.
VariableI1I2I3O1O2
I110.9173−0.21550.8131−0.1426
I20.91731−0.29880.91950.0269
I3−0.2155−0.29881−0.05610.0625
O10.81310.9195−0.056110.2034
O2−0.14260.02690.06250.20341
Table 8. Super-SBM-V Efficiency Scores, Rankings, and Reference Sets.
RankDMUCompany NameScoreReference Set
1DMU 1Vietnam National Textile & Garment Group (VGT)18.6729DMU 11 (1.000)
2DMU 4Century Synthetic Fiber Corp (STK)1.5106DMU 12 (1.000)
3DMU 11Tien Son Thanh Hoa JSC1.3876DMU 8 (0.771), DMU 12 (0.229)
4DMU 8Binh Duong Garment JSC1.3508DMU 7 (0.053), DMU 11 (0.947)
5DMU 3Song Hong Garment JSC1.3454DMU 9 (0.999), DMU 11 (0.001)
6DMU 12Viet Thang Corporation1.325DMU 11 (1.000)
7DMU 7Viet Tien Garment Corporation1.1498DMU 1 (0.120), DMU 3 (0.280), DMU 5 (0.270), DMU 8 (0.330)
8DMU 10Garment 10 Corporation1.0803DMU 2 (0.083), DMU 3 (0.045), DMU 5 (0.208), DMU 8 (0.664)
9DMU 5TNG Investment and Trading JSC1.0664DMU 7 (1.000)
10DMU 2Thanh Cong Textile Garment (TCM)1.0606DMU 5 (0.060), DMU 8 (0.438), DMU 10 (0.502)
11DMU 6Binh Thanh Import Export1.0063DMU 8 (0.002), DMU 11 (0.855), DMU 12 (0.143)
12DMU 9Hoa Tho Textile—Garment JSC1DMU 3 (1.000)
Table 9. Super-SBM Efficiency Scores, Rankings, and Input–Output Projections (Phase 3).
No.DMUScoreRankTotal AssetTotal EmployeesEnergy CostExport RevenueESG Index
DataDiff. (%)DataDiff. (%)DataDiff. (%)DataDiff. (%)DataDiff. (%)
1DMU118.6729118,257,491.0-61,428.0-1259.0-11,234,332.0-0.4-
2DMU21.06064103,220,673.0-6164.017.2233,918.0-3,457,653.0-0.6-
3DMU31.3454254085.3-11,238.03.4145,722.012.03,562,194.0-0.8-
4DMU41.5105823,805,244.0-832.0117.0231,861.0-456,241.0−230.3--
5DMU51.0663695,816,875.0-19,052.018.7311,071.0-7,655,753.0-1.0−3.5
6DMU61.00629113,262,219.0-1500.01.9168,979.0-628,186.0-0.7-
7DMU71.1497774,978,711.0-20,145.0-126,980.020.86,756,124.0-0.9-
8DMU81.3508241,218,441.04.13895.0-29,742.01.51,802,730.0-0.8-
9DMU91122508.862.810,518.06.8148,243.0-2,434,965.0−46.30.6−36.8
10DMU101.0802682,288,750.0-7575.0-110,603.0-3,805,420.0-0.2−325.7
11DMU111.3876331,011,341.0-1565.0-23,570.0-552,233.0−40.80.8-
12DMU121.3249561,189,231.0-1139.056.6114,717.0-1,011,086.0-0.4−130.2
Average2.6636.53,754,630.85.612,087.618.5137,222.12.93,613,076.4−26.40.6−41.4
Max18.67291218,257,491.062.861,428.0117.0311,071.020.811,234,332.0-1.0-
Min112508.8-832.0-1259.0-456,241.0−230.3-−325.7
St Dev5.04473.60564,930,861.218.116,903.635.092,445.16.63,358,149.666.40.397.2
Table 10. Super-SBM Non-Radial Slack Projections.
RankDMUCompany NameScoreI1I2I3O1O2
1DMU 1Vietnam National Textile (VGT)18.672900000
2DMU 4Century Synthetic Fiber (STK)1.51060973.201,050,804.220.493
3DMU 11Tien Son Thanh Hoa JSC1.3876000225,136.490
4DMU 8Binh Duong Garment JSC1.350849,753.850434.100
5DMU 3Song Hong Garment JSC1.34540382.7317,416.4100
6DMU 12Viet Thang Corporation1.32500644.59000.48
7DMU 7Viet Tien Garment Corp1.14980026,461.5600
8DMU 10Garment 10 Corporation1.080300000.627
9DMU 5TNG Investment & Trading1.066403557.04000.035
10DMU 2Thanh Cong Textile (TCM)1.060601057.17000
11DMU 6Binh Thanh Import Export1.0063028.13000
12DMU 9Hoa Tho Textile—Garment1.00001576.5272001,127,229.000.213
Disclaimer/Publisher’s Note: The statements, opinions and data contained in all publications are solely those of the individual author(s) and contributor(s) and not of MDPI and/or the editor(s). MDPI and/or the editor(s) disclaim responsibility for any injury to people or property resulting from any ideas, methods, instructions or products referred to in the content.