1. Introduction
The rapid transition toward cleaner and more intelligent energy systems has accelerated the deployment of Smart Grid technologies and Renewable Energy Sources (RESs) in modern electricity networks. Unlike conventional power systems, smart grids incorporate advanced sensing, communication, automation, and control technologies that enable real-time coordination between electricity generation and consumption [
1]. This capability has become increasingly important due to the growing penetration of renewable energy and the widespread adoption of EVs, both of which introduce variability and uncertainty into the power system [
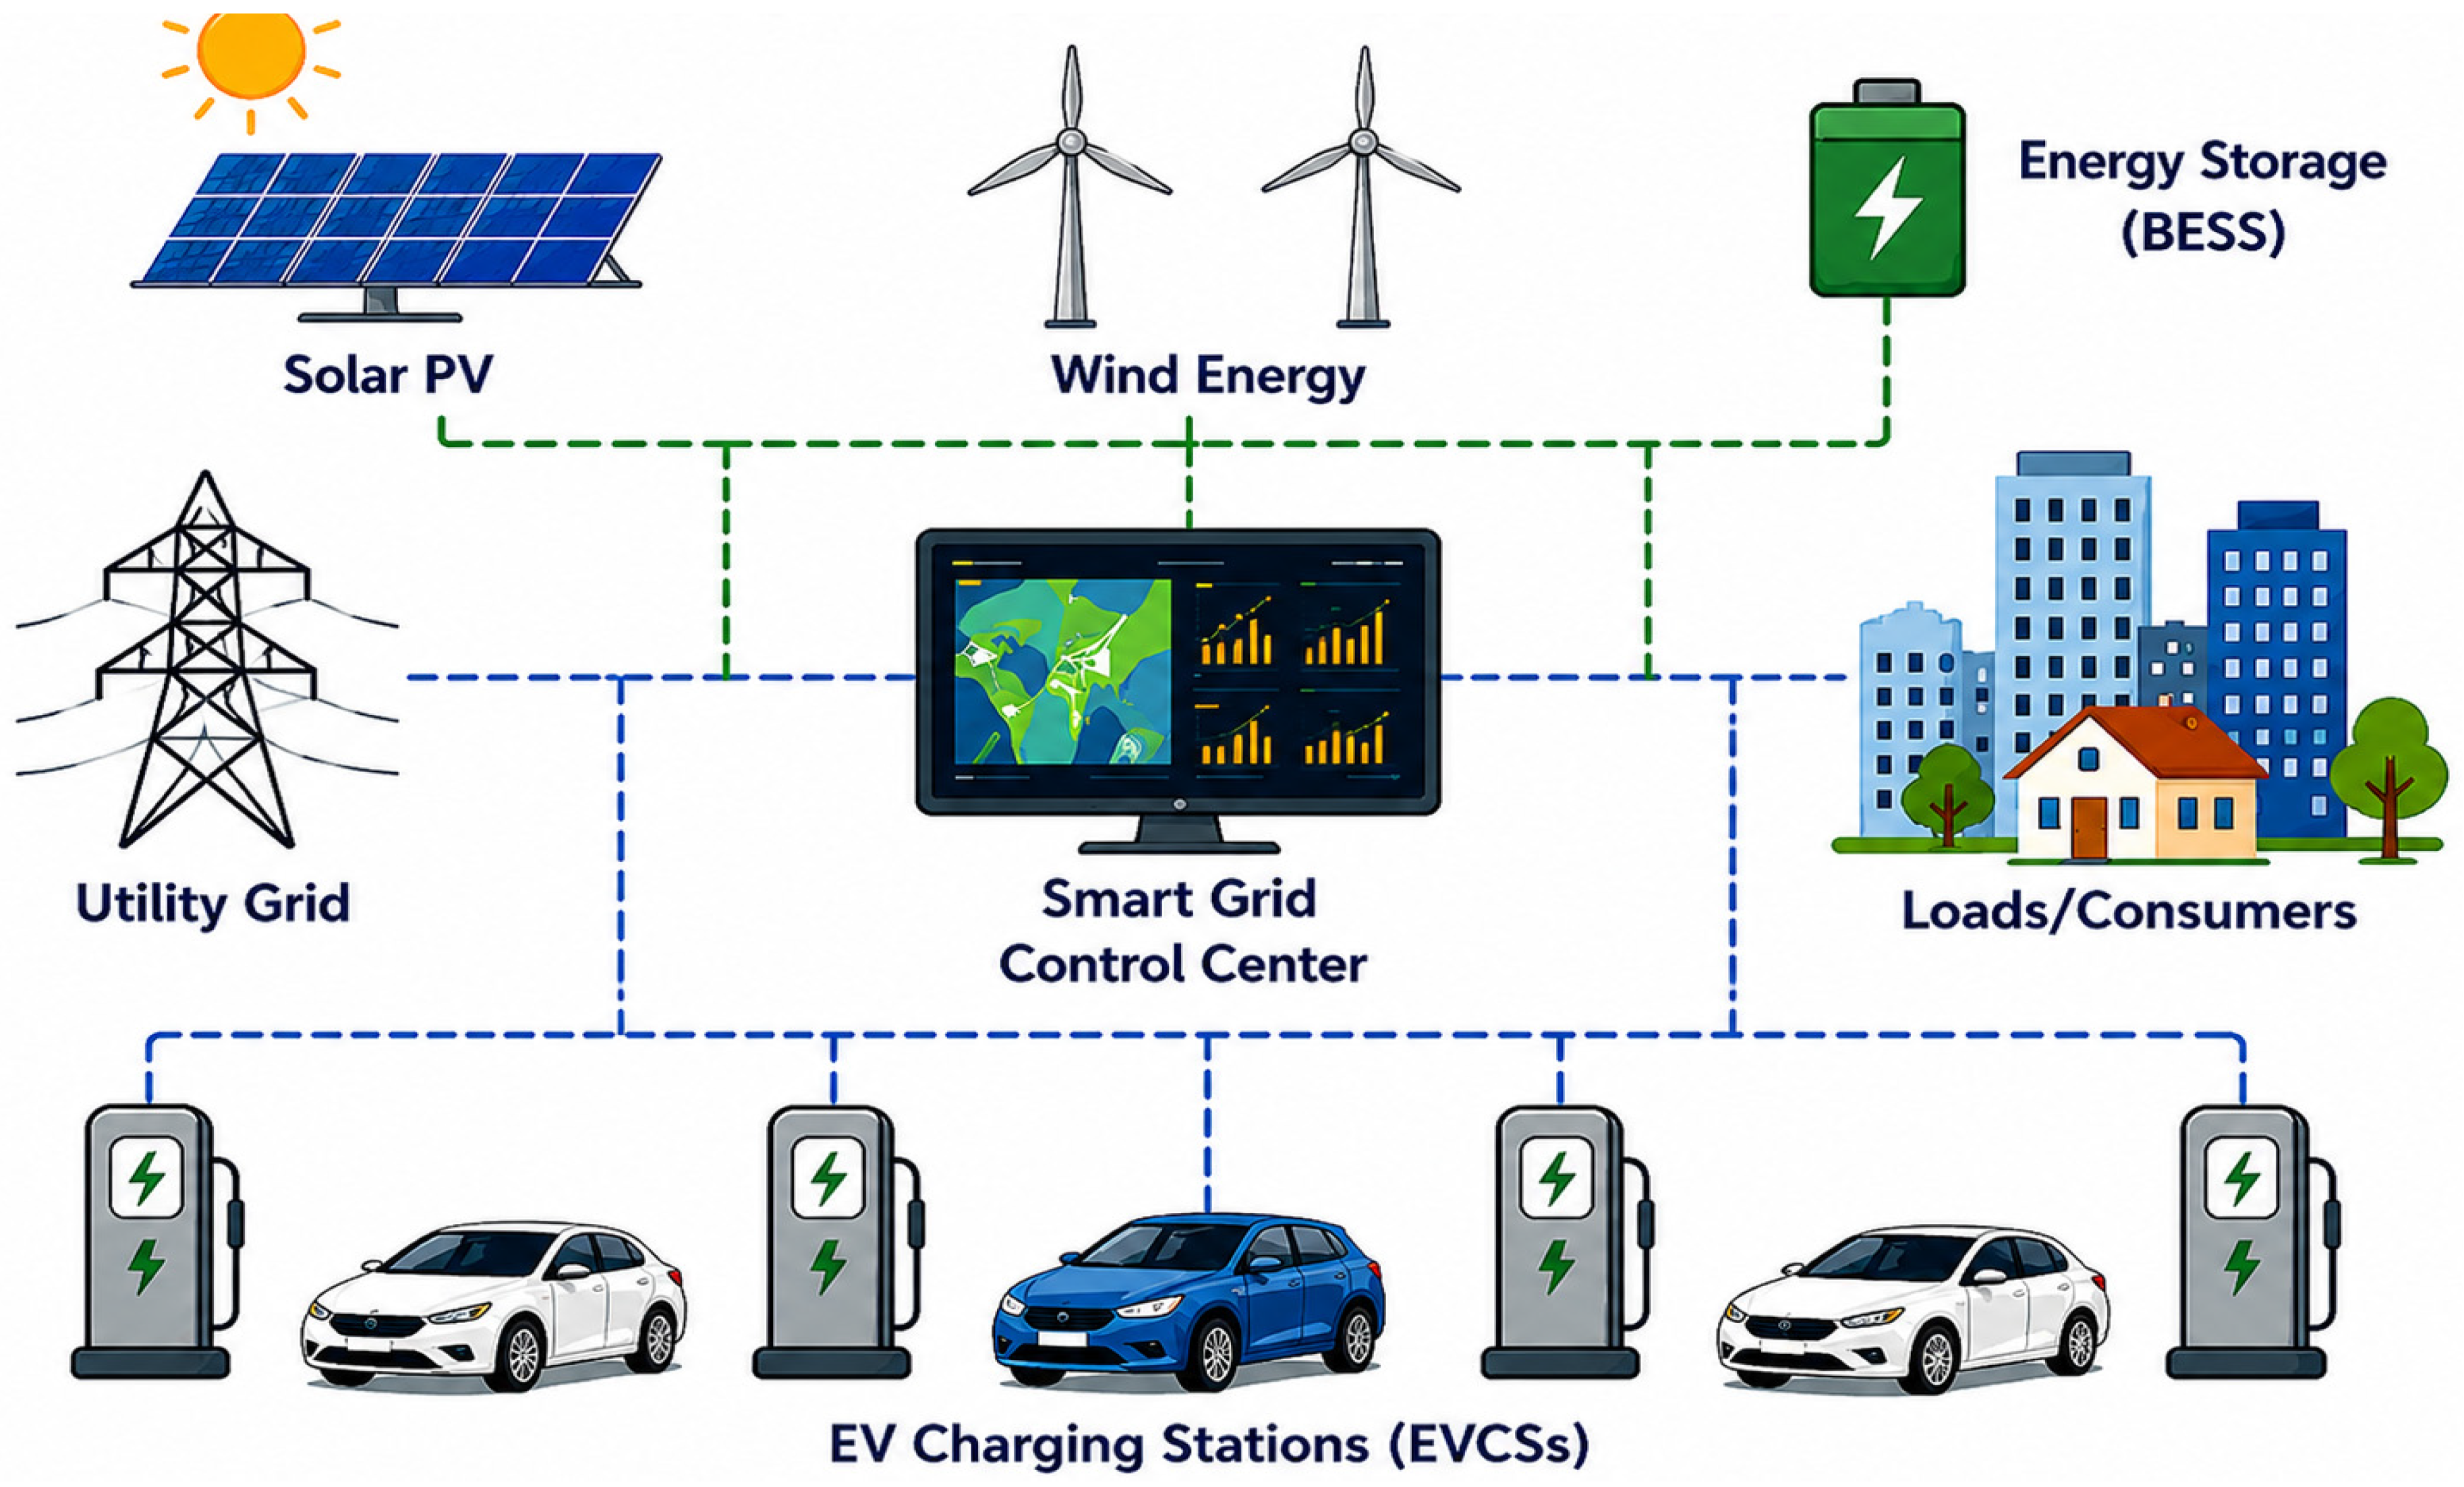
2]. The increasing number of EVs has resulted in a substantial rise in charging demand, creating challenges related to voltage instability, peak load increase, network congestion, and energy management. Uncoordinated EV charging can overload distribution networks and reduce overall grid efficiency, particularly during periods of high electricity demand. To address these challenges, intelligent EVCSs integrated with renewable energy technologies such as solar photovoltaic and wind systems have emerged as an effective solution. These charging infrastructures enable optimized charging operations by dynamically balancing energy demand, renewable power availability, and grid operating conditions [
3]. Furthermore, intelligent EVCSs support demand-side management strategies by scheduling charging activities according to electricity prices, user preferences, and grid constraints. The integration of battery energy storage systems enhances operational flexibility by storing excess renewable energy for later use during peak demand periods. Such coordinated operation minimizes transmission losses, reduces operational costs, and contributes to lower greenhouse gas emissions and improved energy sustainability [
4,
5]. In addition, smart charging technologies enhance user convenience through fast charging capabilities, adaptive scheduling, and efficient load-sharing mechanisms. Consequently, the integration of smart grids, RESs, and intelligent EVCSs represents a promising pathway toward sustainable transportation systems, low-carbon energy infrastructure, and efficient energy management in future power networks.
This study develops a hybrid GOA–HMGIGCN energy management framework for intelligent integration of EVCSs in Smart Grid settings with Renewable Energy Sources. EV charging coordination, renewable energy intermittency, operational cost, and grid stability are addressed by the GOA and HMGIGCN. This approach uses GOA to optimize EVCS placement and charging schedules to increase resource use, charging congestion, and network power distribution. Combining hierarchical temporal and spatial relationships in the smart grid architecture, HMGIGCN reliably predicts future energy demand, renewable generation patterns, and EV charging behavior. The framework reduces operational costs, charge duration, greenhouse gas emissions, and system power losses while boosting energy efficiency, voltage stability, and grid reliability. In addition, cognitive optimization and deep learning improve energy management system flexibility to changing load conditions and renewable energy generation. MATLAB/Simulink is used to develop, implement, and evaluate the suggested model for reliable and sustainable smart grid operation. It is compared to numerous state-of-the-art methodologies. This paper continues as follows. Smart grid energy management, EVCS integration, renewable energy coordination, and optimization-based control strategies are thoroughly reviewed in
Section 2. The system architecture, optimization technique, and predictive learning framework of the GOA–HMGIGCN methodology are described in
Section 3.
Section 4 covers system performance assessments, simulation environment, modeling parameters, datasets, and evaluation measures.
Section 5 compares operational cost, charging time, emissions, energy efficiency, and power losses from simulations.
Section 6 summarizes the study’s findings and makes recommendations for intelligent renewable-integrated smart grid system research and deployment.
3. Intelligent Optimization and Deep Learning Techniques for EVCS Energy Management
Recent studies have demonstrated that the integration of optimization algorithms and deep learning techniques can significantly improve energy management performance in Smart Grid environments incorporating Renewable Energy Sources (RESs) and EVCSs [
17]. Existing research has focused on improving charging coordination, renewable energy utilization, power distribution, and grid stability through intelligent control and predictive energy management frameworks. Optimization-based techniques are widely employed to determine optimal EVCS placement and charging scheduling within smart grid networks [
18,
19]. These approaches are designed to minimize operational cost, charging congestion, and system power losses while improving voltage stability and energy efficiency. Metaheuristic optimization algorithms have shown strong performance in solving nonlinear and multi-objective optimization problems associated with EV charging coordination and renewable energy integration [
20]. These methods can teach complex spatial and temporal relationships among grid components, EV charging behavior, and renewable energy generation patterns. Intelligent predictive frameworks improve charging coordination and energy distribution by accurately forecasting future energy demand and renewable availability [
21].
Despite these advantages, some existing deep learning approaches suffer from high computational complexity and limited scalability in large interconnected smart grid systems. To overcome these limitations, hybrid frameworks combining optimization algorithms with intelligent predictive learning models have recently emerged as promising solutions for smart grid energy management [
22]. Motivated by these advancements, this study proposes a hybrid GOA–HMGIGCN framework that integrates the GOA with the HMGIGCN to achieve intelligent EVCS coordination, efficient energy allocation, reduced operational cost, minimized power losses, and improved grid stability in renewable-integrated smart grid environments [
23].
Table 1 presents a comparison of recent optimization and deep learning-based approaches used for energy management in smart grids integrated with EVCSs and Renewable Energy Sources (RESs). The comparison highlights the application areas, advantages, and limitations of existing techniques, demonstrating the need for a hybrid intelligent framework capable of improving charging coordination, energy efficiency, grid reliability, and renewable energy utilization under dynamic operating conditions.
- (a)
Research Motivation and Identified Research Gaps in Intelligent Smart Grid Energy Management
Notwithstanding the considerable advancements made in intelligent energy management for Smart Grid systems incorporating RESs and EVCSs, numerous research issues persist unaddressed. Current research has predominantly concentrated on either optimization-based methods or prediction-based models in isolation, with minimal incorporation of intelligent optimization and deep learning techniques within a cohesive energy management framework [
38]. Numerous optimization algorithms exhibit robust efficacy in the placement of EVCS and the scheduling of charging; yet they frequently encounter challenges in adjusting to swiftly fluctuating charging demand, the intermittency of renewable energy, and real-time grid operational conditions [
39]. Likewise, deep learning and neural network methodologies have demonstrated significant potential in predicting energy demand, renewable generation, and electric vehicle charging patterns. Nonetheless, numerous current models exhibit elevated computational complexity, diminished scalability, and restricted ability to capture intricate spatial and temporal interactions inside extensive interconnected smart grid systems. Moreover, several contemporary methodologies predominantly emphasize single-objective optimization, such as cost reduction or charging coordination, while overlooking other critical elements such power losses, emissions mitigation, renewable energy integration, and grid resilience [
40].
A significant constraint noted in the literature is the inadequate coordination among electric vehicle charging operations, renewable energy integration, battery energy storage systems, and utility grid interactions. Disorganized charging and variable renewable generation can result in voltage instability, elevated operational expenses, network congestion, and suboptimal energy consumption [
41,
42]. Moreover, numerous current frameworks lack the ability to facilitate adaptive real-time decision-making in the face of dynamic operating conditions and unpredictable EV charging behavior. This paper presents a hybrid GOA–HMGIGCN framework for intelligent energy management in smart grid systems that incorporate EVCSs and RESs, motivated by existing limits. The suggested framework integrates the optimization proficiency of the GOA with the prediction acumen of the HMGIGCN [
43]. The amalgamation of these methodologies facilitates optimal EVCS placement, dynamic charging scheduling, precise forecasting of energy consumption and renewable generation, and enhanced coordination among smart grid elements. The suggested framework seeks to diminish operational costs, charging durations, emissions, and power losses, while simultaneously improving energy efficiency, renewable energy deployment, and overall grid stability across diverse operating situations
4. System Model and Problem Formulation
This section delineates the comprehensive system architecture, mathematical formulation, proposed GOA–HMGIGCN algorithm, testing environment, and operational parameters employed for intelligent energy management in Smart Grid systems incorporating RESs and EVCSs [
44]. The proposed framework integrates optimization and deep learning methodologies to enhance charging coordination, renewable energy use, grid stability, and overall system efficiency across diverse operating situations [
45].
- (a)
Test System Overview
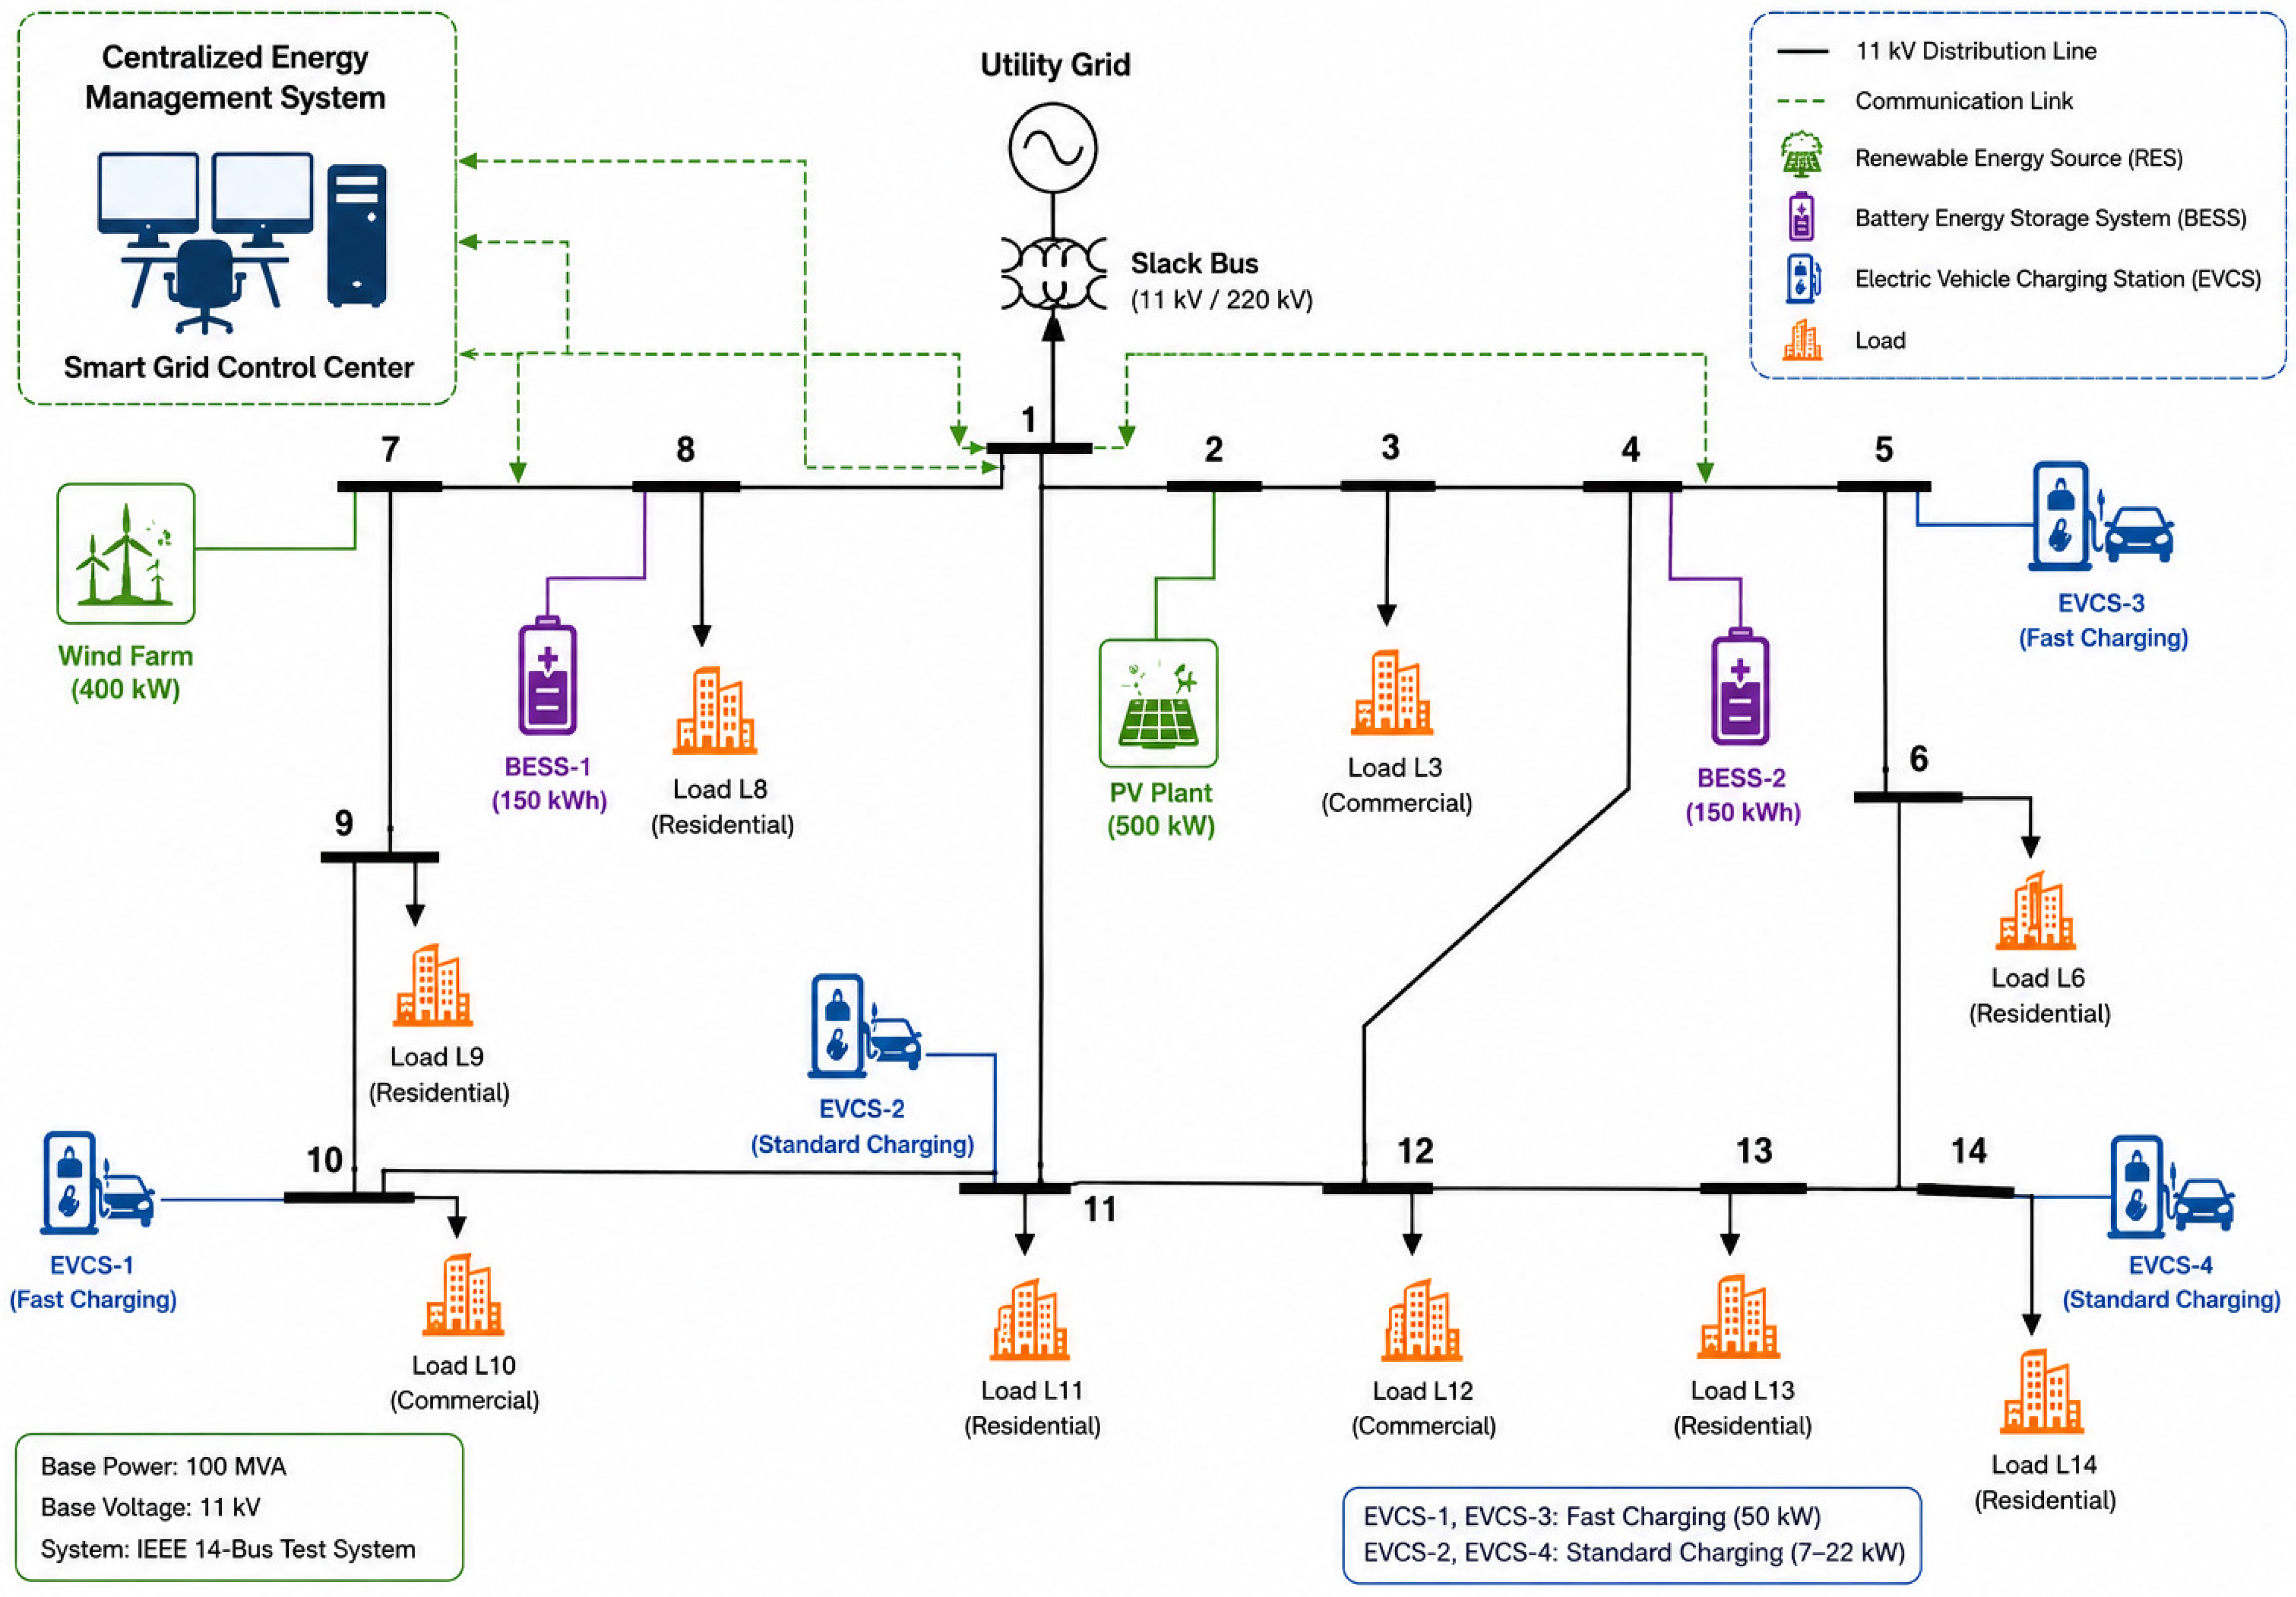
The proposed framework is evaluated using the IEEE 14-bus test system integrated with renewable energy generation units, EVCS infrastructure, and battery storage systems shown in
Figure 2. The IEEE 14-bus system is selected because of its suitability for evaluating energy management, load balancing, and power flow coordination in modern smart grid environments [
46]. The test system consists of interconnected buses, transmission lines, distributed loads, EV charging stations, renewable generation units, and a centralized smart grid control centre. The utility grid operates as the primary power source connected through the slack bus, while renewable energy sources consisting of photovoltaic (PV) and wind energy systems provide supplementary clean energy generation. Battery Energy Storage Systems (BESSs) are integrated at selected buses to store surplus renewable energy and provide backup support during peak demand conditions. Multiple EVCSs are connected to the network to support coordinated charging operations for electric vehicles under varying charging demand conditions. Residential and commercial loads are distributed across the buses to represent practical smart grid operating conditions. The proposed IEEE 14-bus smart grid test system includes 14 buses and interconnected transmission lines, 4 EV charging stations, 2 battery energy storage systems, Solar photovoltaic generation system, Wind energy generation system, Residential and commercial load buses, and Centralized smart grid energy management controller. The smart grid control centre continuously monitors energy demand, charging requests, renewable generation availability, and system operating conditions to ensure reliable and balanced power distribution throughout the network.
- (b)
Simulation Parameters and Testing Samples
The proposed GOA–HMGIGCN framework is evaluated using the IEEE 14-bus Smart Grid test system under multiple operating scenarios to assess its effectiveness in intelligent energy management and EV charging coordination. The simulation studies are performed in MATLAB/Simulink R2024a by considering practical smart grid operating conditions, including peak load periods, fluctuating renewable energy generation, varying EV charging demands, and dynamic battery storage operation. Different charging scenarios are analyzed to evaluate the adaptability and stability of the proposed framework under uncertain operating environments. The testing samples include residential and commercial load variations, intermittent photovoltaic and wind power generation, fast and standard EV charging operations, and varying State of Charge (SOC) conditions for battery energy storage systems. Furthermore, the proposed framework is compared with existing energy management approaches to evaluate improvements in operational cost reduction, charging efficiency, power loss minimization, renewable energy utilization, and overall grid reliability. The detailed simulation parameters used in this study are summarized in
Table 2.
- (c)
Photovoltaic Power Model
The output power generated by the photovoltaic system is expressed as:
where
is the PV panel area.
is solar irradiance.
is cell temperature.
is reference temperature.
: PV efficiency.
: PV temperature coefficient.
- (d)
Wind Energy Model
The wind turbine output power is modelled as:
where
- (e)
Battery Energy Storage System Model
The battery state of charge (SOC) is calculated as:
where
- (f)
EV Charging Demand Model
The EV charging demand is represented as:
where
is the number of Evs.
is required charging energy.
is charging duration.
5. Proposed GOA–HMGIGCN Algorithm
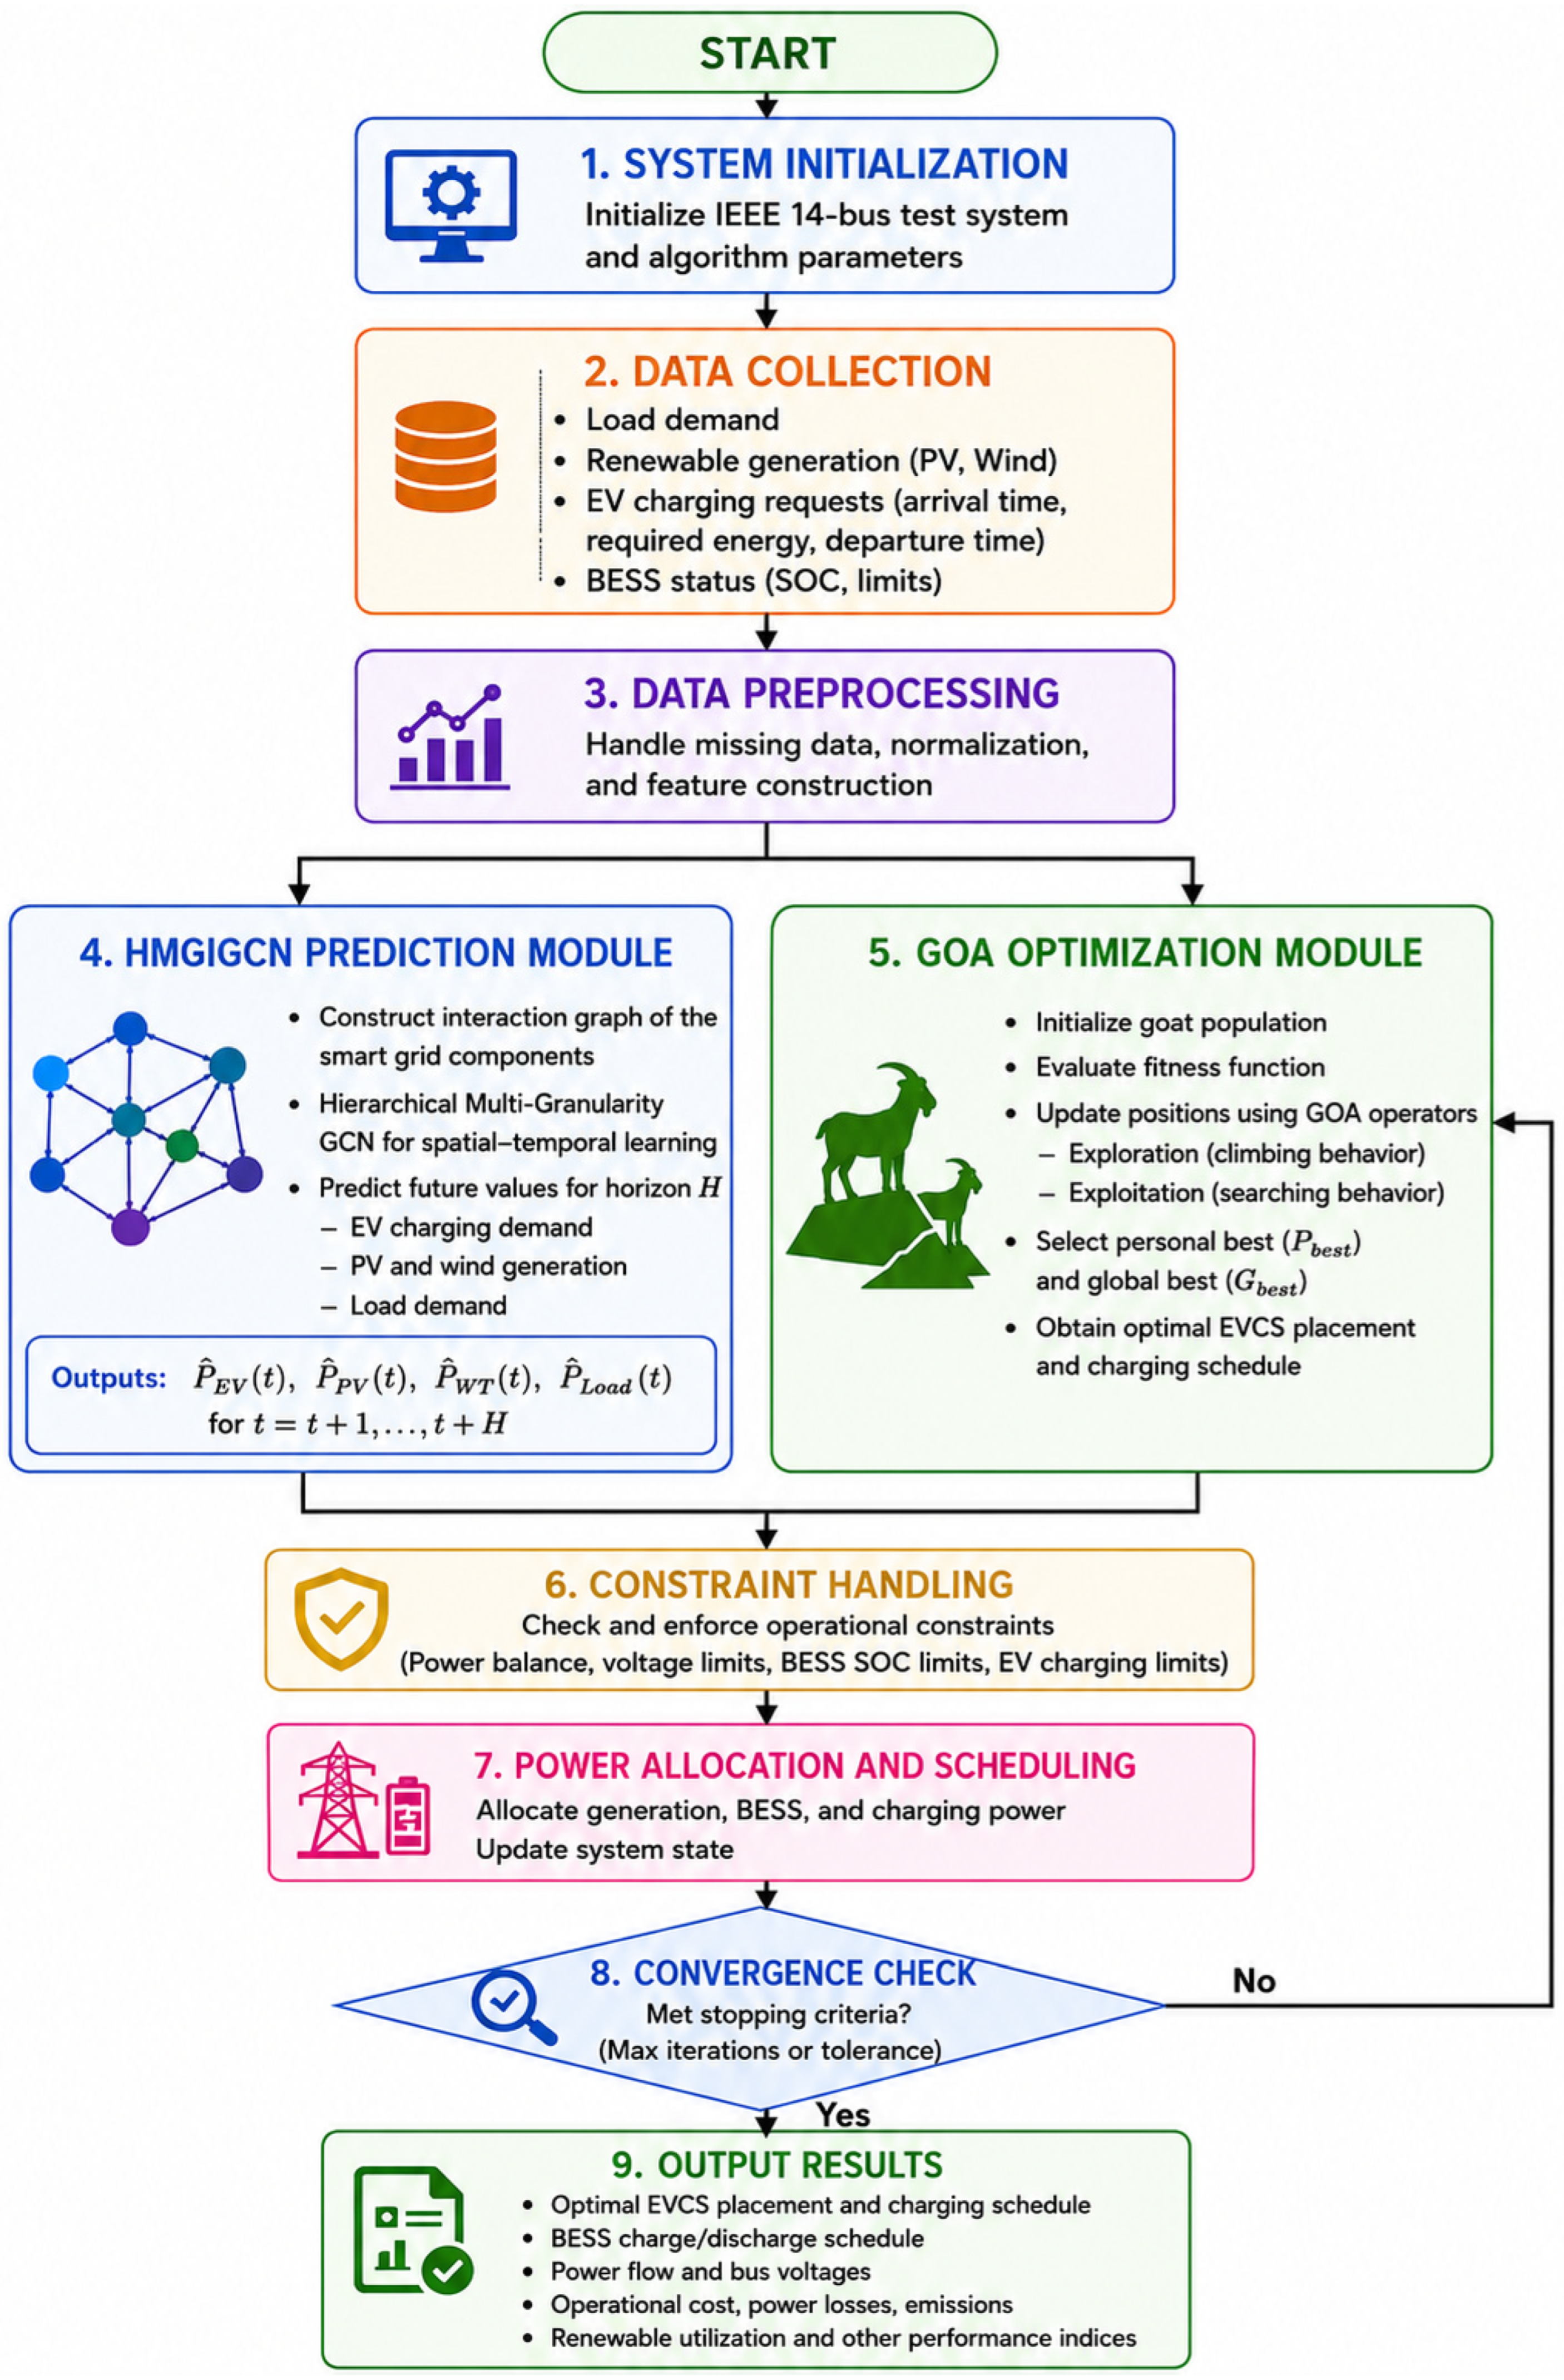
The proposed GOA–HMGIGCN algorithm is developed to provide an intelligent and adaptive energy management solution for Smart Grid systems integrated with RESs and EVCSs as shown in
Figure 3. The algorithm combines the optimization capability of the GOA with the predictive learning capability of the HMGIGCN to achieve efficient charging coordination and balanced power distribution [
47]. In the proposed framework, HMGIGCN is first utilized to predict future EV charging demand, renewable energy generation, and load consumption patterns by capturing complex spatial and temporal relationships within the smart grid network. The predicted information is then supplied to GOA, which performs optimal EVCS placement and charging scheduling while minimizing operational cost, charging time, emissions, and power losses [
48]. The coordinated interaction between optimization and intelligent forecasting enables the proposed framework to adapt dynamically to varying operating conditions, improve renewable energy utilization, reduce grid congestion, and enhance overall system reliability and energy efficiency.
- (a)
Goat Optimization Algorithm
GOA is used for EVCS placement optimization and charging scheduling. The algorithm mimics the climbing and searching behaviour of goats to balance exploration and exploitation within the search space.
The position update mechanism is expressed as:
where
is the current solution.
is the local best solution.
is the global best solution.
are random coefficients.
The optimization fitness function is defined as:
where
are weighting coefficients.
- (b)
HMGIGCN Prediction Model
HMGIGCN is utilized for renewable generation forecasting and EV charging demand prediction by learning spatial-temporal interactions among grid components. The graph convolution process is expressed as:
where
The prediction output is formulated as:
where
represents trainable model parameters.
5.1. Objective Function Formulation
The proposed framework minimizes operational cost, charging delay, emissions, and system power losses simultaneously.
EV Charging Power Constraint
where
: Total operating cost of the system
: Time interval index
: Total number of time intervals
: Cost coefficient of grid power generation
: Power supplied by the main grid at time
: Cost coefficient of photovoltaic generation
: Power generated by the PV system at time
: Cost coefficient of wind turbine generation
: Power generated by the wind turbine at time
: Total active power loss in the network
: Total number of buses
: Bus indices
: Conductance between bus and bus
: Voltage magnitudes at buses and
: Voltage angle difference between buses and
: Total emission produced by grid generation
: Emission coefficient of grid power generation
: Grid power supplied at time
: Total EV charging time
: Total number of electric vehicles
: Target state of charge of EV
: Initial state of charge of EV
: Charging power of EV
: Power supplied or absorbed by the battery energy storage system
: Total system load demand
: Total EV charging demand
: Minimum allowable voltage at bus
: Maximum allowable voltage at bus
: Voltage magnitude at bus
5.2. Forecasting Performance Evaluation Metrics
The forecasting performance of the proposed Hybrid Multi-Graph Integrated Graph Convolutional Network (HMGIGCN) model was evaluated using four widely adopted statistical metrics, namely Mean Absolute Error (MAE), Root Mean Square Error (RMSE), Mean Absolute Percentage Error (MAPE), and the Coefficient of Determination (). These metrics provide quantitative measures of prediction accuracy, error magnitude, and model reliability.
Mean Absolute Error.
MAE measures the average absolute difference between the actual and predicted values and is expressed as:
where
is the total number of observations,
represents the actual value, and
represents the predicted value.
Root Mean Square Error
RMSE measures the standard deviation of prediction errors and places greater emphasis on larger errors. It is calculated as:
A lower RMSE value indicates better forecasting performance.
Mean Absolute Percentage Error
MAPE expresses the prediction error as a percentage of the actual value and is defined as:
Lower MAPE values indicate higher forecasting accuracy. In practical forecasting applications, MAPE values below 5% are generally considered highly accurate.
Coefficient of Determination
The coefficient of determination evaluates the goodness-of-fit between predicted and actual values and is given by:
where
denotes the mean of the actual observations. The
value ranges between 0 and 1, with values closer to 1 indicating a stronger correlation between predicted and actual values and superior model performance.
GOA–HMGIGCN’s operating flowchart for intelligent energy management in the IEEE 14-bus Smart Grid integrated with Renewable Energy Sources, BESSs, and EVCSs is shown in
Figure 3. System initialization and real-time data collecting include load demand, renewable generation, EV charging requests, and battery status. HMGIGCN forecasts charging demand, renewable generation, and load changes using pre-processed data. The GOA optimizes EVCS location and charging timing while meeting system operational limits by decreasing operational cost, charging time, emissions, and power losses. The proposed system includes constraint handling, adaptive power allocation, and scheduling to assure grid stability. Finally, the optimization procedure iteratively meets convergence requirements to produce optimal energy management and charging coordination.
6. Results
The proposed GOA–HMGIGCN framework was implemented and validated in MATLAB/Simulink R2024a using the IEEE 14-bus Smart Grid test network integrated with RESs, BESSs, and EVCSs. The simulation studies were carried out under different operating scenarios to examine the effectiveness of the proposed framework in enhancing smart grid reliability, improving the coordinated interaction between renewable generation and storage systems, and achieving efficient energy management under fluctuating load demand and intermittent renewable energy conditions. The obtained results confirm that the proposed optimization and forecasting framework effectively reduces operational cost, charging delay, emissions, and system power losses while enhancing renewable energy utilization, voltage stability, and overall grid performance.
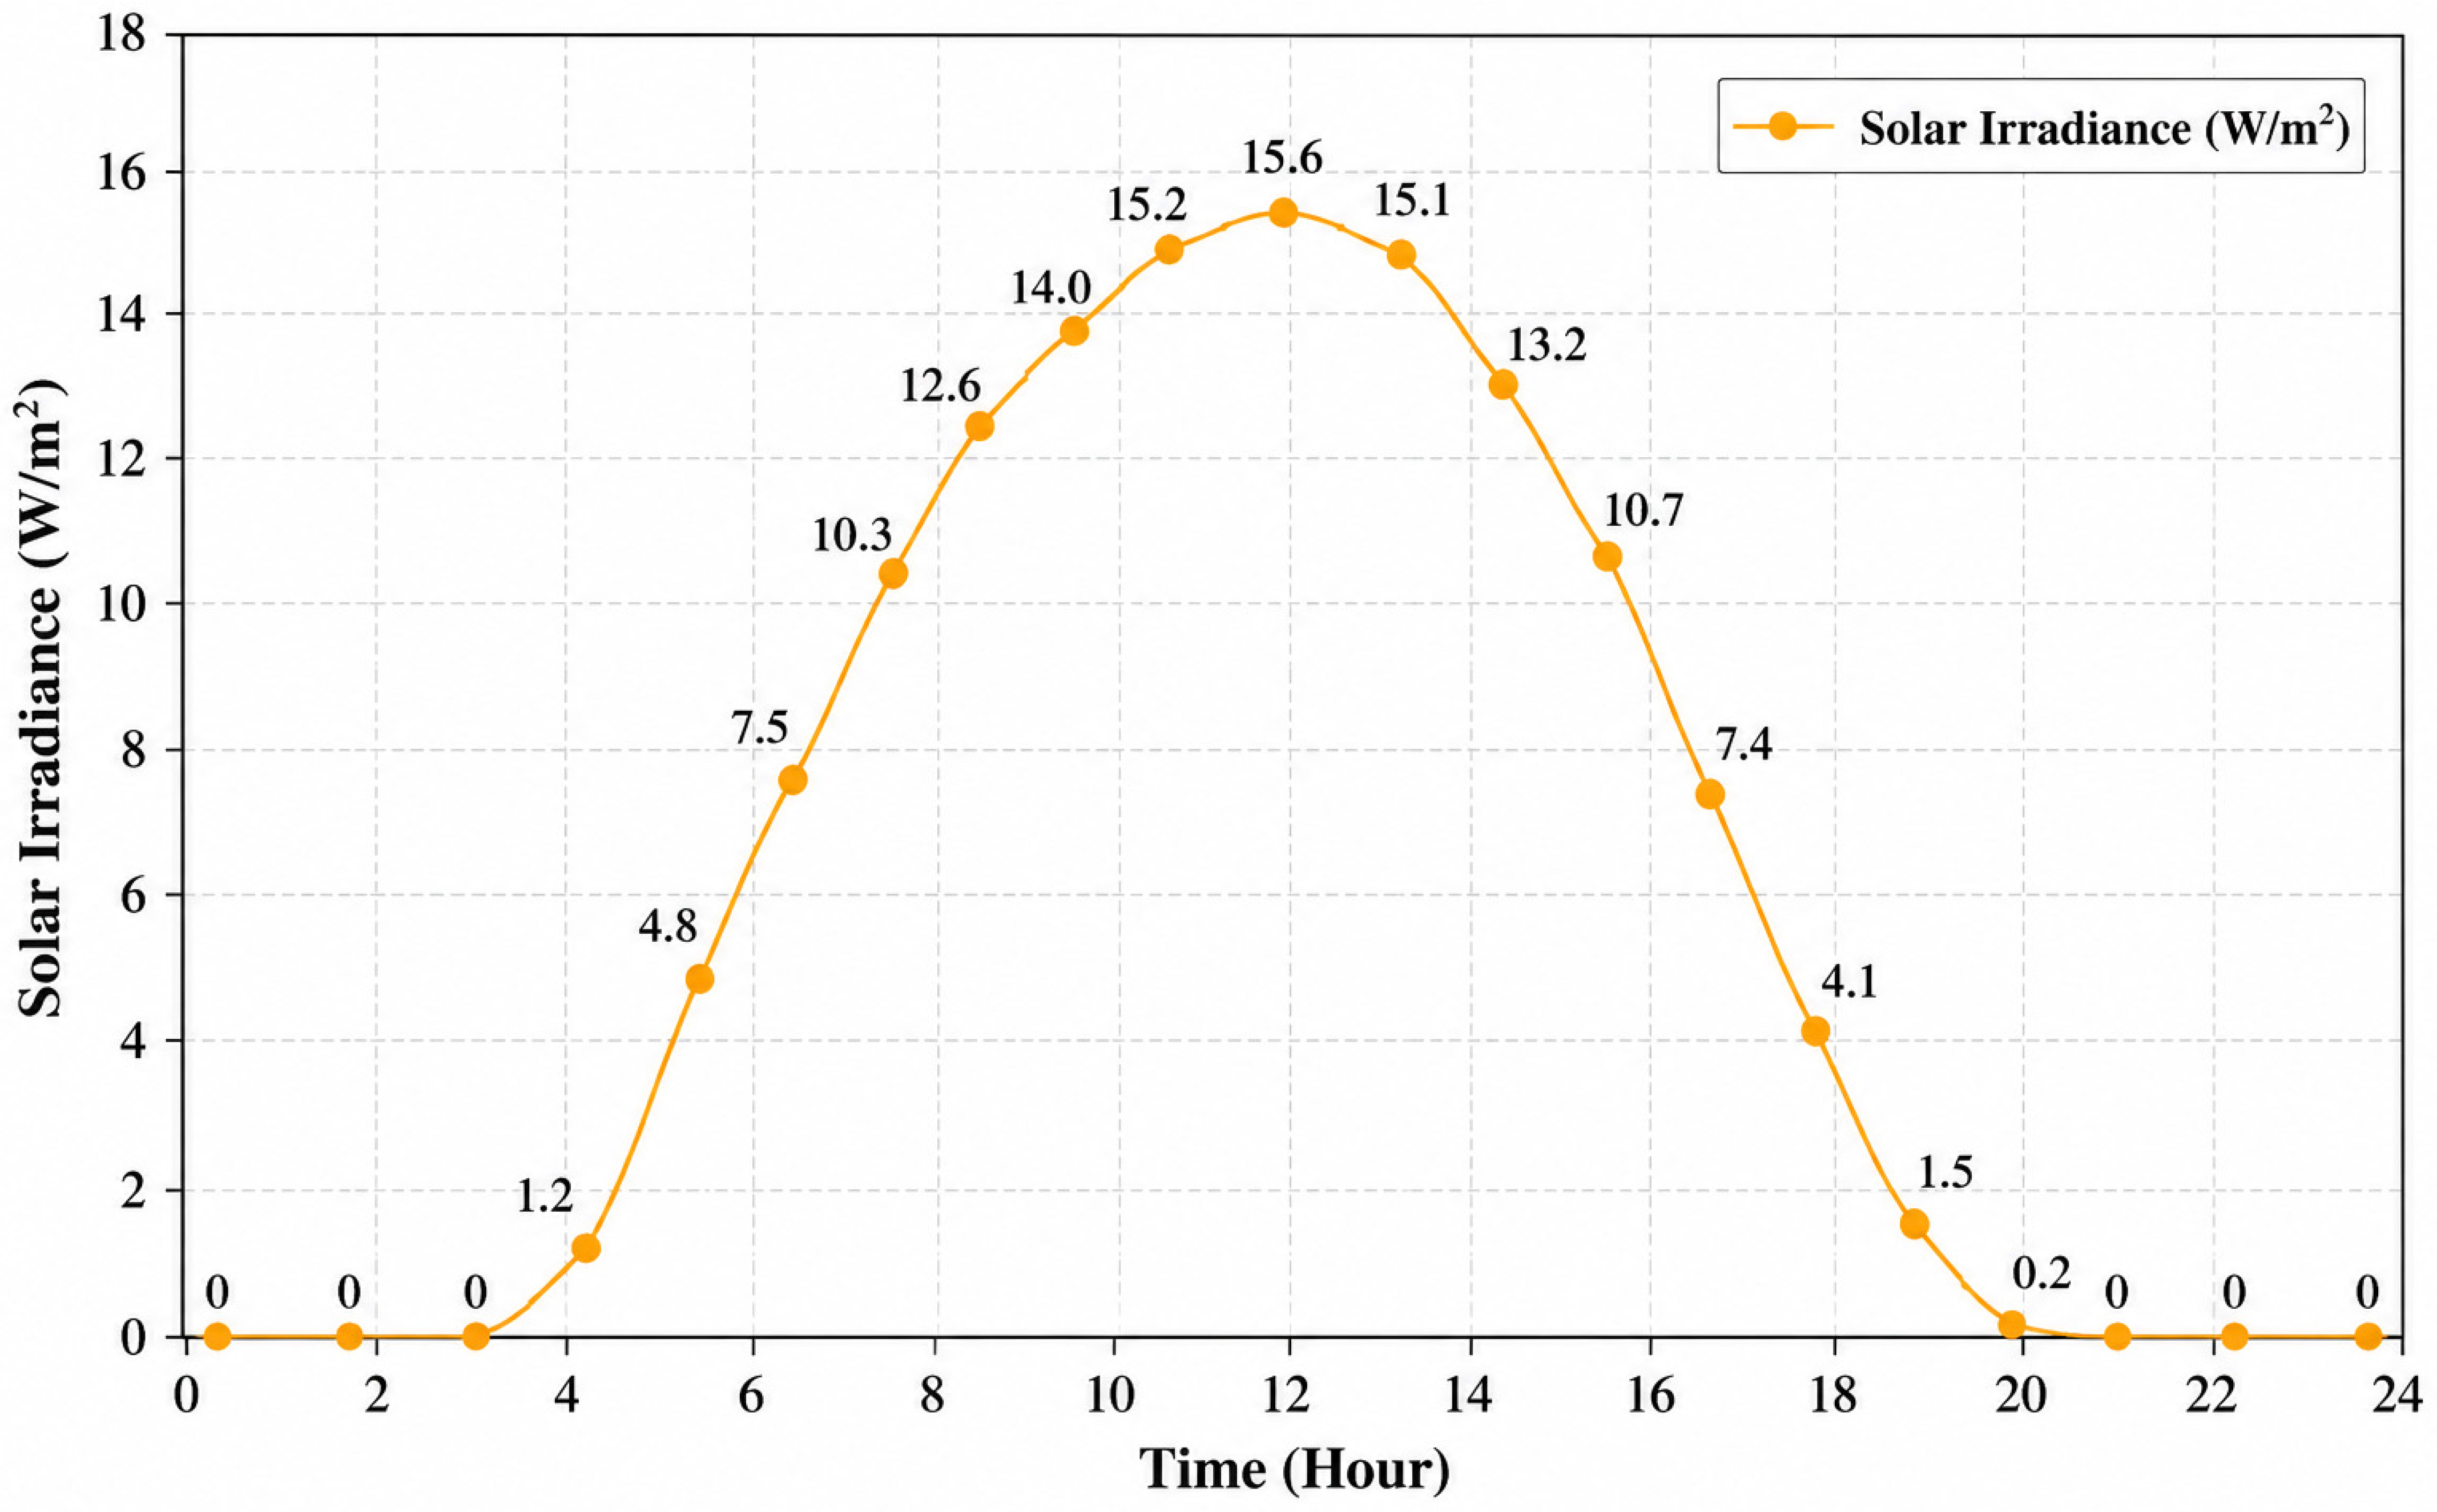
Figure 4 presents the hourly variation of solar irradiance over a 24 h period. During the early morning and nighttime hours, the irradiance remains close to 0 W/m
2 due to the absence of solar radiation. As daytime progresses, the irradiance gradually increases with rising sunlight intensity and reaches its highest value around midday. Following the peak solar period, the irradiance steadily decreases toward evening as sunlight intensity declines. The obtained profile reflects the normal daily behavior of solar irradiance and demonstrates its direct impact on photovoltaic power generation within the proposed smart grid energy management framework.
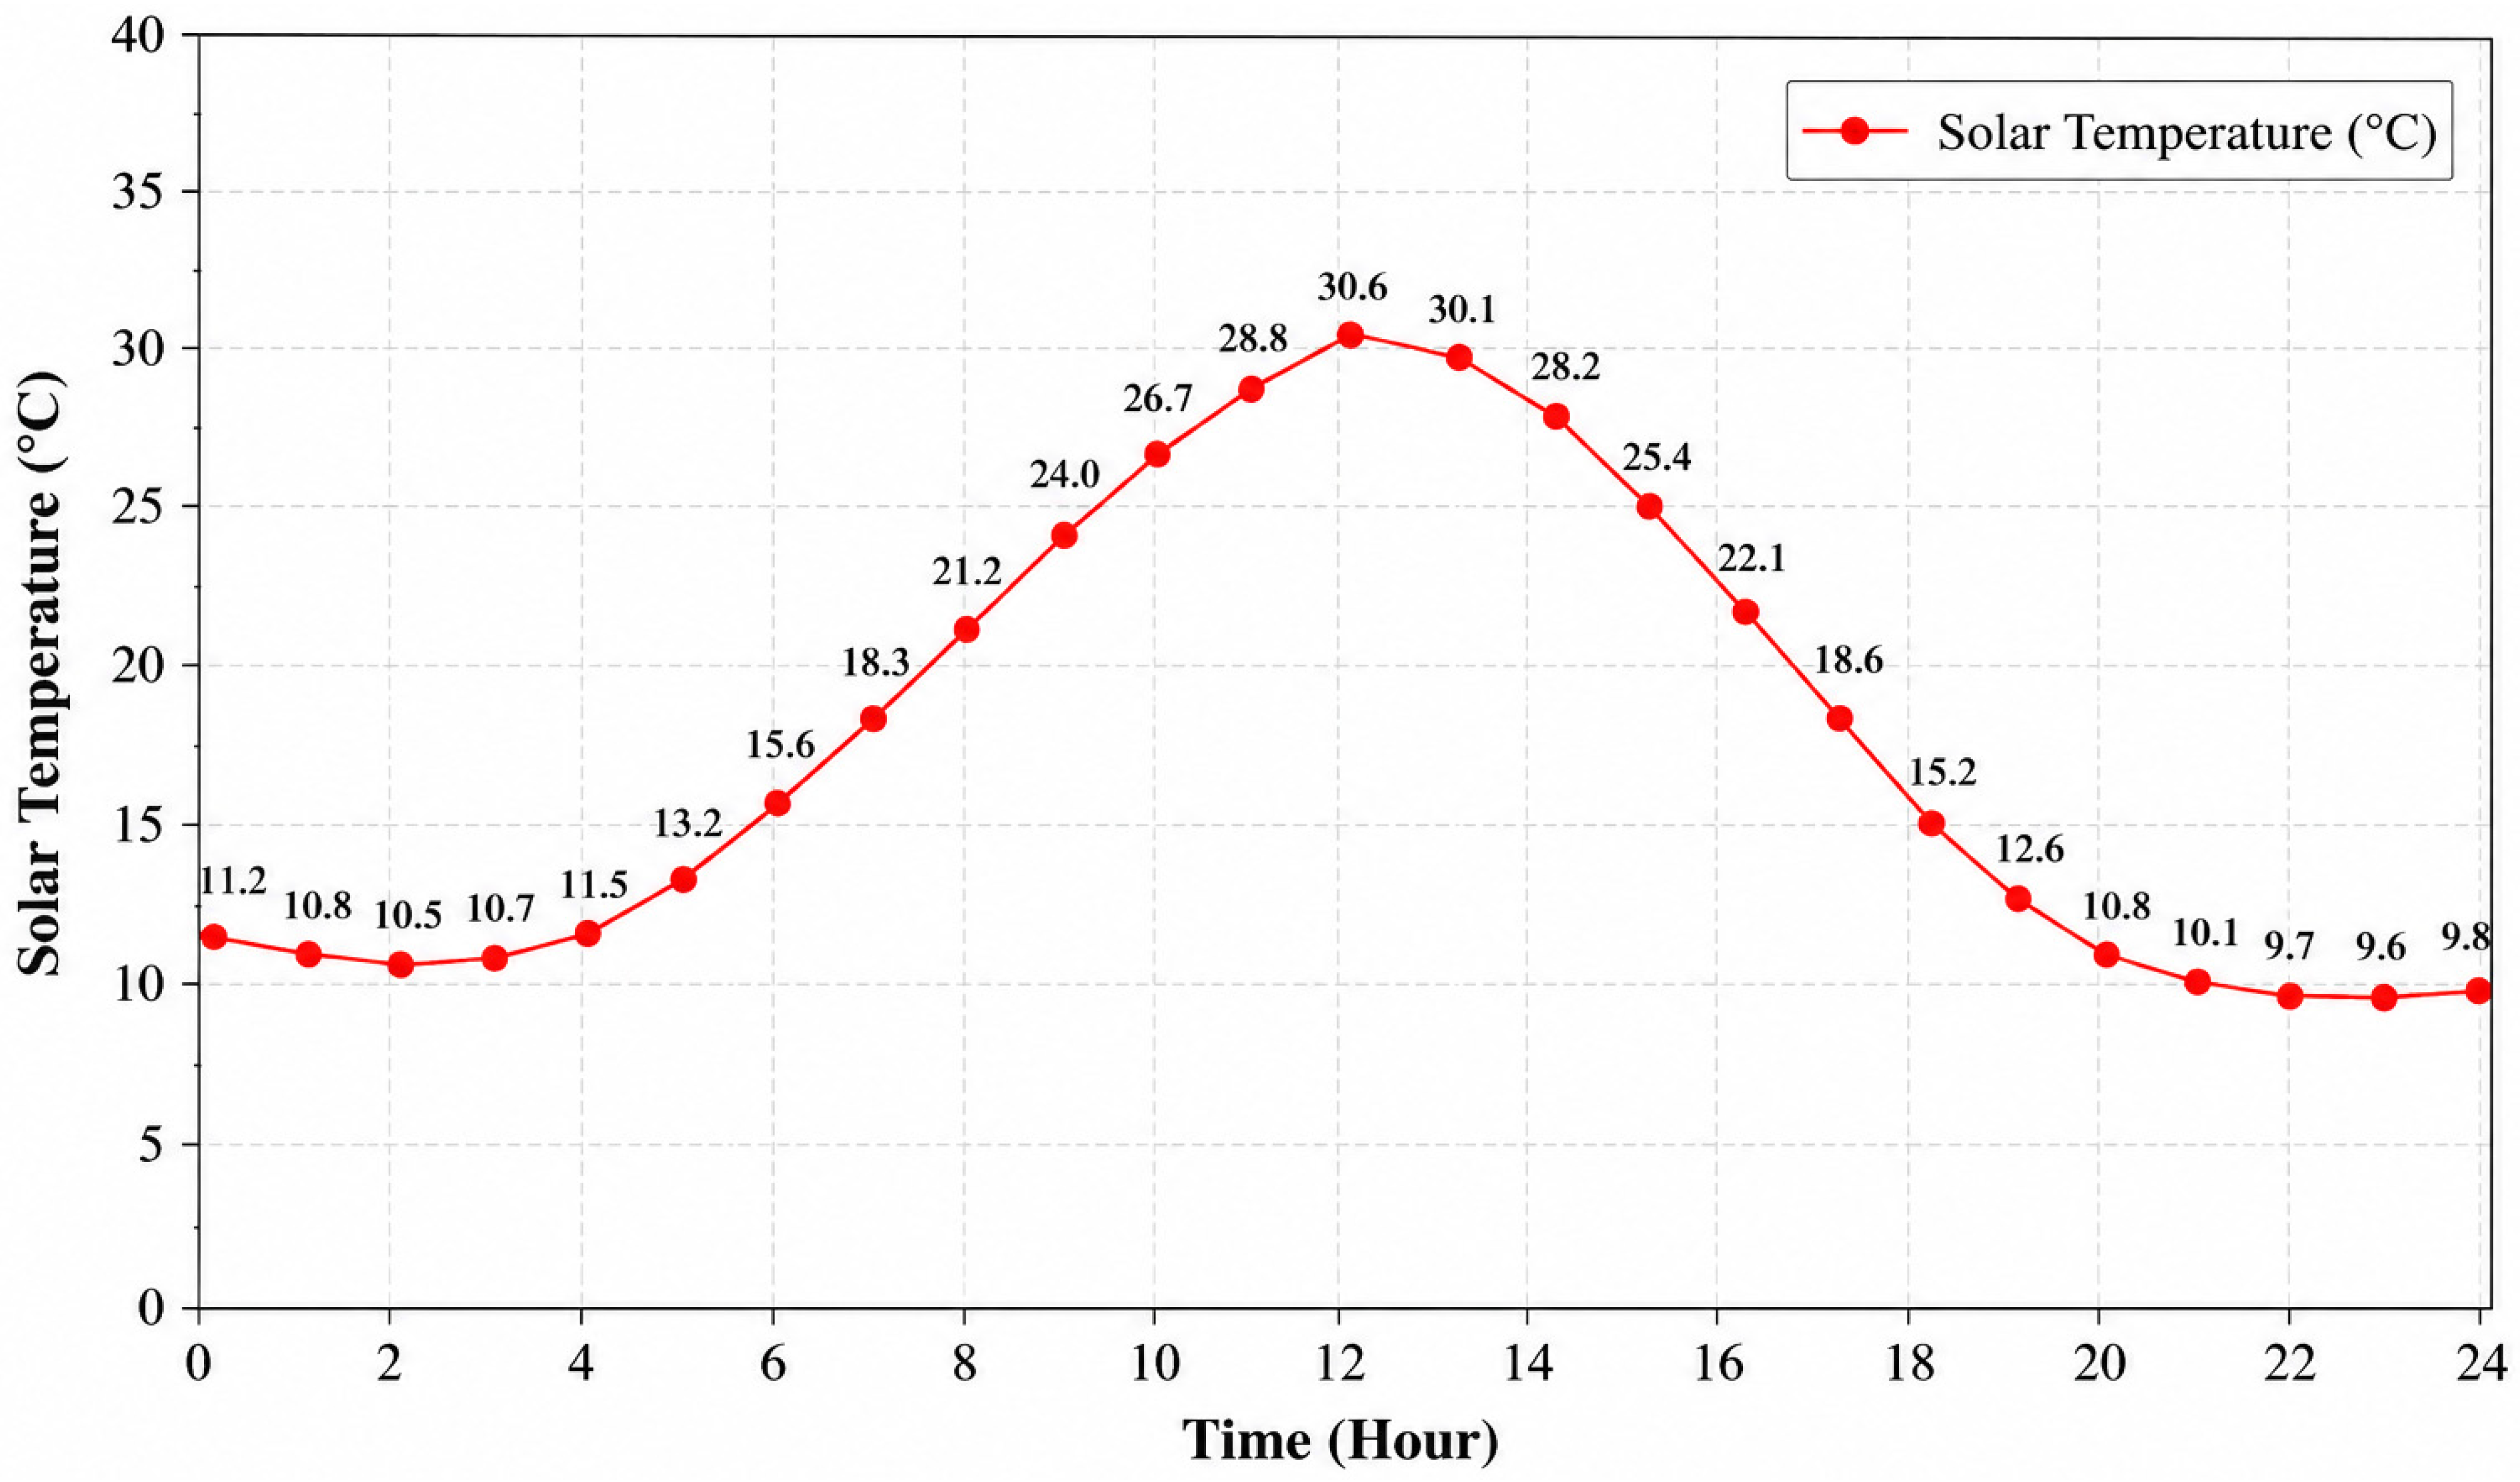
Figure 5 illustrates the fluctuation in solar temperature across the 24 h operational cycle within the proposed Smart Grid framework. In the early morning hours, the temperature remains comparatively low due to diminished sun radiation and decreased air heating. Throughout the day, the temperature incrementally ascends in correlation with the intensification of solar irradiation, peaking around midday when solar heating conditions are optimal. The rise in temperature coincides with the peak of photovoltaic energy production and optimal sun irradiation. Post-noon, the solar temperature gradually diminishes as evening and midnight approach, coinciding with a reduction in solar radiation intensity. The decline in temperature between late afternoon and evening signifies the natural cooling process due to diminished sunshine exposure. The recorded temperature profile exhibits a standard daily thermal pattern linked to photovoltaic operation conditions and renewable energy systems. Furthermore, the variation in solar temperature significantly influences photovoltaic panel performance and overall renewable energy generation efficiency within the proposed framework. Elevated temperatures may diminish photovoltaic conversion efficiency despite augmented solar irradiation, whereas reduced temperatures throughout morning and evening enhance operational conditions. Consequently, precise temperature monitoring and forecasting are vital for effective energy management, renewable energy prediction, and synchronized energy scheduling within the proposed GOA–HMGIGCN system.
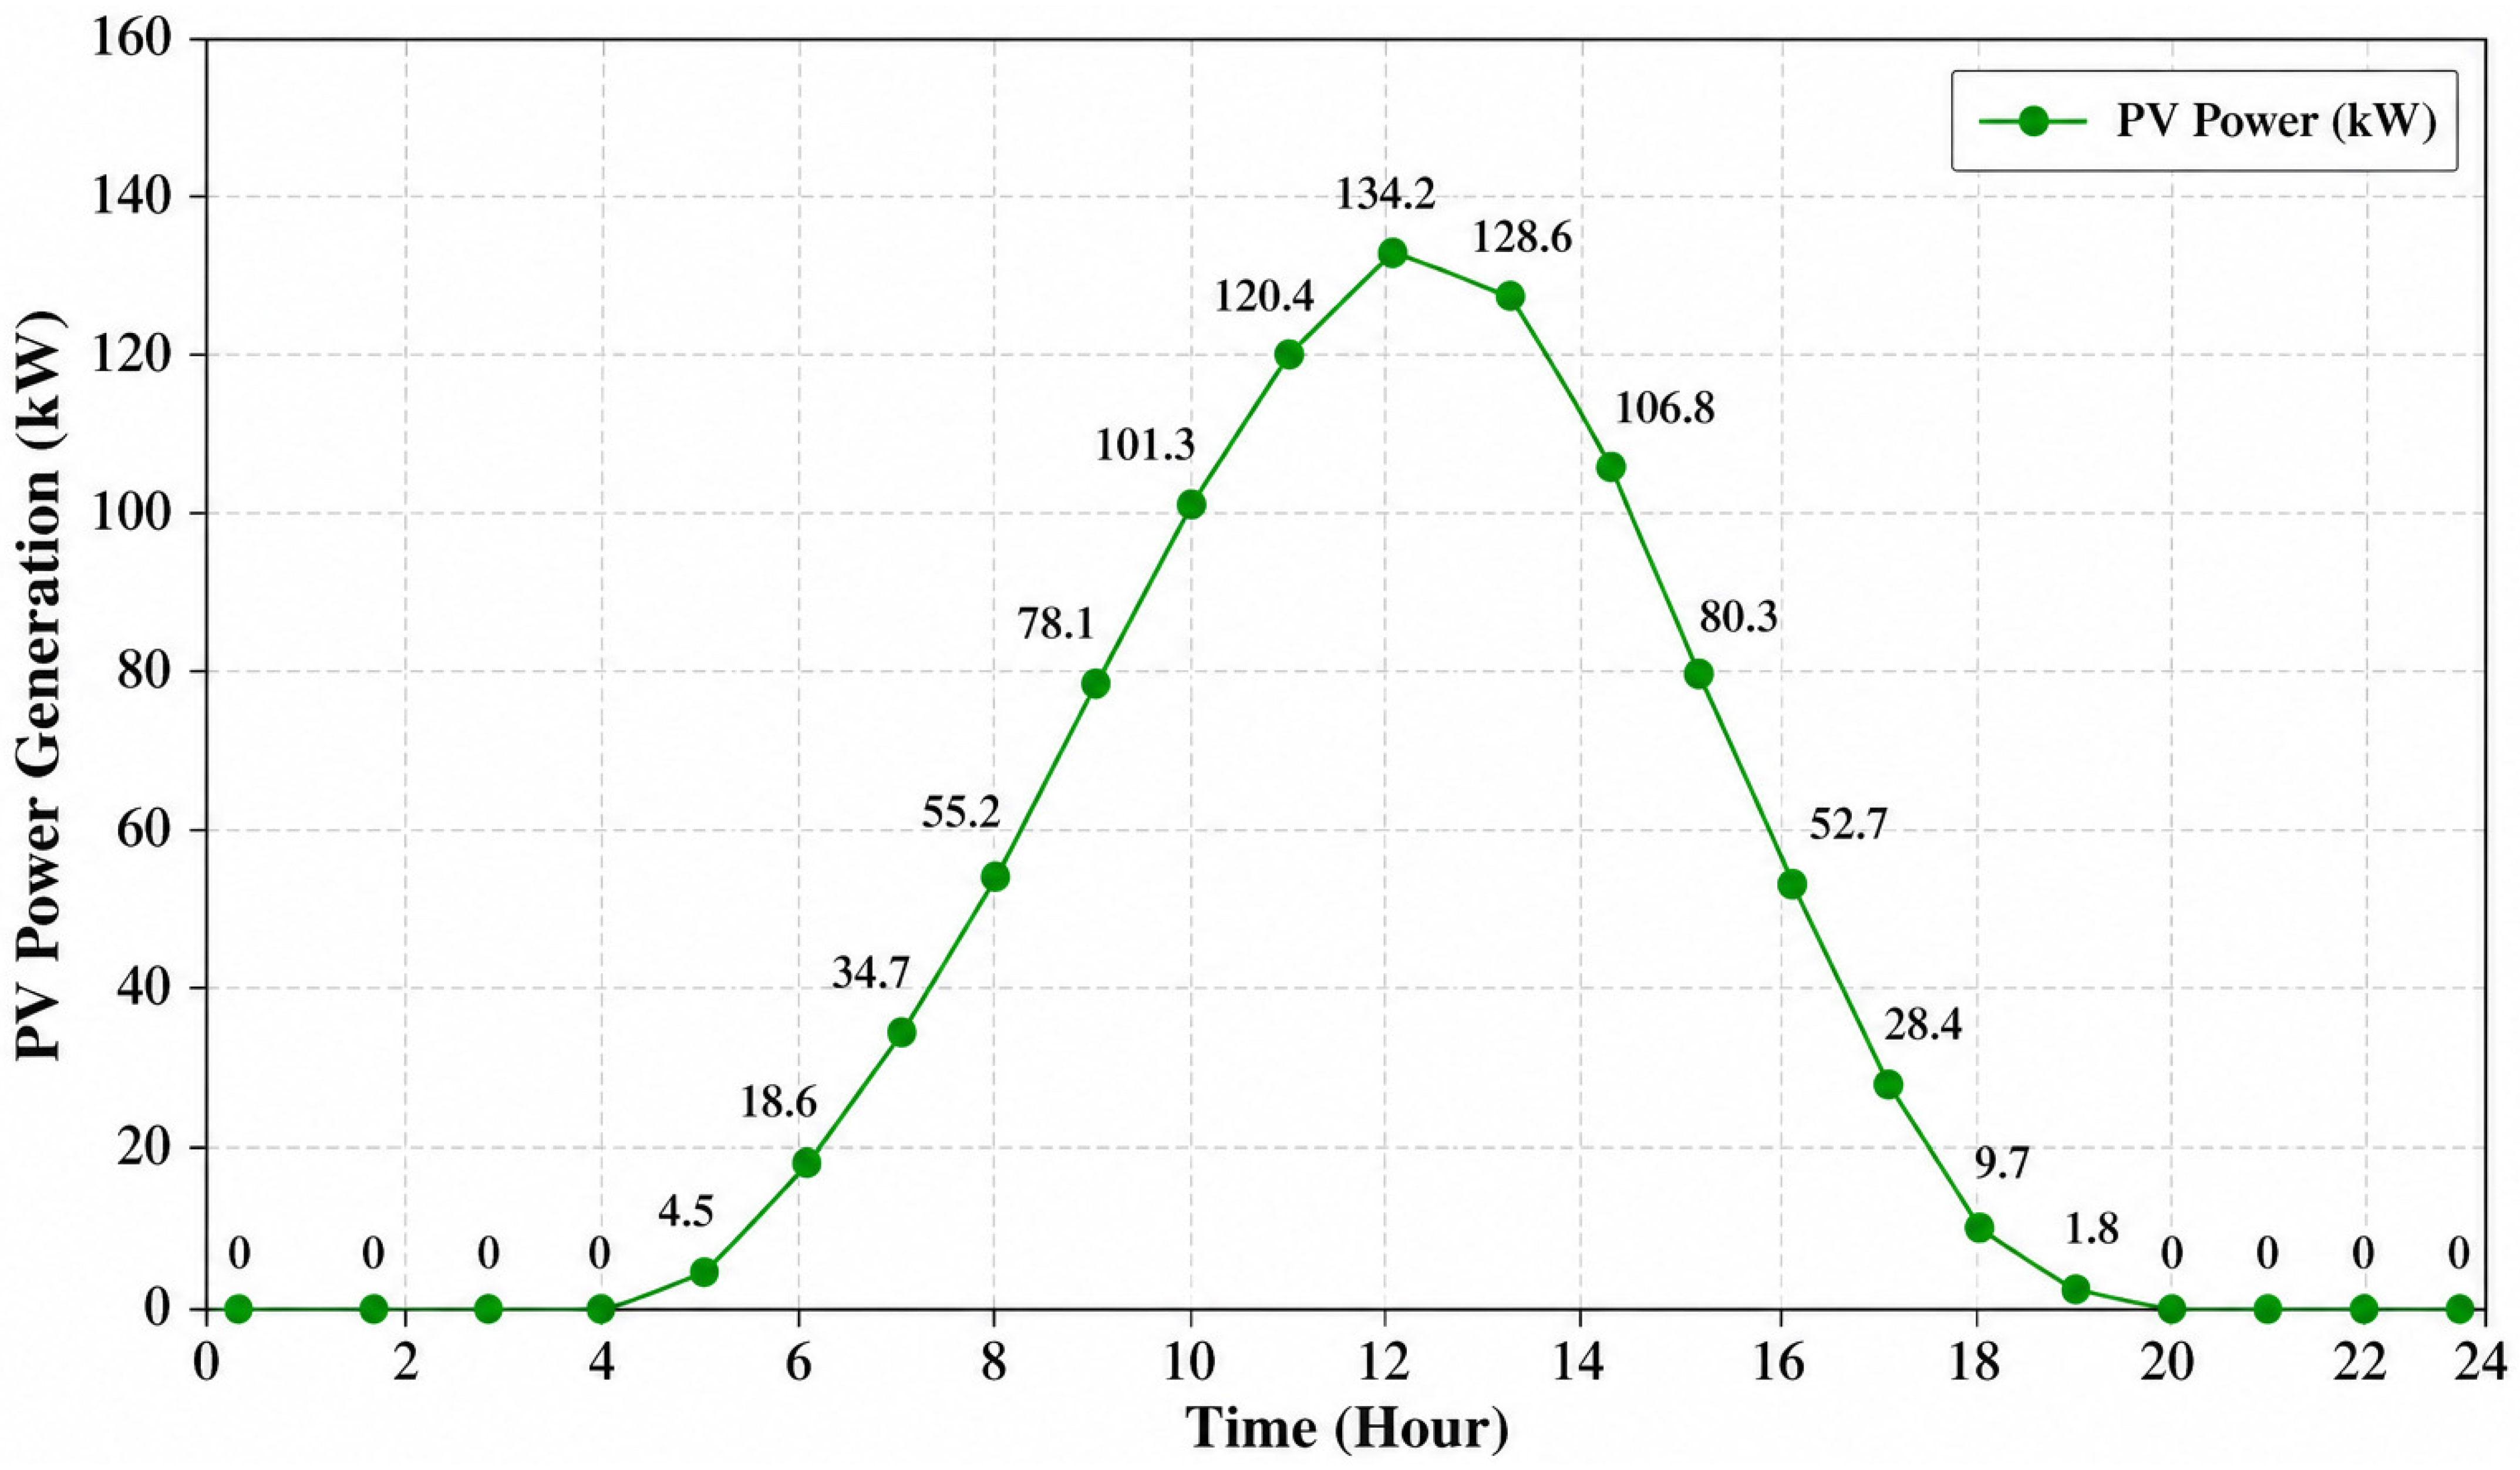
Figure 6 illustrates the variation in PV power generation over the 24 h operating period within the proposed Smart Grid framework. During nighttime and early morning hours, the PV output remains close to zero due to the absence of solar radiation. As solar irradiance gradually increases after sunrise, the PV power output rises significantly, indicating enhanced photovoltaic energy conversion under increasing sunlight intensity. The maximum PV power generation is observed around midday when solar irradiance reaches its peak value, and the availability of solar energy is highest. Following the midday period, the PV output progressively decreases toward the evening hours as solar irradiance intensity declines. During late evening and nighttime conditions, the PV generation returns to nearly zero due to the unavailability of sunlight. The obtained PV power profile demonstrates the direct relationship between solar irradiance and photovoltaic energy production within the proposed renewable-integrated smart grid system. Furthermore, the variation in PV power generation highlights the intermittent nature of solar energy and emphasizes the importance of intelligent forecasting, energy storage coordination, and adaptive energy scheduling within the proposed GOA–HMGIGCN framework. Accurate prediction and management of PV output are essential for maintaining power balance, reducing grid dependency, and improving renewable energy utilization in smart grid energy management applications.
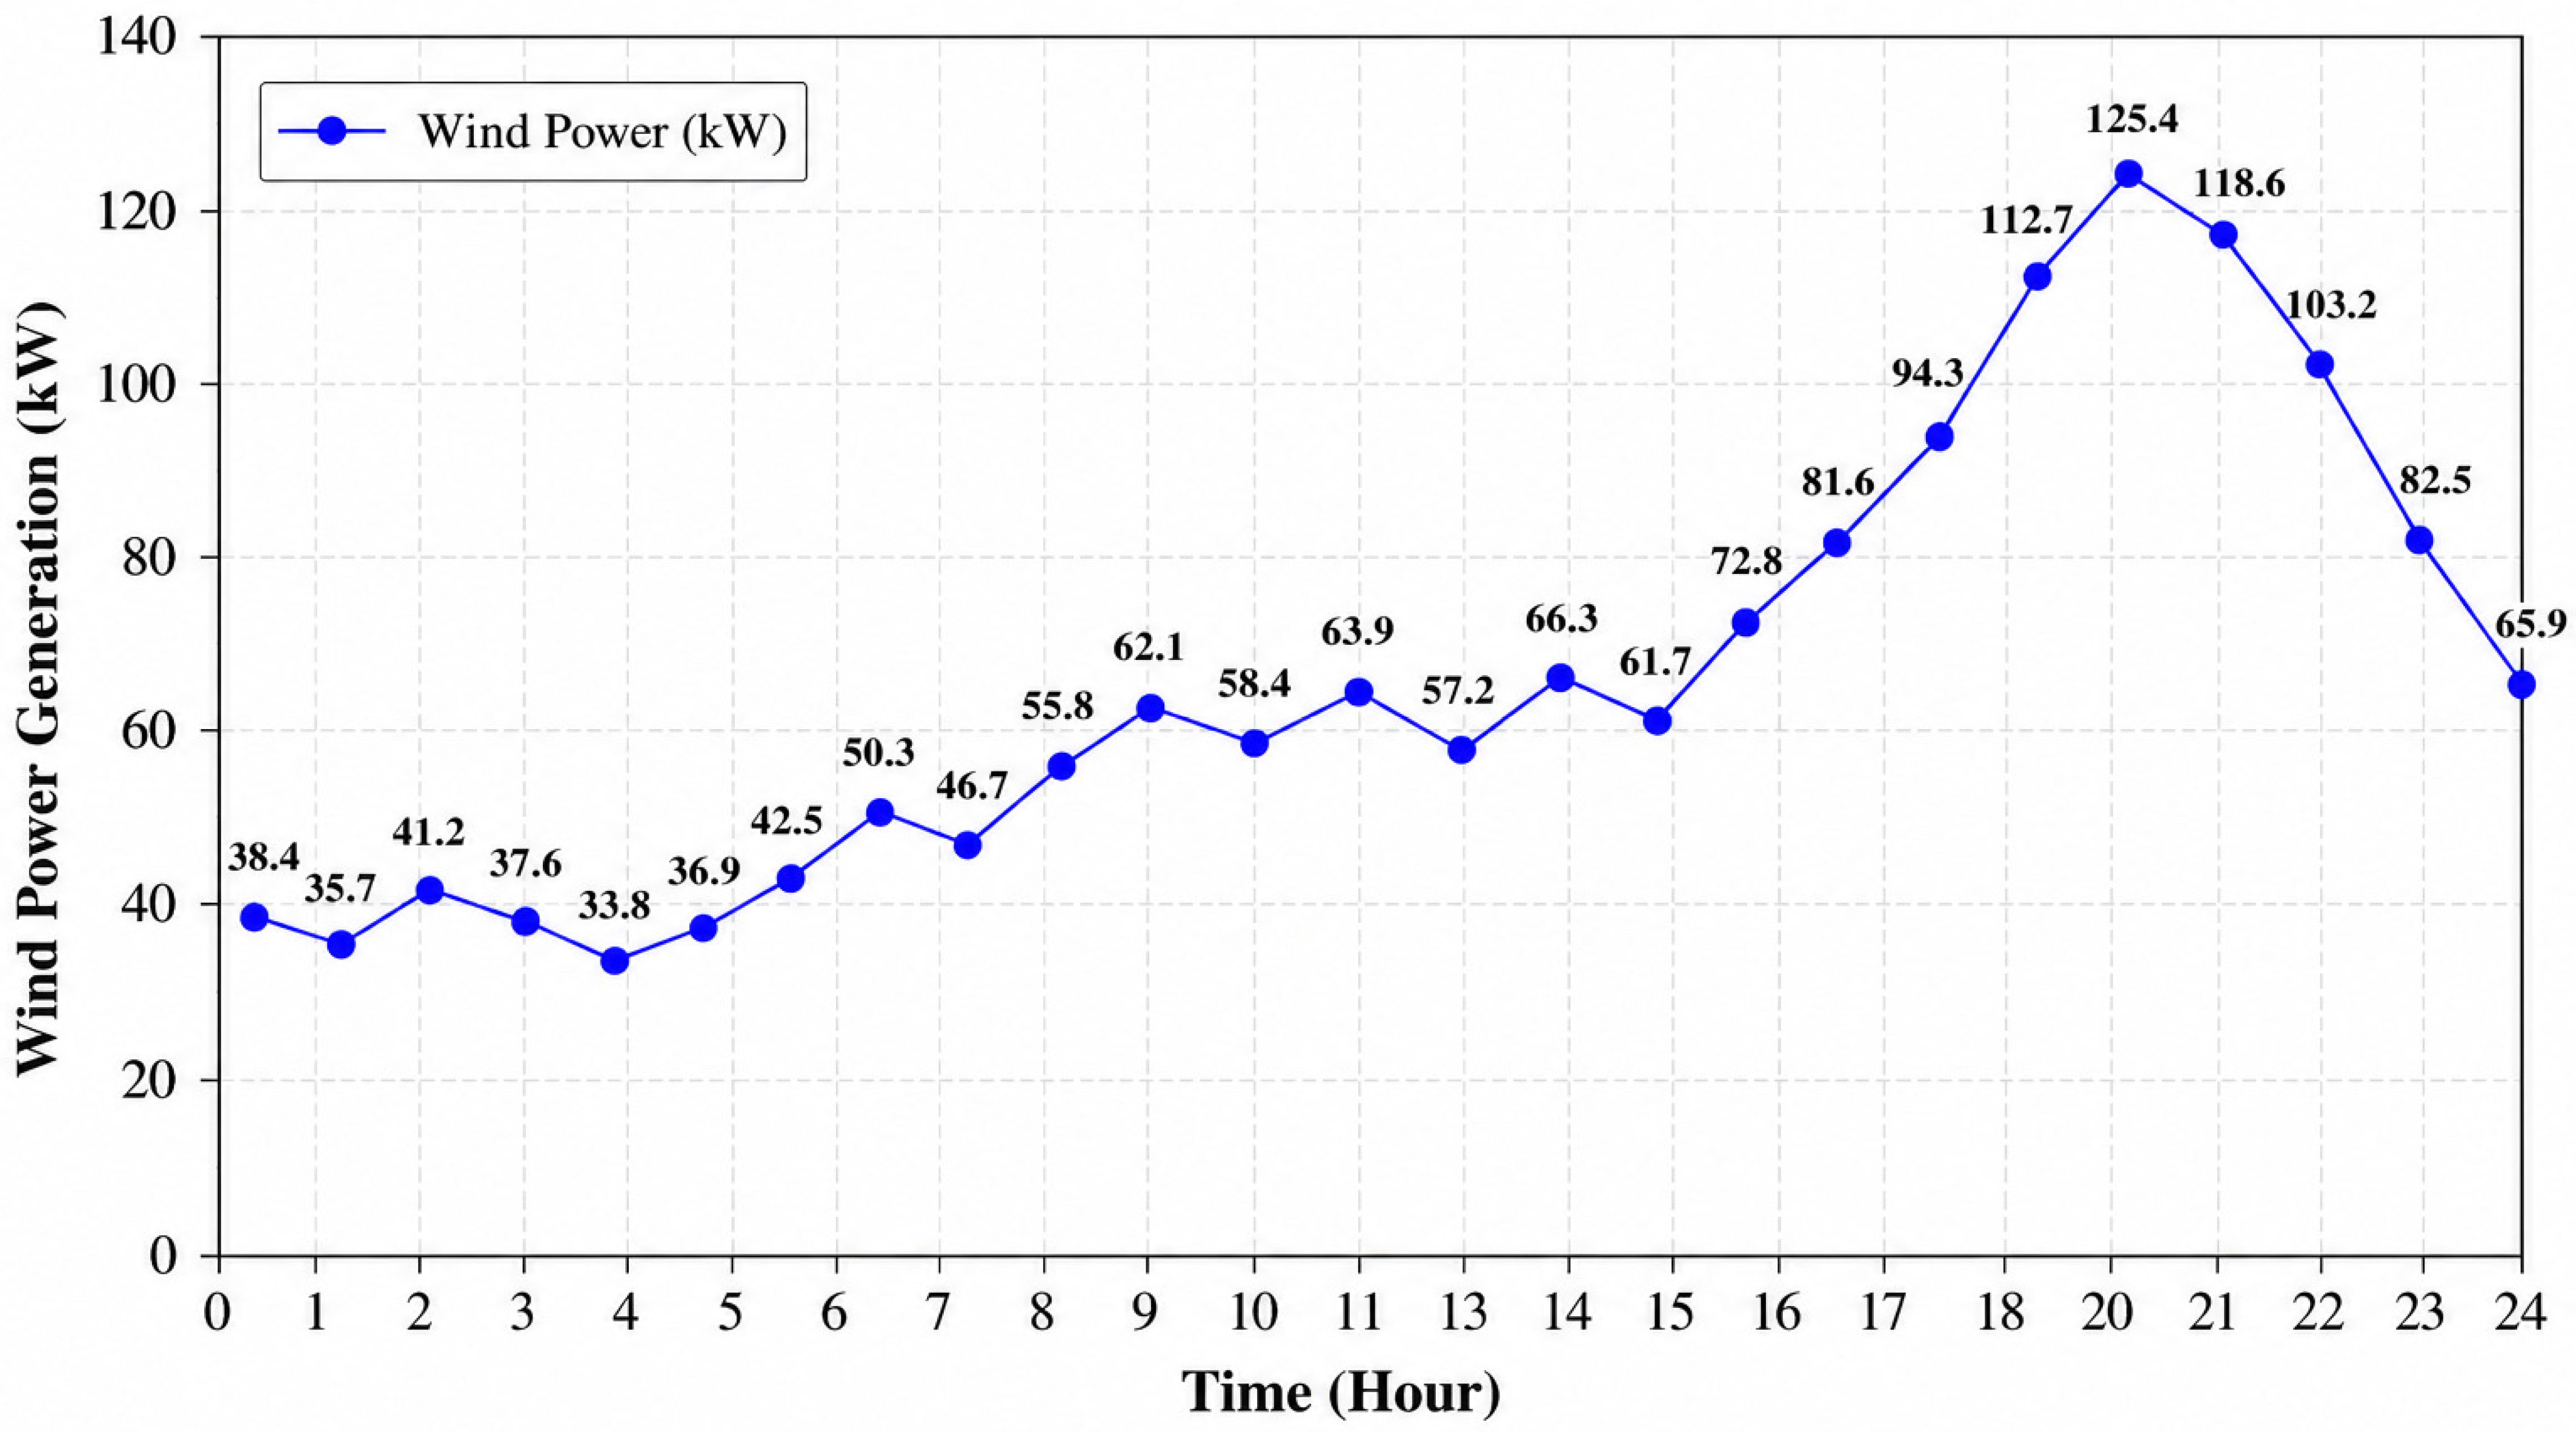
Figure 7 presents the variation in wind power generation over the 24 h operating period within the proposed Smart Grid framework. The wind power output exhibits fluctuating behavior throughout the day due to continuous variations in wind velocity and atmospheric conditions. During the early operating hours, moderate wind power generation is observed, indicating stable wind conditions and consistent renewable energy contribution to the grid. As the operating period progresses, the wind power output experiences several increases and decreases corresponding to changes in wind speed intensity. The highest wind power generation levels are recorded during the evening period when stronger wind activity occurs, resulting in increased renewable energy contribution to the smart grid system. Thereafter, the power output gradually decreases toward the late-night hours as wind conditions become less intense. The obtained wind power profile demonstrates the intermittent and dynamic nature of wind energy generation within renewable-integrated power systems. These fluctuations emphasize the importance of intelligent forecasting, adaptive energy scheduling, and coordinated energy management strategies within the proposed GOA–HMGIGCN framework. Accurate prediction of wind power generation is essential for maintaining power balance, reducing grid instability, improving renewable energy utilization, and supporting reliable operation of EVCSs and BESSs under varying operating conditions.
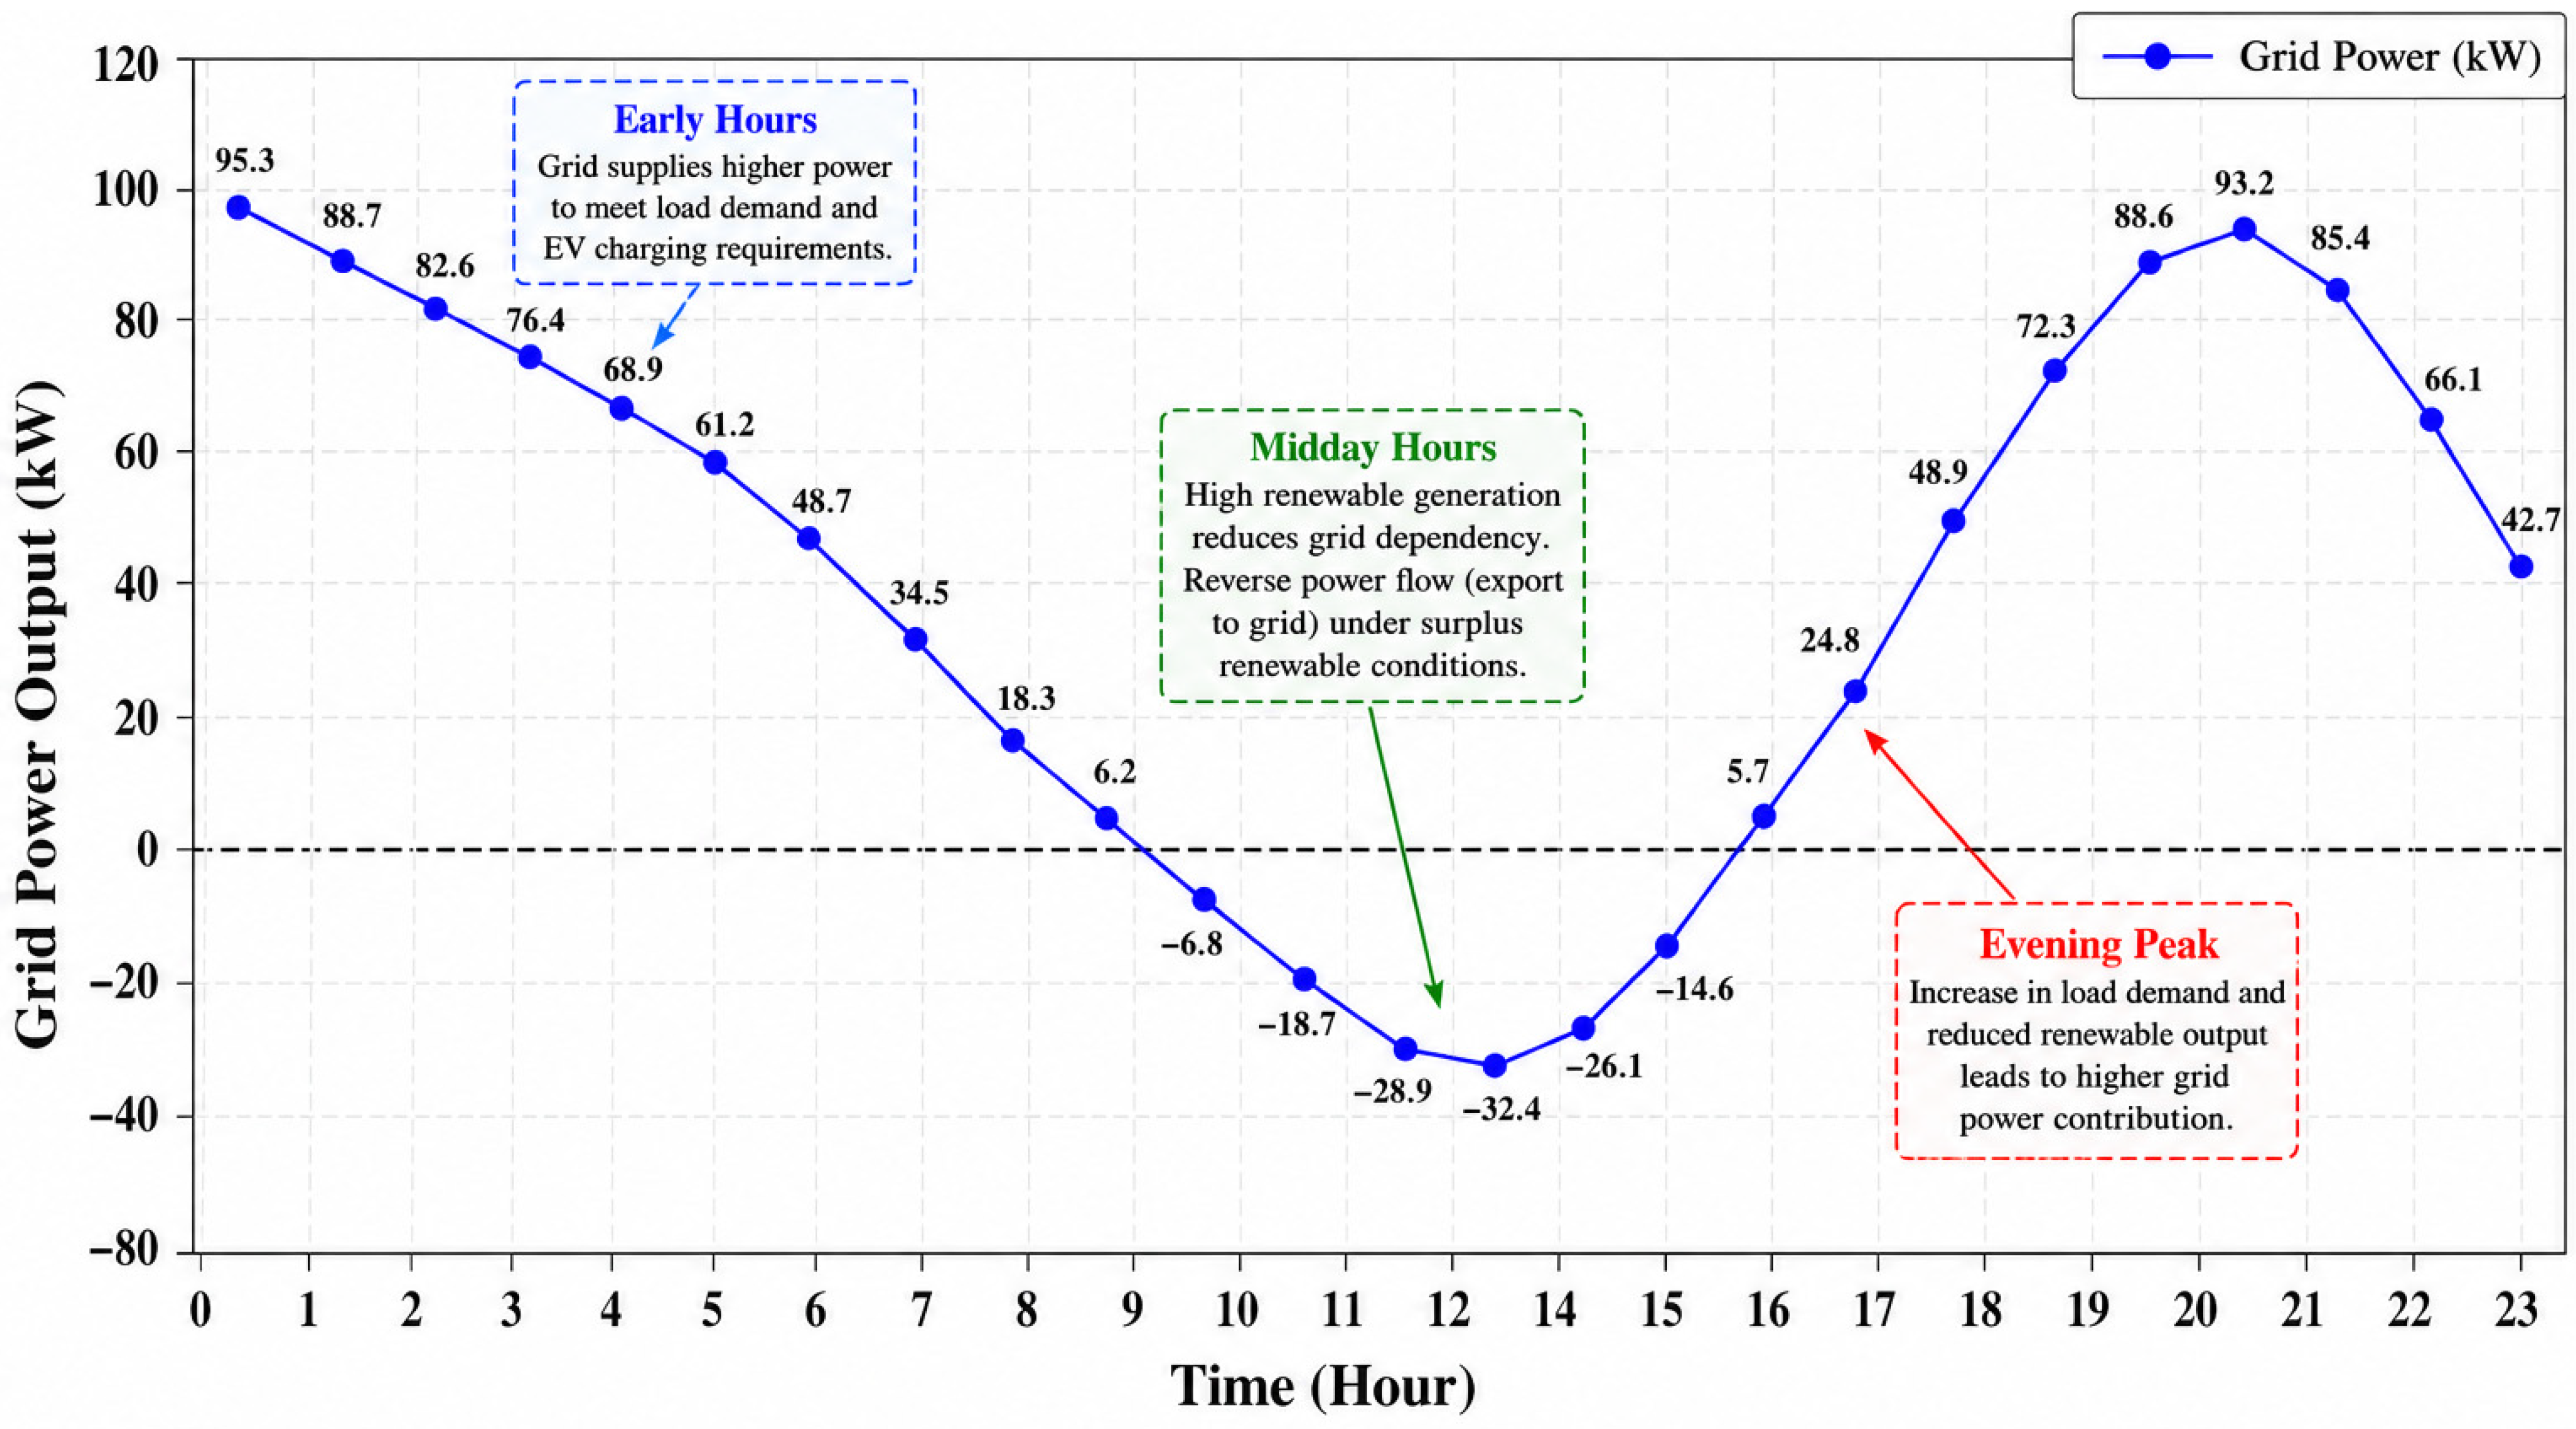
Figure 8 illustrates the variation in utility grid power output throughout the 24 h operating cycle within the proposed Smart Grid framework. During the early operating hours, the grid supplies relatively high-power levels to support residential and commercial load demand as well as EVCS charging requirements. This increased grid contribution occurs due to the limited availability of renewable energy generation during nighttime and early morning conditions. As the daytime period progresses, the contribution from photovoltaic and wind energy systems increases significantly due to improved renewable energy availability. Consequently, the dependence on utility grid power gradually decreases during midday hours. In some operating intervals, reverse power flow conditions are observed, represented by negative grid power values, indicating that surplus renewable energy is exported back to the utility grid. This behavior demonstrates the effectiveness of the proposed GOA–HMGIGCN framework in maximizing renewable energy utilization and reducing grid dependency during high renewable generation periods. During the evening peak demand period, the utility grid contribution increases again to compensate for the reduction in renewable energy generation and the increase in load demand and EV charging activities. The grid power output then gradually decreases toward nighttime as the operating conditions stabilize. Overall, the observed grid power profile highlights the dynamic interaction between renewable energy generation, energy storage systems, EV charging demand, and utility grid support within the proposed energy management framework. The results further confirm the capability of the proposed framework to maintain stable power balance, improve energy coordination, and enhance overall smart grid reliability under varying operating conditions.
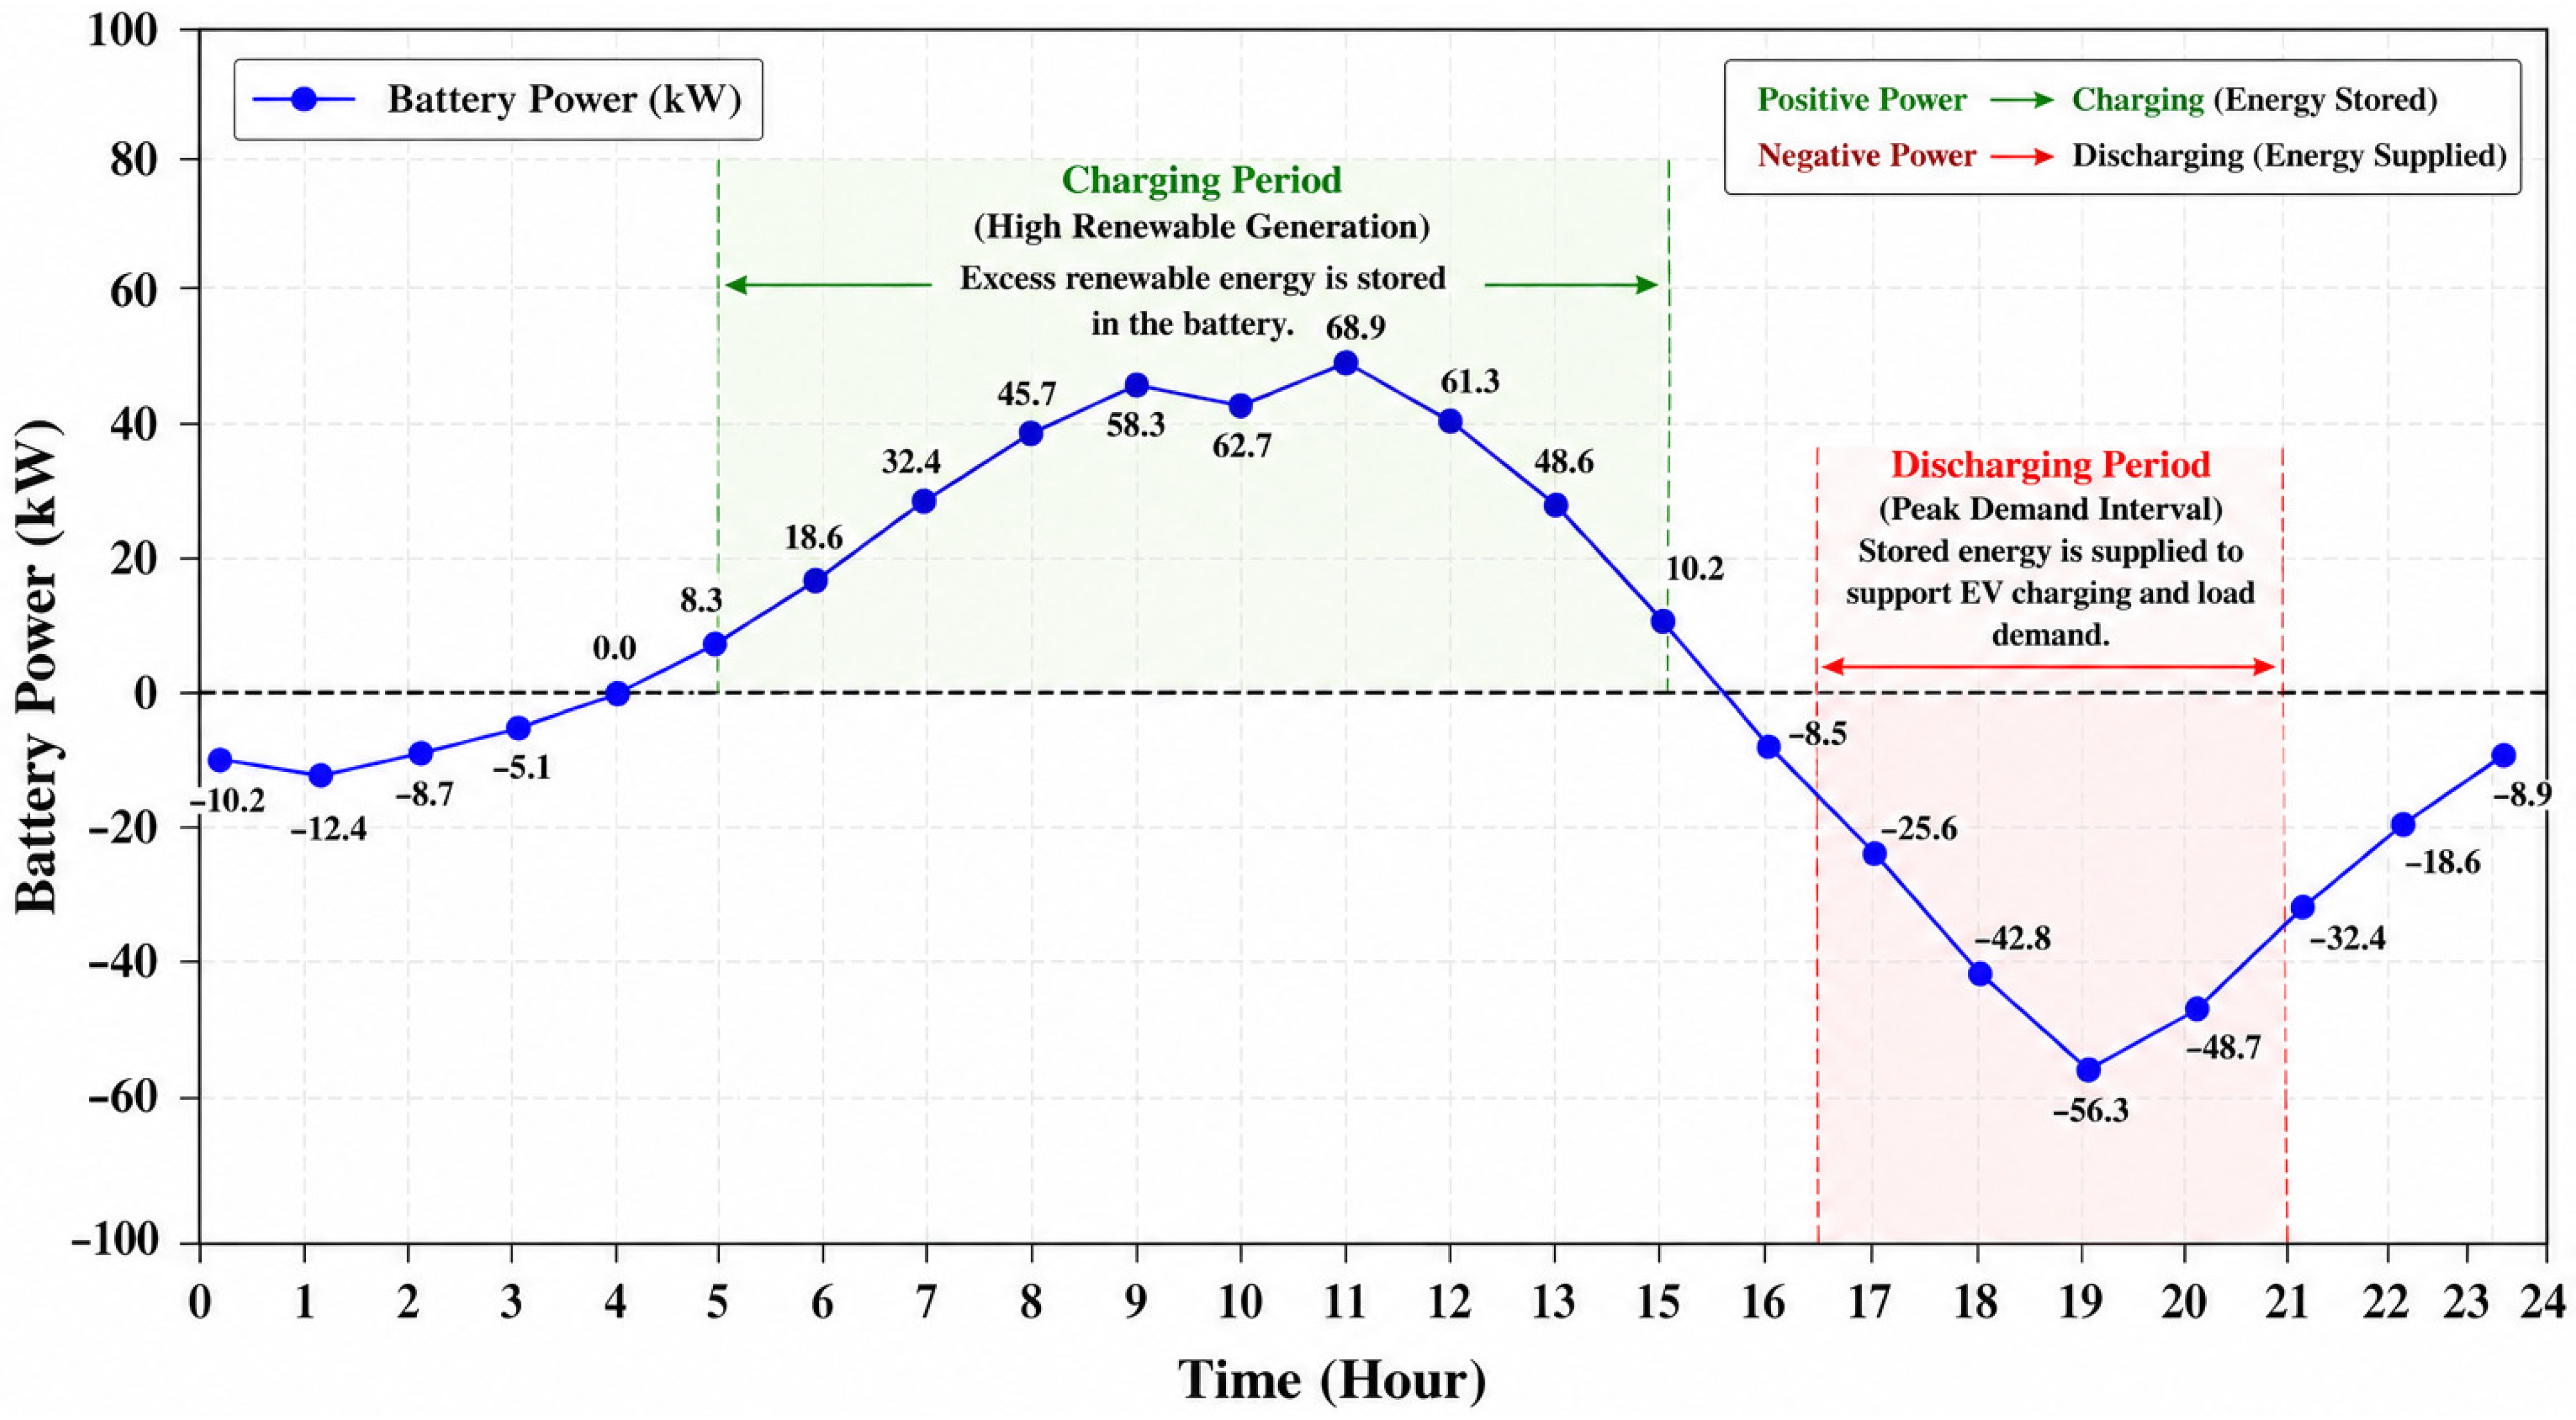
Figure 9 illustrates the variation in battery power during charging and discharging operations within the proposed Smart Grid framework. Positive battery power values represent charging periods during which excess energy generated from photovoltaic and wind energy systems is stored within the BESS. These charging intervals mainly occur during periods of high renewable energy availability and reduced load demand, enabling efficient storage of surplus renewable power for future utilization. Conversely, negative battery power values indicate discharging periods where the stored energy is supplied back to the smart grid to support EVCS demand and residential or commercial load requirements during peak operating conditions. The discharge operation becomes more significant during evening peak demand periods when renewable energy generation decreases and the overall system demand increases. The observed charging and discharging behavior demonstrates the effectiveness of the proposed GOA–HMGIGCN framework in coordinating battery energy storage operation for balanced power management and stable grid performance. Furthermore, the intelligent scheduling and adaptive control of battery operation contribute significantly to reducing grid dependency, minimizing operational cost, improving renewable energy utilization, and maintaining reliable energy supply under dynamic operating conditions. The results also confirm the capability of the proposed framework to achieve efficient energy storage coordination while supporting overall smart grid stability and operational reliability.
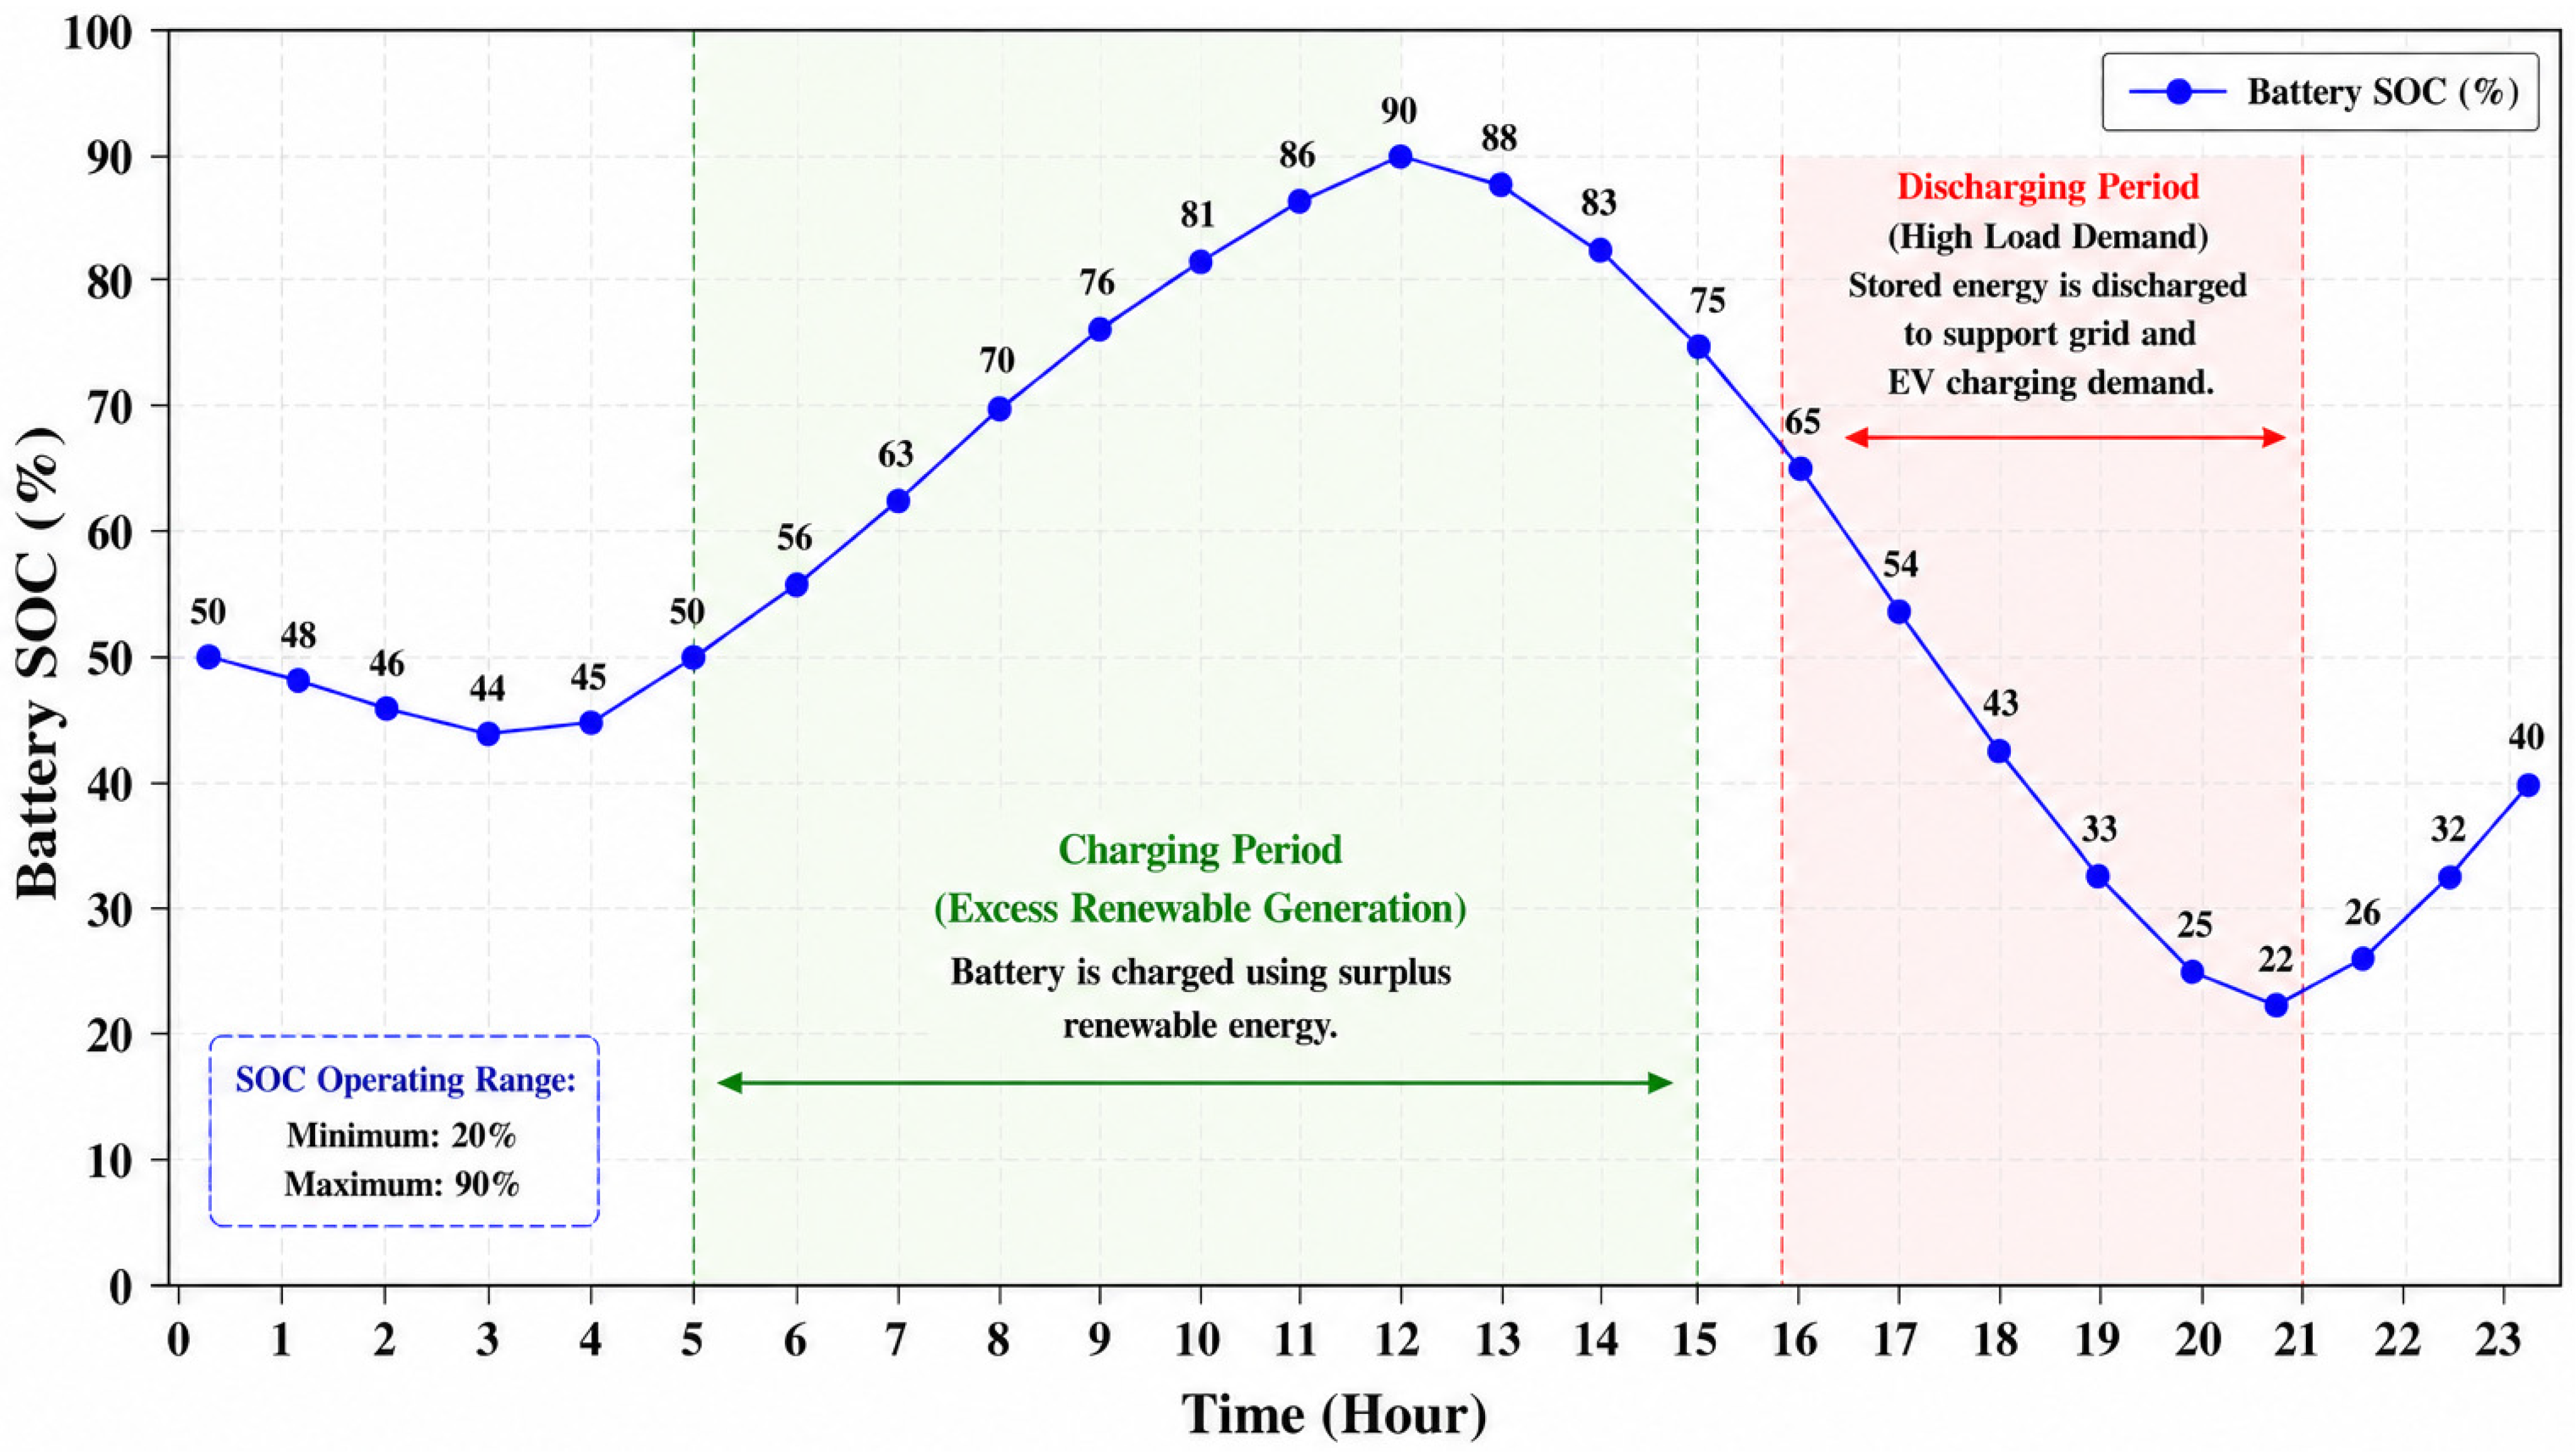
Figure 10 presents the variation in Battery SOC throughout the 24 h simulation period within the proposed Smart Grid framework. The SOC profile demonstrates the dynamic charging and discharging behavior of the BESS under varying renewable generation and load demand conditions. During periods of high photovoltaic and wind power generation, the battery SOC gradually increases as excess renewable energy is stored within the battery system. This charging process mainly occurs during daytime hours when renewable energy availability is high, and grid dependency is reduced. As the operating cycle progresses toward peak demand periods, particularly during the evening hours, the battery begins to discharge stored energy to support EVCS demand and residential or commercial load requirements. Consequently, SOC decreases progressively during these intervals due to increased energy utilization from the battery system. The reduction in SOC reflects the active participation of the BESS in maintaining power balance and supporting stable grid operation during periods of reduced renewable energy generation. Furthermore, the observed SOC profile confirms the effectiveness of the proposed GOA–HMGIGCN framework in performing intelligent battery energy management and adaptive energy scheduling under dynamic operating conditions. The coordinated charging and discharging strategy contributes significantly to improving renewable energy utilization, minimizing grid dependency, reducing operational cost, and enhancing overall smart grid reliability and operational stability.
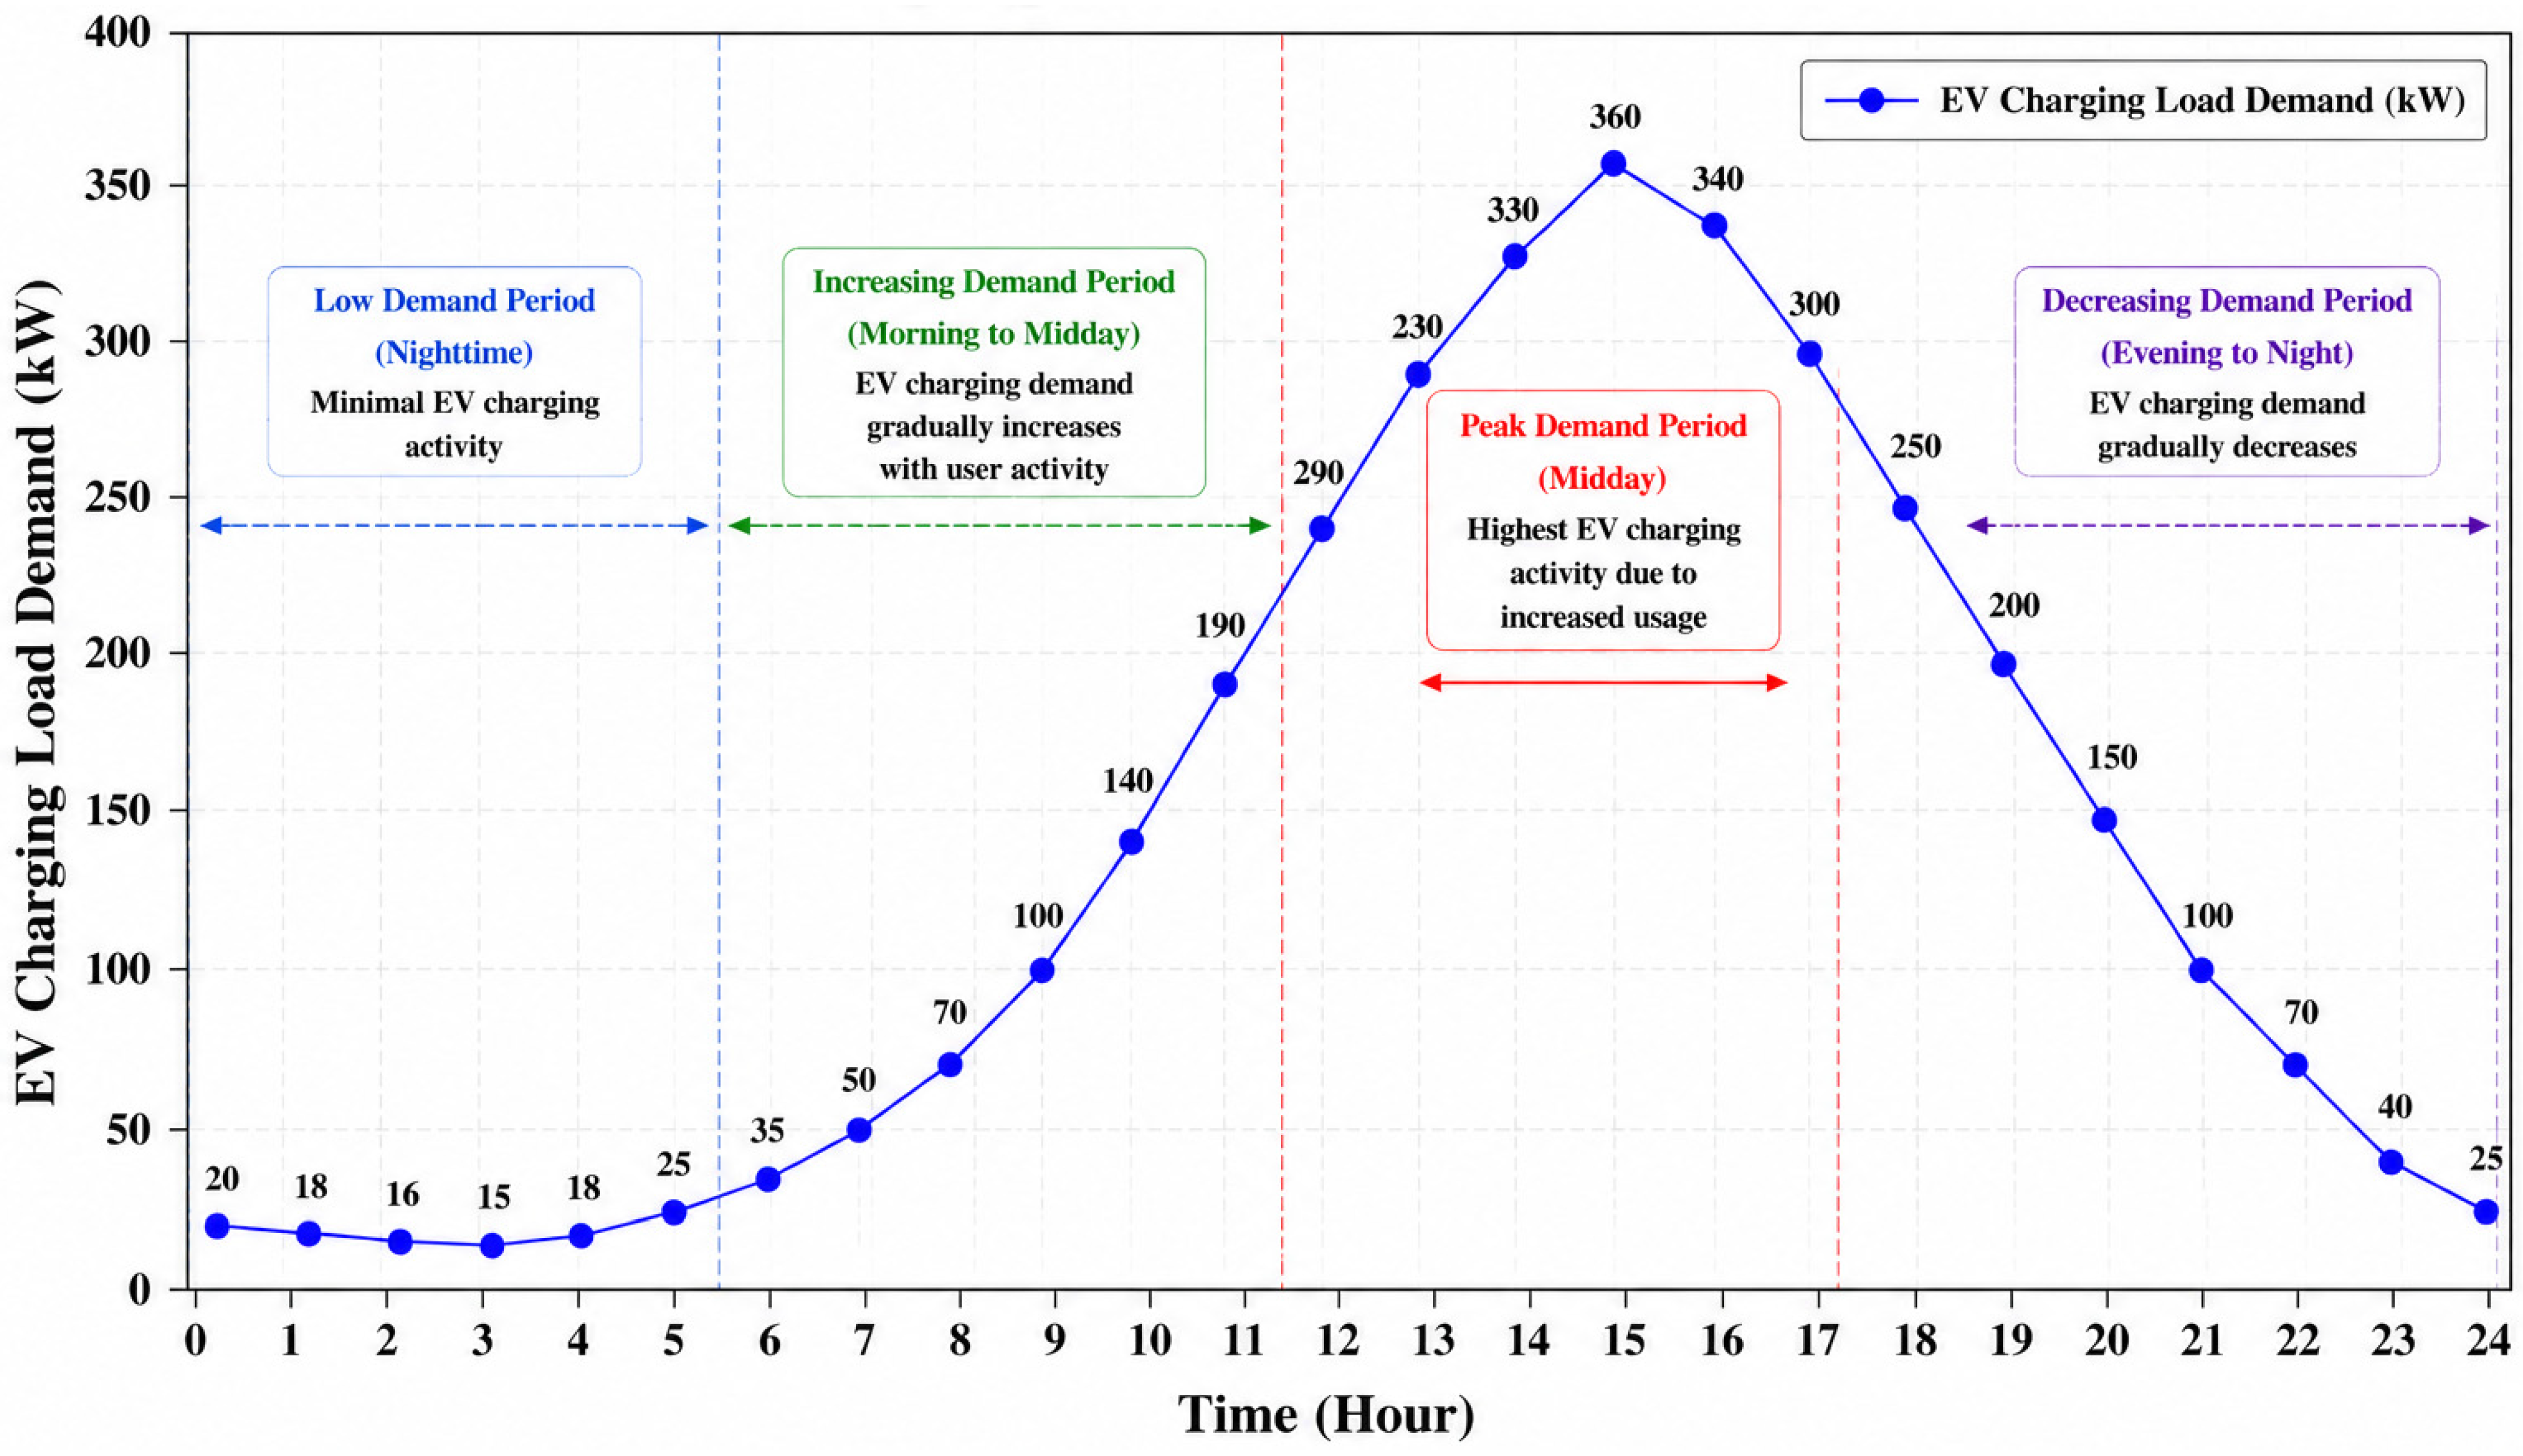
Figure 11 illustrates the variation in EV charging load demand over the 24 h operating period within the proposed Smart Grid framework. During the early morning hours, the EV charging demand remains relatively low due to reduced charging activities and limited vehicle connectivity to the charging infrastructure. As the day progresses, the charging demand gradually increases because of the rising number of EV users requiring charging services during daytime operating hours. The highest EV charging demand is observed around midday, where peak charging activity occurs due to increased vehicle charging requests from residential, commercial, and public charging stations. This peak demand period reflects the significant impact of user mobility patterns and charging behavior on smart grid energy consumption. Following the peak charging interval, the EV load demand progressively decreases toward the evening and nighttime periods as the number of connected vehicles reduces and charging activities decline. The obtained EV charging profile demonstrates the dynamic and time-dependent nature of EV energy demand within renewable-integrated smart grid systems. Furthermore, the results emphasize the importance of intelligent charging scheduling, coordinated load management, and adaptive energy allocation strategies within the proposed GOA–HMGIGCN framework. Effective management of EV charging demand is essential for minimizing grid congestion, reducing operational cost, improving renewable energy utilization, and maintaining stable and reliable smart grid operation under varying demand conditions.
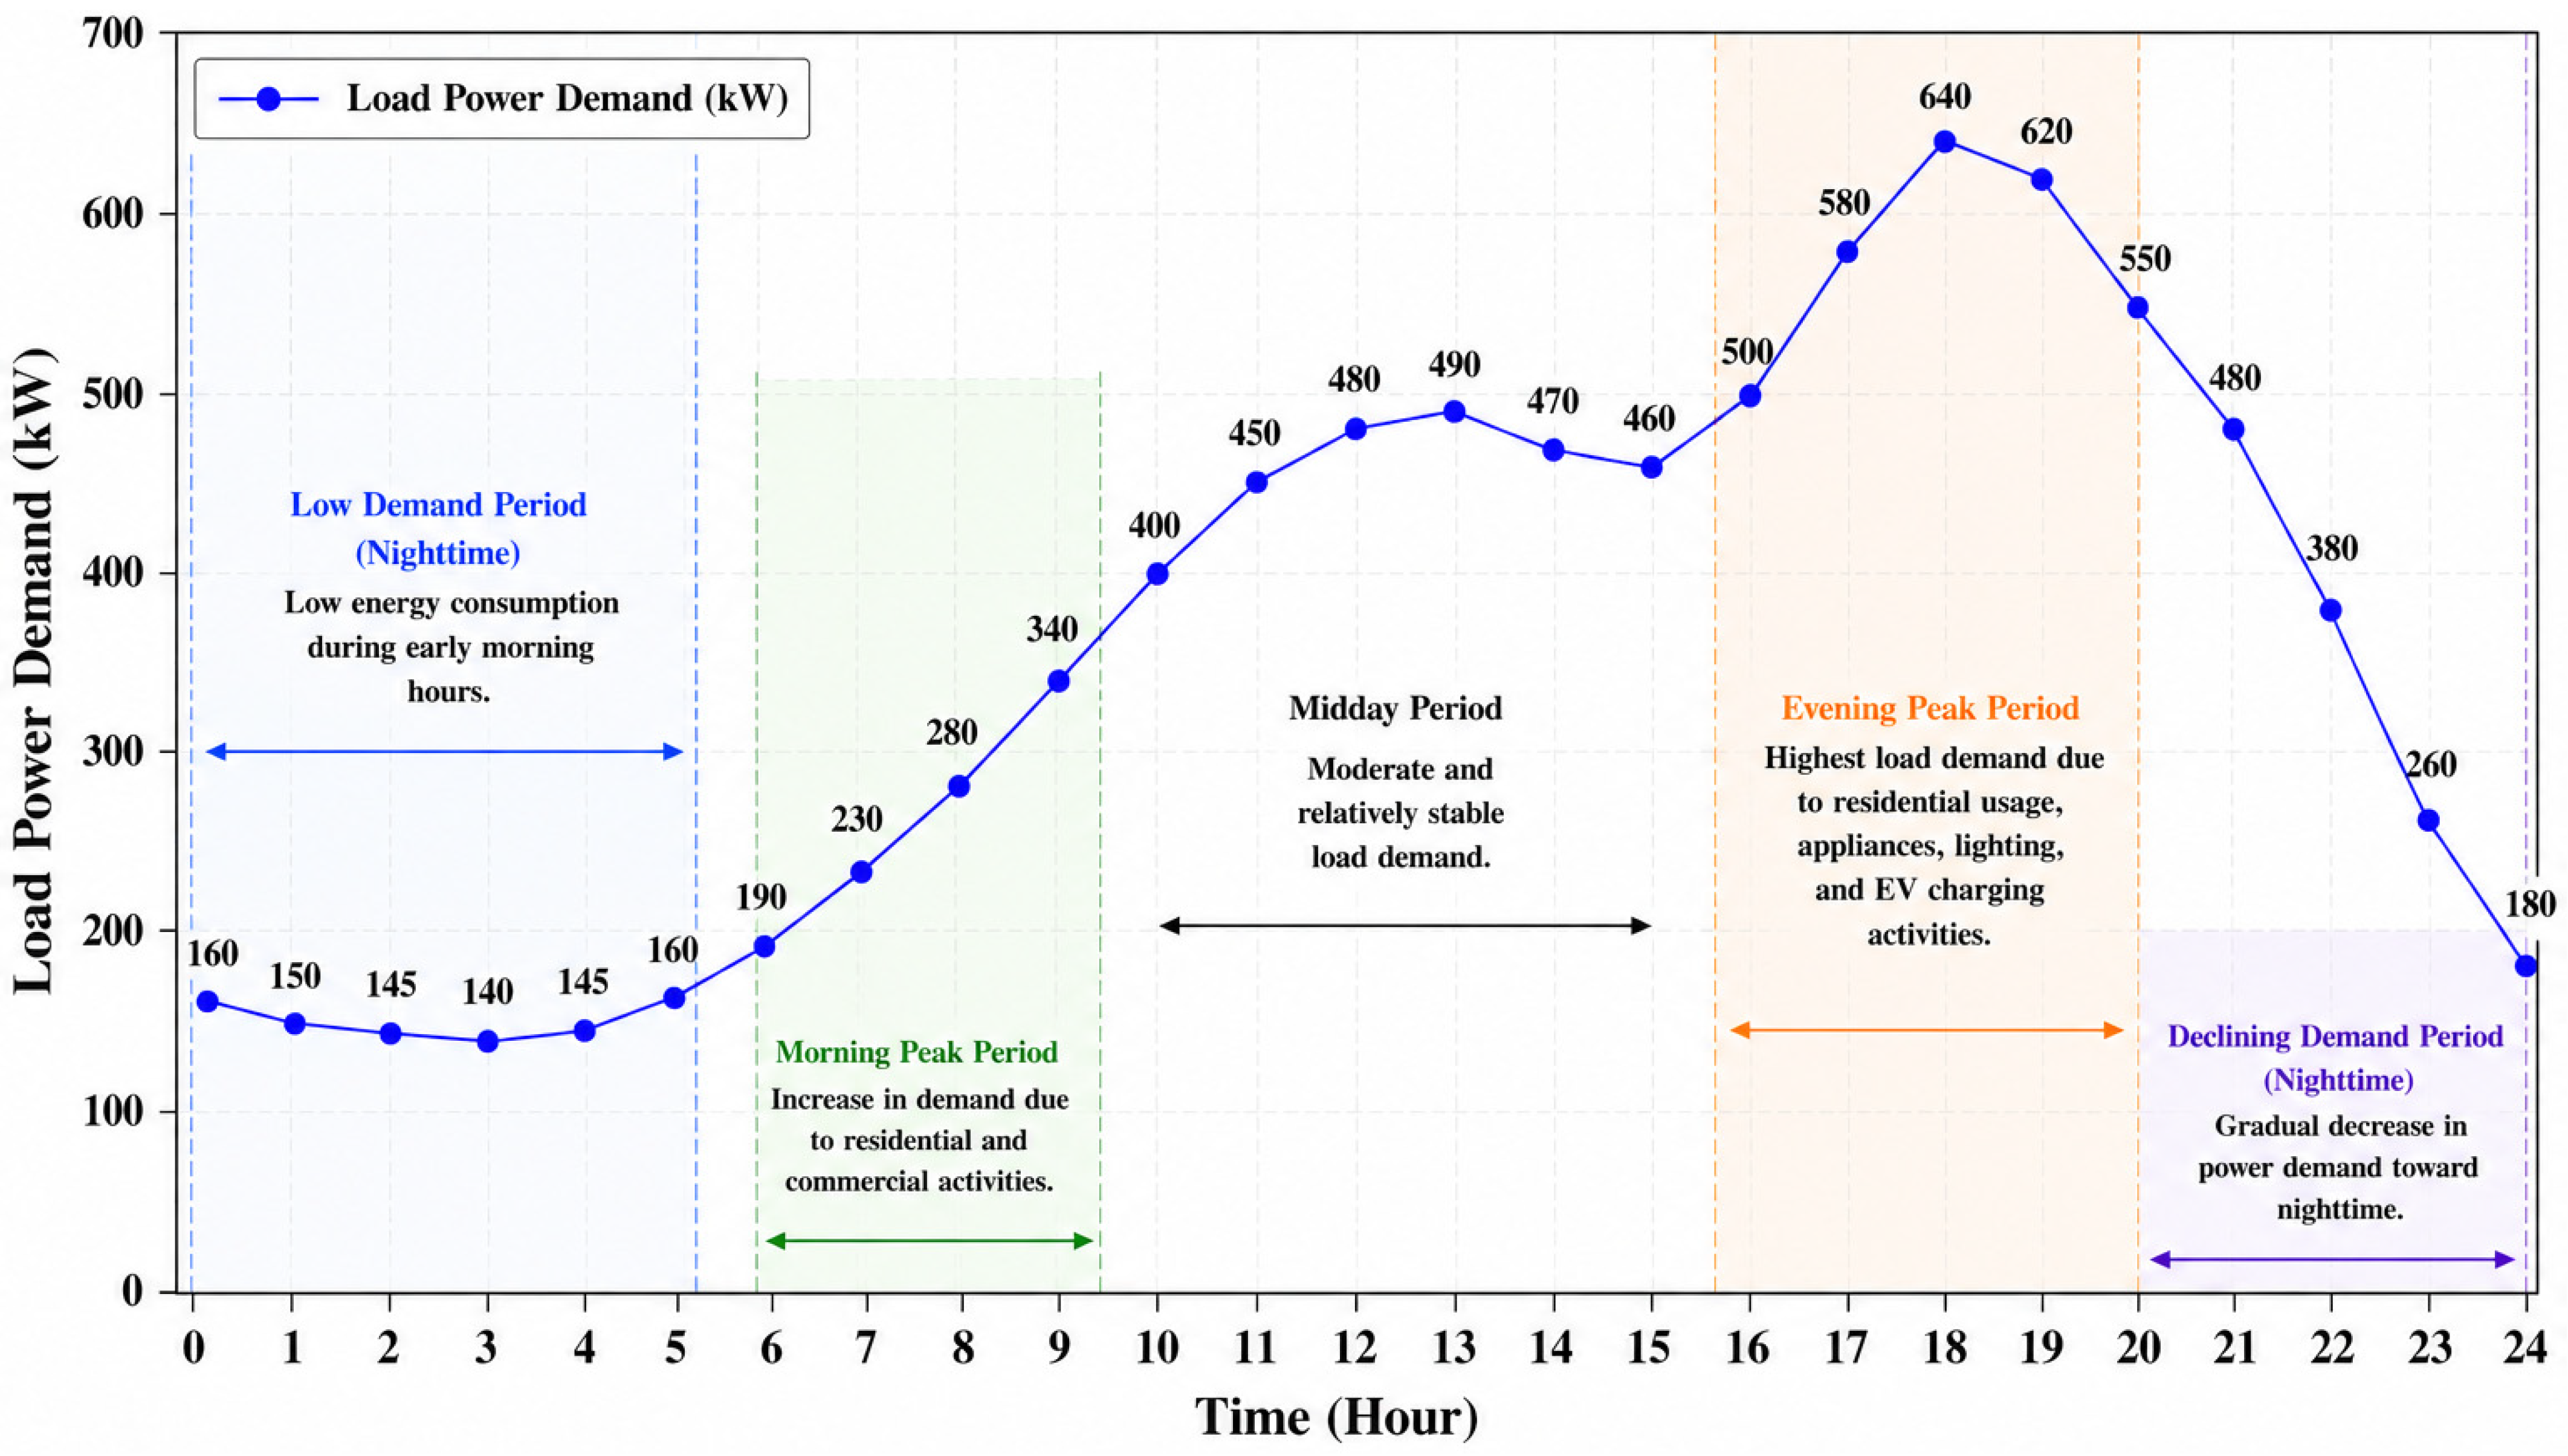
Figure 12 illustrates the variation in load power demand throughout the 24 h operating period within the proposed Smart Grid framework. During the early morning hours, the load demand remains relatively low due to reduced residential, commercial, and industrial energy consumption activities. As the day progresses, the load demand gradually increases, reflecting the rise in household and commercial electricity usage associated with daytime operational activities. A significant increase in load demand is observed during the morning peak period due to increased consumer activity and higher energy utilization across the smart grid network. The load demand then experiences moderate fluctuations during midday hours before increasing substantially again during the evening peak period. The highest demand is recorded during the evening hours when residential energy consumption, lighting demand, appliance utilization, and EVCS activities become more intensive. Following the evening peak interval, the load demand gradually decreases toward nighttime conditions as consumer energy usage declines. The obtained load profile demonstrates the dynamic and time-dependent characteristics of energy consumption within modern smart grid systems. Furthermore, the observed daily demand variation highlights the importance of intelligent energy scheduling, coordinated load management, and adaptive power allocation strategies within the proposed GOA–HMGIGCN framework. Effective management of load demand is essential for minimizing grid congestion, improving renewable energy utilization, reducing operational cost, and maintaining stable and reliable smart grid operation under varying demand conditions.
- (a)
Optimization Convergence Analysis
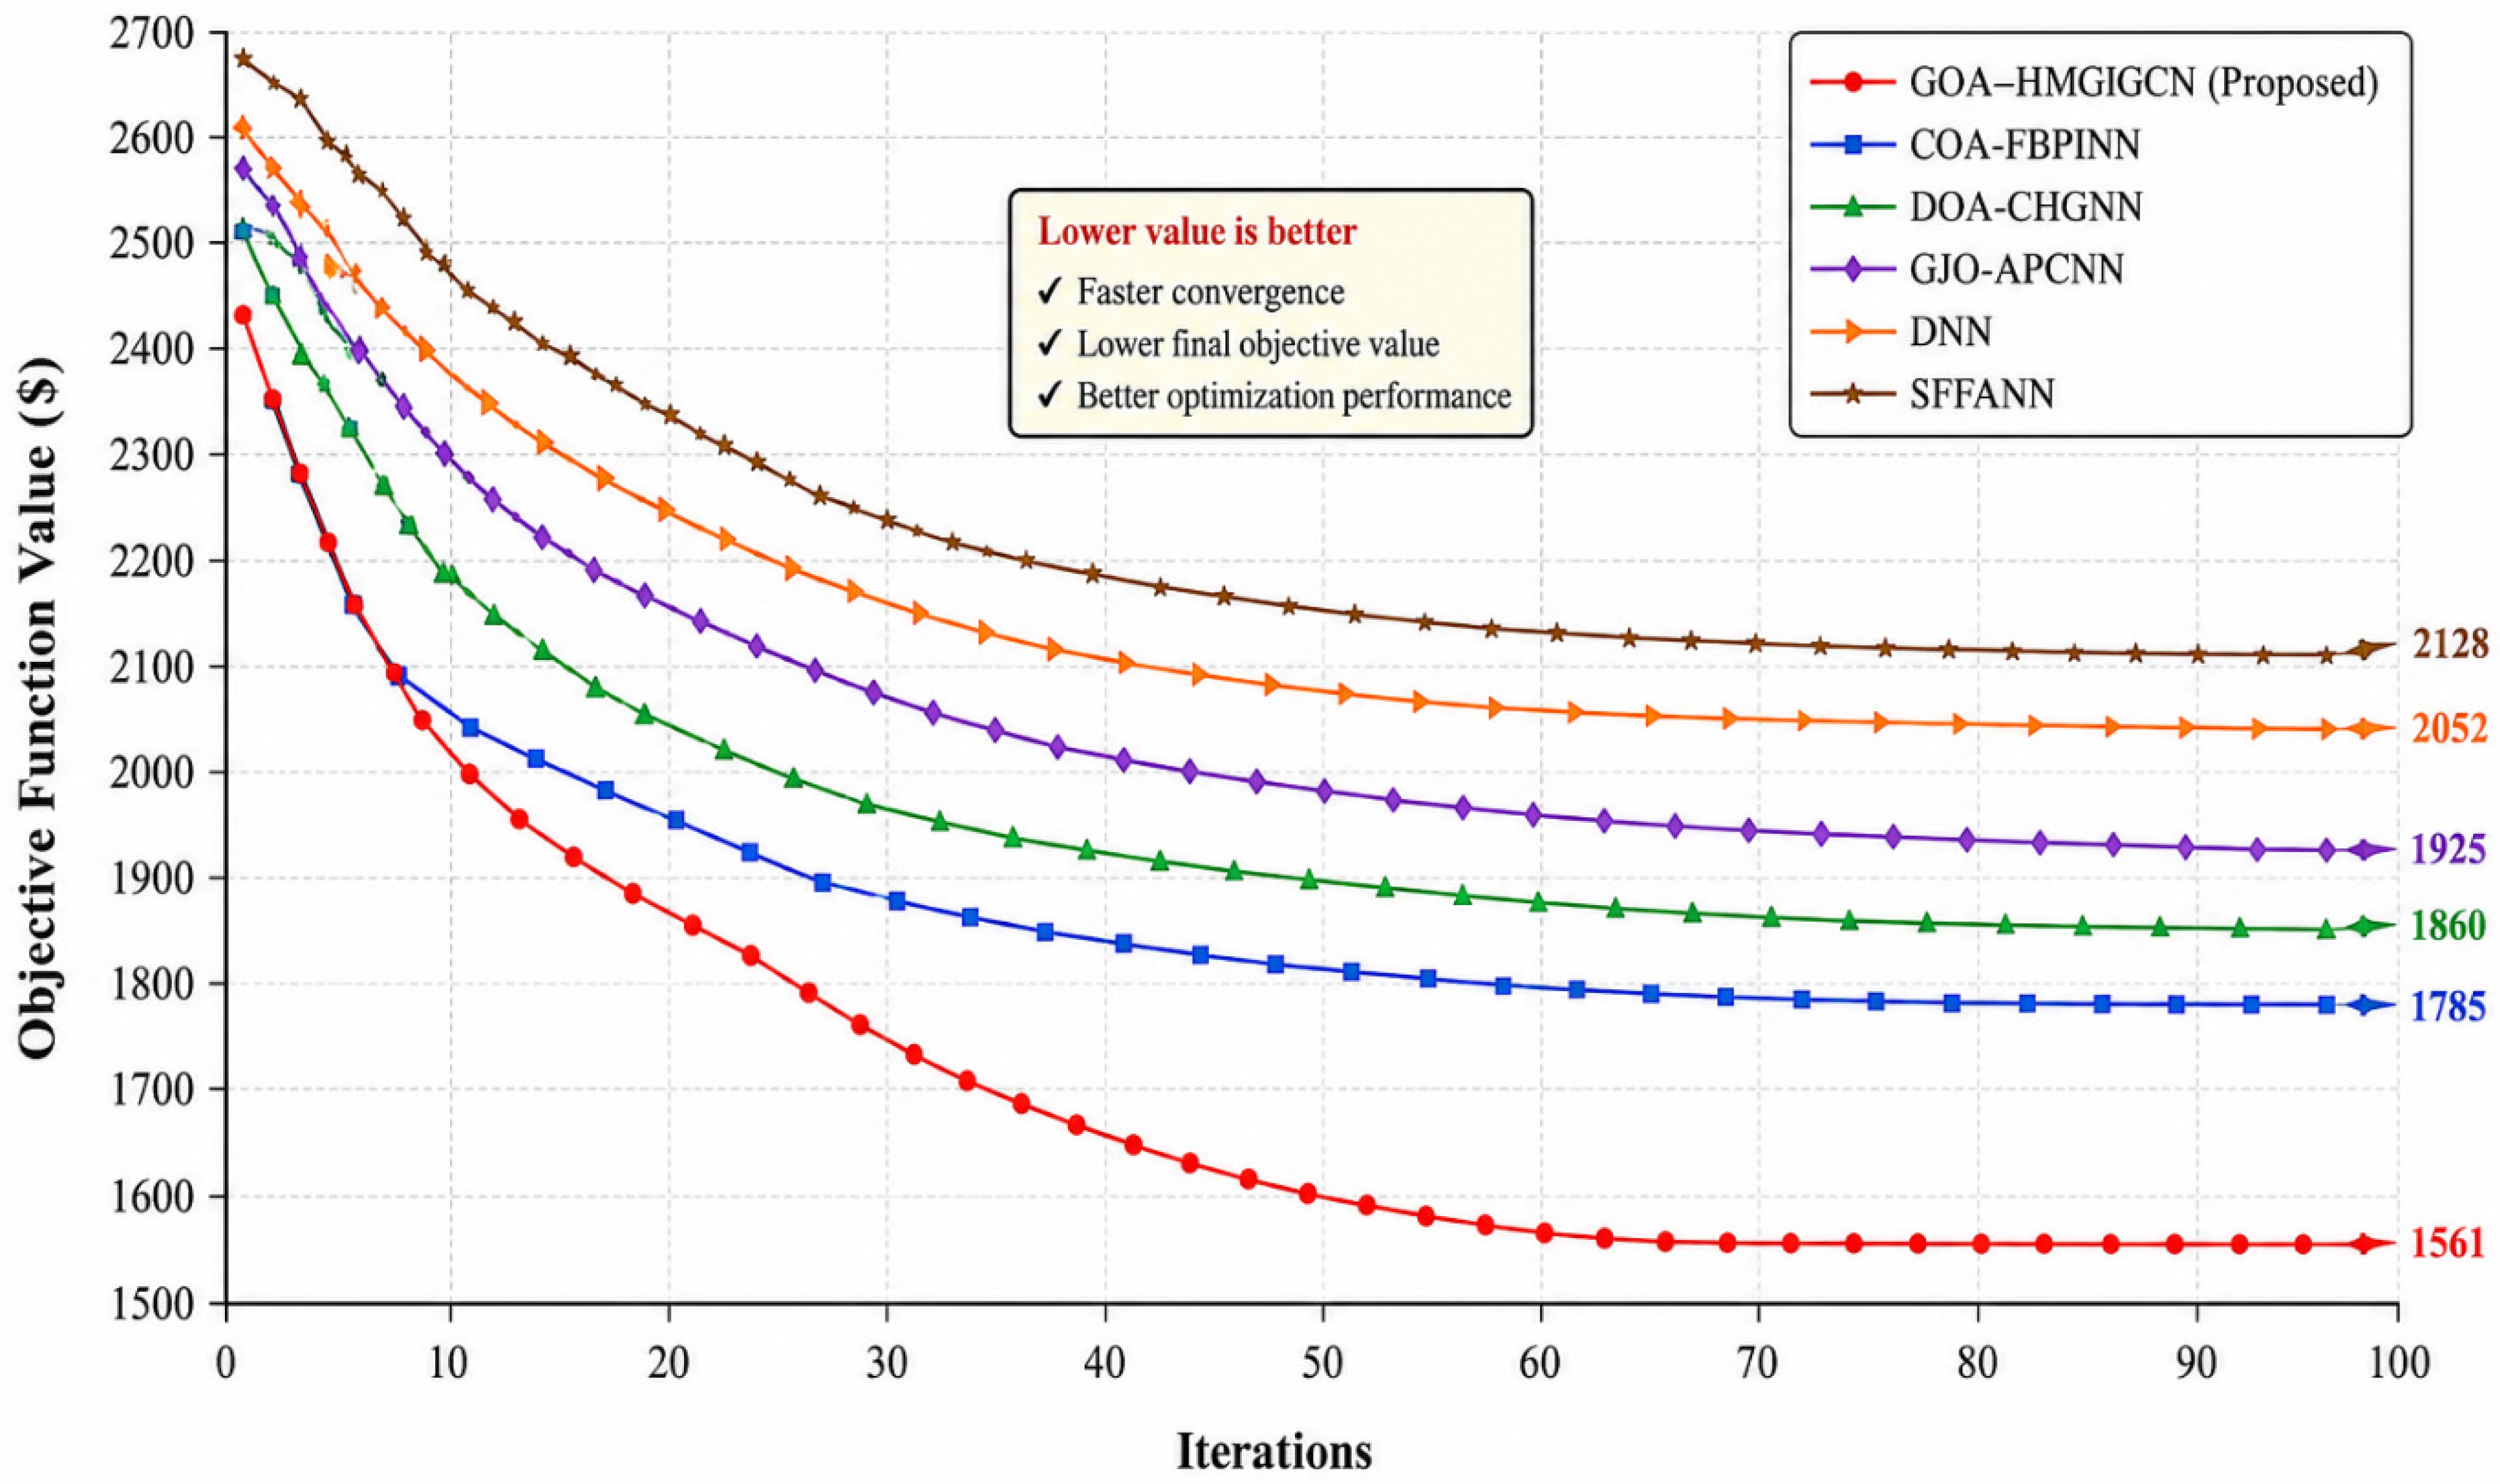
To further evaluate the effectiveness of the proposed GOA–HMGIGCN framework, the convergence characteristics of all optimization and intelligent energy management techniques were analysed. The convergence analysis examines the ability of each method to minimize the objective function, which consists of operational cost, charging time, emissions, and power losses, over successive iterations. Faster convergence and lower objective function values indicate better optimization performance and improved solution quality.
Figure 13 illustrates the convergence curves of GOA–HMGIGCN, COA-FBPINN, DOA-CHGNN, SFFANN, DNN, and GJO-APCNN over 100 iterations. It can be observed that the proposed GOA–HMGIGCN framework exhibits the fastest convergence rate and reaches the lowest objective function value compared with all benchmark methods. The objective function decreases sharply during the first 30 iterations due to the effective exploration capability of GOA and gradually stabilizes after approximately 70 iterations, indicating successful convergence toward the global optimum. In contrast, COA-FBPINN and DOA-CHGNN demonstrate slower convergence behaviour and require more iterations to reach stable solutions. Although these methods achieve acceptable optimization performance, they converge to higher objective function values than the proposed framework. Similarly, GJO-APCNN exhibits moderate convergence characteristics but shows limited improvement during later iterations, suggesting premature convergence to local optimal solutions. The conventional machine learning techniques, namely SFFANN and DNN, display the slowest convergence rates and attain the highest final objective function values. Their performance is constrained by limited optimization capabilities and reduced adaptability to dynamic smart grid operating conditions. Consequently, these methods require longer computational time and produce less optimal charging schedules and energy management decisions.
The results presented in
Table 3 indicate that GOA–HMGIGCN achieves the lowest final objective function value of 1561 while converging within approximately 70 iterations. This represents a reduction of 12.55%, 16.08%, 18.91%, 23.93%, and 26.64% compared with COA-FBPINN, DOA-CHGNN, GJO-APCNN, DNN, and SFFANN, respectively. The superior convergence performance can be attributed to the combined effect of GOA-based optimization and HMGIGCN-based forecasting, which provide accurate future demand estimation and effective search-space exploration. Overall, the convergence analysis confirms that the proposed GOA–HMGIGCN framework not only achieves superior energy management performance but also demonstrates faster and more stable convergence characteristics than existing optimization and deep learning techniques. This validates the suitability of the proposed framework for real-time smart grid energy management and EV charging coordination applications.
- (b)
EVCS Placement Optimization Analysis Using the Proposed GOA–HMGIGCN Method
The EVCS placement optimization was conducted using the proposed GOA–HMGIGCN method to identify the most suitable buses for charging station installation in the IEEE 14-bus smart grid system. In this stage, HMGIGCN predicts EV charging demand, renewable generation, and load variations, while GOA utilizes these predictions to determine the optimal charging station locations that minimize operational cost, charging time, power losses, and voltage deviation. The optimal EVCS locations obtained using the proposed framework are summarized in
Table 4. The results indicate that Buses 4, 7, 10, and 13 provide the most favourable charging station placement due to their strategic positions within the network, improved voltage profiles, and reduced transmission losses. These locations enable efficient charging service coverage while maintaining stable system operation and balanced power distribution.
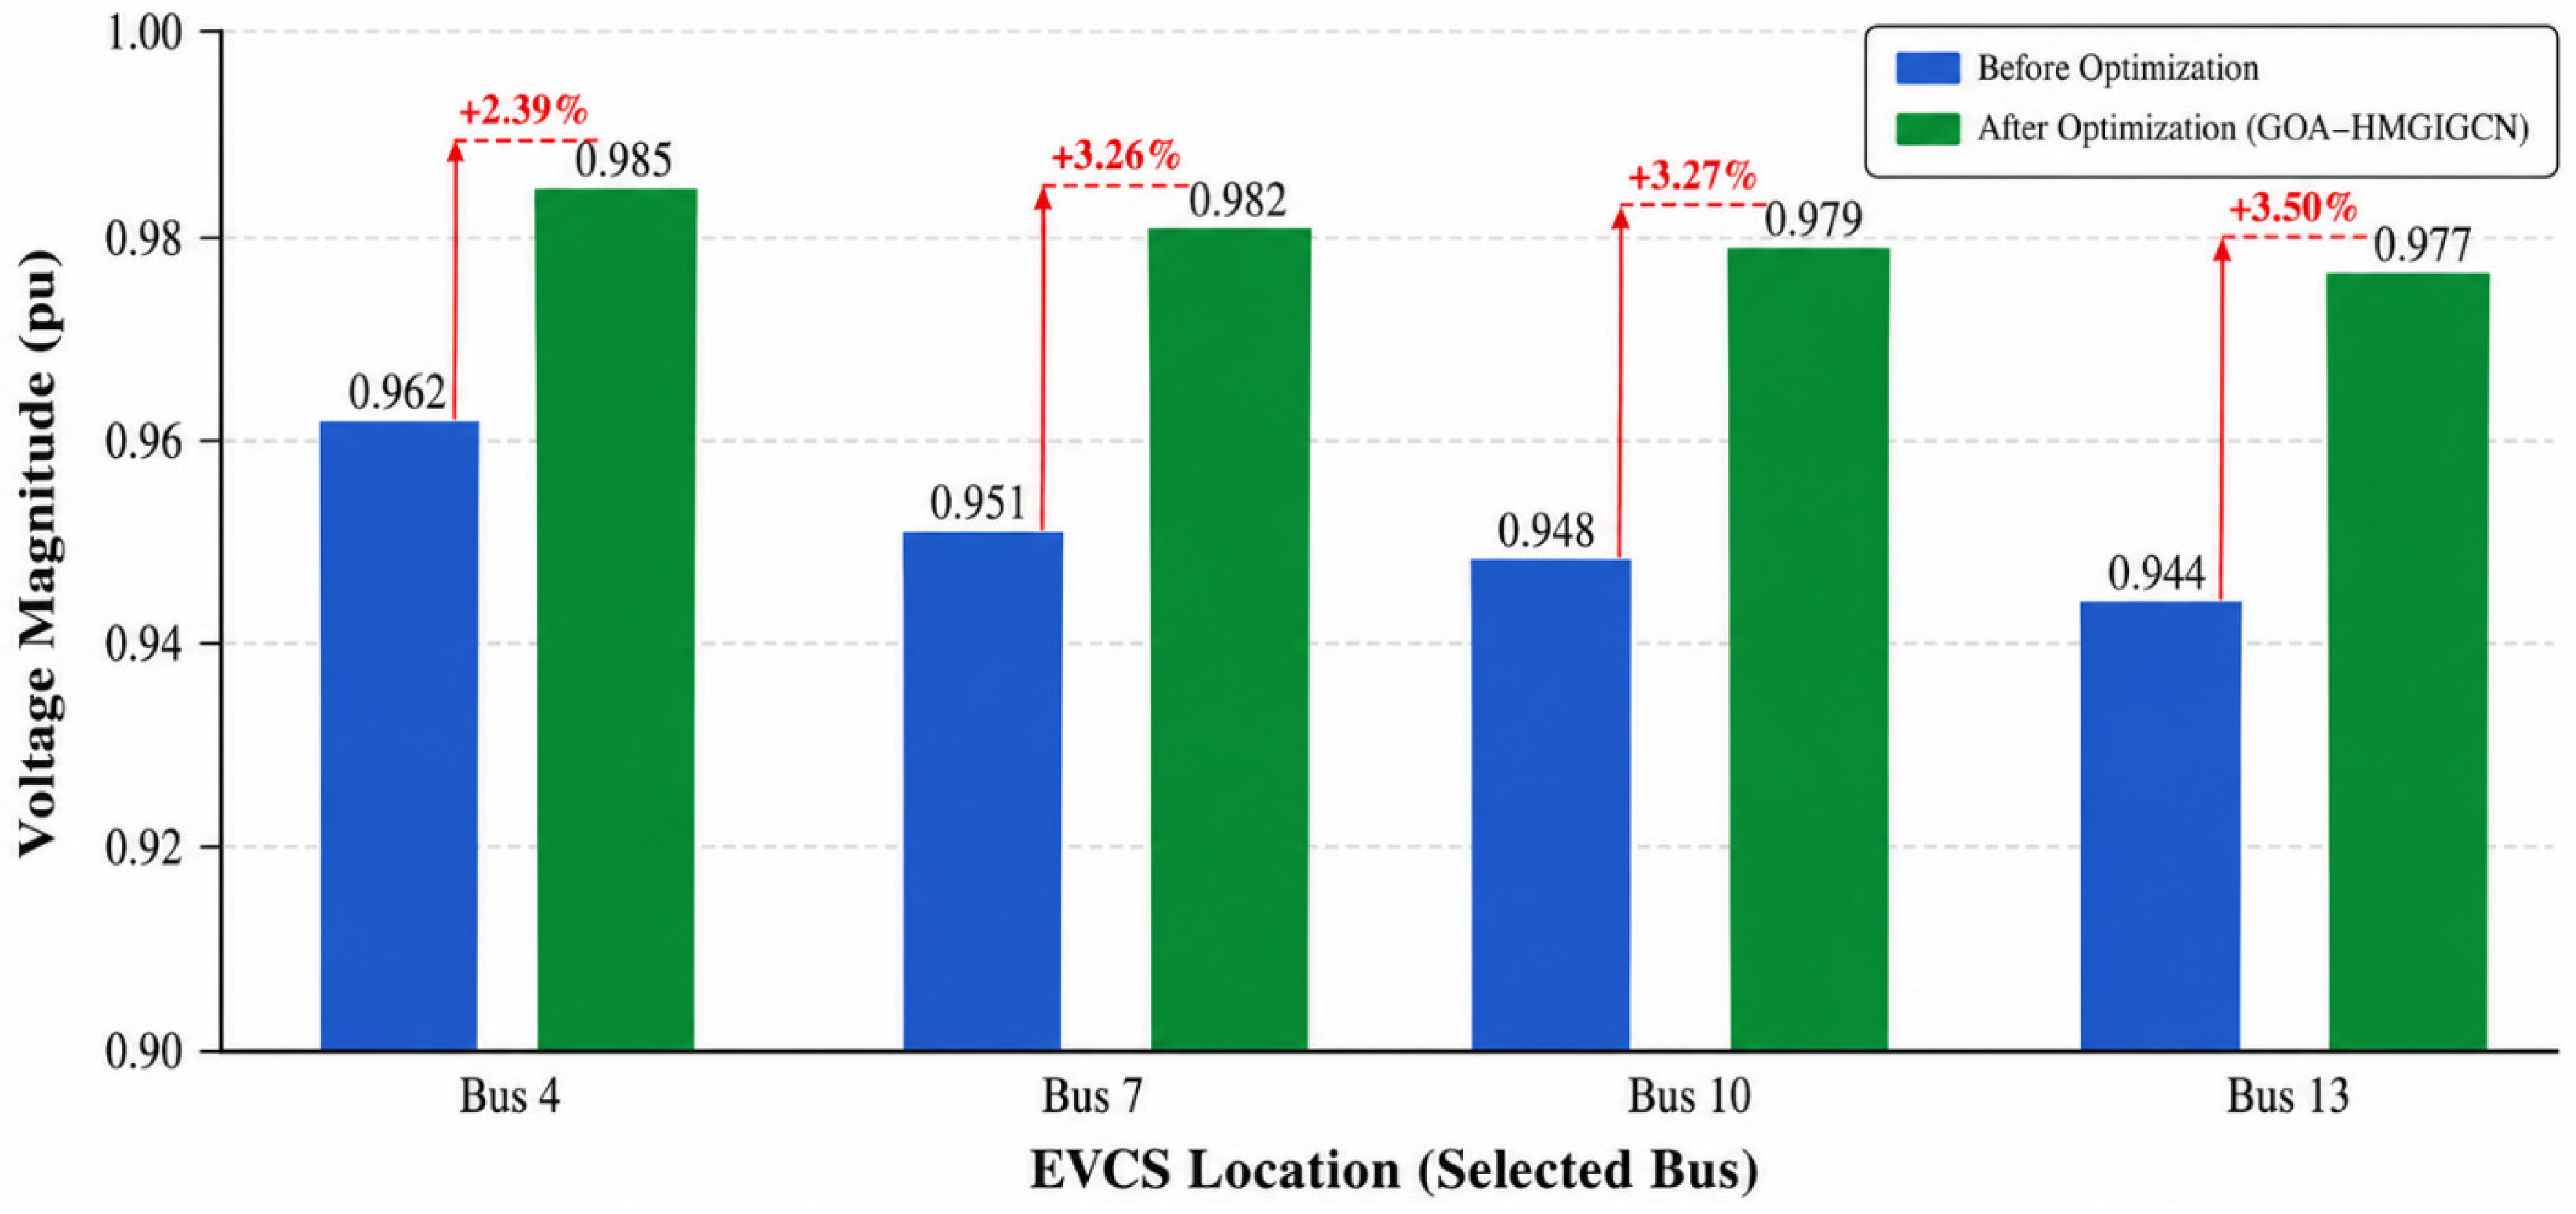
The voltage profile improvement achieved by the proposed GOA–HMGIGCN framework is illustrated in
Figure 14. Prior to optimization, several buses experienced voltage drops due to increased EV charging demand and network loading conditions. After the optimal placement of EV charging stations at Buses 4, 7, 10, and 13, the voltage magnitudes improved significantly across all selected locations. As shown in
Figure 14, the voltage at Bus 4 increased from 0.962 pu to 0.985 pu, while Bus 7 improved from 0.951 pu to 0.982 pu. Similarly, the voltage magnitude at Bus 10 increased from 0.948 pu to 0.979 pu, and Bus 13 improved from 0.944 pu to 0.977 pu. The largest improvement was observed at Bus 13, where the voltage increased by approximately 3.5%. The improved voltage profile confirms the effectiveness of the proposed GOA–HMGIGCN method in identifying suitable EVCS locations that reduce feeder loading and improve power distribution efficiency. Furthermore, the optimized placement contributed to loss reductions ranging from 8.7% to 12.1%, resulting in enhanced grid stability and operational reliability. The results demonstrate that the proposed framework effectively mitigates voltage violations and supports secure integration of EV charging infrastructure within the IEEE 14-bus smart grid network.
- (c)
Comparative Performance Results Analysis
Table 5 presents the comparative performance analysis between the proposed GOA–HMGIGCN framework and existing energy management techniques under identical operating conditions within the IEEE 14-bus Smart Grid environment. The comparison is conducted in terms of operational cost, system efficiency, power loss, and EV charging time to evaluate the effectiveness of the proposed intelligent optimization and forecasting framework. The obtained results indicate that the proposed GOA–HMGIGCN framework achieves the best overall performance among all considered methods. The proposed model attained the lowest operational cost of
$1561, which is significantly lower than COA-FBPINN (
$1785), DOA-CHGNN (
$1860), GJO-APCNN (
$1925), DNN (
$2052), and SFFANN (
$2128). The reduction in operational cost demonstrates the effectiveness of the proposed optimization strategy in improving energy utilization and minimizing unnecessary grid power consumption. In terms of system efficiency, the GOA–HMGIGCN framework achieved the highest efficiency of 99.2%, outperforming COA-FBPINN (96.1%), DOA-CHGNN (95.9%), GJO-APCNN (94.6%), DNN (93.4%), and SFFANN (92.7%). The improvement in efficiency is attributed to the coordinated interaction between the Goat Optimization Algorithm (GOA) and the Hierarchical Multi-Granularity Interaction Graph Convolutional Network (HMGIGCN), which enables intelligent charging coordination and adaptive energy scheduling under varying operating conditions.
Furthermore, the proposed framework achieved the minimum power loss of 10.6 kW compared to 12.5 kW for COA-FBPINN, 14.2 kW for DOA-CHGNN, 15.9 kW for GJO-APCNN, 17.3 kW for DNN, and 17.9 kW for SFFANN. The reduction in power loss confirms the capability of the proposed framework to improve power distribution efficiency and reduce unnecessary energy dissipation within the smart grid network. The charging time analysis also demonstrates superior performance of the proposed GOA–HMGIGCN framework. The proposed method achieved the shortest charging duration of 32 min, whereas COA-FBPINN, DOA-CHGNN, GJO-APCNN, DNN, and SFFANN required 37 min, 39 min, 42 min, 45 min, and 47 min, respectively. The reduced charging time confirms the effectiveness of the proposed intelligent scheduling mechanism in minimizing charging congestion and improving EV charging coordination. Overall, the comparative analysis confirms that the proposed GOA–HMGIGCN framework provides superior operational performance, improved energy efficiency, reduced power loss, and faster EV charging capability compared with conventional optimization and deep learning techniques.
Table 6 presents the ablation study conducted to evaluate the individual and combined contributions of GOA and HMGIGCN within the proposed hybrid framework. The analysis compares the performance of GOA alone, HMGIGCN alone, and the integrated GOA–HMGIGCN configuration in terms of operational cost, efficiency, and power loss. When GOA is applied independently, the framework achieved an operational cost of
$1708, system efficiency of 96.9%, and power loss of 12.3 kW. The optimization capability of GOA contributed to effective EV charging scheduling and improved energy distribution; however, the absence of intelligent forecasting limited the overall performance of the system. Similarly, the standalone HMGIGCN framework achieved improved predictive performance with a lower operational cost of
$1654, higher efficiency of 97.3%, and reduced power loss of 11.8 kW. The deep learning framework effectively captured temporal and spatial relationships within the smart grid environment, enabling improved prediction of renewable generation and EV charging demand. However, the lack of advanced optimization capability restricted the overall energy coordination performance. The integrated GOA–HMGIGCN framework achieved the best overall performance with the minimum operational cost of
$1561, maximum efficiency of 99.2%, and lowest power loss of 10.6 kW. The hybrid integration of intelligent forecasting and optimization significantly enhanced charging coordination, renewable energy utilization, and adaptive power allocation within the smart grid network. The ablation study therefore confirms that the combination of GOA and HMGIGCN provides superior operational efficiency and system reliability compared to the individual implementation of either optimization or predictive learning techniques alone.
- (d)
HMGIGCN Forecasting Performance Validation
To validate the forecasting capability of the proposed HMGIGCN model, additional prediction performance experiments were conducted using load demand, renewable generation, and EV charging demand datasets obtained from the IEEE 14-bus smart grid environment. The forecasting accuracy was evaluated using standard performance metrics, including Mean Absolute Error (MAE), Root Mean Square Error (RMSE), Mean Absolute Percentage Error (MAPE), and the coefficient of determination (R
2). These metrics provide a comprehensive assessment of prediction accuracy, error distribution, and model reliability. The results presented in
Table 7 demonstrate the excellent forecasting capability of the proposed HMGIGCN model. The model achieved an average MAE of 0.014 and an average RMSE of 0.019, indicating very low prediction errors across all forecasting tasks. Similarly, the average MAPE value of 1.71% confirms a high level of forecasting accuracy, significantly below the commonly accepted threshold of 5% for accurate prediction models. Furthermore, the average R
2 value of 0.993 indicates a very strong correlation between the predicted and actual values, demonstrating the model’s ability to capture complex temporal and spatial relationships within the smart grid system. Among the evaluated variables, EV charging demand achieved the highest prediction accuracy with an R
2 value of 0.995 and the lowest MAPE of 1.57%. These results confirm that the proposed HMGIGCN model provides reliable and accurate forecasting information for intelligent energy management, charging coordination, and renewable energy integration within the proposed GOA–HMGIGCN framework.
7. Discussion of Results
The simulation results demonstrate that the proposed GOA–HMGIGCN framework effectively improves the operational performance of the IEEE 14-bus Smart Grid integrated with RESs, BESSs, and EVCSs. The framework successfully coordinated renewable generation, battery storage operation, EV charging demand, and utility grid support under varying operating conditions. The obtained results confirm the capability of the proposed model to minimize operational cost, reduce charging congestion, improve renewable energy utilization, and maintain stable smart grid operation. The solar irradiance profile presented in
Figure 4 shows that the irradiance increased from approximately 0 W/m
2 during early morning hours to a peak value of nearly 15 W/m
2 around midday before decreasing gradually toward evening conditions. Correspondingly, the PV power generation shown in
Figure 6 increased from nearly 0 kW during nighttime conditions to a maximum value of approximately 134.2 kW at midday. The direct relationship between solar irradiance and PV power generation confirms the effectiveness of the renewable generation modelling within the proposed framework. Furthermore, the solar temperature profile in
Figure 5 varied between approximately 10 °C and 30 °C throughout the day, influencing PV operating efficiency and renewable energy production characteristics.
The wind power generation results illustrated in
Figure 7 indicate fluctuating renewable power contribution due to changing wind speed conditions. The wind power output varied between approximately 33.8 kW and 125.4 kW over the simulation period, with the highest power generation observed during evening hours due to increased wind activity. These fluctuations demonstrate the intermittent nature of wind energy generation and justify the need for intelligent forecasting and adaptive energy scheduling within smart grid systems. The utility grid power profile shown in
Figure 8 demonstrates the coordinated interaction between renewable energy generation and utility grid support. During early operating hours, the grid supplied approximately 95.3 kW to satisfy load demand and EV charging requirements. However, during midday periods with high renewable generation, the grid power reduced significantly and reached a minimum reverse power flow value of approximately −32.4 kW, indicating surplus renewable energy export back to the utility grid. During evening peak demand periods, the grid contribution increased again to approximately 93.2 kW to maintain system reliability and stable power supply. The battery charging and discharging characteristics illustrated in
Figure 9 and
Figure 10 further validate the effectiveness of the proposed GOA–HMGIGCN framework in performing intelligent energy storage management. The battery charging power reached approximately 68.9 kW during periods of excess renewable generation, while the maximum discharging power reached approximately −56.3 kW during evening peak demand intervals. Similarly, the battery SOC increased from approximately 44% during early morning conditions to a maximum value of 90% at midday before decreasing to approximately 22% during evening discharge operation. These results confirm efficient charge–discharge coordination and balanced energy storage utilization within the proposed framework.
The EV charging load demand profile presented in
Figure 11 shows that the charging demand increased progressively from approximately 15–20 kW during early morning hours to a peak value of nearly 360 kW during midday charging periods. Thereafter, the charging demand gradually decreased toward nighttime conditions. Similarly, the load power demand profile in
Figure 12 increased from approximately 140–160 kW during early morning periods to a maximum evening peak demand of approximately 640 kW due to increased residential, commercial, and EV charging activities. The ability of the proposed framework to coordinate these varying load conditions demonstrates its effectiveness in minimizing grid congestion and improving energy distribution stability. Overall, the obtained simulation results confirm that the proposed GOA–HMGIGCN framework provides significant improvements in operational performance, renewable energy utilization, charging coordination, and smart grid reliability under dynamic operating conditions. The coordinated integration of optimization and intelligent forecasting mechanisms enables adaptive energy management, reduced dependency on utility grid support, minimized power losses, and improved system stability compared with conventional energy management approaches.