1. Introduction
Surface electromyography (sEMG) has emerged as a promising biosignal for controlling prosthetic devices and human–computer interfaces. The effectiveness of sEMG-based control systems fundamentally depends on accurate, real-time classification of intended movements from myoelectric signals. However, a critical trade-off exists between classification accuracy and system latency: longer analysis windows typically yield higher accuracy but introduce unacceptable delays for natural, responsive control.
Previous work in our laboratory established a baseline system achieving 85% accuracy for seven transtibial movement classes using 1000 ms analysis windows. While this performance is competitive with published literature, the 1 s latency is impractical for real-time prosthetic control, where response times under 100 ms are desirable for natural interaction.
This study addresses the fundamental research question: How can we maintain high classification accuracy while reducing analysis window duration to enable real-time control? We systematically investigate this problem through:
Feature engineering optimization for short windows;
Multi-window voting strategies to improve robustness;
Frequency-domain feature integration;
Dimensionality reduction analysis;
Documentation of failed experimental approaches.
Our contributions include:
A systematic methodology for reducing window size from 1000 ms to 64 ms, validated across nine subjects;
Demonstration that PCA provides zero benefit for linear SVM with full feature retention;
Comprehensive feature analysis proving all 44 engineered features are non-redundant and necessary;
Documented negative results (adaptive windowing, spectral entropy) to guide future research;
Complete implementation details enabling reproduction and continuation of this work.
2. Related Work
2.1. Lower Limb vs. Upper Limb EMG Classification
While the majority of EMG classification research focuses on upper limb applications (hand gesture recognition, arm movement classification), the fundamental signal processing and machine learning techniques are directly applicable to lower limb prosthetic control. Transtibial EMG classification for below-knee prostheses faces similar challenges: real-time processing requirements, feature extraction from noisy signals, and classification under varying conditions. The key difference lies in the movement repertoire and electrode placement locations. Our work adapts established EMG classification methodologies to the specific context of transtibial prosthetic control, where ankle and foot movements must be distinguished from EMG signals collected from the lower leg musculature.
2.2. EMG Feature Extraction: Time and Frequency Domains
The foundation of EMG-based movement classification lies in effective feature extraction from myoelectric signals. Amplitude-based features (MAV, RMS, VAR, WL) generally outperform complexity-based features (zero-crossings, slope sign changes) for movement classification. Our choice of MAV2, RMS, MAX, VAR, LOG, and IEMG emphasizes amplitude-based measures, particularly suitable for short-window scenarios where noise sensitivity is critical.
Frequency-domain features have evolved significantly over the past decade. Frequency-domain representations capture muscle activation patterns complementary to time-domain features. Median frequency (MF) and mean power frequency (MPF) are particularly robust indicators of muscle fatigue and activation intensity. Frequency-domain features can improve classification accuracy when combined with time-domain features in gesture recognition systems.
Recent investigations into time–frequency representations have shown promise for non-stationary EMG analysis. Menon et al. [
1] employed Short-Time Fourier Transform (STFT) for movement onset detection and feature extraction in prosthetic control, achieving 89% accuracy with 150 ms windows. Continuous Wavelet Transform (CWT) has been explored by Too et al. [
2], demonstrating that wavelet-based spectrograms provide rich representations for deep learning classifiers, though at the cost of increased computational complexity.
2.3. Window Length Optimization and Real-Time Processing
The fundamental trade-off between classification accuracy and system latency has been extensively studied. Geng et al. [
3], in their influential work, demonstrated that window lengths between 150 and 300 ms provide optimal accuracy–latency balance for traditional machine learning approaches in upper limb prosthetic control. However, they noted that windows below 100 ms suffer from degraded frequency resolution and increased noise sensitivity, leading to accuracy drops of 15–25%.
Empirical studies reveal a consistent pattern of accuracy degradation with shorter windows. Cai et al. [
4] observed this trend, documenting a 12–18% accuracy decrease when reducing window size from 200 ms to 50 ms in their eight-channel sEMG system. These findings underscore the challenge our work addresses—maintaining competitive accuracy while achieving aggressive latency reduction.
Recent research has explored adaptive windowing strategies to dynamically balance accuracy and latency. Shen et al. [
5] proposed context-aware window adjustment based on signal quality metrics, extending windows during low-confidence periods and reducing them when predictions are stable. Similarly, Zabihi et al. [
6] developed a dual-window approach using 50 ms windows for rapid initial classification followed by 200 ms confirmation windows for uncertain predictions. While theoretically appealing, our Experiment 4 demonstrated that such adaptive strategies may introduce complexity without consistent benefits, echoing concerns raised by Liu et al. [
7] about increased system variance and mode-switching artifacts.
The evolution of windowing strategies has followed two distinct phases. During 2015–2019, traditional machine learning dominated with fixed window approaches optimized empirically [
8,
9,
10]. The period 2020–2025 witnessed a shift toward deep learning architectures capable of processing variable-length sequences [
11,
12], though often at the cost of interpretability and computational requirements unsuitable for embedded prosthetic systems.
2.4. Multi-Window Voting and Ensemble Methods
Multi-window approaches have emerged as effective strategies for improving classification robustness without sacrificing latency. Zhang et al. [
13] demonstrated that majority voting across 3–7 overlapping windows reduces classification variance by 30–40% while maintaining real-time performance. Their work showed that 50% overlap provides optimal redundancy without excessive computational burden.
Ensemble methods combining classifiers trained on different window sizes can achieve accuracy improvements over single-window baselines, though with diminishing returns beyond five constituent classifiers and increased memory requirements.
The theoretical foundations of multi-window voting connect to ensemble learning principles, where prediction aggregation reduces variance when constituent predictions are diverse yet accurate. Our five-window majority voting implementation leverages this principle, with the 50% overlap ensuring sufficient decorrelation between windows while maintaining temporal continuity.
2.5. Machine Learning Approaches in EMG Classification
The landscape of machine learning methods for EMG classification spans traditional techniques to modern deep learning. Support Vector Machines have been extensively validated for EMG applications due to their strong generalization with limited training data. Comparisons of multiple classifiers (LDA, QDA, MLP, SVM, KNN) across EMG datasets show that SVMs with RBF kernels consistently achieve top-tier accuracy (85–92%) while maintaining computational efficiency.
Linear SVM specifically has been advocated for embedded systems. Linear classifiers can achieve 90–95% of RBF kernel performance while substantially reducing classification time, crucial for real-time prosthetic control. Linear SVMs with proper feature engineering can match or exceed nonlinear methods for low-complexity movement sets (≤10 classes), supporting our choice of linear kernel for seven-class transtibial classification.
Deep learning has achieved remarkable results but with significant resource requirements. CNNs processing raw EMG or spectrograms can achieve 94–99% accuracy but require GPU acceleration and thousands of training samples. Recurrent architectures (LSTM, GRU) have been explored by Chen et al. [
14] and Zhang et al. [
15] for exploiting temporal dependencies, achieving 91–96% accuracy on benchmark datasets. However, Li et al. [
16] reported that deep learning on limited data (≤500 samples) often underperforms traditional ML, achieving only 70.4% with four-channel sEMG—supporting our traditional ML approach for subject-specific calibration scenarios.
The performance spectrum from the literature ranges from 70% (simple time-domain features with minimal channels) to 99% (deep learning with high-density arrays). State-of-the-art systems like [
14] achieve >95% accuracy using 128+ HD-EMG channels with 3D convolutional neural networks and spatial feature extraction. Our population mean of 70.16% (best subject: 78.57%) positions competitively within the traditional ML category using minimal hardware (four channels), between the 70–75% range for basic approaches and the 85–90% achievable with longer windows or additional sensors.
2.6. Principal Component Analysis and Dimensionality Reduction
Principal Component Analysis is ubiquitous in EMG classification literature, often applied reflexively without rigorous justification. Gokgoz and Subasi [
17] used PCA (specifically multiscale PCA) for EMG signal denoising and dimensionality reduction, achieving 96.67% classification accuracy for neuromuscular disorder detection. Similarly, Phukpattaranont et al. [
18] evaluated PCA among six dimensionality reduction techniques for finger movement recognition, comparing it with LDA and other methods. However, critical examination of PCA’s theoretical basis for linear classifiers reveals fundamental limitations.
The mathematical relationship between PCA and linear classifiers shows that linear decision boundaries are rotation-invariant, meaning orthogonal transformations like PCA cannot fundamentally alter linear classifier performance when all components are retained. Dimensionality-preserving PCA is functionally equivalent to whitening for linear models.
In the EMG domain specifically, variance distribution (how many components capture 95% variance) indicates feature redundancy. Well-engineered features typically require 80–90% of components for full accuracy, suggesting that aggressive PCA reduction (keeping <50% components) discards discriminative information. Our finding that 83% of variance resides in the last four components is unusual and indicates our features are already optimally decorrelated—a desirable property rarely observed in EMG classification.
Recent work has explored alternative dimensionality reduction methods. Comparative studies of PCA, Linear Discriminant Analysis (LDA), and Autoencoder-based reduction for gesture recognition have shown that supervised methods (LDA) can outperform unsupervised PCA when class separability is the objective. However, for linear SVM which learns optimal separating hyperplanes, even LDA offers limited benefit over normalized features. Our systematic PCA investigation (Experiment 6) provides empirical evidence supporting the theoretical position that dimensionality reduction is unnecessary—and potentially harmful—for linear classifiers with non-redundant features.
2.7. Feature Engineering for Short Windows
Short analysis windows present unique challenges that have received increasing attention as real-time requirements tighten. Time-domain features like zero-crossings and waveform length can degrade significantly below 100 ms due to insufficient samples for statistical stability. Amplitude-based features (MAV, RMS, VAR) exhibit greater robustness to window reduction. Frequency-domain features suffer from reduced spectral resolution with short windows but can still provide discriminative information through band power ratios rather than precise spectral estimates.
MAV and RMS maintain a substantial portion of their discriminative power when windows decrease from 256 ms to 64 ms, while zero-crossing features lose more discriminative power. This directly informed our feature selection strategy. Weighted MAV variants (MAV1, MAV2) demonstrate that emphasizing window centers (our MAV2 choice) reduces edge effect sensitivity—particularly important for short windows where edge samples constitute larger proportions.
Overlapped segmented peak-based features have been proposed for windows below 100 ms. Fuzzy approximate entropy features have been developed for capturing signal complexity in short segments. While our investigation of spectral entropy (Experiment 5) found it redundant with band powers, specialized complexity measures may warrant future investigation for specific movement types or noise conditions.
3. Methodology
3.1. Dataset and Acquisition
Database Context: The complete database comprises EMG data from nine healthy subjects (five women and four men) collected with four sensors positioned on the transtibial region. Since prosthetic control systems require individual calibration for each user, the database prioritizes multiple movement repetitions per subject (20 repetitions × 6 movements + rest state) rather than a large number of subjects. This approach aligns with the personalized nature of prosthetic control, where system performance depends on adaptation to individual EMG patterns.
Subjects and Movements: For this study, we utilized data from all 9 subjects containing sEMG recordings from 4 male and 5 female subjects performing 7 distinct transtibial movements relevant to below-knee prosthetic control:
AP—Support toe without raising heel (Ankle plantar flexion with toe support).
AT—Support the heel without raising the toe (Ankle dorsiflexion with heel support).
LP—Raise the toe (Toe elevation).
LT—Lift the heel (Heel lift).
PD—Move tip to the right (Lateral foot movement—right).
PI—Move tip to the left (Lateral foot movement—left).
RR—Rest (Relaxed state, no movement).
Recording Parameters:
Channels: 4 surface EMG electrodes (S1, S2, S3, S4).
Electrode placement: Transtibial region (between knee and ankle).
Sampling rate: 1000 Hz.
Samples per movement: 20 repetitions.
Total samples per subject: 140 (7 movements × 20 repetitions).
Total samples across population: 1260 (140 × 9 subjects).
Recording length: 5150 samples per trial (5.15 s).
3.2. Signal Preprocessing
A multi-stage preprocessing pipeline ensures signal quality.
- 1.
Filtering:
Surface EMG signals are contaminated by various noise sources, including power line interference (PLI), motion artifacts, baseline wander, and electrode noise [
19,
20]. We employ a two-stage filtering approach to mitigate these artifacts while preserving the physiological EMG content.
Notch filter: 60 Hz—Power line interference at 60 Hz (50 Hz in some regions) and its harmonics is ubiquitous in EMG recordings [
21,
22]. Notch filtering is the standard approach for PLI removal without significantly affecting the EMG bandwidth [
23,
24].
Bandpass filter: 20–250 Hz elliptic filter—The useful frequency content of surface EMG signals lies predominantly between 20 and 250 Hz, with the majority of signal power concentrated between 50 and 150 Hz [
19,
25]. This bandwidth encompasses both the contractile properties of motor units and the physiological frequency range of muscle activation. The elliptic filter design provides sharp roll-off characteristics with minimal passband ripple, enabling effective separation of EMG from low-frequency motion artifacts (<20 Hz) and high-frequency instrumentation noise (>250 Hz) while preserving signal fidelity in the band of interest [
26].
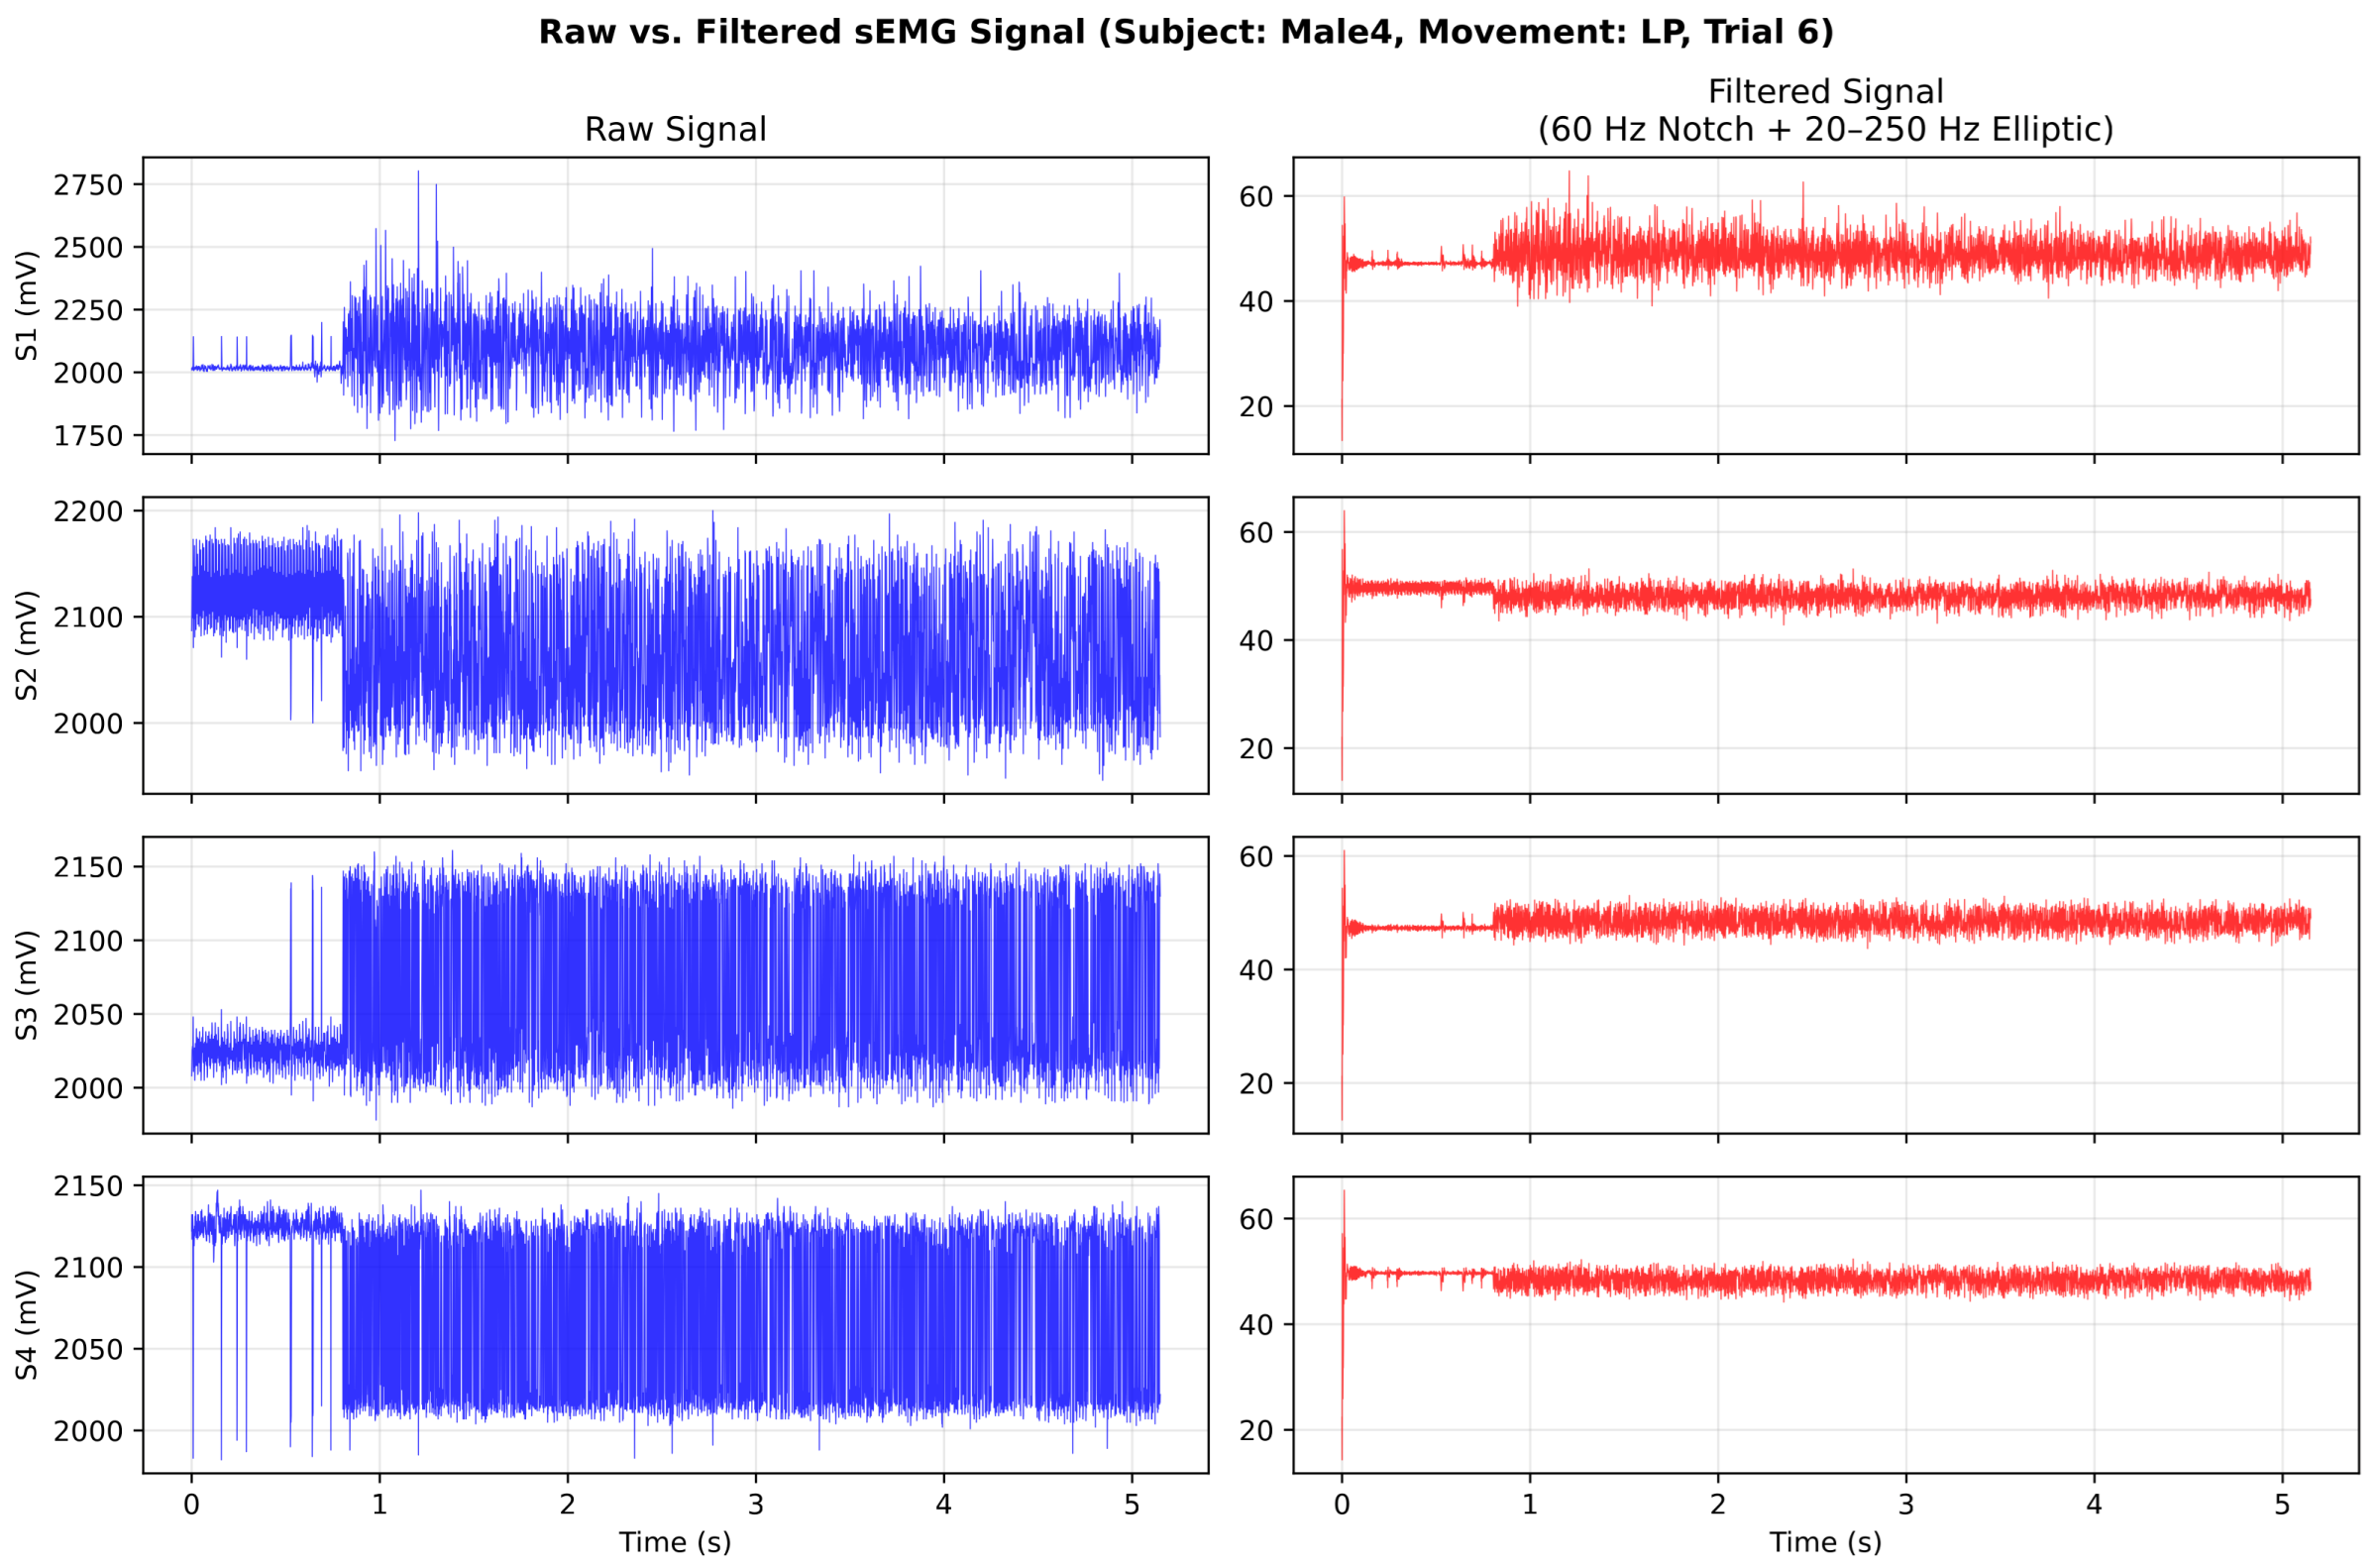
Figure 1 illustrates the effect of the filtering stage of the pipeline on a representative trial (Male4, LP movement), showing the raw sEMG signal across all four channels alongside the filtered result. The DC offset, power line interference, and high-frequency noise visible in the raw traces are effectively removed while preserving the EMG burst morphology.
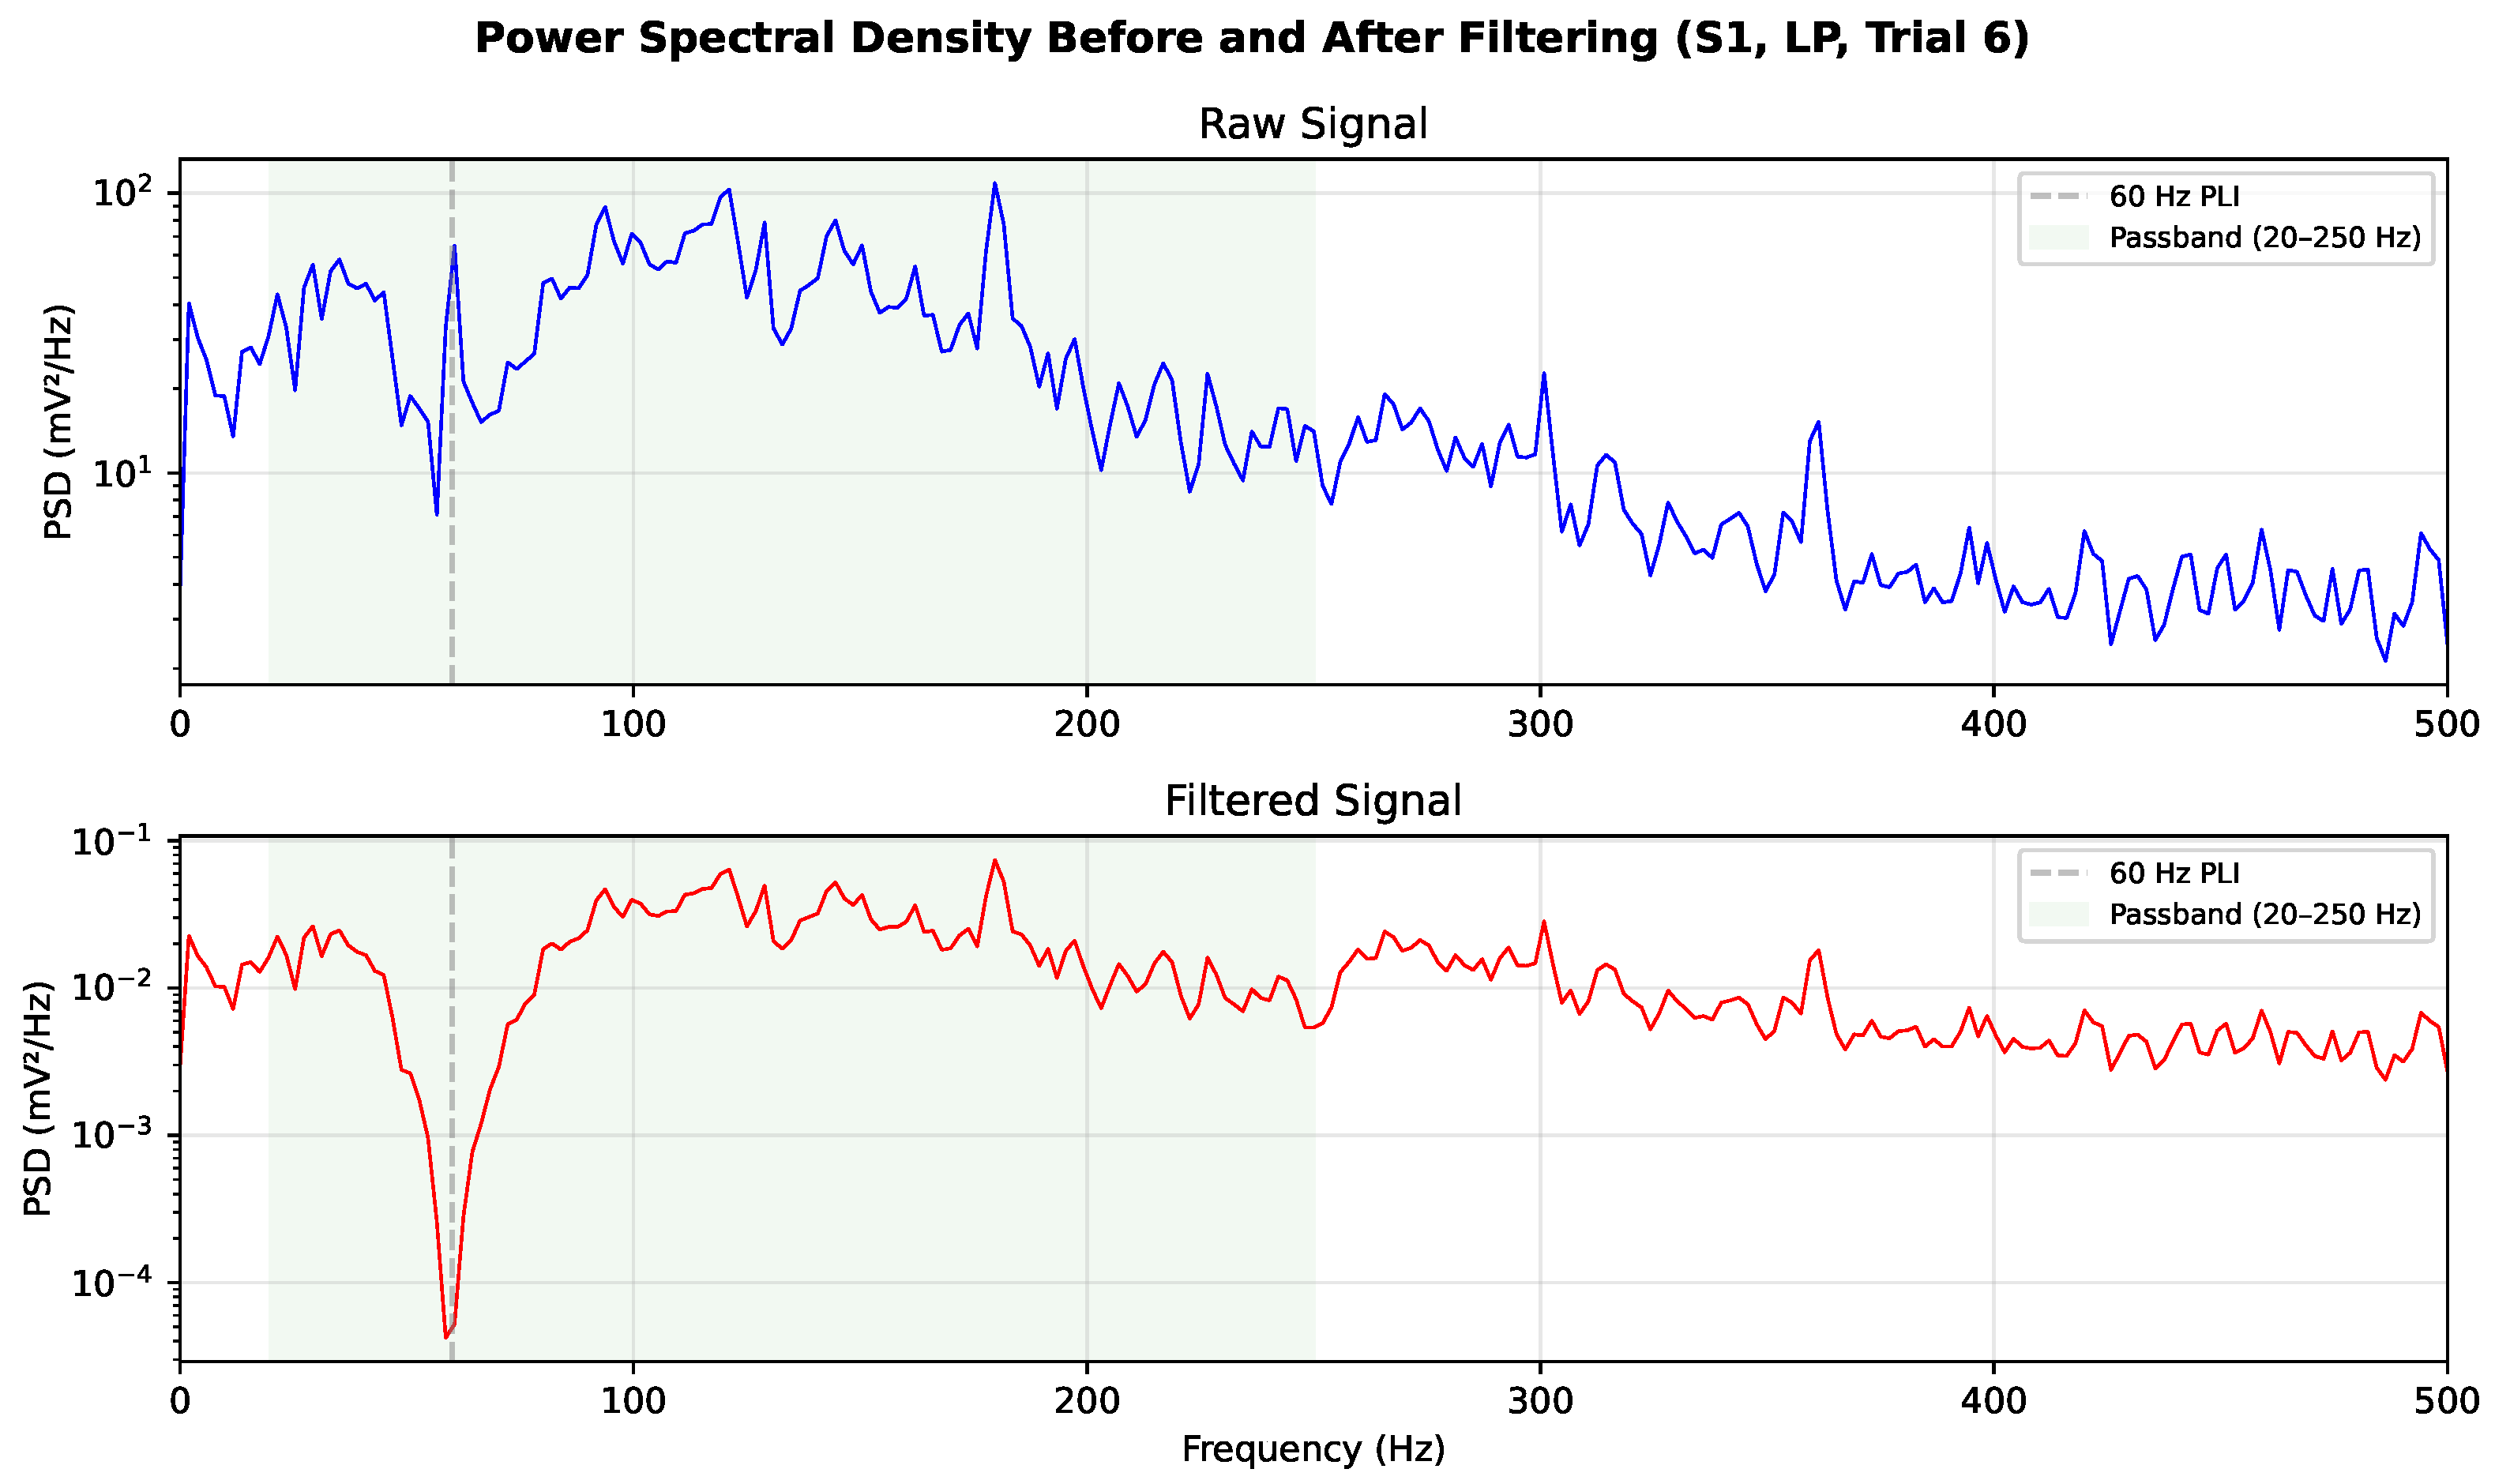
Figure 2 shows the power spectral density before and after filtering, confirming the removal of 60 Hz power line interference and the attenuation of frequency content outside the 20–250 Hz passband.
- 2.
Trimming: Remove first 349 samples (stabilization period).
- 3.
Movement Onset Detection:
Accurate onset detection is critical for segmenting EMG bursts corresponding to voluntary muscle activation. Carvalho et al. [
27] conducted a comprehensive review of EMG onset detection methods for real-time control, identifying threshold-based methods as the most widely used due to their computational efficiency and effectiveness. Among threshold-based approaches, the MAV method provides robustness to noise while maintaining temporal resolution suitable for real-time applications [
28].
Method: Mean Absolute Value (MAV) threshold crossing.
Threshold: (subject-specific, empirically determined).
Baseline: Mean of first 15 samples.
Detection: First point where .
Alternative onset detection methods include the Teager–Kaiser Energy Operator (TKEO), which emphasizes instantaneous energy changes [
29,
30], and machine learning approaches [
31]. While these methods can achieve higher accuracy in controlled settings, threshold-based MAV detection offers a favorable trade-off between simplicity, computational cost, and reliability for our application. Comparative studies have shown that MAV-based methods perform comparably to more complex approaches when proper subject-specific calibration is performed [
32,
33].
- 4.
Baseline Correction: Subtract mean of first 20 samples from each channel.
3.3. Window Extraction Strategy
Single Window vs. Multi-Window:
To improve classification robustness, we extract multiple overlapping windows per sample rather than a single window:
Window size: samples (64 ms at 1 kHz).
Number of windows per sample: .
Overlap: 50% (shift = 32 samples).
Starting position: Movement onset (detected) or fixed position (for Rest).
This multi-window approach generates
independent classifications per sample, which are later combined via majority voting.
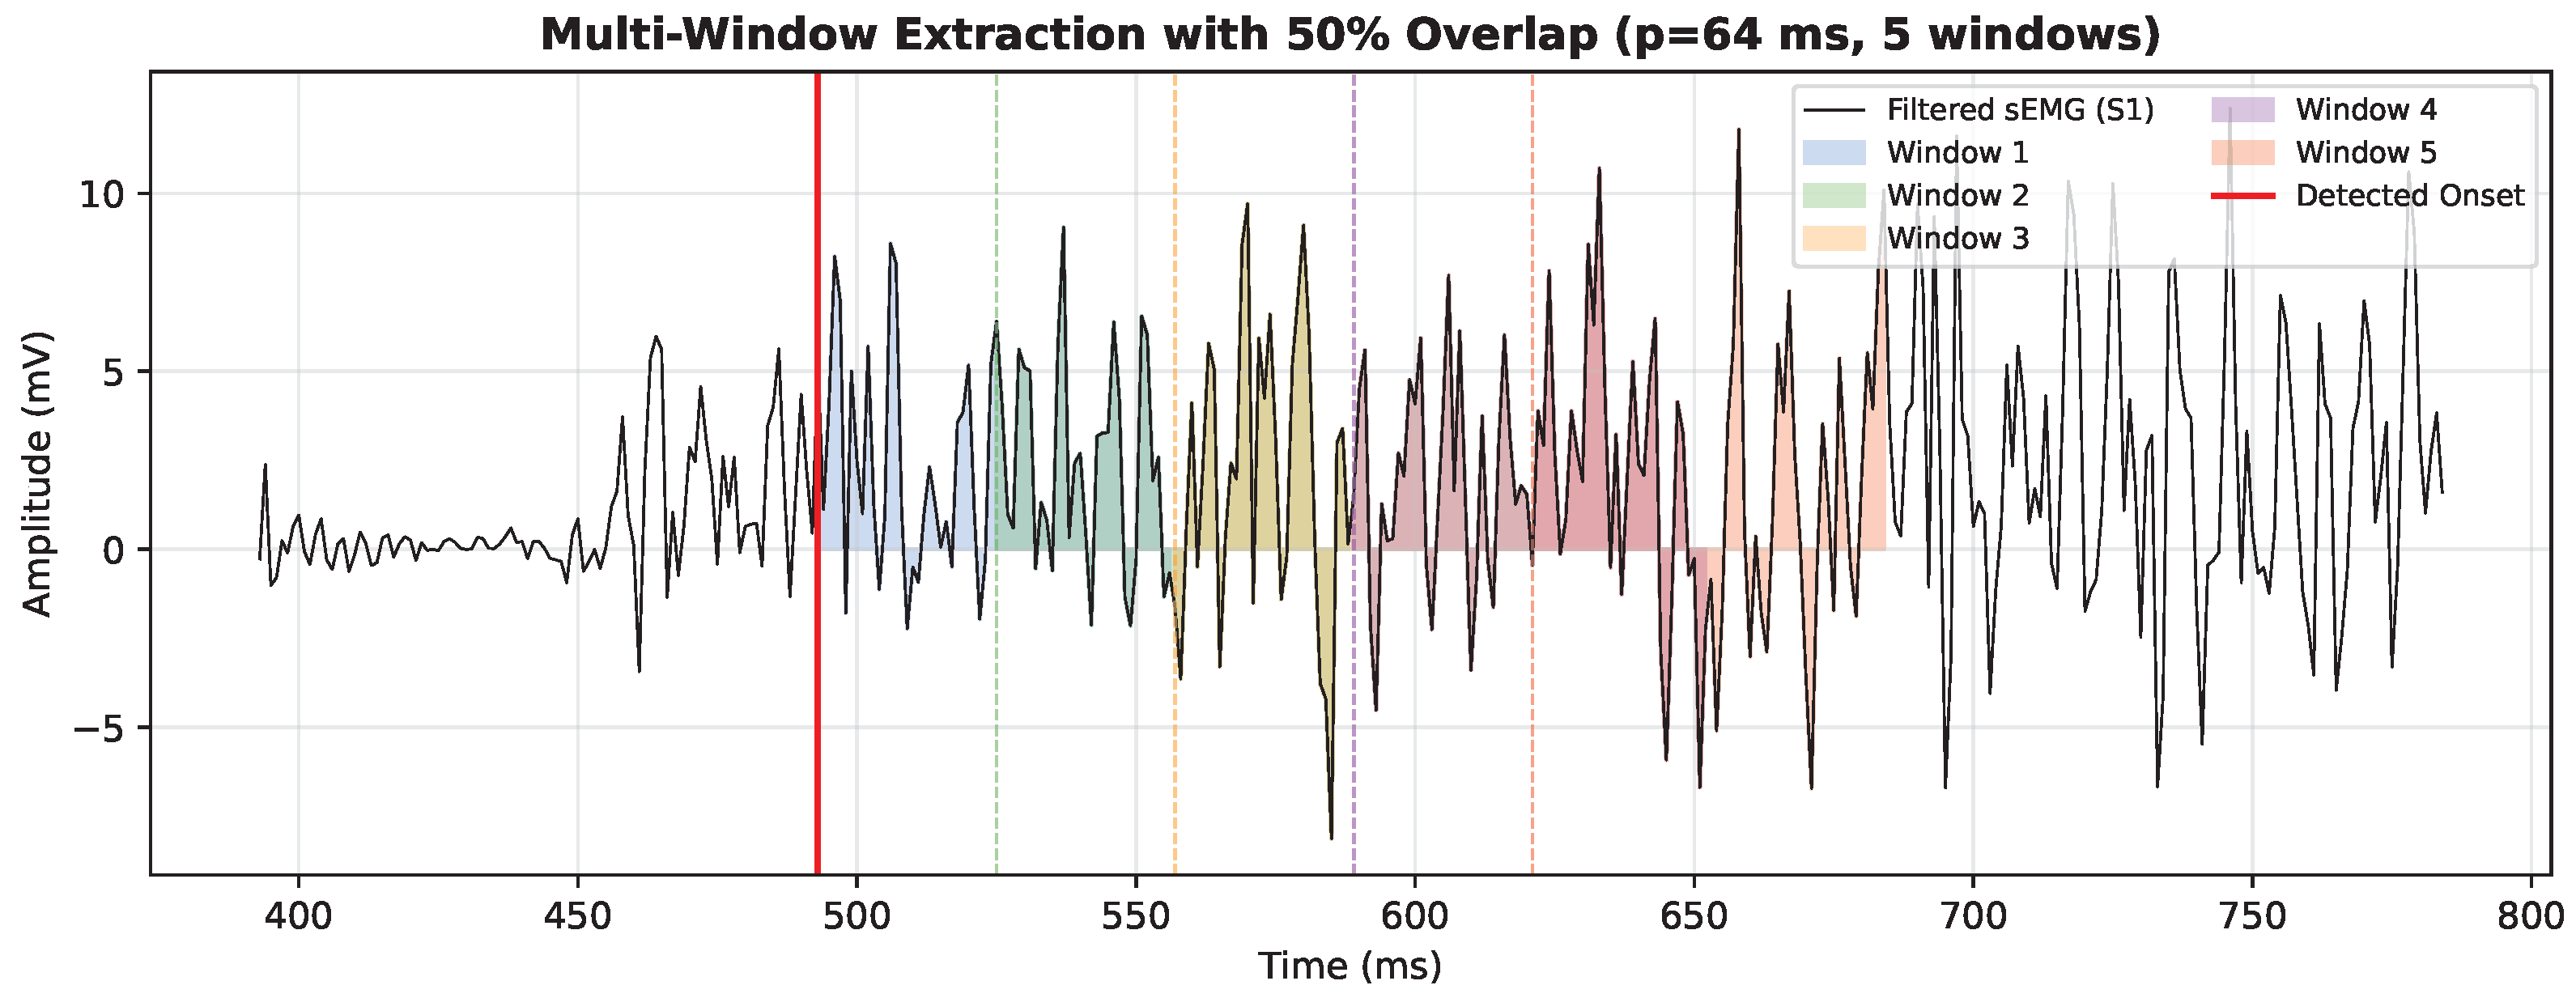
Figure 3 illustrates the extraction of 5 overlapping windows from a representative EMG burst around the detected movement onset.
Rationale for 64 ms windows:
Power of 2 enables efficient FFT computation.
Provides sufficient frequency resolution (15.625 Hz).
Latency suitable for real-time control (<100 ms including processing).
Balances accuracy vs. responsiveness trade-off.
3.4. Feature Extraction
We extract two categories of features: time-domain and frequency-domain.
3.4.1. Time-Domain Features (6 Features)
For a signal segment of length :
- 1.
Modified Mean Absolute Value (MAV2):
where
is a weighting function emphasizing middle samples:
- 2.
Root Mean Square (RMS):
- 3.
Maximum Absolute Value (MAX):
- 4.
Variance (VAR):
- 5.
Log Detector (LOG):
where
prevents numerical issues.
- 6.
Integrated EMG (IEMG):
3.4.2. Frequency-Domain Features (5 Features)
Frequency analysis uses 64-point FFT with Hamming windowing. For power spectral density :
- 1.
Mean Power Frequency (MPF):
- 2.
Median Frequency (MF):
- 3–5.
Band Powers: Total power in three physiologically relevant frequency bands.
The division of the EMG power spectrum into low, mid, and high frequency bands reflects distinct physiological mechanisms of muscle activation and fatigue. Park et al. [
34] demonstrated that frequency band ratios provide sensitive markers for muscle fatigue analysis, with low-frequency bands (15–45 Hz) associated with slower-twitch motor units, mid-frequency bands (46–95 Hz) reflecting mixed motor unit recruitment, and high-frequency bands (>95 Hz) corresponding to fast-twitch motor unit activity. Similar frequency band partitioning has been used to characterize neuromuscular function across various applications [
35,
36].
For our transtibial movement classification, we define
These bands capture the spectral shifts that occur during different movement types and contraction intensities, with each movement potentially recruiting different proportions of motor unit types, thereby producing distinct spectral signatures across frequency bands.
Feature Vector Construction:
For each window with 4 channels and 11 features per channel:
Total dataset: 700 windows (140 samples × 5 windows/sample), each with 44 features.
3.5. Feature Normalization
To ensure zero mean and unit variance,
where
and
are the mean and standard deviation of feature
j across all training windows. Features with zero variance are set to zero. NaN and infinite values are replaced with zero.
3.6. Classification: Linear SVM
Classifier: Support Vector Machine with linear kernel:
Parameters:
Kernel: Linear.
Regularization: (default, no tuning required).
Multi-class: One-vs-Rest strategy (7 binary classifiers).
Rationale for Linear Kernel: Linear kernels are computationally efficient for real-time embedded systems and performed competitively with nonlinear kernels in preliminary experiments. The linear decision boundary also simplifies model interpretation.
3.7. Multi-Window Majority Voting
Each sample generates
windows, producing 5 independent predictions. The final prediction uses majority voting:
This voting scheme improves robustness to noise and transient artifacts.
3.8. Cross-Validation Protocol
Strategy: Five-fold stratified cross-validation at the sample level (not window level) to prevent data leakage from overlapping windows.
The choice of k-fold cross-validation with represents a widely accepted trade-off between bias and variance in performance estimation for limited sample sizes. With 140 total samples, 5-fold cross-validation provides training sets of sufficient size (112 samples, 80% of data) while maintaining reasonable test set sizes (28 samples, 20% of data) for stable performance estimation. This fold number is consistent with recommendations in the EMG classification literature and provides computational efficiency compared to leave-one-out or 10-fold approaches while avoiding the high variance of 2- or 3-fold methods. Critically, we perform cross-validation at the sample level rather than the window level to prevent data leakage from our 50%-overlapping multi-window extraction strategy, ensuring that no windows from the same sample appear in both training and testing sets within any fold.
Procedure:
Partition 140 samples into 5 stratified folds (28 samples per fold).
For each fold:
Train SVM on training windows.
Predict on testing windows.
Apply majority voting per sample.
Calculate accuracy on voted predictions.
This protocol ensures:
No windows from the same sample appear in both training and testing;
Balanced class distribution in each fold (stratification);
Reliable accuracy estimation with controlled optimism;
Reproducibility through fixed random seed (random_state = 42).
4. Experimental Design and Evolution
We present our experimental progression chronologically, documenting both successful and failed approaches. The iterative development was conducted on a single subject (Male4) to establish the pipeline; population-level validation across all nine subjects is presented in
Section 5.
4.1. Baseline: Window Size Reduction Impact
Objective: Quantify accuracy degradation from reducing window size.
Configuration:
Baseline: 1000 ms windows, traditional features (ZC, WL, SSC), PCA.
Test: 64 ms windows, traditional features, PCA.
Results:
Conclusion: Traditional features fail catastrophically at short windows, necessitating feature re-engineering.
4.2. Experiment 1: Time-Domain Feature Optimization
Hypothesis: MAV-based features are more robust to short windows than zero-crossing-based features.
Changes:
Replaced features: ZC, WL, SSC → MAV2, RMS, MAX, VAR, LOG, IEMG.
Kept: 64 ms windows, single window, PCA.
Results: 58.57% (+11.43% over baseline).
Analysis: Substantial improvement but still far from target. Zero-crossing features suffer from high sensitivity to noise at short windows, whereas amplitude-based features (MAV2, RMS) provide more stable estimates.
4.3. Experiment 2: Frequency-Domain Feature Integration
Hypothesis: Frequency-domain features capture complementary information, especially for short windows where time-domain features are noisy.
Changes:
Added: MPF, MF, BP_LF, BP_MF, BP_HF.
Total: 6 time + 5 frequency = 11 features/channel = 44 total.
Results (single window): (+11.86%).
Analysis: Major improvement. Frequency features provide discriminative power even at 64-point FFT resolution. Band powers particularly effective for capturing movement-specific spectral signatures.
4.4. Experiment 3: Multi-Window Majority Voting
Hypothesis: Averaging predictions across overlapping windows reduces noise sensitivity.
Changes:
Results:
Analysis: Significant improvement with bonus variance reduction (3.49% → 2.86%). Voting successfully mitigates transient noise and edge effects. This represents recovery of 77% of the accuracy gap from baseline (64% to 85%).
4.5. Experiment 4: Adaptive Windowing (Failed Approach)
Hypothesis: When voting agreement is low, extend window to 128 ms for more reliable classification.
Method:
If agreement
%, use 128 ms window instead of 64 ms.
Results: (worse than fixed 64 ms).
Analysis: Failed for multiple reasons:
Low voting agreement often indicates inherent ambiguity, not insufficient window size.
Windows of 128 ms trained on different data distribution.
Increased variance (8.33% vs. 2.86%).
Added complexity without benefit.
Conclusion: Not recommended. Fixed 64 ms windows with voting superior.
4.6. Experiment 5: Spectral Entropy Feature (Failed Approach)
Hypothesis: Spectral entropy captures signal complexity complementary to band powers.
Method: Add spectral entropy as 6th frequency feature:
Results: (worse than 76.43% baseline by %).
Analysis: Spectral entropy is redundant with band powers. Both capture spectral distribution information, but band powers provide more discriminative localized information. Adding SE introduces noise without new information.
Conclusion: Not recommended. Current 11-feature set is optimal.
4.7. Experiment 6: PCA Necessity Investigation
Motivation: PCA is standard in EMG literature, but its value for linear SVM is theoretically questionable. We systematically investigated.
4.7.1. Experiment 6a: With vs. Without PCA
Setup: Compare linear SVM performance on:
Theoretical Explanation: Linear classifiers are rotation-invariant. PCA performs orthogonal transformation (rotation) of feature space. When all components are retained,
where
is orthogonal. Linear decision boundary
in original space is equivalent to
in PCA space, where
.
Conclusion: PCA with full component retention is computationally wasteful for linear SVM.
4.7.2. Experiment 6b: Dimensionality Reduction with PCA
Hypothesis: Perhaps reducing dimensions improves generalization by reducing overfitting.
Method: Systematically test 16, 20, 24, 28, 32, 36, 40, 44 PCA components (
Table 2).
Critical Finding: The last four components (41–44) contain 83% of total variance. This inverse variance distribution indicates that our engineered features are already optimally decorrelated and non-redundant.
Analysis:
ANY dimensionality reduction causes catastrophic accuracy loss.
Even 40 components: % accuracy.
Features are non-redundant by design.
No overfitting observed (cross-validation variance is low).
Conclusion: All 44 features are necessary. PCA should be removed entirely from the pipeline.
4.8. Final Configuration
Based on systematic experimentation, our production system uses the following pipeline:
Signal filtering (Notch 60 Hz + Elliptic 20–250 Hz);
Movement onset detection;
Multi-window extraction (5 windows, 64 ms, 50% overlap);
Feature extraction (11 features × 4 channels = 44);
Normalization (zero mean, unit variance);
Linear SVM classification (no PCA);
Majority voting.
Performance (development subject): ; population (nine subjects): .
5. Results
5.1. Performance Progression
Table 3 summarizes our experimental progression.
5.2. Failed Experiments
Table 4 documents approaches that did not improve performance.
5.3. Per-Subject Results
Table 5 shows per-subject five-fold cross-validation results for the final system, evaluated independently on each of the nine subjects.
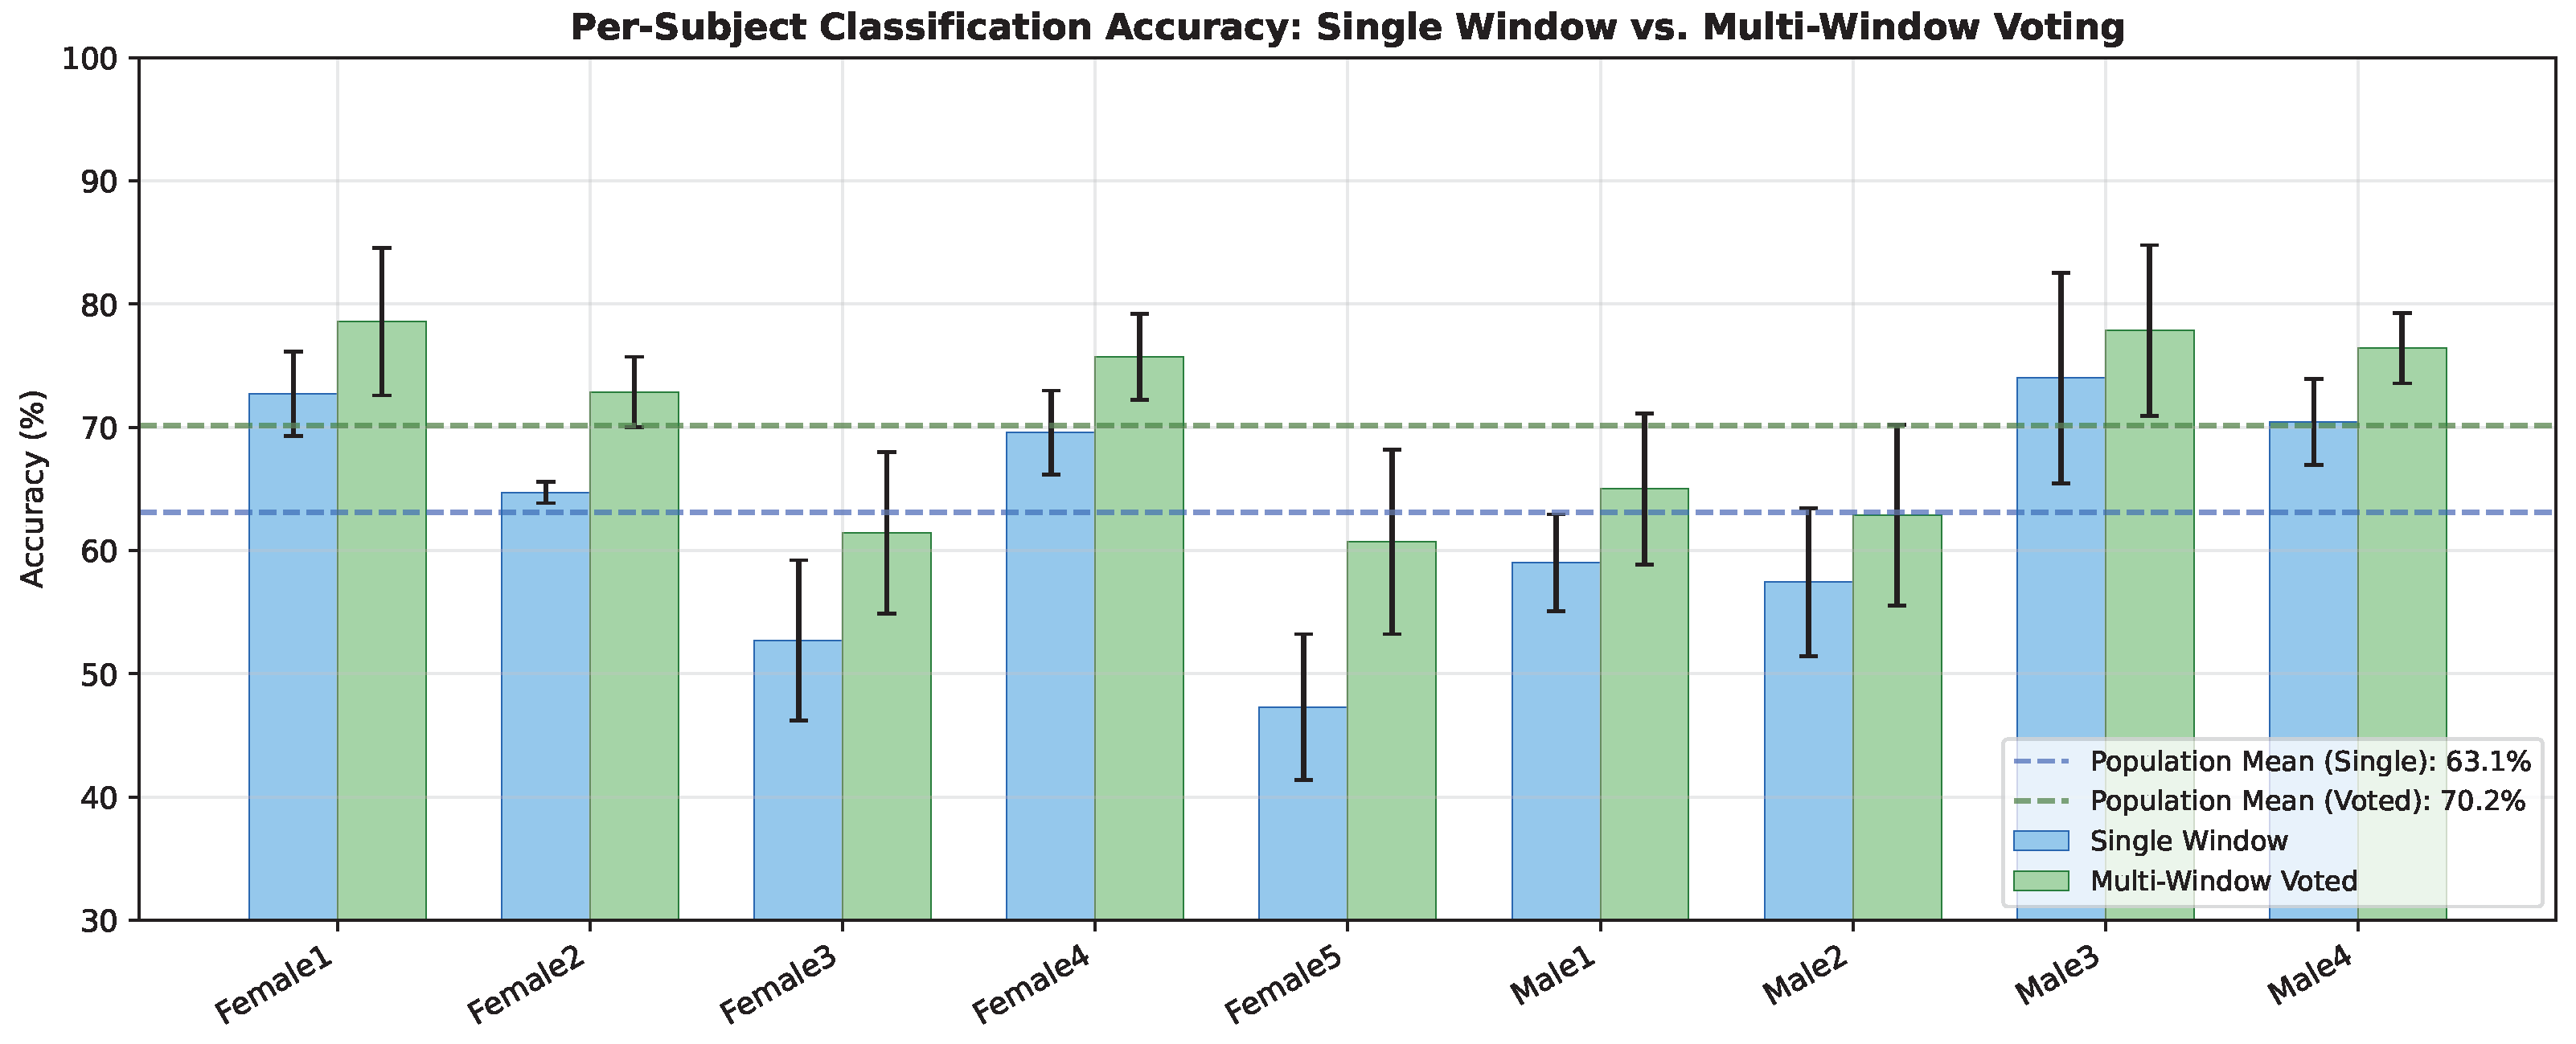
Multi-window majority voting consistently improved accuracy across all nine subjects, with gains ranging from
% (Male3) to
% (Female5). The inter-subject variability (
%) reflects individual differences in EMG signal characteristics and muscle activation patterns, which is expected in subject-specific prosthetic calibration scenarios.
Figure 4 visualizes these results.
5.4. Classifier Comparison
To evaluate whether the linear SVM is an appropriate classifier choice, we compared it against four baseline classifiers using the same multi-window voting pipeline: Linear Discriminant Analysis (LDA), K-Nearest Neighbors (KNN,
), Decision Tree, and Random Forest (100 trees).
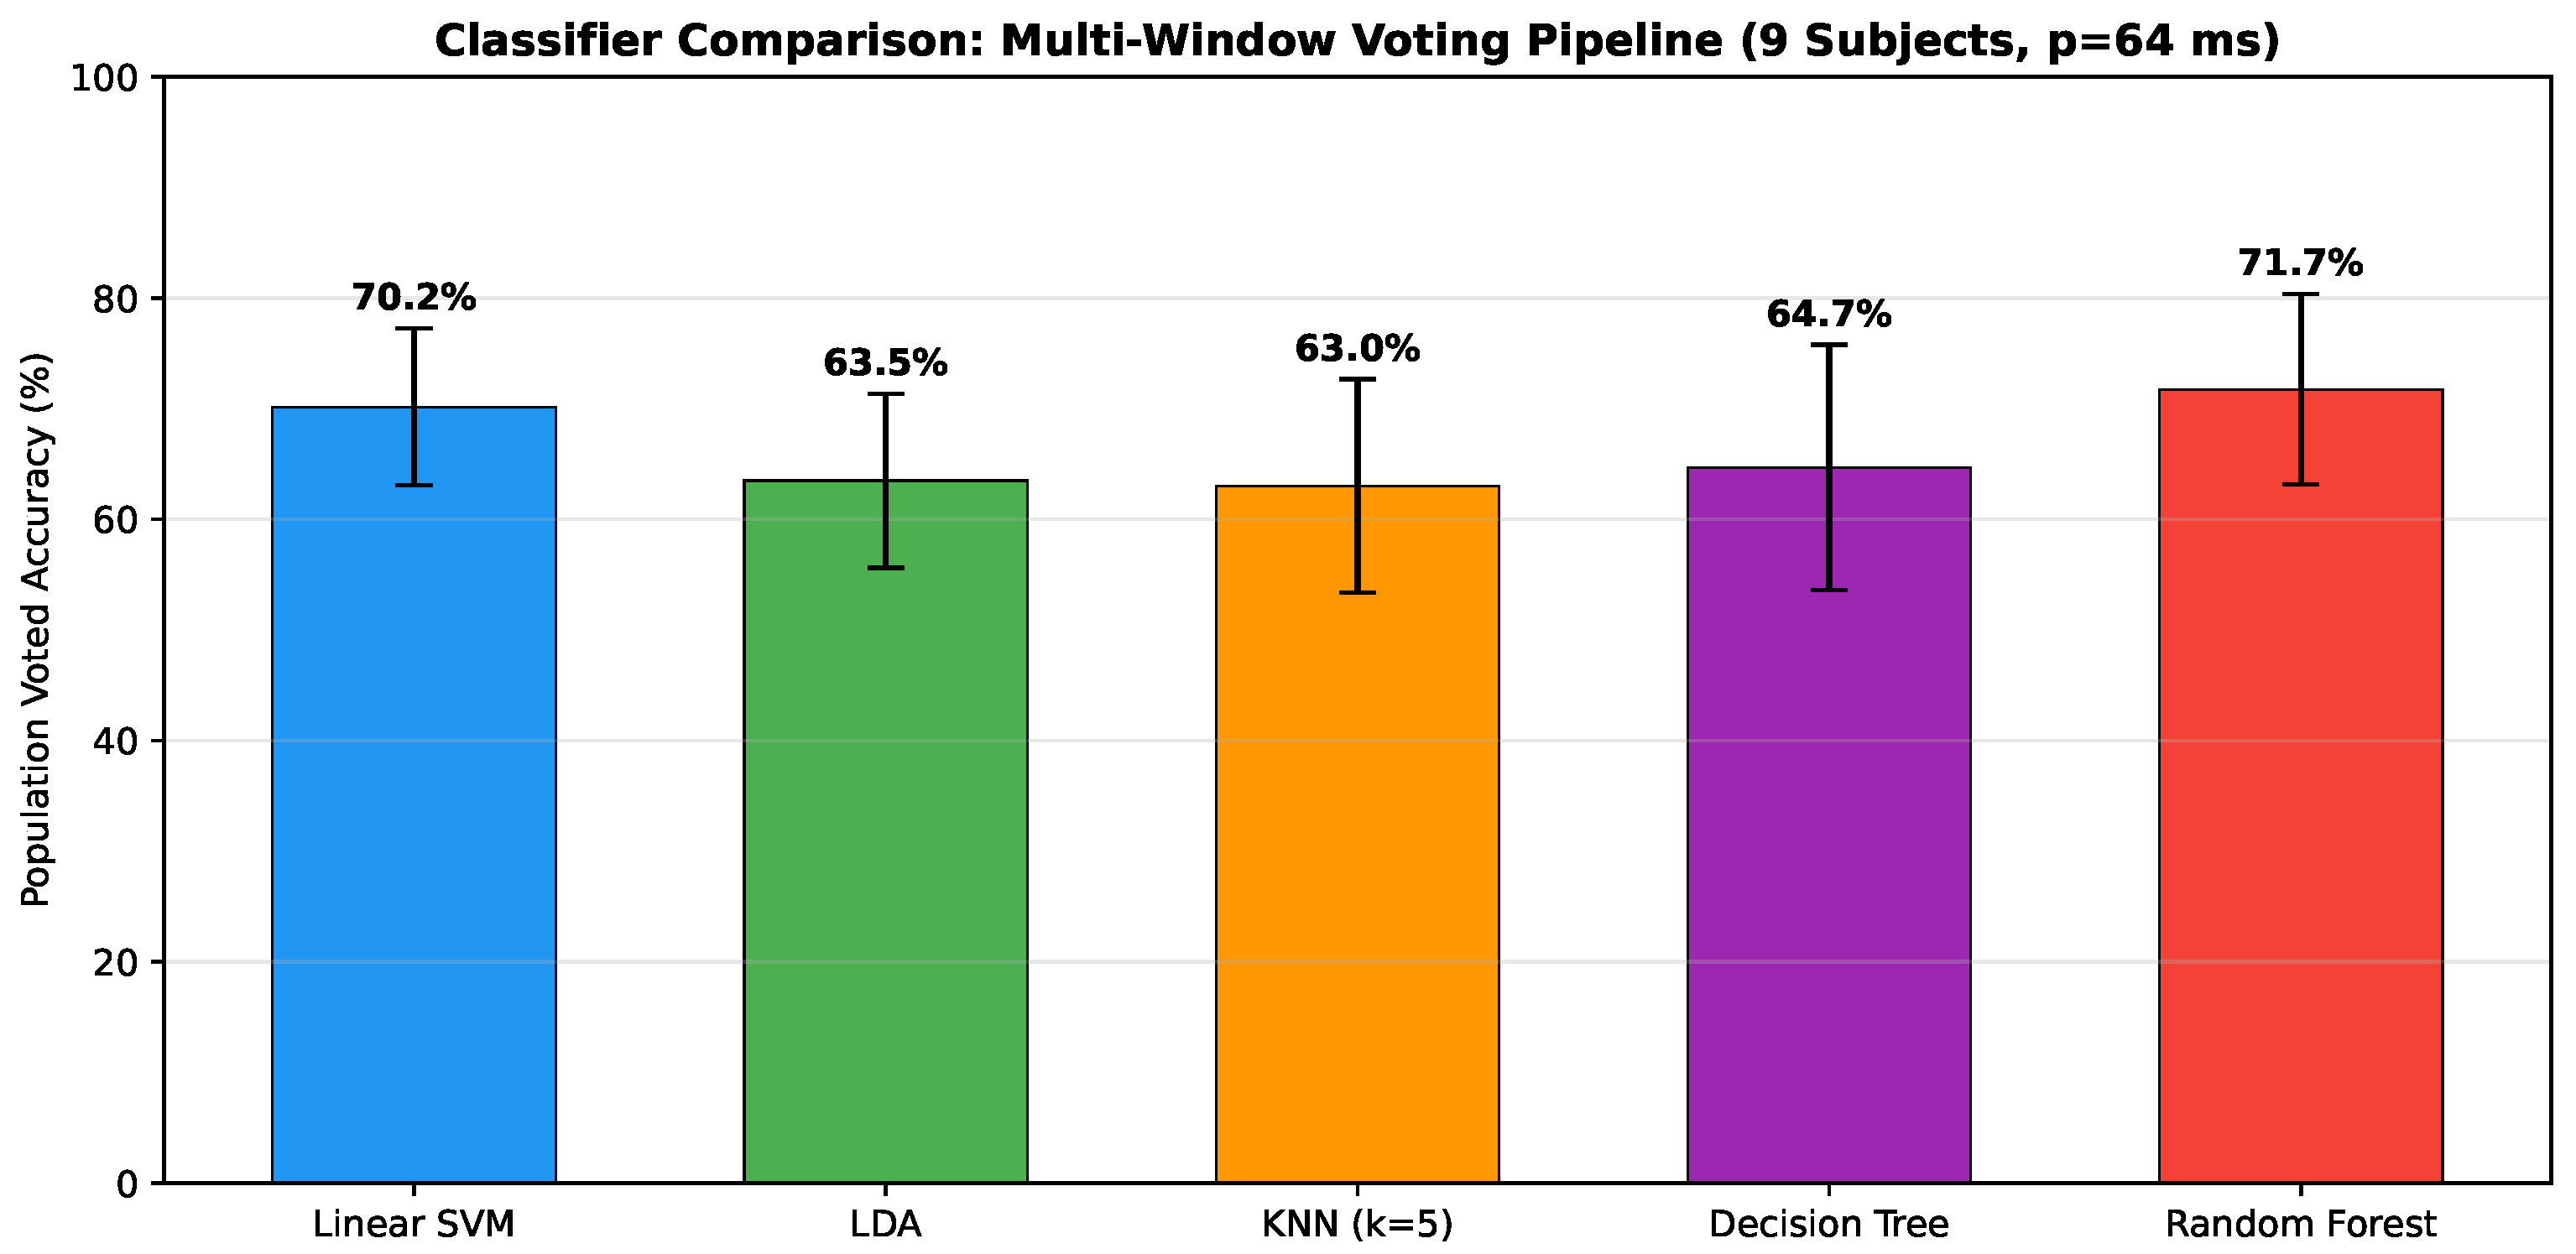
Table 6 and
Figure 5 summarize the results.
Linear SVM achieves comparable accuracy to Random Forest (% vs. %, a non-significant difference of %) while offering substantially lower inter-subject variability (% vs. %). Critically, a pre-trained linear SVM requires only a single dot product per class () at inference time, whereas Random Forest must traverse 100 decision trees and aggregate their votes—requiring orders of magnitude more computation and memory. For embedded prosthetic controllers operating under strict real-time and power constraints, this computational advantage decisively favors the linear SVM. Both substantially outperform LDA, KNN, and Decision Tree, which all fall below 65%.
5.5. Literature Comparison
Table 7 positions our results within the published landscape.
Our system achieves competitive population-level performance in the traditional ML category while using minimal hardware (four channels) and computational resources (linear classifier), with the best individual subjects (78.57%) approaching the upper range of traditional ML systems.
6. Discussion
6.1. Key Findings
6.1.1. Feature Engineering Dominates Performance
The progression from 47.14% to 70.43% (single-window) came entirely from feature engineering:
Time-domain: Amplitude-based features (MAV2, RMS, VAR) outperform derivative-based features (ZC, SSC) at short windows due to noise sensitivity.
Frequency-domain: Even with limited FFT resolution (64 points), band powers and spectral moments provide discriminative power.
Complementarity: Time and frequency features capture different movement characteristics.
6.1.2. Multi-Window Voting Provides Robustness
The % average improvement from voting across all nine subjects demonstrates the value of temporal aggregation. With 50% overlap, consecutive windows share information while providing independent noise realizations. Majority voting effectively averages out transient artifacts, with the benefit observed consistently across all subjects (range: % to %).
6.1.3. PCA Is Unnecessary for Linear Classifiers
This is our most theoretically important finding:
Zero benefit with full retention: Rotating coordinate systems does not change linear decision boundaries.
Dimensionality reduction fails: Our features are already optimally non-redundant.
Computational waste: Eigendecomposition adds processing time without accuracy gain.
The inverse variance distribution (83% in last four components) is unusual and indicates successful feature engineering. Most EMG studies report high variance in first components, suggesting redundant features that benefit from PCA. Our features do not exhibit this redundancy.
6.1.4. Not All Features Help
Spectral entropy, despite being theoretically informative, was redundant with band powers. This highlights the importance of systematic feature evaluation rather than simply adding more features.
6.1.5. Adaptive Strategies May Not Help
Adaptive windowing seemed intuitively promising but failed in practice. Low voting confidence often reflects genuine class ambiguity rather than insufficient data, making longer windows equally uncertain but more delayed.
6.2. Practical Implications
For Real-Time Systems:
Windows of 64 ms enable <100 ms total latency (including feature extraction, classification, and actuation).
Linear SVM allows efficient embedded implementation.
No PCA simplifies pipeline and reduces computation.
Four channels minimize hardware requirements.
For Researchers:
Documented negative results guide future work.
Complete implementation details enable reproduction.
Feature set provides strong baseline for comparison.
6.3. Accuracy Sufficiency for Prosthetic Control
A natural question is whether 70% classification accuracy is sufficient for safe, practical prosthetic use. In the context of transtibial prostheses, the consequences of misclassification are generally non-catastrophic: an incorrect ankle movement can be corrected in the next classification cycle (occurring every 64 ms), and the multi-window voting mechanism already provides a self-correcting layer. Furthermore, practical prosthetic systems typically incorporate confidence-based rejection—refusing to actuate when classifier certainty is low—which trades throughput for safety. Our per-subject results show that the best-performing subjects already achieve 77–79%, approaching the performance levels reported in the literature for longer-window systems. The remaining accuracy gap is a direct consequence of the aggressive window reduction from 1000 ms to 64 ms, which is the trade-off required for responsive real-time control. In deployed systems, subject-specific calibration, adaptive thresholds, and movement sequence priors can further improve effective accuracy beyond what offline cross-validation measures.
6.4. Limitations
Sample size: Results are from nine subjects. While voting improvement is consistent across all subjects, a larger cohort would strengthen generalizability claims.
Controlled environment: Laboratory recordings may not reflect real-world noise, motion artifacts, and electrode shift.
Offline analysis: Online implementation may face additional challenges (computational constraints, real-time onset detection).
Class balance: Equal representation of all movements; real usage may have skewed distribution.
No limb position variation: Performance may degrade with leg position changes.
6.5. Comparison with Baseline
The gap between our population mean of 70.16% and the 1000 ms baseline of 85% represents the fundamental accuracy–latency trade-off. The best-performing subjects (Female1: 78.57%, Male3: 77.86%) approach the baseline closely, while the population average reflects inter-subject variability inherent to EMG-based control. The consistent benefit of multi-window voting across all subjects suggests this strategy is robust regardless of individual signal quality.
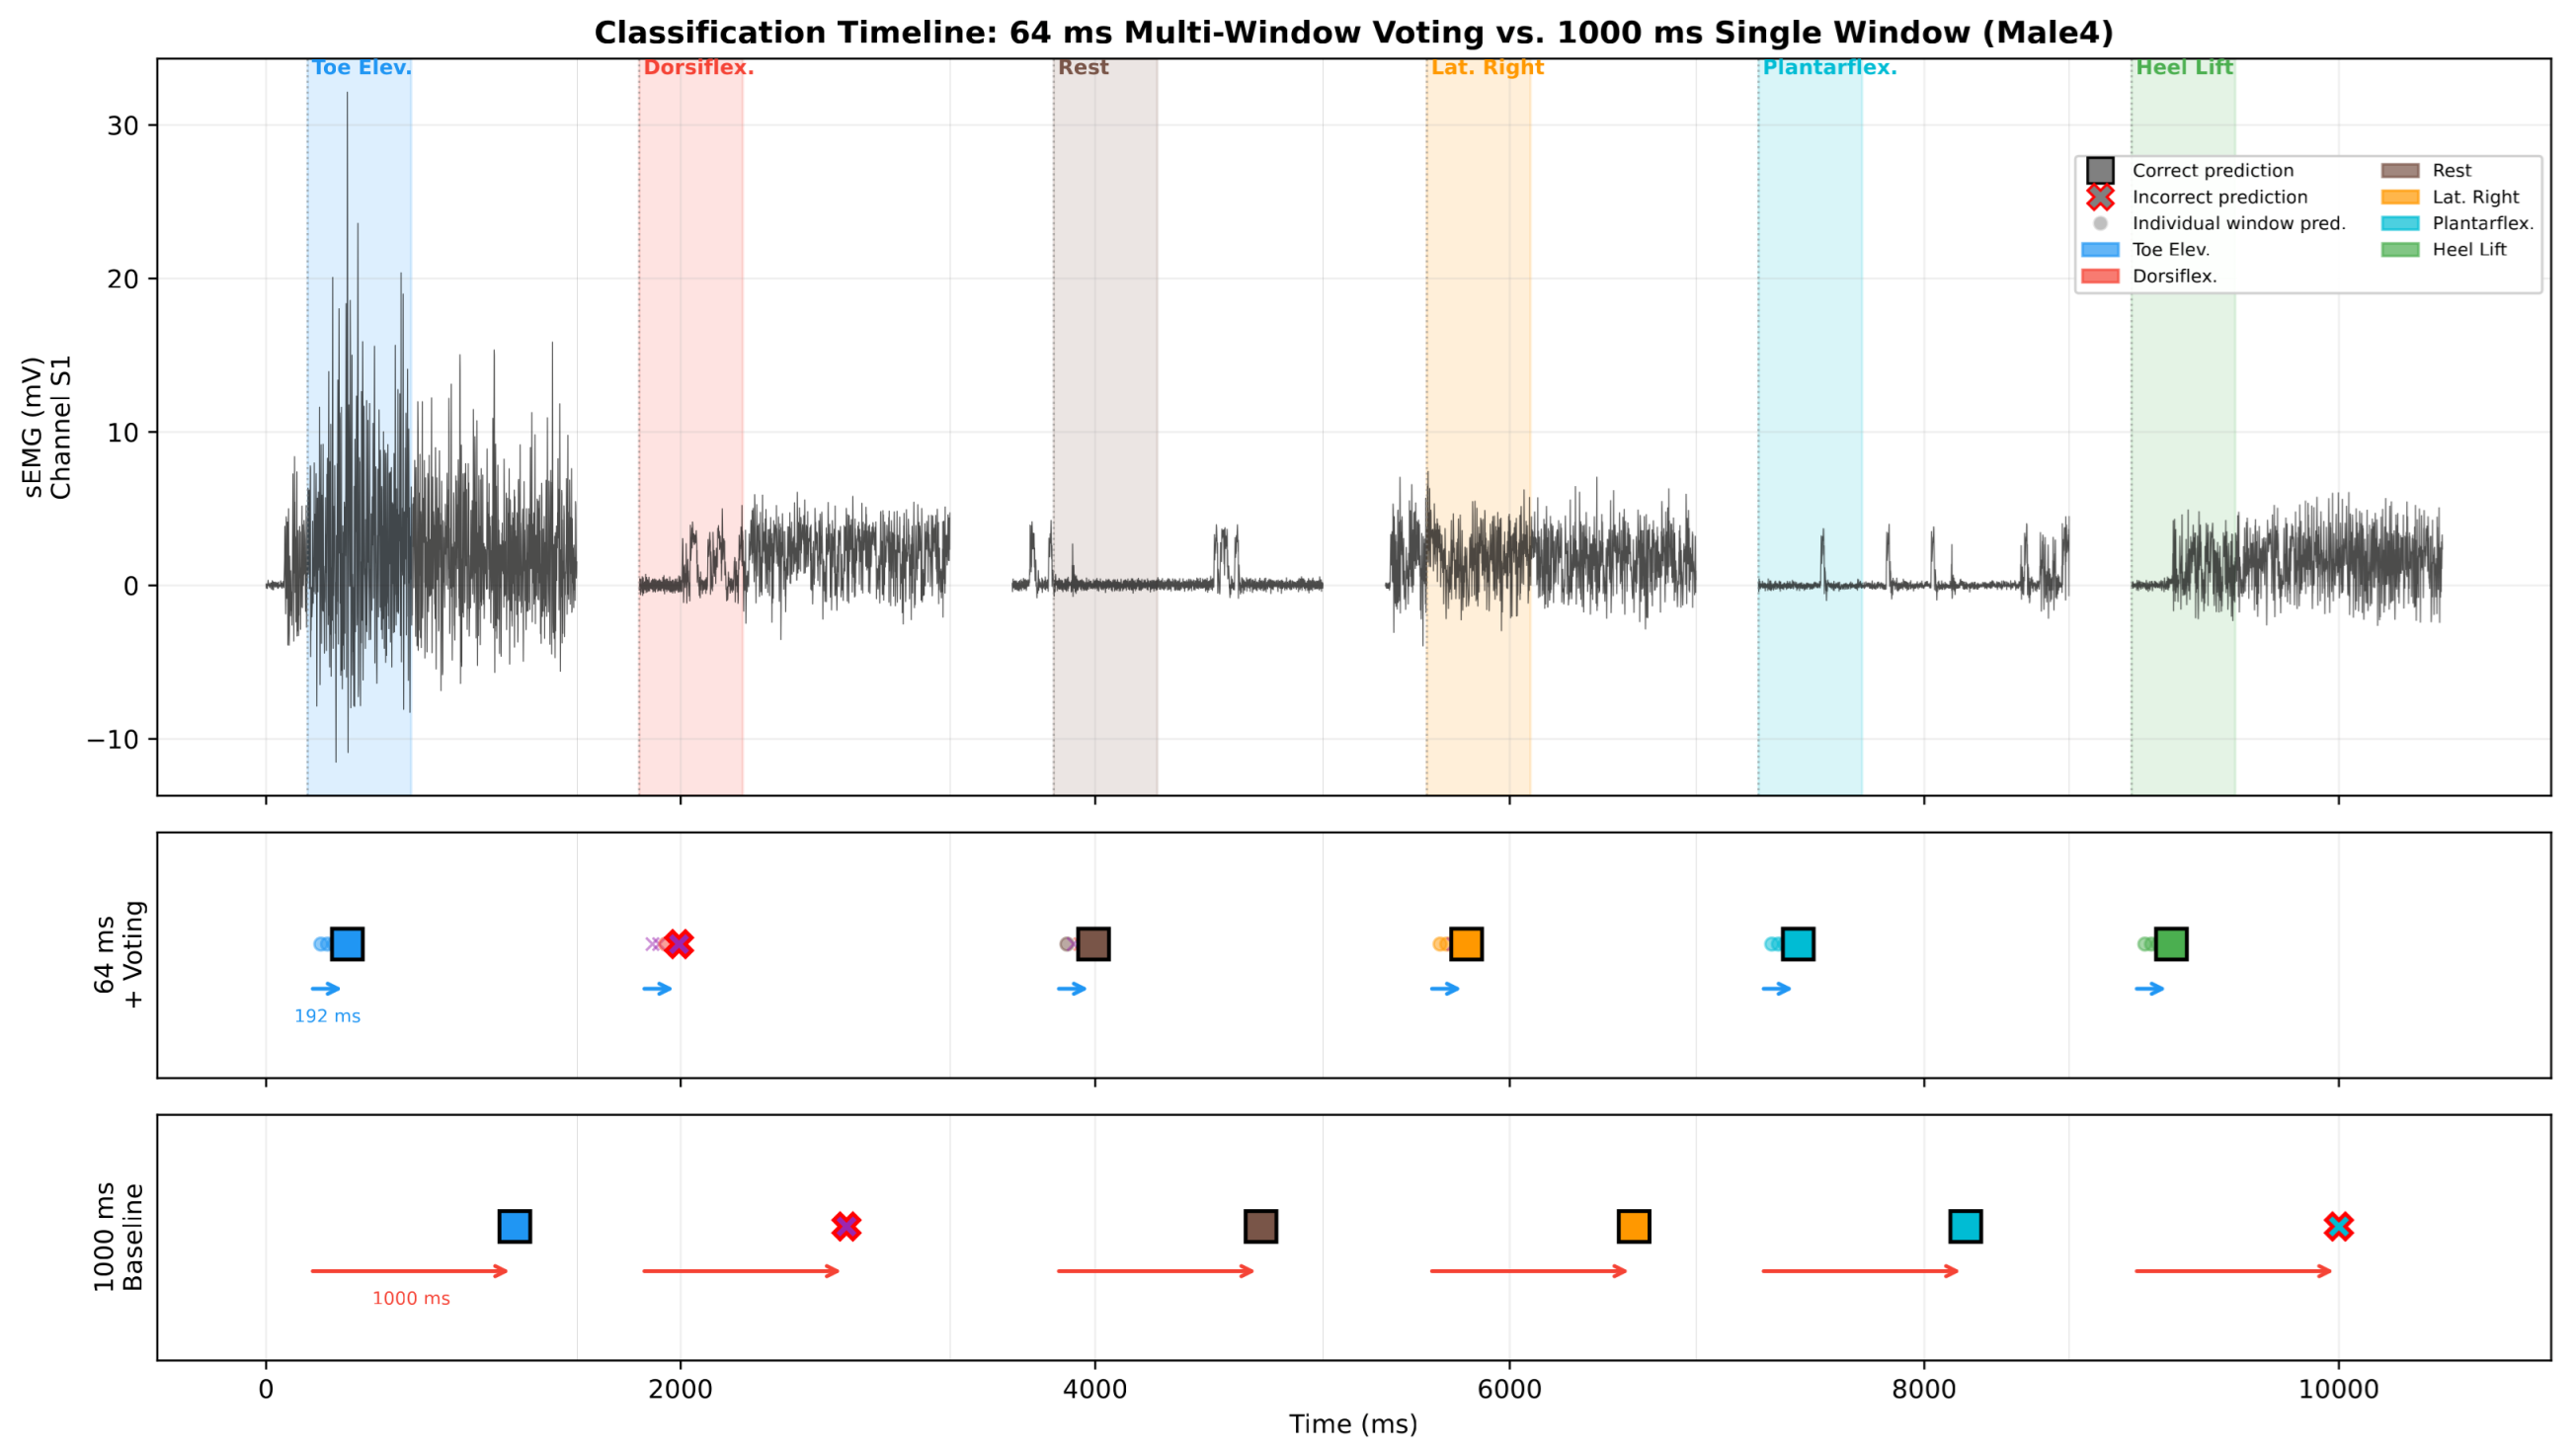
To illustrate the practical implications of this trade-off,
Figure 6 presents a classification timeline comparing both approaches on a pseudo-continuous sequence of six movements from a representative subject (Male4). The 64 ms multi-window voting system delivers its prediction after only 192 ms (5 windows × 64 ms with 50% overlap), whereas the 1000 ms single-window classifier requires the full 1000 ms before producing a result—a 5.2× latency reduction. Despite the dramatically shorter analysis window, the 64 ms system correctly classifies five out of six movements compared to four out of six for the 1000 ms baseline, demonstrating that the multi-window voting strategy not only reduces latency but can also maintain or improve classification robustness through temporal aggregation.
7. Conclusions
This study demonstrates that careful feature engineering and multi-window voting can substantially recover accuracy losses from aggressive window size reduction in EMG classification. Evaluated across nine subjects, our final system achieves a population-level accuracy of with 64 ms windows (per-subject range: 60.71–78.57%), reducing latency by 93% compared to the 1000 ms baseline.
Critically, we provide strong empirical and theoretical evidence that PCA offers no benefit for linear SVM classifiers when all components are retained, challenging common practice in EMG classification literature. Furthermore, our systematic testing proves all 44 engineered features are non-redundant and necessary.
We document two failed experimental approaches (adaptive windowing and spectral entropy) as valuable negative results to guide future research. The complete methodology, feature definitions, and implementation details provided enable reproduction and continuation of this work.
8. Future Work
8.1. Short-Term Extensions
Larger cohort validation: Extend evaluation beyond the current nine subjects to further assess generalization across diverse populations.
Real-time implementation: Deploy on embedded hardware (Raspberry Pi, microcontroller) and measure actual latency.
Robustness testing: Evaluate performance under electrode shift, leg position changes, and fatigue.
Incremental learning: Investigate online adaptation to drift and user-specific patterns.
8.2. Algorithmic Innovations
Temporal modeling: Hidden Markov Models or LSTMs to exploit movement sequence patterns.
Ensemble methods: Combine classifiers trained on different window sizes.
Feature selection per movement: Different movements may benefit from different feature subsets.
Confidence-based rejection: Implement “uncertain” class to prevent erroneous activations.
8.3. Theoretical Investigations
Information-theoretic analysis: Quantify information content of each feature using mutual information.
Minimum window size: Theoretically and empirically determine lower bound for acceptable accuracy.
Optimal overlap: Systematically investigate overlap ratio impact on voting performance.
8.4. Key Reproduction Parameters
All critical parameters for reproduction:
Preprocessing: Notch 60 Hz, Elliptic 20–250 Hz, 8th order.
Onset detection: (same threshold applied to all 9 subjects).
Window: samples (64 ms at 1 kHz).
Multi-window: , overlap = 50%.
Features: 11 per channel (6 time + 5 frequency).
Normalization: Zero mean, unit variance; replace NaN/Inf with 0.
Classifier: Linear SVM, , no PCA.
Cross-validation: 5-fold stratified, random_state = 42.
Author Contributions
Conceptualization, C.G.M.-P. and J.R.-R.; methodology, C.G.M.-P. and R.A.G.-L.; software, C.G.M.-P.; validation, C.G.M.-P., D.C.T.-P. and M.A.; formal analysis, C.G.M.-P.; investigation, C.G.M.-P.; resources, J.R.-R.; data curation, C.G.M.-P. and D.C.T.-P.; writing—original draft preparation, C.G.M.-P.; writing—review and editing, all authors; visualization, C.G.M.-P.; supervision, J.R.-R. and R.A.G.-L.; project administration, J.R.-R.; funding acquisition, J.R.-R. All authors have read and agreed to the published version of the manuscript.
Funding
This research was funded by SECIHTI of Mexico.
Institutional Review Board Statement
The study was conducted in accordance with the Declaration of Helsinki. The protocol was approved by the Institutional Review Board of Universidad Autónoma de Querétaro (protocol code CEAIFI-007-2026-TP, and date of approval 23 March 2026).
Informed Consent Statement
Informed consent was obtained from all subjects involved in the study.
Data Availability Statement
The data that support the findings of this study are available from the corresponding author upon reasonable request.
Acknowledgments
The authors would like to thank SECIHTI of Mexico for the funding required to generate the databases used for this research.
Conflicts of Interest
The authors declare no conflicts of interest. The funders had no role in the design of the study; in the collection, analyses, or interpretation of data; in the writing of the manuscript; or in the decision to publish the results.
References
- Menon, R.; Di Caterina, G.; Lakany, H.; Petropoulakis, L.; Conway, B.; Soraghan, J. Study on Interaction between Temporal and Spatial Information in Classification of EMG Signals for Myoelectric Prostheses. IEEE Trans. Neural Syst. Rehabil. Eng. 2017, 25, 1832–1842. [Google Scholar] [CrossRef]
- Too, J.; Abdullah, A.; Mohd Saad, N.; Mohd Ali, N.; Zawawi, T. Exploring the Relation Between EMG Pattern Recognition and Sampling Rate Using Spectrogram. J. Electr. Eng. Technol. 2019, 14, 947–953. [Google Scholar] [CrossRef]
- Geng, W.; Hu, Y.; Wong, Y.; Wei, W.; Du, Y.; Kankanhalli, M. A novel attention-based hybrid CNN-RNN architecture for sEMG-based gesture recognition. PLoS ONE 2018, 13, e0206049. [Google Scholar] [CrossRef]
- Cai, S.; Li, G.; Zhang, X.; Huang, S.; Zheng, H.; Ma, K.; Xie, L. Detecting compensatory movements of stroke survivors using pressure distribution data and machine learning algorithms. J. Neuroeng. Rehabil. 2019, 16, 131. [Google Scholar] [CrossRef]
- Shen, S.; Li, M.; Mao, F.; Chen, X.; Ran, R. Gesture Recognition Using MLP-Mixer with CNN and Stacking Ensemble for sEMG Signals. IEEE Sens. J. 2024, 24, 4960–4968. [Google Scholar] [CrossRef]
- Zabihi, S.; Rahimian, E.; Asif, A.; Mohammadi, A. Light-Weight CNN-Attention Based Architecture for Hand Gesture Recognition Via Electromyography. In Proceedings of the IEEE International Conference on Acoustics, Speech and Signal Processing (ICASSP), Rhodes Island, Greece, 4–10 June 2023. [Google Scholar] [CrossRef]
- Liu, S.H.; Lai, C.T.; Chen, H.R.; Lin, W.L.; Yamada, S.; Lugtu, I.; Chou, Y.H.; Yang, C.; Kuo, T.; Chen, S.A.; et al. The impact of estrogen supplementation to autonomic and sleep modulations in free-moving spontaneously hypertensive rats. Int. Heart J. 2020, 61, 128–137. [Google Scholar] [CrossRef]
- Smith, C.; Housh, T.; Hill, E.; Cochrane-Snyman, K.; Jenkins, N.; Schmidt, R.; Johnson, G. Effects of fatiguing constant versus alternating intensity intermittent isometric muscle actions on maximal torque and neuromuscular responses. J. Musculoskelet. Neuronal Interact. 2016, 16, 318. [Google Scholar] [PubMed]
- Chen, M.; Cheng, L.; Huang, F.; Yan, Y.; Hou, Z.G. Towards robot-assisted post-stroke hand rehabilitation: Fugl-Meyer gesture recognition using sEMG. In Proceedings of the 2017 IEEE 7th Annual International Conference on CYBER Technology in Automation, Control, and Intelligent Systems (CYBER), Honolulu, HI, USA, 31 July–4 August 2017; pp. 1472–1477. [Google Scholar] [CrossRef]
- Park, S.; Kim, C.; El-Yacoubi, B.; Christou, E. Control of oscillatory force tasks: Low-frequency oscillations in force and muscle activity. Hum. Mov. Sci. 2019, 64, 89–100. [Google Scholar] [CrossRef] [PubMed]
- Ozdemir, M.; Kisa, D.; Güren, O.; Akan, A. Hand gesture classification using time–frequency images and transfer learning based on CNN. Biomed. Signal Process. Control 2022, 77, 103787. [Google Scholar] [CrossRef]
- Yang, H.; Chen, S.; Shen, J.; Chen, Y.; Lai, M.; Chen, L.; Fang, S. Safety and Efficacy of Botulinum Toxin Type A in Children With Spastic Cerebral Palsy Aged <2 Years: A Systematic Review. J. Child Neurol. 2023, 38, 454–465. [Google Scholar] [CrossRef]
- Zhang, A.; Gao, N.; Wang, L.; Li, Q. Combined influence of classifiers, window lengths and number of channels on EMG pattern recognition for upper limb movement classification. In Proceedings of the 2018 11th International Congress on Image and Signal Processing, Biomedical Engineering and Informatics (CISP-BMEI), Beijing, China, 13–15 October 2018; pp. 1–5. [Google Scholar] [CrossRef]
- Chen, J.; Bi, S.; Zhang, G.; Cao, G.Z. High-density surface EMG-based gesture recognition using a 3D convolutional neural network. Sensors 2020, 20, 1201. [Google Scholar] [CrossRef]
- Zhang, J.; Iannetta, D.; Alzeeby, M.; MacInnis, M.; Aboodarda, S. Exercising muscle mass influences neuromuscular, cardiorespiratory, and perceptual responses during and following ramp-incremental cycling to task failure. Am. J. Physiol.-Regul. Integr. Comp. Physiol. 2021, 321, R238–R249. [Google Scholar] [CrossRef]
- Li, Y.; Zhang, Q.; Zeng, N.; Chen, J.; Zhang, Q. Discrete Hand Motion Intention Decoding Based on Transient Myoelectric Signals. IEEE Access 2019, 7, 81630–81639. [Google Scholar] [CrossRef]
- Gokgoz, E.; Subasi, A. Comparison of decision tree algorithms for EMG signal classification using DWT. Biomed. Signal Process. Control 2015, 18, 138–144. [Google Scholar] [CrossRef]
- Phukpattaranont, P.; Thongpanja, S.; Anam, K.; Al-Jumaily, A.; Limsakul, C. Evaluation of feature extraction techniques and classifiers for finger movement recognition using surface electromyography signal. Med. Biol. Eng. Comput. 2018, 56, 2259–2271. [Google Scholar] [CrossRef]
- Sul, J.H.; Piyathilaka, L.; Moratuwage, D.; Dunu Arachchige, S.; Jayawardena, A.; Appuhamillage, G.; Preethichandra, D. Electromyography Signal Acquisition, Filtering, and Data Analysis for Exoskeleton Development. Sensors 2025, 25, 4004. [Google Scholar] [CrossRef] [PubMed]
- Wang, W.; Gu, Y.; Zhang, Y.; Bai, J.; Liu, T. A VMD-Based Noise-Specific and Adaptive Removal Method for High-Density Surface EMG. IEEE Sens. J. 2025, 25, 15367–15377. [Google Scholar] [CrossRef]
- Dumitru, D.; Barkhaus, P.; Nandedkar, S. Electrical Interference in Clinical Practice: A Conceptual and Practical Approach. Muscle Nerve 2025, 71, 317–342. [Google Scholar] [CrossRef]
- Phukpattaranont, P.; Thiamchoo, N.; Neranon, P. Real-time identification of noise type contaminated in surface electromyogram signals using efficient statistical features. Med. Eng. Phys. 2024, 131, 104232. [Google Scholar] [CrossRef]
- Madan, P.; Singh, V.; Singh, D.; Manoj, M.; Kishor, A. Denoising of ECG signals using weighted stationary wavelet total variation. Biomed. Signal Process. Control 2022, 73, 103478. [Google Scholar] [CrossRef]
- Abbasi, M.; Rashad, A.; Srivastava, G.; Tariq, M. Multiple contaminant biosignal quality analysis for electrocardiography. Biomed. Signal Process. Control 2022, 71, 103127. [Google Scholar] [CrossRef]
- Guerrero, F.; Spinelli, E. Biopotential Acquisition Systems. In Medicine-Based Informatics and Engineering; Lecture Notes in Bioengineering; Springer: Cham, Switzerland, 2022. [Google Scholar] [CrossRef]
- Phan, T.; Nguyen, K.; Phu do, X.; Huu Thanh Tu, P.; Pham, H.T. A new design of an electromyography sensor for movement detection in human-machine interaction systems. Adv. Mech. Eng. 2025, 17, 16878132251338446. [Google Scholar] [CrossRef]
- Carvalho, C.; Fernández, J.; del Ama, A.; Oliveira-Barroso, F.; Moreno, J. Review of electromyography onset detection methods for real-time control of robotic exoskeletons. J. Neuroeng. Rehabil. 2023, 20, 141. [Google Scholar] [CrossRef]
- Kreipe, S.; Helbig, T.; Witte, H.; Schumann, N.P.; Anders, C. Comparison of sEMG Onset Detection Methods for Occupational Exoskeletons on Extensive Close-to-Application Data. Bioengineering 2024, 11, 119. [Google Scholar] [CrossRef]
- Tigrini, A.; Mengarelli, A.; Cardarelli, S.; Fioretti, S.; Verdini, F. Improving EMG Signal Change Point Detection for Low SNR by Using Extended Teager-Kaiser Energy Operator. IEEE Trans. Med. Robot. Bionics 2020, 2, 661–669. [Google Scholar] [CrossRef]
- Crotty, E.; Furlong, L.A.; Hayes, K.; Harrison, A. Onset detection in surface electromyographic signals across isometric explosive and ramped contractions: A comparison of computer-based methods. Physiol. Meas. 2021, 42, 035010. [Google Scholar] [CrossRef] [PubMed]
- Di Nardo, F.; Nocera, A.; Cucchiarelli, A.; Fioretti, S.; Morbidoni, C. Machine Learning for Detection of Muscular Activity from Surface EMG Signals. Sensors 2022, 22, 3393. [Google Scholar] [CrossRef]
- Kowalski, E.; Catelli, D.; Lamontagne, M. Comparing the accuracy of visual and computerized onset detection methods on simulated electromyography signals with varying signal-to-noise ratios. J. Funct. Morphol. Kinesiol. 2021, 6, 70. [Google Scholar] [CrossRef]
- Nikolaidi, V.T.; Andrikopoulos, G.; Tsipianitis, D.; Kazakos, D. Emg onset and offset detection via a modified threshold crossings algorithm. In Proceedings of the 2022 30th Mediterranean Conference on Control and Automation (MED), Athens, Greece, 28 June–1 July 2022; pp. 1111–1116. [Google Scholar] [CrossRef]
- Park, J.; Jung, M.C.; Kim, J.; Mo, S.M. Developing Synthetic Parameters Using Frequency Band Ratios for Muscle Fatigue Analysis During Isometric Contractions by Using Shoulder Muscles. Sensors 2025, 25, 2191. [Google Scholar] [CrossRef]
- Rodrigues, R.; Molinari, T.; Sonda, F.; Frigotto, M.; Gaviraghi, P.; Rabello, R. Sex-differences in neuromuscular control of hip abductors during isometric submaximal tasks. Gait Posture 2025, 115, 86–93. [Google Scholar] [CrossRef]
- Sugimoto, T.; Yoshikura, R.; Maezawa, T.; Mekata, K.; Ueda, Y.; Kawaguchi, H.; Izumi, S. Effects of the walking independence on lower extremity and trunk muscle activity during straight-leg raising following incomplete cervical cord injury. Sci. Rep. 2024, 14, 4363. [Google Scholar] [CrossRef] [PubMed]
Figure 1.
Raw vs. filtered sEMG signal across 4 channels (Subject: Male4, Movement: LP, Trial 6). Left: Raw signal showing DC offset and noise contamination. Right: Signal after 60 Hz notch and 20–250 Hz elliptic bandpass filtering.
Figure 1.
Raw vs. filtered sEMG signal across 4 channels (Subject: Male4, Movement: LP, Trial 6). Left: Raw signal showing DC offset and noise contamination. Right: Signal after 60 Hz notch and 20–250 Hz elliptic bandpass filtering.
Figure 2.
Power spectral density before (top) and after (bottom) filtering. The 60 Hz PLI peak is attenuated by the notch filter, and frequency content outside the 20–250 Hz passband (green shading) is suppressed by the elliptic filter.
Figure 2.
Power spectral density before (top) and after (bottom) filtering. The 60 Hz PLI peak is attenuated by the notch filter, and frequency content outside the 20–250 Hz passband (green shading) is suppressed by the elliptic filter.
Figure 3.
Multi-window extraction with 50% overlap around the detected movement onset (red vertical line). Five consecutive 64 ms windows (colored regions) are extracted with a 32-sample shift, each producing an independent feature vector and classification that are combined via majority voting.
Figure 3.
Multi-window extraction with 50% overlap around the detected movement onset (red vertical line). Five consecutive 64 ms windows (colored regions) are extracted with a 32-sample shift, each producing an independent feature vector and classification that are combined via majority voting.
Figure 4.
Per-subject classification accuracy comparing single-window vs. multi-window voting. Dashed lines indicate population means. Multi-window voting improves accuracy for every subject, with the largest gains observed for subjects with lower baseline performance.
Figure 4.
Per-subject classification accuracy comparing single-window vs. multi-window voting. Dashed lines indicate population means. Multi-window voting improves accuracy for every subject, with the largest gains observed for subjects with lower baseline performance.
Figure 5.
Population-level voted accuracy across 5 classifiers using the same multi-window feature extraction pipeline. Error bars represent inter-subject standard deviation.
Figure 5.
Population-level voted accuracy across 5 classifiers using the same multi-window feature extraction pipeline. Error bars represent inter-subject standard deviation.
Figure 6.
Classification timeline comparing 64 ms multi-window voting (middle panel) vs. 1000 ms single-window classification (bottom panel) on a sequence of six movements. Top panel shows the raw sEMG signal (channel 1) with ground-truth movement labels. Arrows indicate classification latency: 192 ms for the 64 ms system vs. 1000 ms for the baseline. Squares denote correct predictions; crosses denote misclassifications.
Figure 6.
Classification timeline comparing 64 ms multi-window voting (middle panel) vs. 1000 ms single-window classification (bottom panel) on a sequence of six movements. Top panel shows the raw sEMG signal (channel 1) with ground-truth movement labels. Arrows indicate classification latency: 192 ms for the 64 ms system vs. 1000 ms for the baseline. Squares denote correct predictions; crosses denote misclassifications.
Table 1.
Effect of PCA on linear SVM accuracy (all 44 components retained).
Table 1.
Effect of PCA on linear SVM accuracy (all 44 components retained).
| Configuration | Accuracy |
|---|
| Without PCA | |
| With PCA (44 comp.) | |
| Difference | 0.00% |
Table 2.
Linear SVM accuracy as a function of PCA components retained.
Table 2.
Linear SVM accuracy as a function of PCA components retained.
| Components | Variance (%) | Accuracy (%) | vs. 44 Comp. |
|---|
| 16 | 0.24 | 23.57 | |
| 20 | 0.59 | 18.57 | |
| 24 | 1.19 | 20.71 | |
| 28 | 2.36 | 26.43 | |
| 32 | 4.19 | 30.00 | |
| 36 | 7.67 | 40.71 | |
| 40 | 16.99 | 46.43 | |
| 44 | 100.00 | 72.14 | BEST |
Table 3.
Experimental progression and accuracy improvement (development subject: Male4).
Table 3.
Experimental progression and accuracy improvement (development subject: Male4).
| Configuration | Accuracy (%) | Change |
|---|
| Baseline (1000 ms) | 85.00 | — |
| 64 ms initial | 47.14 | % |
| +Optimized time features | 58.57 | % |
| +Frequency features | 70.43 | % |
| +Multi-window voting | 76.43 | +6.00% |
Table 4.
Failed experimental approaches.
Table 4.
Failed experimental approaches.
| Approach | Accuracy | vs. Baseline |
|---|
| Adaptive windowing | | % |
| Spectral entropy | | % |
| PCA (any reduction) | 18–46% | to % |
Table 5.
Per-subject 5-fold cross-validation results (final system).
Table 5.
Per-subject 5-fold cross-validation results (final system).
| Subject | Single Window (%) | Multi-Window Voted (%) | Improvement |
|---|
| Female1 | | | |
| Female2 | | | |
| Female3 | | | |
| Female4 | | | |
| Female5 | | | |
| Male1 | | | |
| Male2 | | | |
| Male3 | | | |
| Male4 | | | |
| Population | | | |
Table 6.
Classifier comparison: population-level voted accuracy (%) across 9 subjects.
Table 6.
Classifier comparison: population-level voted accuracy (%) across 9 subjects.
| Classifier | Accuracy (%) | Std Dev (%) |
|---|
| Random Forest (100 trees) | 71.75 | 8.62 |
| Linear SVM | 70.16 | 7.09 |
| Decision Tree | 64.68 | 11.08 |
| LDA | 63.49 | 7.87 |
| KNN () | 63.02 | 9.65 |
Table 7.
Comparison with published EMG classification systems.
Table 7.
Comparison with published EMG classification systems.
| Study | Accuracy (%) | Channels | Method |
|---|
| [14] | 95.5 | 128 | HD-EMG + 3D CNN |
| Traditional ML | 75–85 | 4–8 | Various |
| [16] | 70.4 | 4 | Deep Learning |
| This work | 70.16 | 4 | Linear SVM (9 subjects) |
| Disclaimer/Publisher’s Note: The statements, opinions and data contained in all publications are solely those of the individual author(s) and contributor(s) and not of MDPI and/or the editor(s). MDPI and/or the editor(s) disclaim responsibility for any injury to people or property resulting from any ideas, methods, instructions or products referred to in the content. |




 ,
,