1. Introduction
Unplanned downtime in industrial machinery poses a significant challenge to manufacturing efficiency. Unexpected machine failures can lead to severe financial losses, production delays, and increased maintenance costs. In plastic injection molding, where precision and continuity are crucial, predicting and preventing such failures is essential to maintain productivity and reduce operational risks. Failures in these machines can stem from various sources, including mechanical wear, electrical faults and human errors, making early detection a complex but necessary task.
Plastic Injection Molding (PIM) machines are heavy industrial equipment that require specialized maintenance interventions. Ideally, they operate continuously for many hours, days, or even weeks in order to maximize production and minimize setup time. Nonetheless, they can suffer numerous problems that require fast, qualified maintenance interventions. A number of possible problems and solutions are discussed below. The problems include fixed plate deformation, obstructions in the injection system, pressure and temperature variations, mold cooling failures, and other common challenges in this type of equipment.
Recent advancements in data science and machine learning have enabled the development of predictive maintenance strategies aimed at reducing unplanned stoppages. Anomaly detection has shown promising results in identifying patterns associated with machine failures, allowing early interventions [
1]. However, despite the growing body of research, many industrial applications still rely on reactive maintenance, leading to inefficiencies and high costs. This study aims to contribute to bridging this gap for this particular type of equipment, by applying data-driven clustering and classification methods to detect failures in a plastic injection machine at a very early stage.
The main objectives of this research are as follows: (1) to analyze machine behavior through literature and dataset analysis; (2) to group and identify states through clustering techniques and (3) to classify the data to be used later in fault detection in a real-world industrial context. The study follows a structured methodology, starting with data collection and machine characterization, followed by clustering analysis and classification. The present paper is an expanded and revised version of [
2].
The remainder of this paper is organized as follows:
Section 2 describes the operating principles and main components of the plastic injection machine.
Section 3 reviews the current state of the art.
Section 4 outlines the data and methodology adopted in this study.
Section 5 discusses the results, and
Section 7 presents the conclusions and future research directions.
2. Plastic Injection Machines
Plastic Injection Machines are large and complex equipment, heating the plastic and passing molten plastic through more or less complex molds for production.
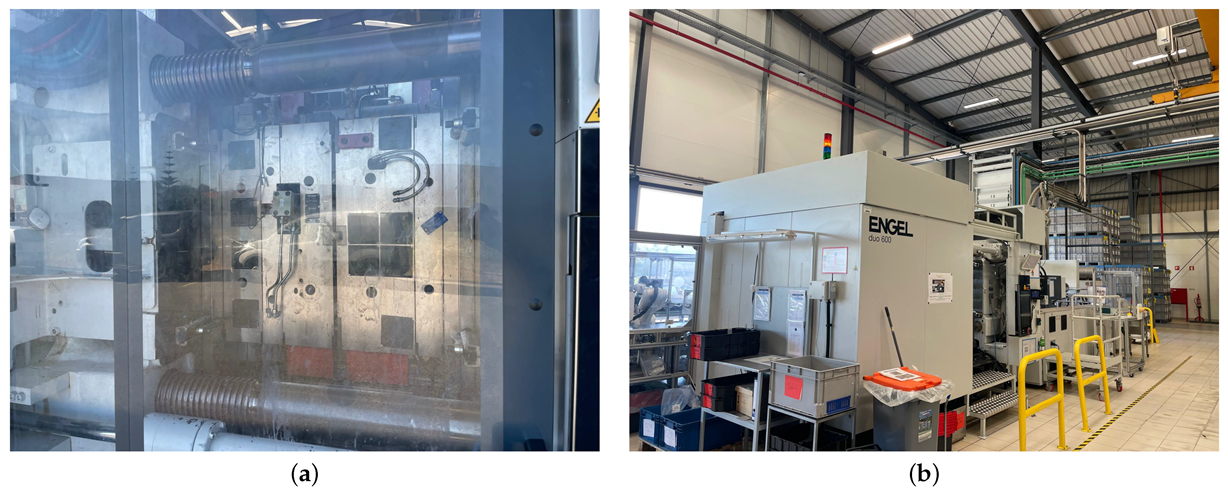
Figure 1 shows pictures of the PIM subject of study.
Table 1 shows the components that make up the machine, its location and a brief description of what it does.
2.1. Steps in Injection Molding
Injection molding is a critical manufacturing process in the plastics industry, capable of producing high-volume, high-precision components for a wide range of applications. Here is a detailed description of the plastic injection molding process.
Feeding and Preparation of Raw Material —The process begins with loading plastic raw materials, usually in the form of small pellets or granules, into the machine’s hopper. These thermoplastic materials, such as polypropylene (PP), polyethylene (PE), polystyrene (PS), polycarbonate (PC), or acrylonitrile butadiene styrene (ABS), can be mixed with additives such as colorants, UV stabilizers, or reinforcing agents to alter the appearance of the part. The hopper feeds the material into a heated cylinder by gravity.
Plasticizing the Material—Inside the cylinder, a reciprocating screw rotates and moves the plastic forward. As the material advances, it is gradually heated by both external electric heaters surrounding the barrel and the frictional heat generated by the shearing action of the screw. This combined heat melts the pellets into a homogeneous, viscous molten state called a pillow. At the front of the barrel, a check valve prevents the molten plastic from flowing backwards, ensuring that the full volume of material is injected forward when needed.
Injection into the Mold—Once a sufficient amount of molten plastic has accumulated in front of the screw (a process known as “shot size preparation”), the screw stops rotating and moves forward, acting as a plunger. It forces the molten plastic through the nozzle and into the mold cavity under high pressure. The mold, which is tightly closed under tons of pressure, contains the negative shape of the final part. The high injection pressure ensures that the molten plastic fills every detail of the cavity, including thin walls, small features and complex geometries.
Cooling and Solidification—Once the mold is filled, the cooling phase begins. The plastic begins to solidify when it comes into contact with the cooler walls of the mold. Most molds have an integrated cooling system, usually channels that circulate water or oil, to control and accelerate the cooling process. Cooling time is crucial and depends on the material, part thickness and mold design. Adequate cooling ensures dimensional stability and prevents problems such as warpage or sink marks.
Mold Opening and Part Ejection—After sufficient cooling time, the mold opens and ejector pins push the solidified part out of the cavity. In multi-cavity molds, several parts can be ejected simultaneously. Sometimes, robotic arms or conveyors assist in removing and organizing molded parts, especially in automated production lines. Once the part is ejected, the mold closes again and the next cycle begins. A complete injection molding cycle can take anywhere from a few seconds to a few minutes.
Post-Molding Operations—Although injection molding produces parts that are nearly finished in shape, some post-processing may be required. In this case, the piece is automatically inspected for defects, then transferred to an oven where it is hardened and strengthened before being stored.
2.2. PIM Problems and Failures
PIMs are complex devices that require careful optimization and maintenance to operate smoothly and safely. According to industry operators who perform daily maintenance on injection molding machines, a number of issues are common [
3].
One of the most common problems in PIM machines is the obstruction of the injection devices due to plastic residue accumulation or contaminants. This issue may arise from improper cleaning procedures, low-quality materials, or incorrect processing conditions. Additionally, incorrect material selection and improper processing parameters can lead to material degradation, overheating, and nozzle blockage. Regular maintenance and cleaning of injection devices are essential to prevent obstructions. Operators should use appropriate cleaning agents to remove accumulated residues. Using compatible materials and optimizing processing parameters also significantly reduces obstruction risks and enhances machine efficiency.
The Mold Cooling System is another sensitive part. Inefficient mold cooling can result from poor cooling channel design and inadequate heat dissipation capacity, leading to uneven temperature distribution, extended cycle times, higher defect risks, and reduced product quality. Optimizing the layout and configuration of cooling channels ensures uniform temperature distribution throughout the mold. Proper positioning, consistent channel diameters, and appropriate spacing improve cooling efficiency, leading to better productivity and higher-quality injected parts.
Pressure and Temperature Variations in Injection can also be a source of problems. Pressure variations in the injection process are influenced by changes in material viscosity and polymer flow behavior. Temperature fluctuations and humidity content can alter material flow properties, causing injection pressure instability. Controlling material properties through proper storage, handling, and humidity monitoring is critical. Injection parameters must be adjusted based on material type, product shape, and mold design. Proper pressure calibration minimizes variations and ensures consistent production quality.
Part Adhesion and Removal Issues are another typical problem. Part adhesion to the mold can result from inadequate use of mold release agents. Insufficient extraction force or poorly designed ejector pins may lead to deformation or incomplete removal of molded parts. Applying mold release agents correctly and optimizing surface finish reduces friction and facilitates part removal. Adjusting the extraction force and modifying the ejector pin design ensure efficient part ejection, minimizing defects and material waste.
The Hydraulic System can also cause frequent failures. Hydraulic failures, including oil leaks due to worn seals, damaged hoses, or loose connections, can significantly impact machine performance. Insufficient hydraulic pressure caused by pump failures, valve blockages, or fluid contamination also disrupts operation. Regular hydraulic system inspections prevent oil leaks and ensure all connections are secure. Monitoring pressure gauges and performing preventive maintenance on pumps, valves, and filters, help maintain optimal hydraulic performance and avoid machine failures.
The Electrical and Control System must also be monitored to prevent potential failures. Electrical issues, such as power fluctuations or wiring failures, can cause unexpected machine shutdowns and production delays. Malfunctions in the control system, including software or hardware issues, can impact machine performance and process regulation. Installing surge protectors, voltage regulators, and uninterruptible power supplies (UPS) stabilizes the power supply and prevents sudden failures. Routine inspections of electrical wiring, terminals, and connectors help prevent malfunctions. Diagnosing and resolving control system issues in advance ensures stable operation and high-quality production.
By addressing these issues through proper maintenance and optimization strategies, the efficiency, durability, and quality of plastic injection molding machines can be significantly improved.
4. Data and Methodology
In this study, an unsupervised learning approach was used. This is a type of machine learning that analyzes data without human supervision. Unlike supervised learning, it works with unlabeled data, allowing models to discover patterns and insights independently. This approach was employed to analyze the dataset, using Principal Component Analysis (PCA) for dimensionality reduction and Density-Based Spatial Clustering of Applications with Noise (DBSCAN) for clustering. This method is particularly useful for organizing large volumes of information into clusters and identifying previously unknown patterns. The methodology followed a structured workflow involving data preprocessing, feature extraction, and clustering to uncover meaningful patterns in the data.
Figure 2 illustrates the steps of the process that was followed.
4.1. Dataset Description and Data Preprocessing
The dataset consists of sensor values recorded by the machine over time. It contains failure data, although it does not show what kind of failure it was. Due to its high-dimensional nature, a preprocessing step was necessary to reduce the dataset size while preserving crucial information to improve clustering performance.
This dataset contains records from April 2024 to January 2025, covering a sampling period of 274 days. The records were sampled at a frequency of seconds, based on a
best effort approach. There is a total of 48 million records across 129 variables and seven machines. The subset for analysis was subsequently reduced to 19 critical variables, containing 3,242,214 records from a single machine, Machine 76.
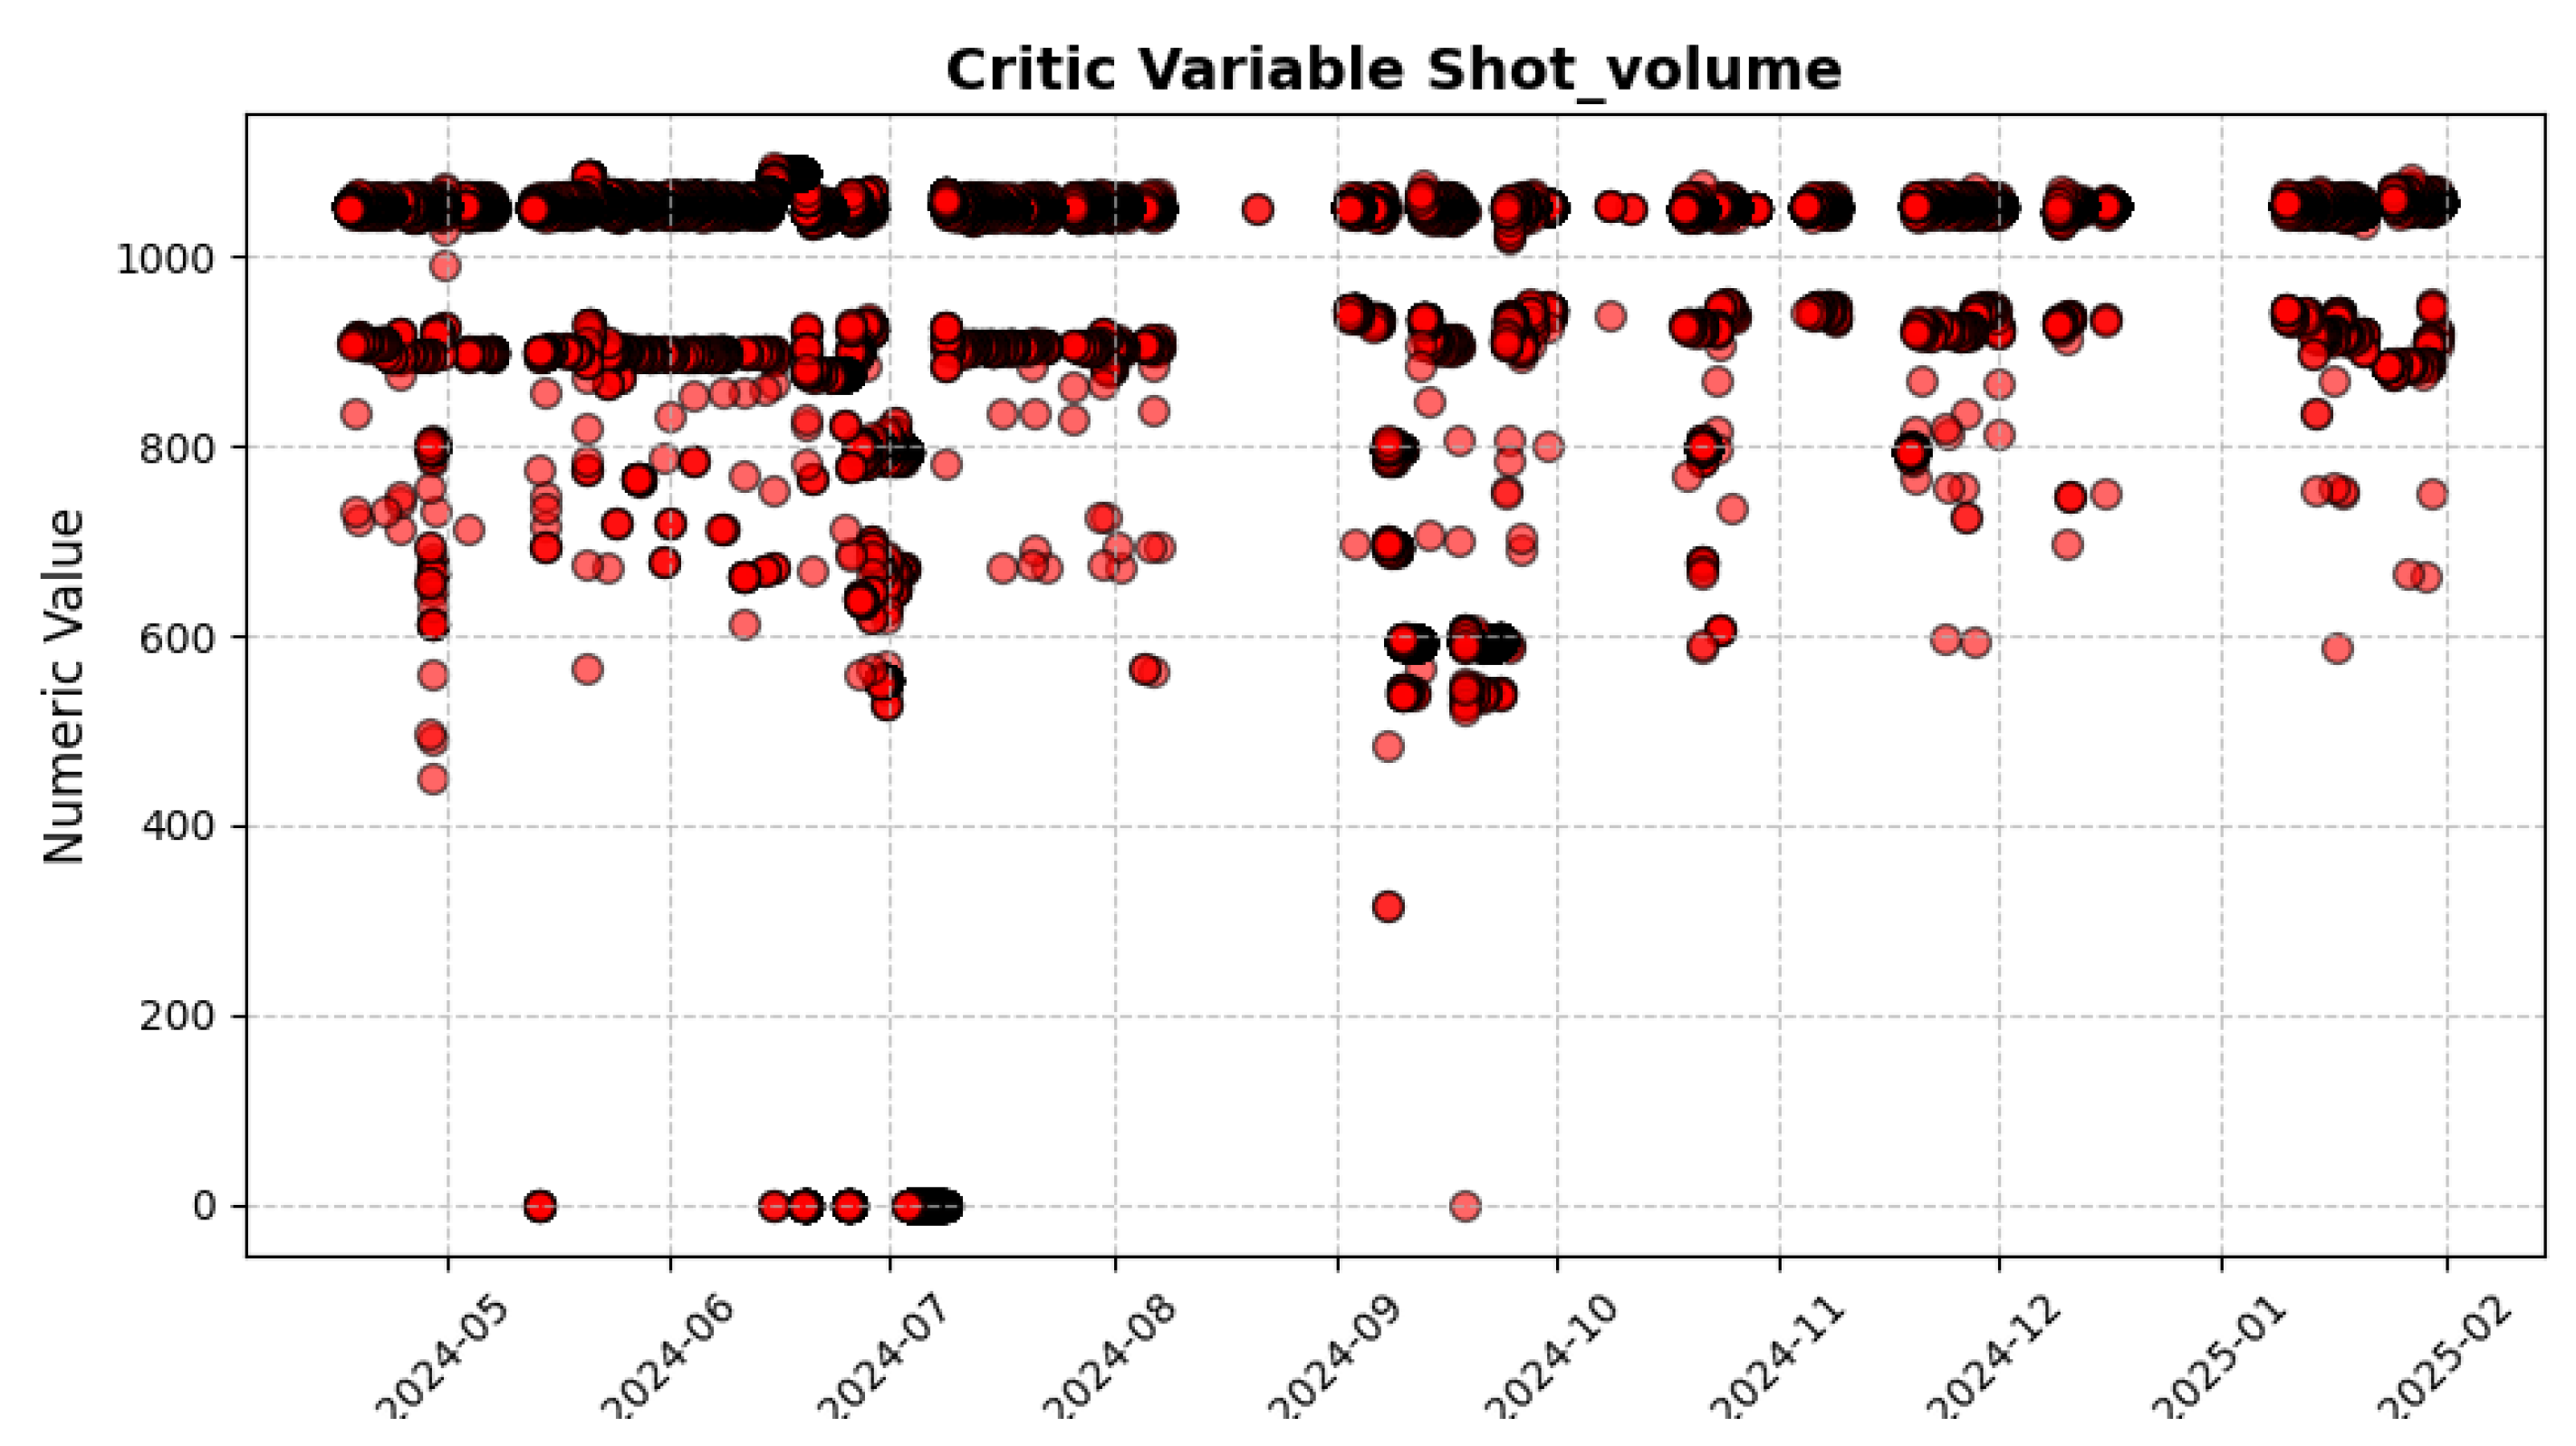
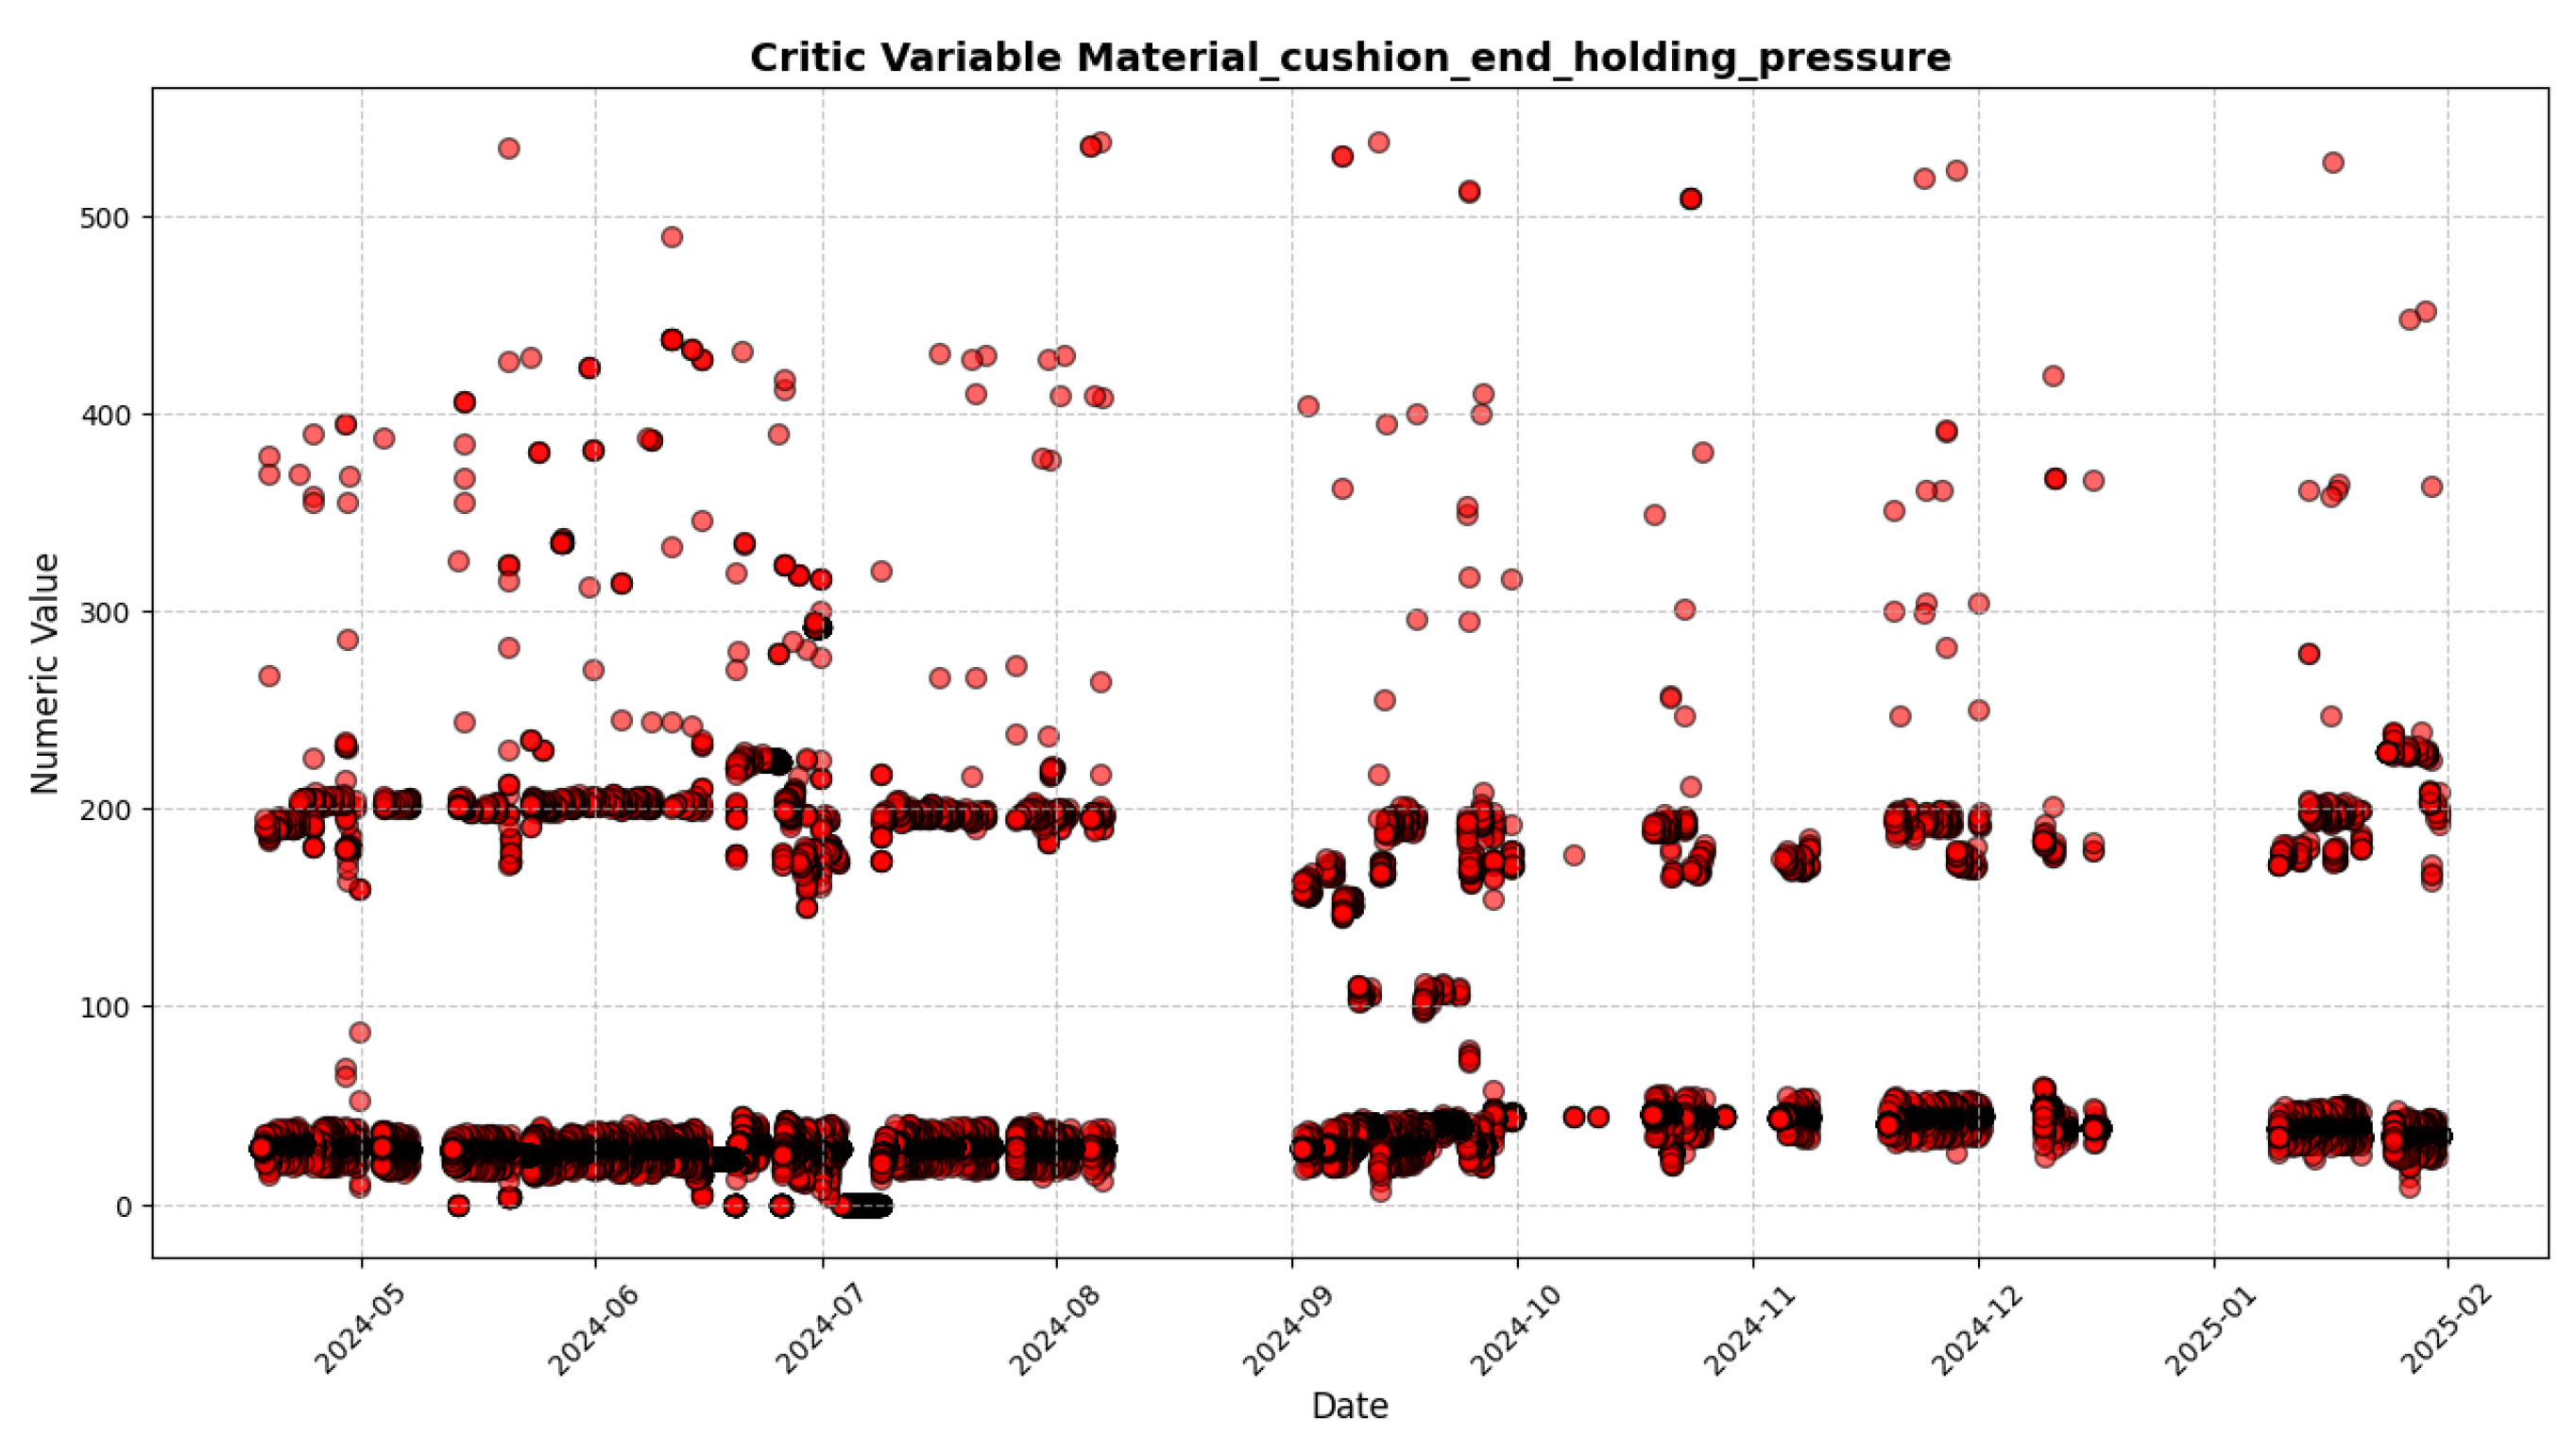
Table 2, as well as
Figure 3 and
Figure 4, show the statistics of the variables used for clustering and the plots of the records for two of the variables utilized.
As we can see from these two graphs
Figure 3 and
Figure 4, the data sampling period together with where the data have the highest frequency, and the areas where black stands out are due to the high number of points. The dataset had areas of missing records in all the critical variables used. As can be seen in
Figure 3, it is possible to observe the absence of records for some time intervals. The values were replaced using the forward-fill (ffill) method in the Python pandas library, which drags the last valid value known until a new valid value is found. This approach was chosen because sensor values often remain constant during operation, making the previous value a reasonable estimator.
4.2. Dimensionality Reduction Using PCA
Principal Component Analysis (PCA) is a statistical technique that transforms high-dimensional data into a lower-dimensional space while retaining most of its variance. This process is particularly useful in clustering, as it removes noise and redundant information, leading to improved performance. PCA identifies directions, known as principal components, along which data exhibits the most variance, and projects the data onto these components.
Since PCA is sensitive to scale, all numerical features were standardized using z-score normalization, ensuring a mean of zero and a standard deviation of one. This step prevented features with large magnitudes from dominating the analysis.
As the dataset contains a large number of records and the DBSCAN clustering model uses a large amount of memory, it was necessary to reduce the dataset, preserving as much of the variance as possible. For this reason, PCA was tested with variance threshold values between 0.8 and 0.995, which are meant to have between two and four components.
4.3. Rationale and Objectives for Clustering
Since the dataset does not contain any labels indicating the machine’s operational state, it is necessary to apply an unsupervised learning approach to infer these states from the data. Specifically, we use clustering to group similar observations together based on the values of the available features.
The rationale for employing clustering lies in its ability to uncover natural groupings within the data without prior knowledge of the categories. By doing so, we aim to identify distinct operational states of the machine. Each cluster is expected to correspond to a different state, such as normal operation, early signs of degradation, or imminent failure.
Although this technique is quite interesting, it presents certain challenges. Most notably, the fact that the groups identified in the data may not reflect real-world groupings. To address this, several tests needed to be conducted using different parameters, followed by a meeting with company stakeholders to determine the number of clusters that best fit the context. This gave greater reliability to the study.
4.4. Clustering with DBSCAN
DBSCAN is a density-based clustering algorithm that groups data points based on their density, making it well-suited for datasets with irregular cluster shapes. Unlike K-Means, DBSCAN does not require specifying the number of clusters beforehand. Instead, it identifies clusters as dense regions separated by areas of lower density.
DBSCAN assigns each data point to a cluster or labels it as noise if it does not meet the density criteria, that is, if the number of neighboring points within a given radius is less than a predefined minimum. A core point is one that has at least this minimum number of neighbors within the radius. Points that do not have enough neighbors are classified as noise.
This model contains two parameters that can be changed to obtain different results. These parameters, min_samples and eps, are responsible for defining the minimum number of points within the radius to form a cluster and for defining that radius, respectively. The values used for this study for min_samples are between 50 and 300 and for eps between 0 and 2. These parameter values were chosen based on the dataset values so that no single cluster or several irrelevant clusters are created.
4.5. Classification with PyCaret
PyCaret is an open-source, low-code machine learning library in Python 3.12.9 that automates machine learning workflows. It was designed and implemented to simplify the work of data scientists. With just a few lines of code, it automates the entire machine learning workflow, from data preparation and model comparison to hyperparameter tuning, cross-validation, and final model selection.
In this study, PyCaret was also used for easy and balanced splitting of the dataset across all clusters, ensuring the same proportion of data from each cluster was used for both training and testing. Additionally, PyCaret trains multiple machine learning models and tests various hyperparameter configurations for each one. The best-performing model is then selected, saved, and used in the application. It also offers a variety of visualizations to assess classification performance and detect potential issues such as overfitting or underfitting.
Before carrying out the classification tests to determine the most effective classifier, the data were divided equally, percentage-wise, among all the clusters. This approach aims to ensure that, regardless of the number of samples per cluster (for example, one cluster with 1000 samples and another with only 100), the proportion of data allocated for training and testing remains uniform. The data_split_stratify parameter, provided by PyCaret, ensures that.
Figure 5 illustrates the steps followed during the data analysis process.
5. Clustering and Classification Results
Clustering and classification results are presented and discussed below.
5.1. DBSCAN Results
After optimization, DBSCAN identified a total of six clusters for the machine, plus noise. Noise in the present case can be discrepant samples caused by electromagnetic noise, spurious phenomena, or a machine malfunction. In the present study, after careful analysis, the noisy samples were considered not relevant for further analysis.
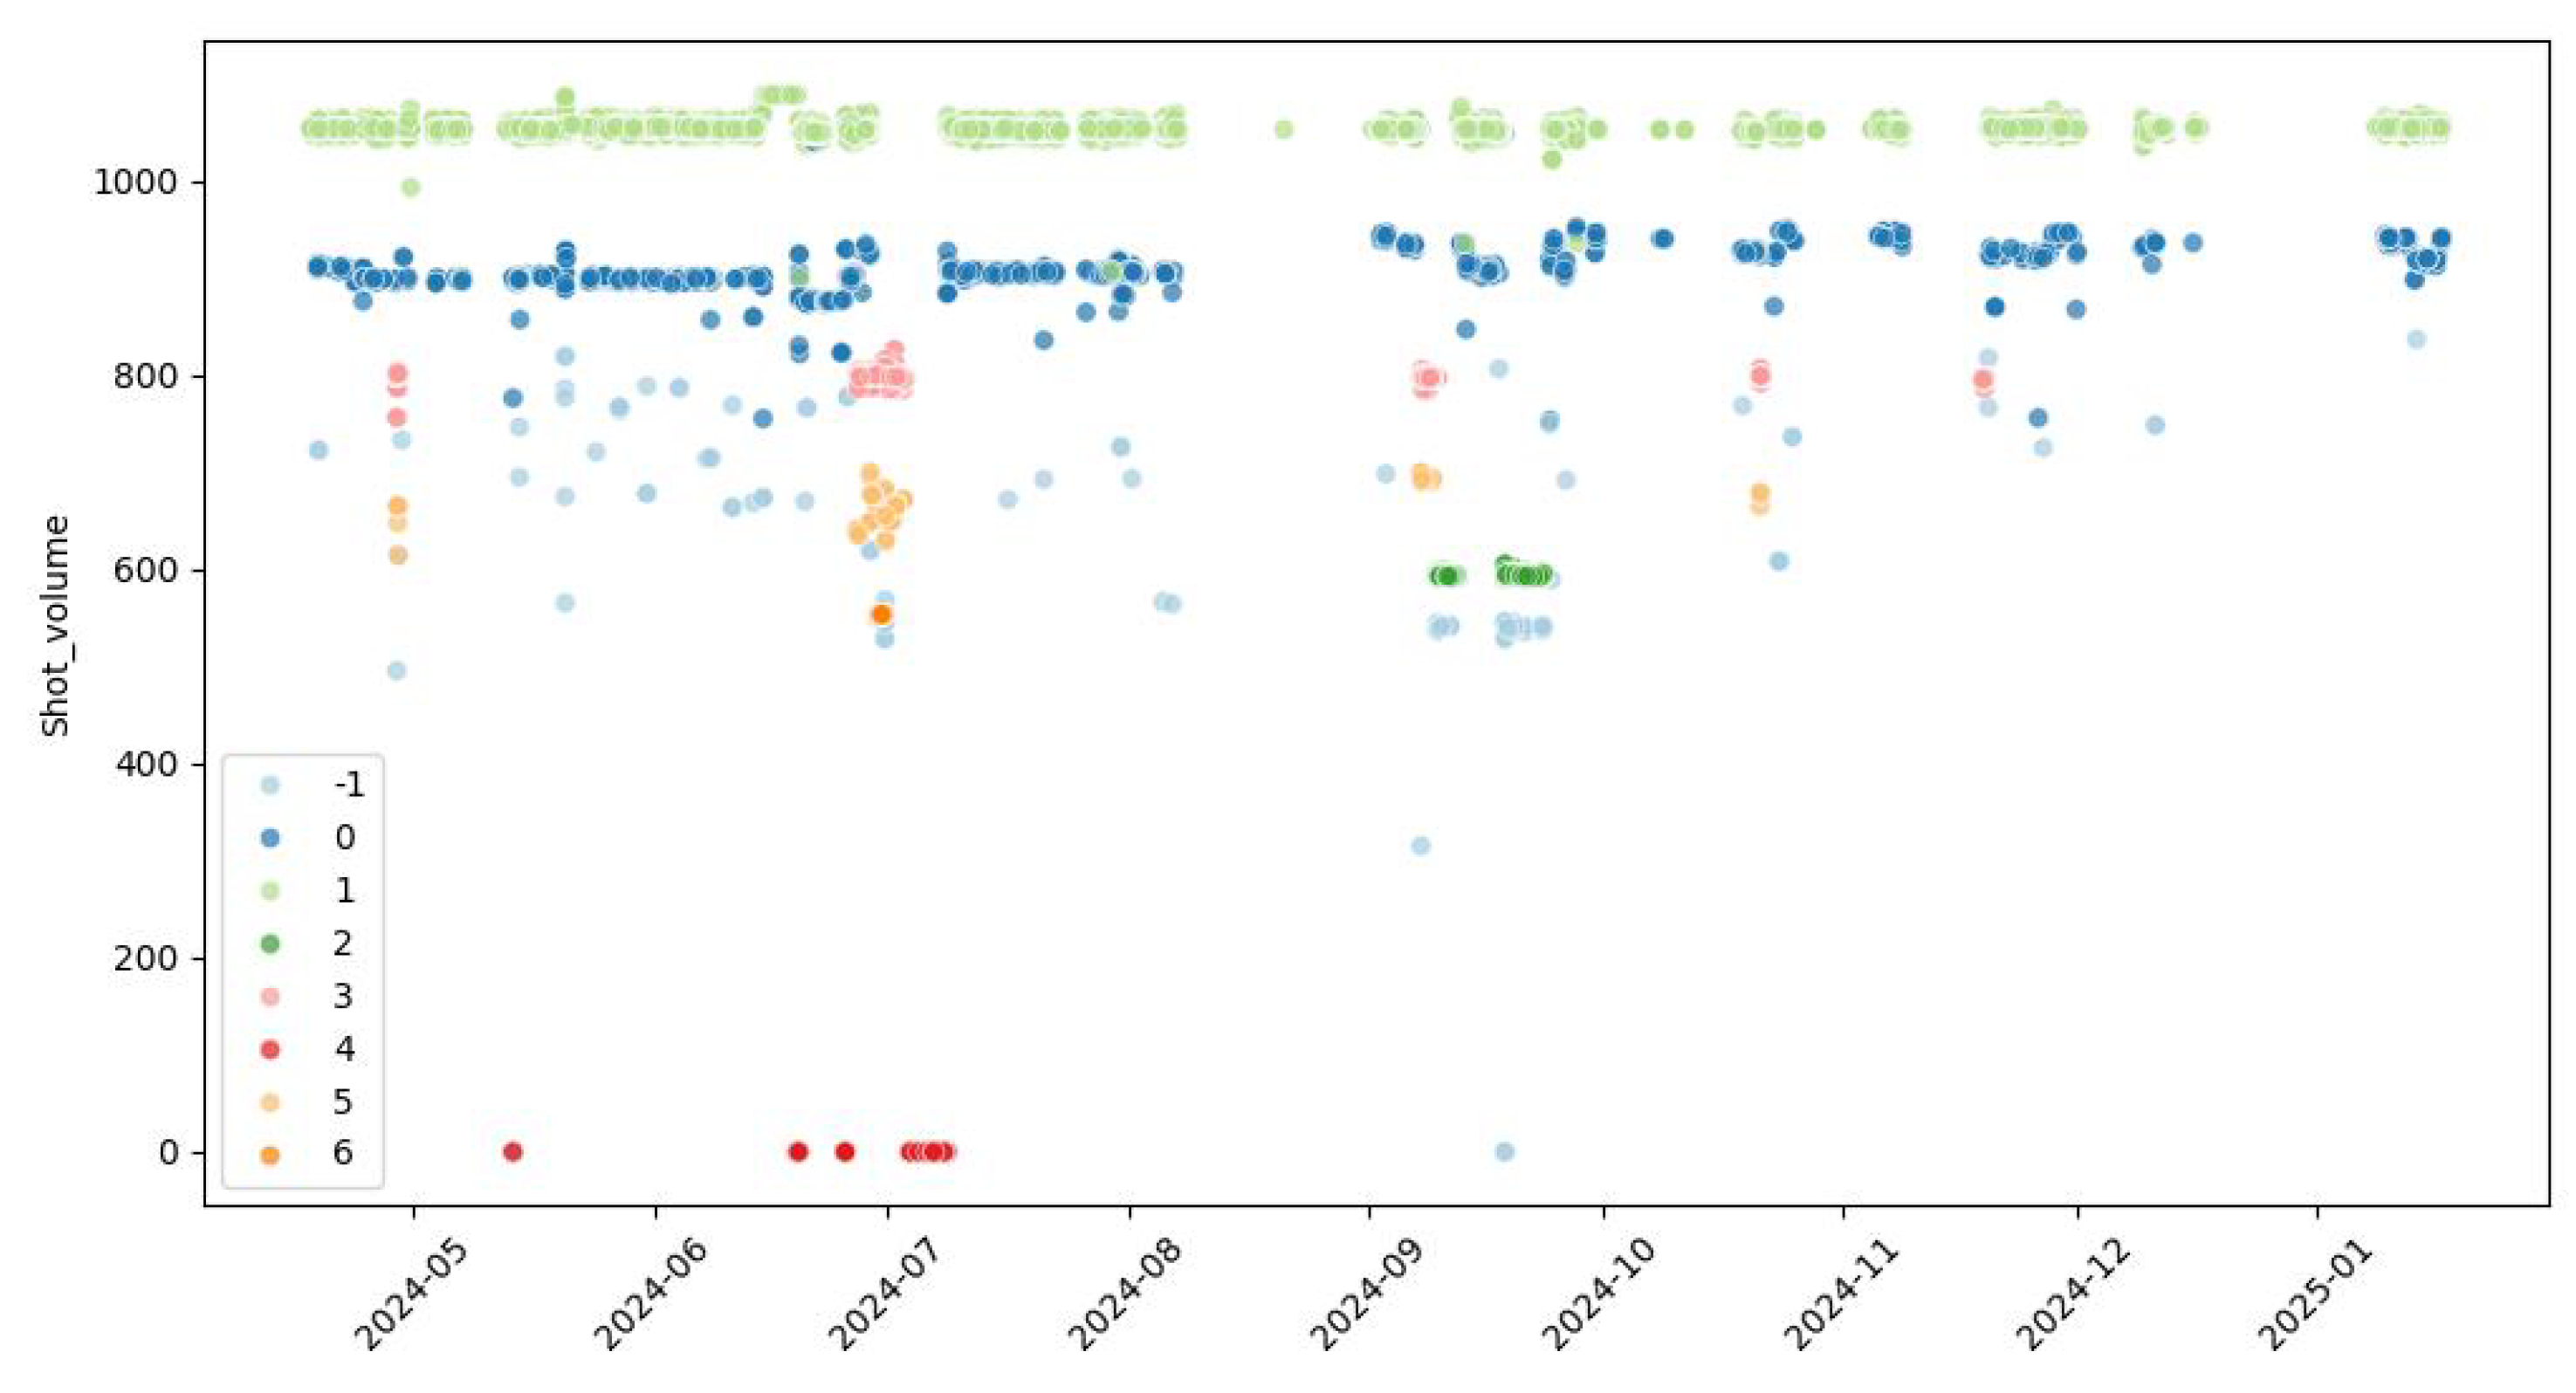
Figure 6 shows a visualization of the results of the clustering algorithm. The figure illustrates how the algorithm identifies different clusters over time, for variable Shot Volume.
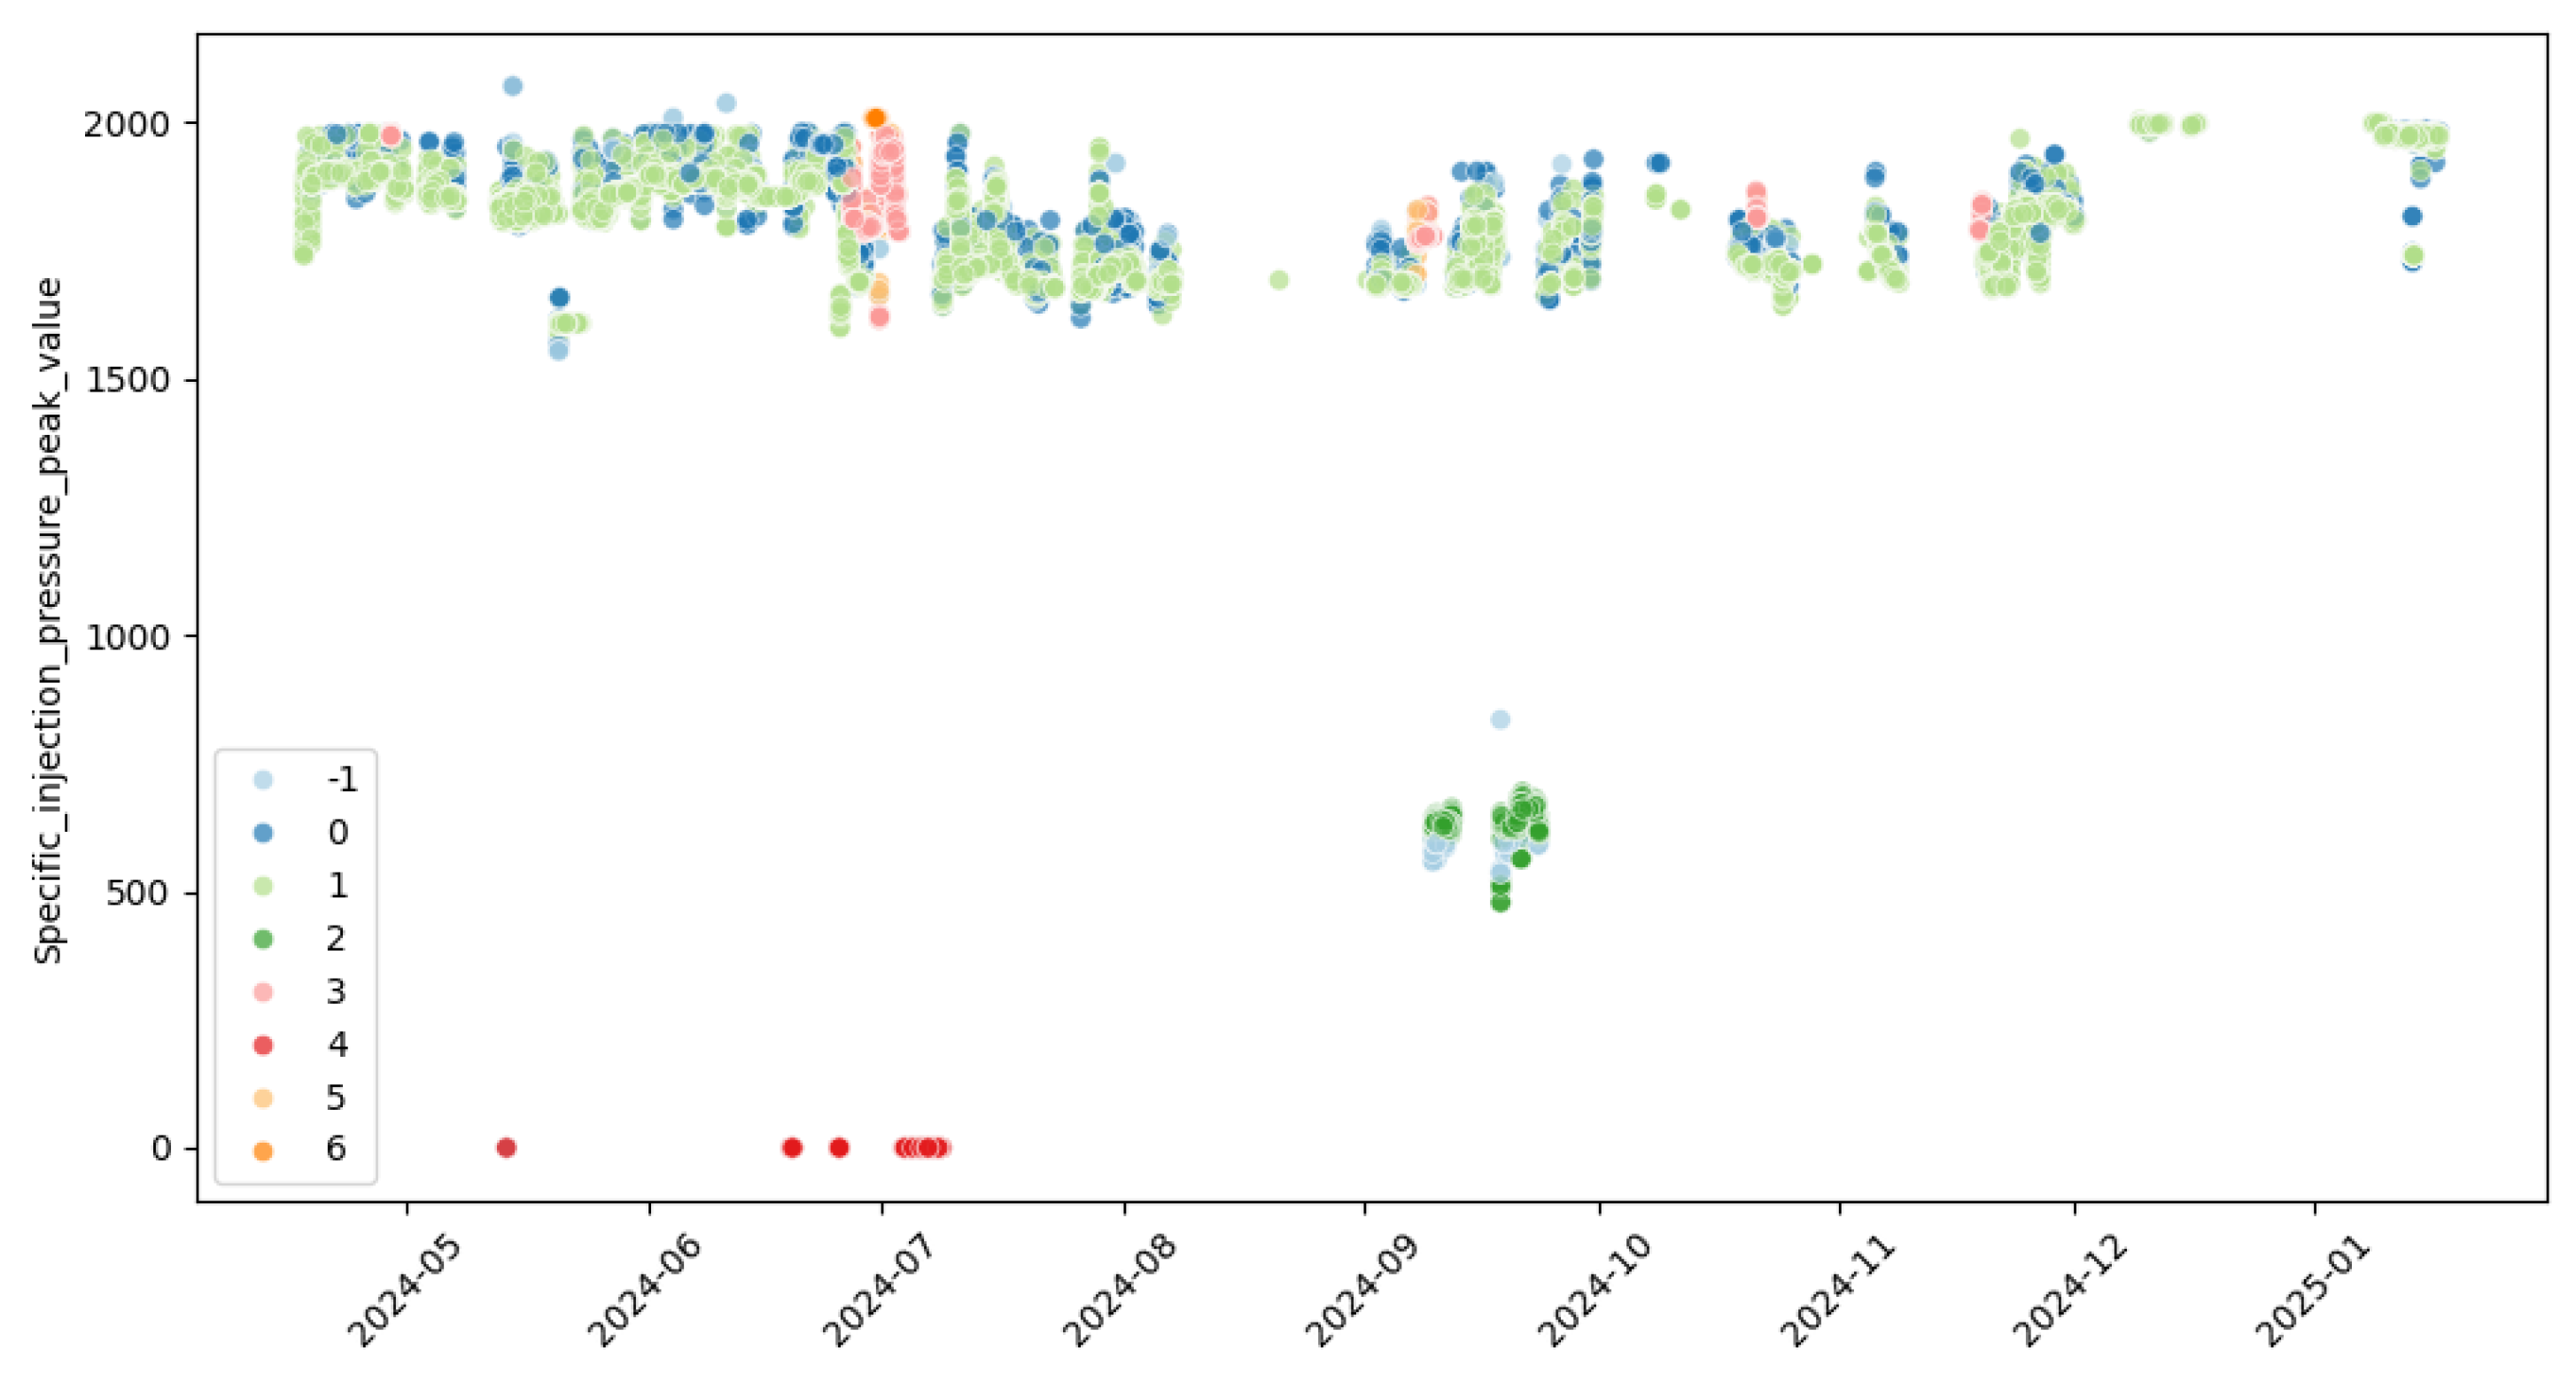
Figure 7 shows the same for variable Injection Pressure. Those clusters were formed using four PCA components, which explain up to 99.5% of the variance in the dataset.
Table 3 shows a description of each cluster. Points assigned label −1 are not included in any cluster, so they are considered noise. The description of the clusters and the respective assignment were discussed together with the provider of the dataset, and validated by the customer.
As the figures and the table show, DBSCAN was able to successfully separate the working states of the machine, with a silhouette score of 0.79. We used the silhouette score as a metric to assess the overall quality of the clustering results, but we focused more on the graphical analysis of the clusters and discussions with the company that provided the data. This collaborative approach helped us to identify the meaning of each cluster and to determine the number of clusters that best represented the machine’s operating states. Points assigned labels −1 (noise), or 6, may require urgent attention because they refer to possible anomalous states. Cluster 5 refers to a state which also requires attention, because the machine is not operating in good condition.
5.2. Detailed Cluster Analysis
Since the machine operates with a four-cavity mold, a specific cluster immediately forms, represented in light green in
Figure 6. If one of the cavities exhibits a defect or malfunction, the machine operates with three cavities. This operating condition forms a separate cluster. Another example is the replacement of the mold with one that has only a single cavity, represented in the graph by the dark green color.
The clusters with the highest potential to represent an anomalous machine state were identified as dark blue and yellow clusters. As shown in
Figure 7, this cluster corresponds to values that fall above and below the ranges considered normal, thus indicating a potential irregularity in the machine’s operation. Additionally, the light blue points, considered outliers, may be classified as anomalous points.
Through detailed analysis of the clusters with the dataset provider, it was possible to identify that one of them is directly related to the machine’s idle state. This cluster, represented in red, corresponds to the moment when the machine is in standby mode. In this state, the machine is not performing any active operations, awaiting its next task or activation. Distinguishing this cluster is essential for understanding machine inactivity periods and effectively monitoring its operational cycles.
Table 4 shows some statistical properties of each cluster. The statistics are shown for the first two components of the Principal Component Analysis (PCA1 and PCA2): min is the minimum, max is the maximum, mean is the average value, and std is the standard deviation within the cluster. For noisy samples, the values are not shown, since noise does not form a cluster. A more detailed description of the clusters is given below.
Points labeled −1: Outliers/Possible Severe Faults. Those points are extremely dispersed. Considered outliers, they potentially represent noise in the data or severe machine failures.
Cluster 0: Reduced or Anomalous Operation. There is lower variability compared with outliers, with PCA1 values from −105.30 to 506.25. This indicates reduced or anomalous machine operation, possibly associated with an alert condition or low operational efficiency.
Cluster 1: Normal Operation with 4-Cavity Mold. Well-concentrated values, with a PCA1 mean of 229.67 and controlled dispersion. Represents normal machine operation with its most common 4-cavity mold, indicating smooth process running.
Cluster 2: Normal Operation with 1-Cavity Mold, PCA1 values concentrated in a negative region (−1880.73 to −1614.95) with low standard deviation. Indicates normal machine operation with a different mold compared with Cluster 1. Useful for classifying different operational modes of the machine.
Cluster 3: Operation with less than 4 Cavities. Moderate variability, PCA1 values from −167.87 to 370.21. Represents an operational state where the machine runs with fewer than four cavities, expected in certain production cycles. This occurs when one of the cavities has a defect and is covered up, keeping the machine working in a normal state, but with only three cavities, reducing the number of products produced.
Cluster 4: Machine Stopped. Extremely concentrated values in PCA1 (−5411.39 to −5409.07) and PCA2 (−2640.39 to −2632.49), with negligible standard deviation. Indicates that the machine is stopped, with no significant operational variations.
Cluster 5: Reduced or Anomalous Operation. Intermediate values, PCA1 ranging from −210.95 to 332.50, with controlled dispersion. Suggests anomalous machine operation, representing low production or a failure state associated with specific conditions.
Cluster 6: Possible Anomaly. Values concentrated in PCA1 (428.60 to 435.49), slightly negative variation in PCA2 (−218.35 to −203.47). Low presence in data, considered irrelevant for overall analysis. May represent a rare anomalous situation.
5.3. Classification Results
Once the clustering process was completed and the clustering-labeled dataset prepared, PyCaret was applied to proceed to automatic classification model selection with the best performance based on predefined metrics. Initially, several models were automatically tested using PyCaret; however, none demonstrated true robustness, with the highest accuracy reaching approximately 69%. Consequently, the XGBoost model was implemented due to its well-known robustness in similar cases. Using tree-learning algorithms, extreme gradient boosting (XGBoost) is one of the most efficient classification models available. However, it is still not available in PyCaret, so it was applied separately.
For XGBoost training and validation, a dataset with about 890,000 records was used, which included only data from seven clusters.
A detailed graphical analysis of the time series shows that there are some instantaneous transitions, which are but noise, for it is not possible for the machine to transition from one state to another and then immediately back to the previous state. Hence, the time series was filtered using a median filter with a window of variable width. This approach replaces each data point with the median value of its neighbors within a window of a given size. A window of size 5, applied specifically to the cluster labels, showed the best performance. The median filter reduces the impact of noise and outliers by smoothing the data, thus enhancing the quality of the training set.
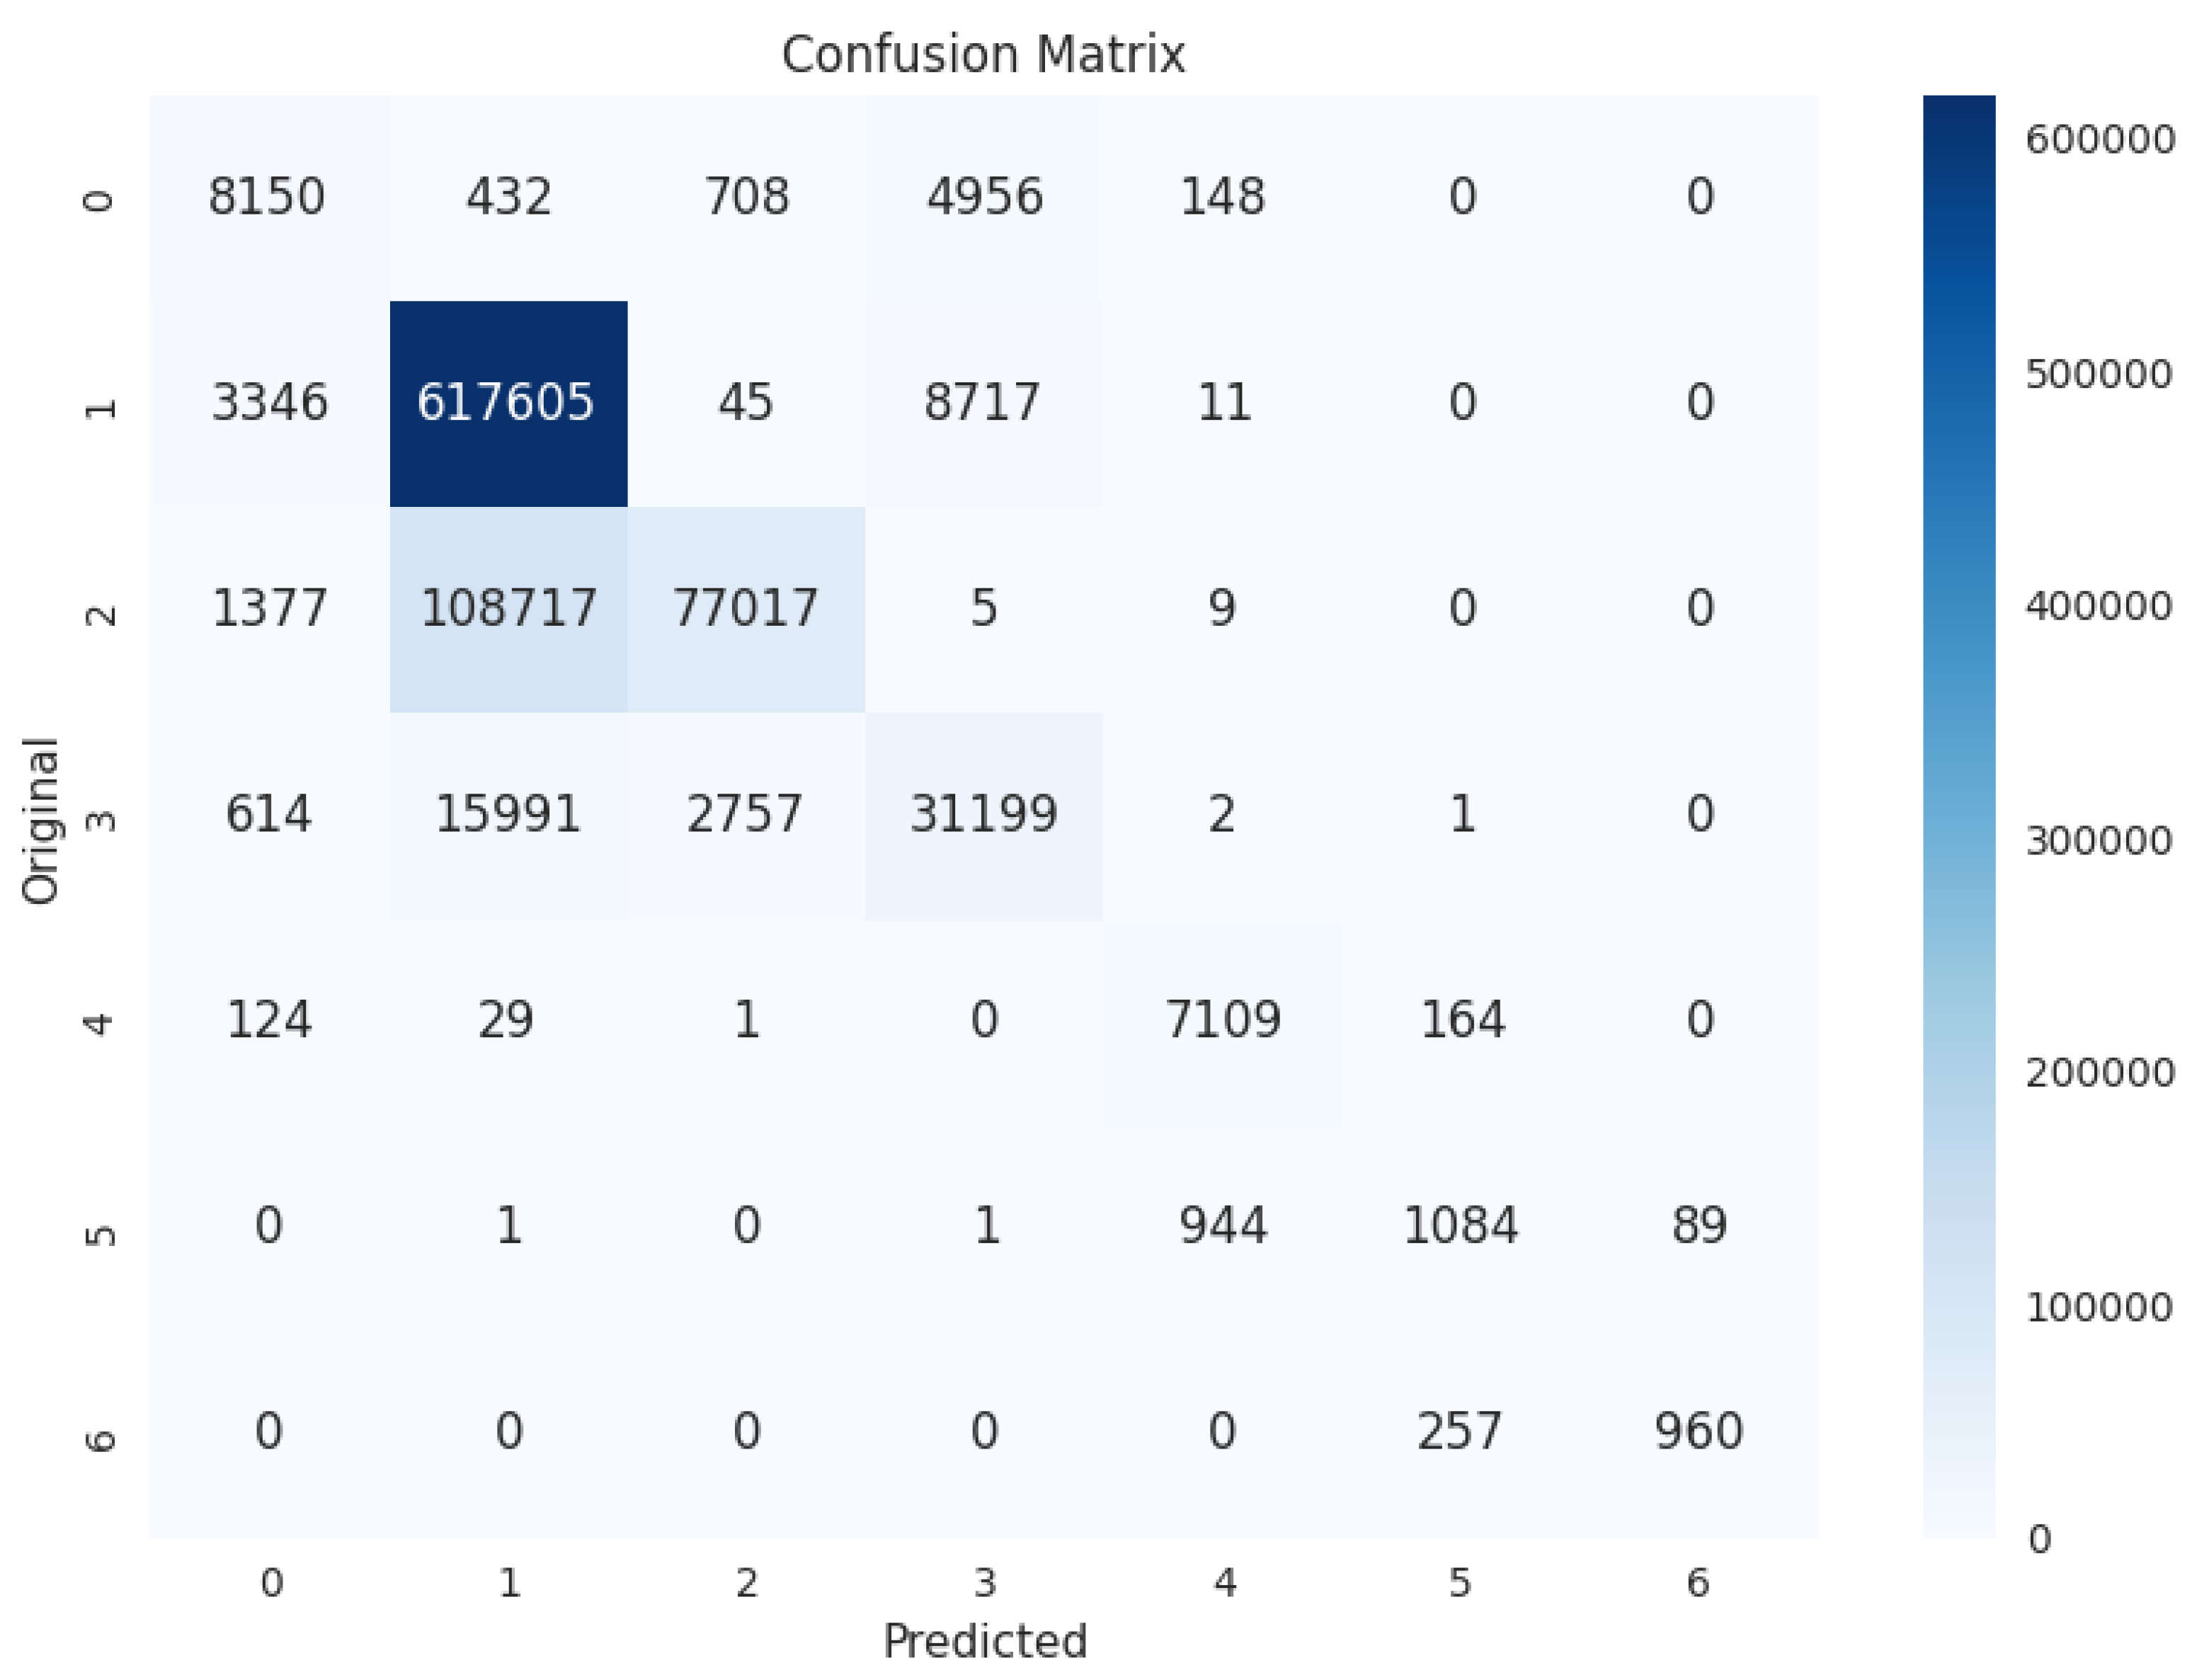
Applying the median technique resulted in an improved accuracy of 83.26%, as can be seen in
Table 5, a value considered acceptable for reliable classification. The confusion matrix shown in
Figure 8 for the evaluated classification model demonstrates strong accuracy for class 1, with 617,605 correct predictions, suggesting that this class is well defined and easily distinguishable. However, notable classification errors are observed: a significant number of instances of class 2 (108,717) are misclassified as class 1, and similarly, many samples of class 3 (15,991) are also predicted as class 1. This pattern indicates that class 1 shares overlapping characteristics with neighboring classes, especially class 2 and class 3, leading to confusion for the model.
It is worth noting that, although class 2 achieves a high precision of 0.956, its recall is significantly lower at 0.412. This indicates that while the model is highly reliable when it predicts class 2, it fails to detect a substantial portion of its actual instances. This can be explained by the fact that class 2 corresponds to a different mold that was used only during a short period of time and differs from class 1 in the number of cavities. As a result, the model had limited exposure to examples of this class, making it more difficult to generalize and detect all occurrences reliably.
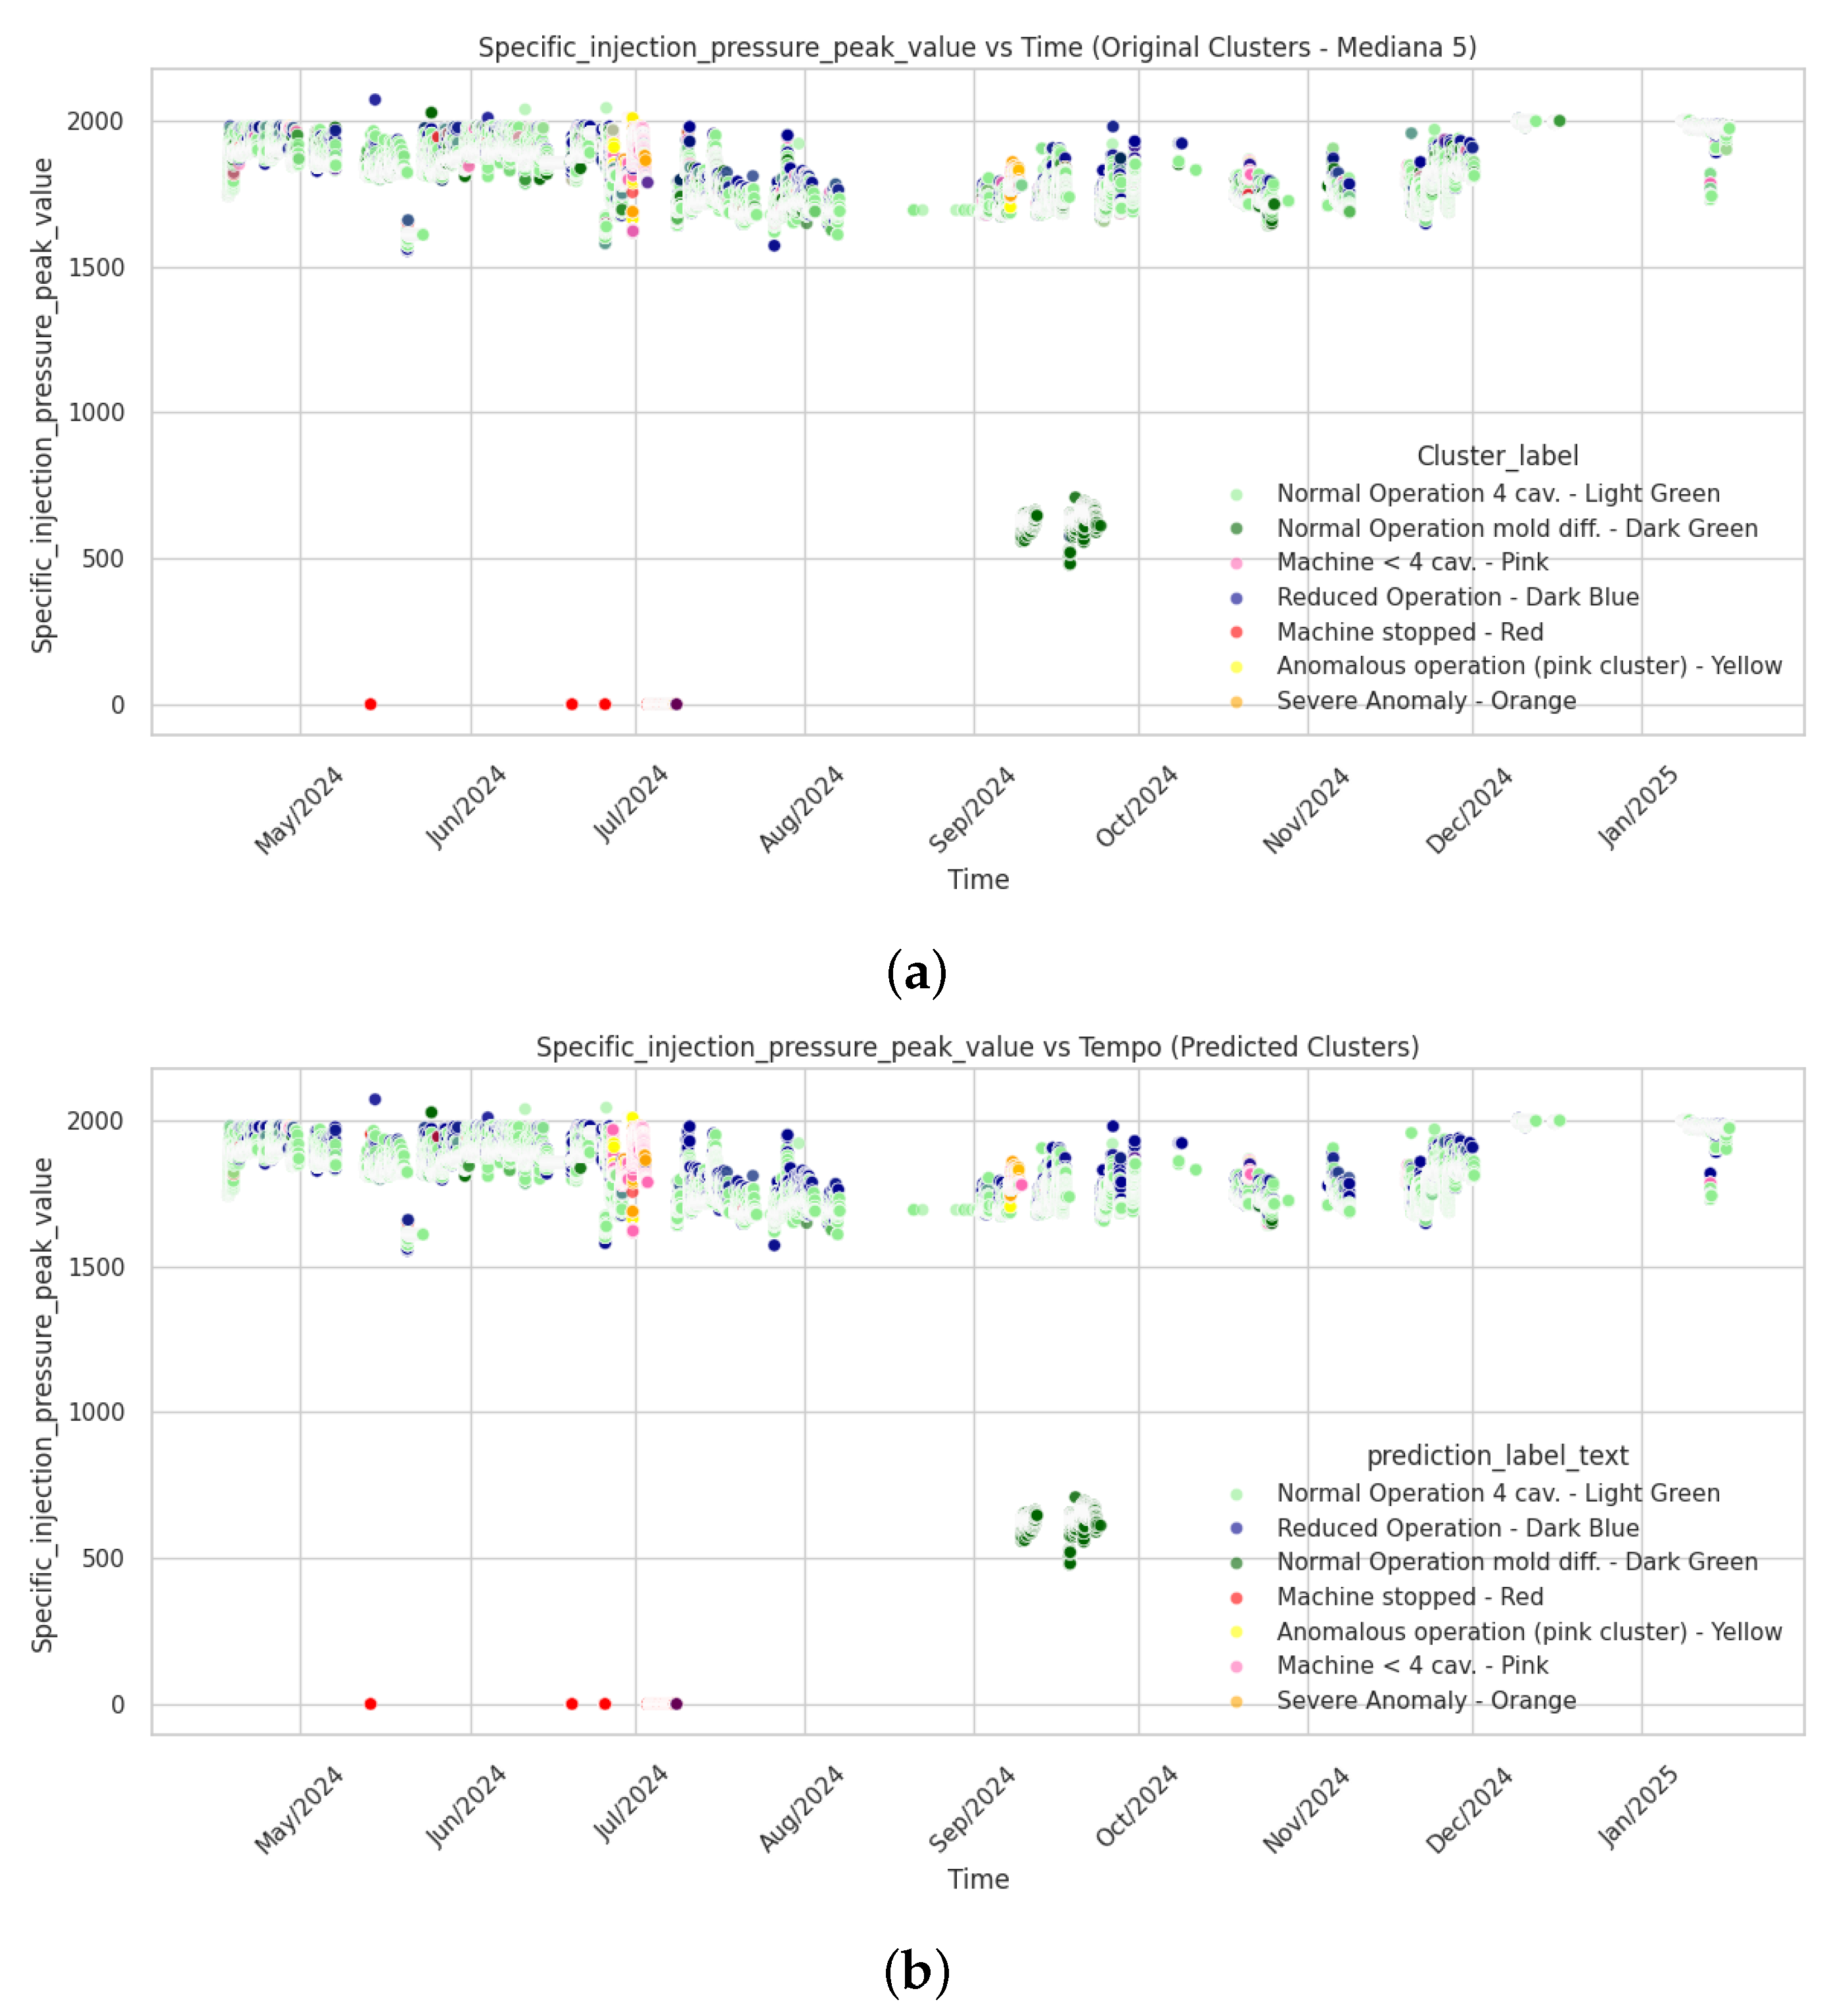
Figure 9a,b presents the time series of the variable Shot_Volume over a given period. Data points are colored according to their respective cluster assignments.
Figure 9a displays the ground-truth cluster labels, while
Figure 9b shows the cluster predictions generated by the classification model. True Labels–Ground Truth Clustering: This figure represents the original clustering of the dataset, based on the true labels. Each color corresponds to a distinct cluster, providing a clear view of the actual data distribution according to the known classification. Predicted Clusters–Classification Model Output: This figure shows the predicted clusters assigned by the classification model. When compared with the ground truth (
Figure 9a), the predicted clusters exhibit a similar overall pattern, suggesting that the model effectively captured the underlying structure of the data; minor discrepancies between the two figures may indicate regions of misclassifications or areas where clusters overlap.
6. Discussion
The results obtained from the DBSCAN clustering model provide valuable insights into the operational states of the plastic injection molding machine. A comparison with state-of-the-art methods, such as Predictive Maintenance by Pierleoni et al. [
13] and Aslantaş et al. [
12], represents an important first step. This is because, with the classification model, it becomes possible to determine when machines require maintenance, detect anomalies, or identify human errors. For example, if a mold is changed but an operator forgets to adjust the settings, this method can detect the inconsistency, triggering an alarm.
One of the main contributions of this study is the identification and differentiation of machine states, which will assist industrial companies operating plastic injection machines to detect anomalies more easily. Unlike conventional analyses that rely on artificially generated data or data not originating from real contexts, this study successfully identified distinct machine states using a real dataset covering several months of operation. This distinction is crucial, as it increases the likelihood that the clustering step will be more accurate and effective in real-world applications. Utilizing Principal Component Analysis to reduce data dimensionality and integrating the Silhouette Score metric to assess clustering quality, our methodology ensures robust segmentation of machine states, thereby supporting improved monitoring and predictive maintenance strategies.
A key insight from our findings is the effective detection of anomalous states. The identification of outliers (label -1), or anomalous operation clusters (labels 0, 5, and 6), as potential severe malfunctions aligns with industry concerns regarding common failures in plastic injection molding machines [
3], including injection device obstruction, mold cooling inefficiencies, and pressure or temperature variations. By clustering machine states based on real operational data, our method offers a data-driven approach to early and straightforward fault detection, complementing conventional preventive maintenance.
Segmenting machine states into seven distinct clusters provides a more granular understanding of operational behaviors. For instance, differentiating between normal operation with a four-cavity mold (light green cluster) and operation with the same mold but fewer active cavities (pink clusters) enables more precise monitoring of mold performance. Similarly, identifying idle states (red cluster) allows better assessment of machine downtime and potential maintenance periods.
In the study, different DBSCAN parameters were tested, and adjustments in PCA variance retention significantly improved clustering runtime and efficiency. Similar to Zhang and Alexander et al. [
9], Principal Component Analysis was instrumental in retaining the most relevant features, enhancing clustering performance. The achieved Silhouette Score of approximately 80% indicates high-quality clustering performance, validating our model’s effectiveness. Furthermore, the approval by the dataset supplier adds credibility and supports the real-world applicability of the results.
Regarding model generalization, the proposed approach can be extended to other plastic injection molding machines, provided that they operate with the same relevant variables and use identical or similar molds. This ensures that the learned clusters remain meaningful across different machines. In the current project, to promote robustness and reliable evaluation, the dataset was split using PyCaret, which performs stratified and randomized division, ensuring that each class is proportionally represented in both training and testing sets. This stratification functions similarly to cross-validation, mitigating bias and improving the model’s generalization capability. While transfer learning or even trained model transfer may be possible, further training for each specific machine will probably be required.
From a deployment perspective, the model is ready for integration within the factory environment. The machines continuously record their process variables in a centralized database, and a Python program has been developed to fetch these data in real-time, applying the trained classifier to instantly categorize machine states. This enables timely alerts and operational decisions, thus supporting predictive maintenance in an automated manner.
However, since new molds or variables with different value ranges may be introduced over time, the model requires periodic retraining and fine-tuning with fresh data to maintain accuracy and adaptability. This continual learning process is essential to preserve the robustness and reliability of the predictive system as operational conditions evolve.
Another challenge is the early-stage nature of the data collection process, where inconsistencies and variable relevance shifts may occur. Therefore, the ongoing evaluation of variable importance and data quality is necessary to ensure the model remains aligned with industrial needs.
In addition to the results discussed, recent developments in machine learning and structural health monitoring (SHM) offer promising directions for enhancing the methodology proposed in this study. Khatir et al. [
15] demonstrated that integrating artificial neural networks (ANNs) with analytical models can significantly improve prediction accuracy while reducing computational cost. Although their work focuses on deflection prediction in tapered steel beams, a similar hybrid approach could be adapted to plastic injection molding machines. For example, combining data-driven learning (such as XGBoost or ANN) with domain-specific process models (e.g., injection pressure curves, mold flow dynamics) could improve both the interpretability and generalization of the fault classification system.
Khatir et al. [
16] further showed that using frequency response functions (FRFs) and optimizing ANN training with bio-inspired algorithms like the Reptile Search Algorithm (RSA) can enhance damage detection accuracy and convergence speed. While our current study uses only process parameters (e.g., pressure, cycle time, volume), incorporating vibration or acoustic signals into the dataset processed via RSA-optimized neural networks could increase sensitivity to mechanical faults such as wear in moving parts, misalignment, or structural fatigue. This would expand the detection capabilities beyond what is possible with process data alone.
Similarly, the hybrid PSO-YUKI approach proposed by Khatir et al. [
17] for detecting double cracks in CFRP beams suggests potential advantages of using metaheuristic optimization to tune machine learning models in complex industrial systems. In our context, such optimization could be applied not only to improve the classification stage, but also to automatically tune DBSCAN parameters (eps and min_samples), a critical step currently conducted empirically. This could lead to more robust and reproducible clustering results across different machines or molds, particularly when deploying the method at scale in varied industrial settings.
These insights support the view that future versions of our predictive maintenance system could evolve toward a hybrid, multimodal approach, incorporating not only sensor data and machine learning but also signal processing, vibration analysis, and automated optimization. Such integration would align our system more closely with the broader goals of Industry 4.0 and intelligent manufacturing.
This research advances understanding of plastic injection molding machine behavior by introducing a clustering-based approach for state identification and classification to facilitate anomaly detection. Future work may involve retraining the classification model with new data and variables, integrating additional sensor inputs, and refining clustering techniques to further enhance predictive capabilities and operational efficiency.
In summary, the main objectives outlined in the introduction were fully achieved. The behavior of the plastic injection molding machine was thoroughly analyzed using both literature review and real-world dataset examination. Through the application of unsupervised clustering techniques, specifically DBSCAN combined with PCA, distinct machine operational states were successfully identified and characterized. Furthermore, these clusters served as a foundation for training a classification model capable of detecting anomalies and potential human errors in an industrial setting. The alignment of the results with real operational scenarios confirms the practical value of the proposed methodology and its potential for implementation in predictive maintenance systems.
7. Conclusions
This study presents a novel data-driven approach for identifying and monitoring operational states and anomalies in plastic injection molding machines using the DBSCAN clustering algorithm coupled with supervised classification. The methodology successfully uncovered seven distinct machine states, enabling a more granular understanding and timely detection of abnormal conditions that could lead to faults or inefficiencies.
The significance of this work lies in its practical applicability within industrial environments. By leveraging real operational data rather than simulated or synthetic datasets, the approach offers a robust foundation for predictive maintenance strategies that can reduce downtime, optimize production quality, and prevent costly failures. The implementation of a real-time data pipeline and classification system further demonstrates the feasibility of deploying such models in live factory settings, marking an important step towards intelligent, Industry 4.0-enabled manufacturing.
Nevertheless, certain limitations warrant consideration. The clustering and classification performance heavily depend on the quality, completeness, and representativeness of the data. Variations in machine configurations, mold types, and external environmental conditions could challenge the model’s generalization capabilities. Moreover, the model’s reliance on fixed variable sets and periodic retraining highlights the need for adaptive algorithms capable of accommodating evolving operational contexts without significant manual intervention.
Future research directions should focus on addressing these limitations by integrating multimodal sensor data (such as vibration and acoustic signals), developing automated hyperparameter tuning methods for clustering algorithms, and exploring hybrid models that combine data-driven learning with physical process knowledge. Additionally, extending this framework to a broader range of industrial machines and operational scenarios will be critical for validating its scalability and effectiveness in diverse manufacturing ecosystems.
In conclusion, this study contributes a valuable methodology for advancing predictive maintenance in plastic injection molding processes, with promising potential for enhancing manufacturing reliability, reducing operational costs, and supporting the transition toward smarter, data-centered industrial systems.
