Article

The Specialist’s Paradox: Generalist AI May Better Organize Medical Knowledge

1
Histology and Embryology Laboratory, Department of Medicine and Surgery, University of Parma, Via Volturno 39, 43126 Parma, Italy
2
Department of Medicine and Surgery, Dental School, University of Parma, 43126 Parma, Italy
3
Centre for Oral Clinical Research, Institute of Dentistry, Faculty of Medicine and Dentistry, Queen Mary University of London, London E1 2AD, UK
*
Author to whom correspondence should be addressed.
Algorithms 2025, 18(7), 451; https://doi.org/10.3390/a18070451
Submission received: 27 June 2025 / Revised: 15 July 2025 / Accepted: 16 July 2025 / Published: 21 July 2025
(This article belongs to the Special Issue Evolution of Algorithms in the Era of Generative AI)

Abstract

This study investigates the ability of six pre-trained sentence transformers to organize medical knowledge by performing unsupervised clustering on 70 high-level Medical Subject Headings (MeSH) terms across seven medical specialties. We evaluated models from different pre-training paradigms: general-purpose, domain-adapted, and from-scratch domain-specific. The results reveal a clear performance hierarchy. A top tier of models, including the general-purpose MPNet and the domain-adapted BioBERT and RoBERTa, produced highly coherent, specialty-aligned clusters (Adjusted Rand Index > 0.80). Conversely, models pre-trained from scratch on specialized corpora, such as PubMedBERT and BioClinicalBERT, performed poorly (Adjusted Rand Index < 0.51), with BioClinicalBERT yielding a disorganized clustering. These findings challenge the assumption that domain-specific pre-training guarantees superior performance for all semantic tasks. We conclude that model architecture, alignment between the pre-training objective and the downstream task, and the nature of the training data are more critical determinants of success for creating semantically coherent embedding spaces for medical concepts.

1. Introduction

Biomedicine is characterized by an unprecedented information volume [1]. The relentless expansion of scientific literature, coupled with the proliferation of electronic health records, has created a repository of knowledge so vast that it exceeds the capacity of human cognition to effectively synthesize [2]. This data deluge presents both a challenge and an opportunity. Hidden patterns in the text can advance clinical care, enabling pharmacovigilance and accelerating hypothesis generation [3]. However, accessing this knowledge is hindered by the limitations of traditional information retrieval methods [4]. Keyword-based searches, while useful, often fail to capture the deep semantic relationships that underpin medical language, which is rich with specialized vocabulary, complex synonymy, and nuanced conceptual hierarchies [5]. Unlocking these data requires tools that move beyond lexical matching to real semantic understanding [6].
The field of natural language processing (NLP) has made significant strides in addressing this challenge, evolving from frequency-based techniques like term frequency–inverse document frequency [7] to sophisticated deep learning models that generate dense vector representations, or embeddings [8]. Early breakthroughs with models such as Word2Vec [9] and GloVe [10] enabled the capture of word-level semantics, but these non-contextual models were limited in their ability to represent the meaning of entire sentences or documents [11]. The introduction of the transformer architecture [12], most notably with the bidirectional encoder representations from transformers (BERT) model [13], marked a paradigm shift by creating deeply contextualized word embeddings that account for the surrounding text [14].
Building on this, sentence-transformer variants (e.g., SBERT) trained with contrastive objectives produce fixed-size vectors whose cosine distance reflects semantic relatedness, enabling fast similarity search and clustering [15]. These models employ specialized architectures, such as Siamese or triplet networks, which process two or three sentences independently through a shared transformer network [16]. They are fine-tuned on massive datasets of sentence pairs (often numbering over a billion) [17]. These models embed any span of text—single words, multi-word terms, or full sentences—into the same semantic space [18].
The unique characteristics of biomedical language [19]—its specialized vocabulary and distinct syntactic structures—led to the recognition that models pre-trained on general-domain text might be inadequate for medical NLP tasks [20]. In response, two dominant strategies for creating domain-specific language models emerged. The first is domain-adaptive fine-tuning [21], exemplified by models like BioBERT [22]. This approach initializes a model with parameters from a pre-trained general-domain model (like BERT) and continues the pre-training process on large biomedical corpora, such as PubMed abstracts and PubMed Central (PMC) full-text articles. The underlying rationale is to leverage the robust general linguistic knowledge learned from a massive general corpus and adapt it to the nuances of the specialized domain. The second strategy is from-scratch training [23]. Models like PubMedBERT epitomize this approach, as they are trained entirely from scratch using only in-domain data [24]. This involves building a new vocabulary directly from the biomedical corpus (e.g., PubMed abstracts) and training all model parameters exclusively on this data. The argument for this paradigm is that it avoids any potential “contamination” from irrelevant out-of-domain text and optimizes the model’s vocabulary and representations solely for the target domain, treating its terminology as “first-class citizens”. These competing philosophies—adapting general knowledge versus building specialized knowledge from the ground up—represent a fundamental question in the development of language models for specialized fields [25]. Although this debate usually foregrounds the source of the training corpus, considerably less attention has been paid to the training objective itself—whether the model is optimized for masked-language reconstruction or for contrastive, sentence-pair similarity—and our results show that this choice can be decisive when the downstream task is unsupervised semantic clustering [26].
While domain-specific models like BioBERT and PubMedBERT have demonstrated state-of-the-art performance on a variety of supervised biomedical NLP tasks such as named entity recognition (NER), relation extraction, and question answering, their intrinsic ability to generate high-quality, semantically structured embedding spaces for unsupervised tasks remains less explored [27]. An effective semantic space should organize concepts based on their underlying relationships, a property that is not directly optimized by the standard masked-language model (MLM) pre-training objective [28]. Furthermore, the NLP landscape also includes powerful general-purpose sentence encoders, such as all-mpnet-base-v2, which has been trained on over a billion diverse sentence pairs and achieves top performance on general semantic-similarity benchmarks [29]. It is an open question how the robust but general semantic knowledge of these models compares to that of specialized biomedical models when applied to medical concepts.
This study aims to fill this critical knowledge gap by systematically evaluating the ability of a diverse set of six sentence transformers to organize high-level medical concepts. We employ an unsupervised clustering task using a controlled vocabulary of Medical Subject Headings (MeSH) terms from seven distinct medical specialties [30]. By assessing how well each model can intrinsically recover the established semantic structure of medicine without supervision, we provide crucial empirical evidence on the effectiveness of different pre-training paradigms. This investigation offers relevant insights into the optimal strategies for building and selecting models for semantic representation in the increasingly complex biomedical domain.

2. Materials and Methods

2.1. Data and Specialties

We created a focused reference set of 70 Medical Subject Headings (MeSH) terms to serve as a clean test bed for the embedding models. Drawing directly from the National Library of Medicine’s controlled hierarchy, we first identified seven broad clinical domains—Cardiology, Dentistry, Neurology, Endocrinology, Dermatology, Oncology, and Gastroenterology—and then selected 10 high-level descriptors that the authors agreed are emblematic of each field (Table 1). Because MeSH is a curated thesaurus, every term is uniquely defined and mapped to a single concept node [30]. We decided to include both terms that unequivocally belonged to a unique field (e.g., Dental Caries), and more ambiguous terms, which could belong to more than one field, such as Melanoma. Embedding these concise, standardized phrases—rather than free-text article titles—allows us to test whether sentence transformers can recover specialty-specific semantics from minimal, noise-free input and provides an interpretable benchmark for comparing general-purpose and biomedical encoders.

2.2. Embedding Models

We employed 6 off-the-shelf sentence transformers to encode each MeSH term into embeddings without any additional fine-tuning (Table 2). Three general-purpose encoders—all-mpnet-base-v2 (MPNet) [31], RoBERTa (a robustly optimized general-purpose model often used as a strong baseline) [32], and all-MiniLM-L6-v2 (MiniLM) [33]—were selected to provide robust representations optimized for semantic similarity. MPNet and RoBERTa generated 768-dimensional vectors, while MiniLM’s embeddings are 384-dimensional. The other three encoders target the biomedical domain and illustrate different adaptation strategies: pritamdeka/BioBERT-mnli-snli-scinli-scitail-mednli-stsb (“BioBERT”) starts from BioBERT’s PubMed-pretrained weights and is further fine-tuned in the sentence-transformer framework on 6 natural-language-inference and semantic-similarity corpora (SNLI, MNLI, SciNLI, SciTail, MedNLI, and STS-B), producing 768-dimensional embeddings optimized for biomedical entailment and relatedness [22,24].
pritamdeka/S-PubMedBert-MS-MARCO (“PubMedBERT”) is built on the from-scratch PubMedBERT backbone and then fine-tuned for passage retrieval with the MS-MARCO question–answer collection, giving it strong document-level semantics tailored to biomedical prose, and emilyalsentzer/Bio_ClinicalBERT (“BioClin”) begins with BioBERT, replaces the vocabulary with clinical subwords where needed, and continues masked-language modeling on the full set of MIMIC-III hospital notes [34], thereby injecting abbreviations and discharge-summary phrasing common in electronic health records [35]. This configuration allowed us to directly compare how general versus domain-specific transformers capture the nuanced semantics of standardized medical vocabulary.

2.3. Embedding and Clustering Procedure

Each of the 70 MeSH descriptor terms was first encoded into a 384- or 768-dimensional vector by each pre-trained sentence transformer. We projected the embeddings to two dimensions with UMAP (n_neighbors = 10, min_dist = 0.1), preserving local and global structure for visualization. For each model, the resulting 2D coordinates were clustered via K-Means with k = 7 (one cluster per specialty). We used Euclidean distance and kept the run with the lowest within-cluster sum of squares. We selected UMAP because it preserves both local and global structure in high-dimensional data, making it suitable for visualization and clustering [36]. K-Means was chosen as a robust, widely understood partitioning algorithm suitable for our hypothesis of k = 7 distinct specialty clusters. While other clustering methods exist (e.g., density-based approaches like HDBSCAN [37]), this straightforward pipeline provides a standardized and interpretable basis for comparing the semantic spaces generated by each model [9]. This uniform pipeline—MeSH term encoding, UMAP projection, and K-Means partitioning—provided a consistent basis for comparing how general versus domain-specific transformers capture medical semantics.

2.4. Evaluation Metrics

Clustering performance was evaluated using both internal and external validation metrics. For internal evaluation, we calculated the Silhouette coefficient (ranging from −1 to 1) for each model’s clustering, which measures how well-separated the clusters are by comparing the average distance of each point to points in its own cluster versus points in other clusters [38].
Given an observation i, let a(i) be the mean distance from i to all other points in its own cluster and b(i) the minimum mean distance to points in any other cluster. The per-point Silhouette is
s ( i ) = b ( i ) a ( i ) m a x { a ( i ) ,   b ( i ) } ,
A higher Silhouette value indicates more distinct, well-separated clusters.
We also computed the Davies–Bouldin Index (DBI), which is an internal metric where lower values signify better clustering (it captures the average similarity between each cluster and its most similar cluster) [39]. For each cluster C_k with centroid c_k and mean intra-cluster scatter S_k, we compute the similarity R k j = ( S k + S j ) / c k c j to every other cluster and take
D B I = 1 K k = 1 K m a x j k R k j ,
so, a lower DBI signals tighter, more distinct groupings.
For external evaluation, we leveraged the fact that each title’s true specialty label is known. We computed the Adjusted Rand Index (ARI) and Normalized Mutual Information (NMI) between the K-Means cluster assignments and the actual specialty [40,41]. ARI measures the agreement between the clustering and the ground truth labels, adjusted for chance alignment, with 0 indicating random agreement and 1 indicating perfect recovery of the true classes.
A R I = Index Expected Max Expected [ 1,1 ] .
NMI measures the amount of mutual information shared between the cluster labels C and the true labels S, normalized to range from 0 (no mutual information) to 1 (perfect correlation):
N M I ( C , S ) = 2   I ( C ; S ) H ( C ) + H ( S ) ,
These external metrics provide insight into how well the unsupervised clusters align with the expected specialty groupings.
To complement these standard indices, we computed cluster purity—the proportion of terms in each cluster that match that cluster’s majority specialty—and its complement, the overall error rate. Purity is calculated as
Purity = 1 N k = 1 K m a x s C k S s ,
Purity provides an intuitive, one-number summary of how “clean” the partition is with respect to the ground-truth labels and is easily interpreted beside ARI and NMI. Because purity ignores minority labels within each cluster, we additionally logged the exact terms that disagreed with the majority vote; this term-level record forms the basis for the qualitative diagnostics described below.

2.5. Qualitative Analysis

Beyond numerical scores, we qualitatively analyzed both the geometry and label consistency of the learned embedding spaces. We generated scatter plots of the UMAP-reduced embeddings for each model, coloring each point by its specialty label to visually assess cluster formation.
We also analyzed the composition of each K-Means cluster by examining the distribution of specialty labels within it. Misclassification analysis was conducted by identifying titles that were clustered with a different specialty group than their true label and inspecting these cases to understand the source of confusion. For example, we noted if a cluster nominally representing one specialty (say, Oncology) contained several titles from another specialty (like Dermatology), suggesting a thematic overlap or limitations in the embedding model’s differentiation.
For every model we generated a “misclassification ledger” by mapping each K-Means cluster to its majority specialty and flagging any term whose true label diverged from that majority.

2.6. Robustness-of-Clustering Analysis

To probe the algorithm-dependence of the observed specialty structure, we re-clustered the identical 2-D UMAP projections with four heuristics—baseline K-Means (k = 7, random_state = 0), Ward-link agglomerative (k = 7, Euclidean distance), average-link agglomerative (k = 7, cosine distance), and the density-adaptive HDBSCAN (min_cluster_size = 5, cluster_selection_method = “eom”, Euclidean metric). For every (encoder, algorithm) combination we calculated four coherence indices—Silhouette, Davies–Bouldin, ARI, and NMI—using scikit-learn 1.5 and hdbscan 0.9. HDBSCAN runs that produced fewer than two non-noise clusters were discarded to avoid undefined metrics. All scores were written to a pandas dataframe and subsequently summarized by Pearson correlations and Δ-metrics to quantify agreement across algorithms.

3. Results

3.1. Clustering Performance Overview

The ability of the sentence transformers to organize MeSH terms into semantically coherent groups corresponding to the seven medical specialties considered varied markedly across the evaluated models. Our analysis, which integrated qualitative visualization, cluster composition analysis, and quantitative metrics, revealed a distinct performance hierarchy. A top tier of models, including the domain-specific BioBERT and the general-purpose MPNet and RoBERTa, proved highly effective, generating robust and accurate clusters that aligned closely with the ground-truth specialties. In stark contrast, other models, most notably PubMedBERT and BioClinicalBERT, failed to produce meaningful groupings, resulting in disorganized clusters with little correspondence to the actual medical domains. Occupying a middle ground, a light-weight model like MiniLM demonstrated partial success, effectively separating some specialties while conflating others. The subsequent sections provide a detailed examination of these outcomes, beginning with a qualitative assessment of the embedding spaces.

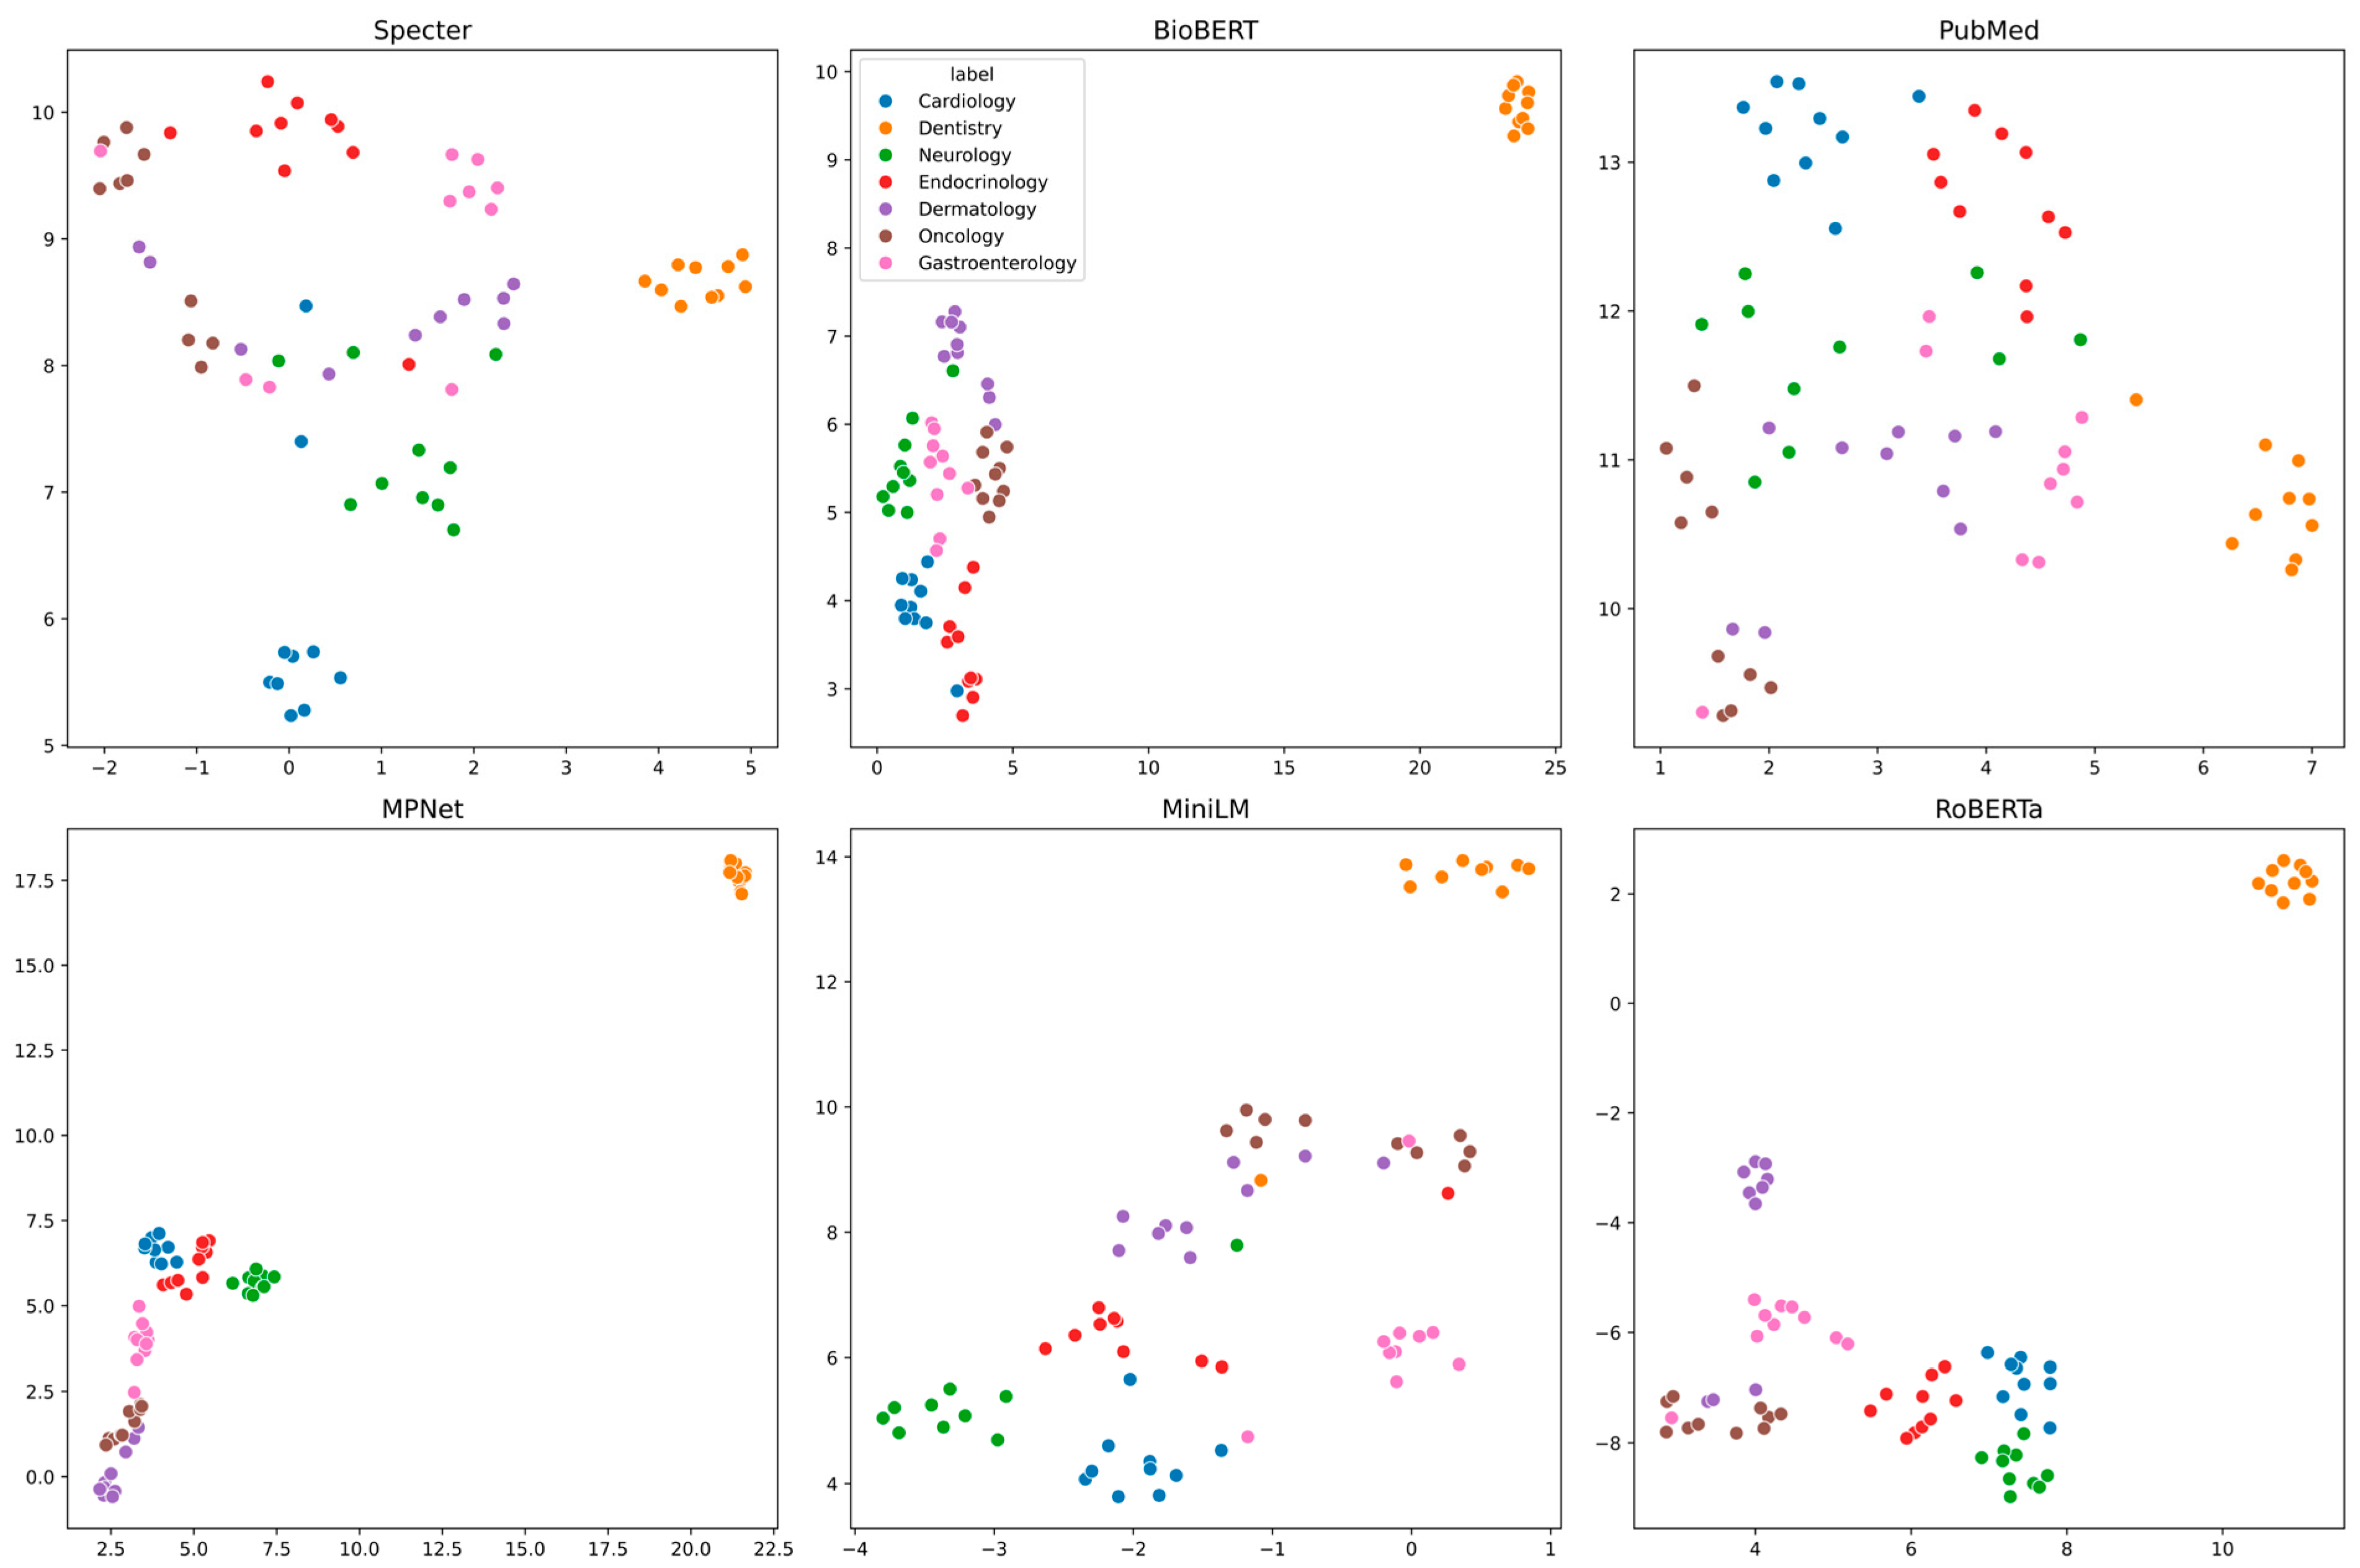
3.2. Visualization of Embedding Spaces

Qualitative evaluation of the UMAP-projected embeddings revealed marked differences in how effectively the various transformer models segregated the MeSH terms by medical specialty. Visual inspection demonstrated that a subset of models, including BioBERT, MPNet, and RoBERTa, produced robust semantic separation (Figure 1). In the UMAP plots for these models, the 70 terms resolved into seven tight, well-delineated clusters that aligned almost perfectly with their true specialty labels. Noticeably, for these models, terms from Dentistry consistently formed a highly isolated and compact cluster, indicating a distinct semantic signature, as it would be reasonably expected. The remaining specialties also resolved into clear, mostly non-overlapping groups, underscoring the effectiveness of these architectures in modeling domain-specific vocabulary.
In contrast, other models exhibited significantly poorer performance. The general-purpose MiniLM model, for example, achieved only partial separation; while it successfully separated terms from specialties like Neurology and Gastroenterology, it failed to clearly resolve the others. The embeddings for Cardiology, Endocrinology, Dermatology, and Oncology were quite intermingled, suggesting that this smaller model struggled to capture the finer semantic distinctions between these clinical areas. Performance degraded further with the PubMedBERT model, which produced a more scantly structured embedding space with substantial overlap among all specialties, making it difficult to visually distinguish most of the groups. The most pronounced failure was observed in the BioClinicalBERT model, which produced little to no discernible clustering (Figure 1). Its UMAP projection revealed a point scattering where terms from all seven specialties were quite intermixed, indicating that its embeddings did not capture the underlying categorical structure of the data.

3.3. Quantitative Clustering Performance

As detailed in the Materials and Methods section, the clustering performance of the pre-trained models was assessed using internal metrics, which evaluate cluster geometry (Silhouette coefficient and Davies–Bouldin Index, DBI), and external metrics, which measure agreement with ground-truth specialty labels (Adjusted Rand Index, ARI, and Normalized Mutual Information, NMI).
Consistently with our qualitative evaluation of the scatter plots, these results identified RoBERTa, MPNet, and BioBERT as the top-performing models. RoBERTa and MPNet emerged as the clear leaders, jointly achieving the highest external validation scores with identical ARI (0.835) and NMI (0.902) values (Table 3). RoBERTa distinguished itself with the best internal cluster geometry, posting the highest Silhouette coefficient (0.396) and the best (lowest) DBI score (0.451). BioBERT also demonstrated strong performance with an ARI of 0.806 and NMI of 0.879, ranking it firmly in the top tier.
A second tier of lower-performing models included MiniLM and PubMed. Their external validation scores were substantially lower, with ARI values of 0.512 and 0.506, respectively, indicating a much weaker correspondence with the ground-truth specialties. At the bottom of the rankings, BioClin was the definitive lowest performer across all external metrics, returning an ARI of only 0.350 and an NMI of 0.534. Notably, while its external scores were poor, its internal Silhouette score (0.152) was higher than that of both MiniLM (0.071) and PubMed (0.104). This discrepancy again underscores that a model can form geometrically plausible clusters that do not align with the correct semantic labels, highlighting the importance of external validation when the ground truth is known.

3.4. Architectural Capacity and Semantic Coherence

To examine whether the sheer size of a transformer encoder—its depth or total parameter count—translates into a measurably “cleaner” semantic space, we performed a post hoc capacity-versus-coherence analysis on our seven benchmark models. For each encoder, we retrieved (i) the number of hidden layers and (ii) the base-10 logarithm of the total trainable parameters, then correlated these surrogates of architectural complexity with all four clustering metrics. Neither surrogate exhibited a statistically credible linear relationship with coherence. Layer depth explained only a small fraction of the variance in Adjusted Rand (r = 0.26, p = 0.58) and NMI (r = 0.26, p = 0.57); its associations with Silhouette (r = −0.30, p = 0.51) and Davies–Bouldin (r = −0.23, p = 0.63) were likewise weak. Parameter count fared even worse (e.g., ARI r = 0.09, p = 0.84). Collectively, these results suggest that once a baseline capacity of roughly 100 M parameters/12 layers is met, further scaling alone neither guarantees nor impedes improved clustering; instead, domain-aligned pre-training objectives and task-specific fine-tuning dominate performance gains.

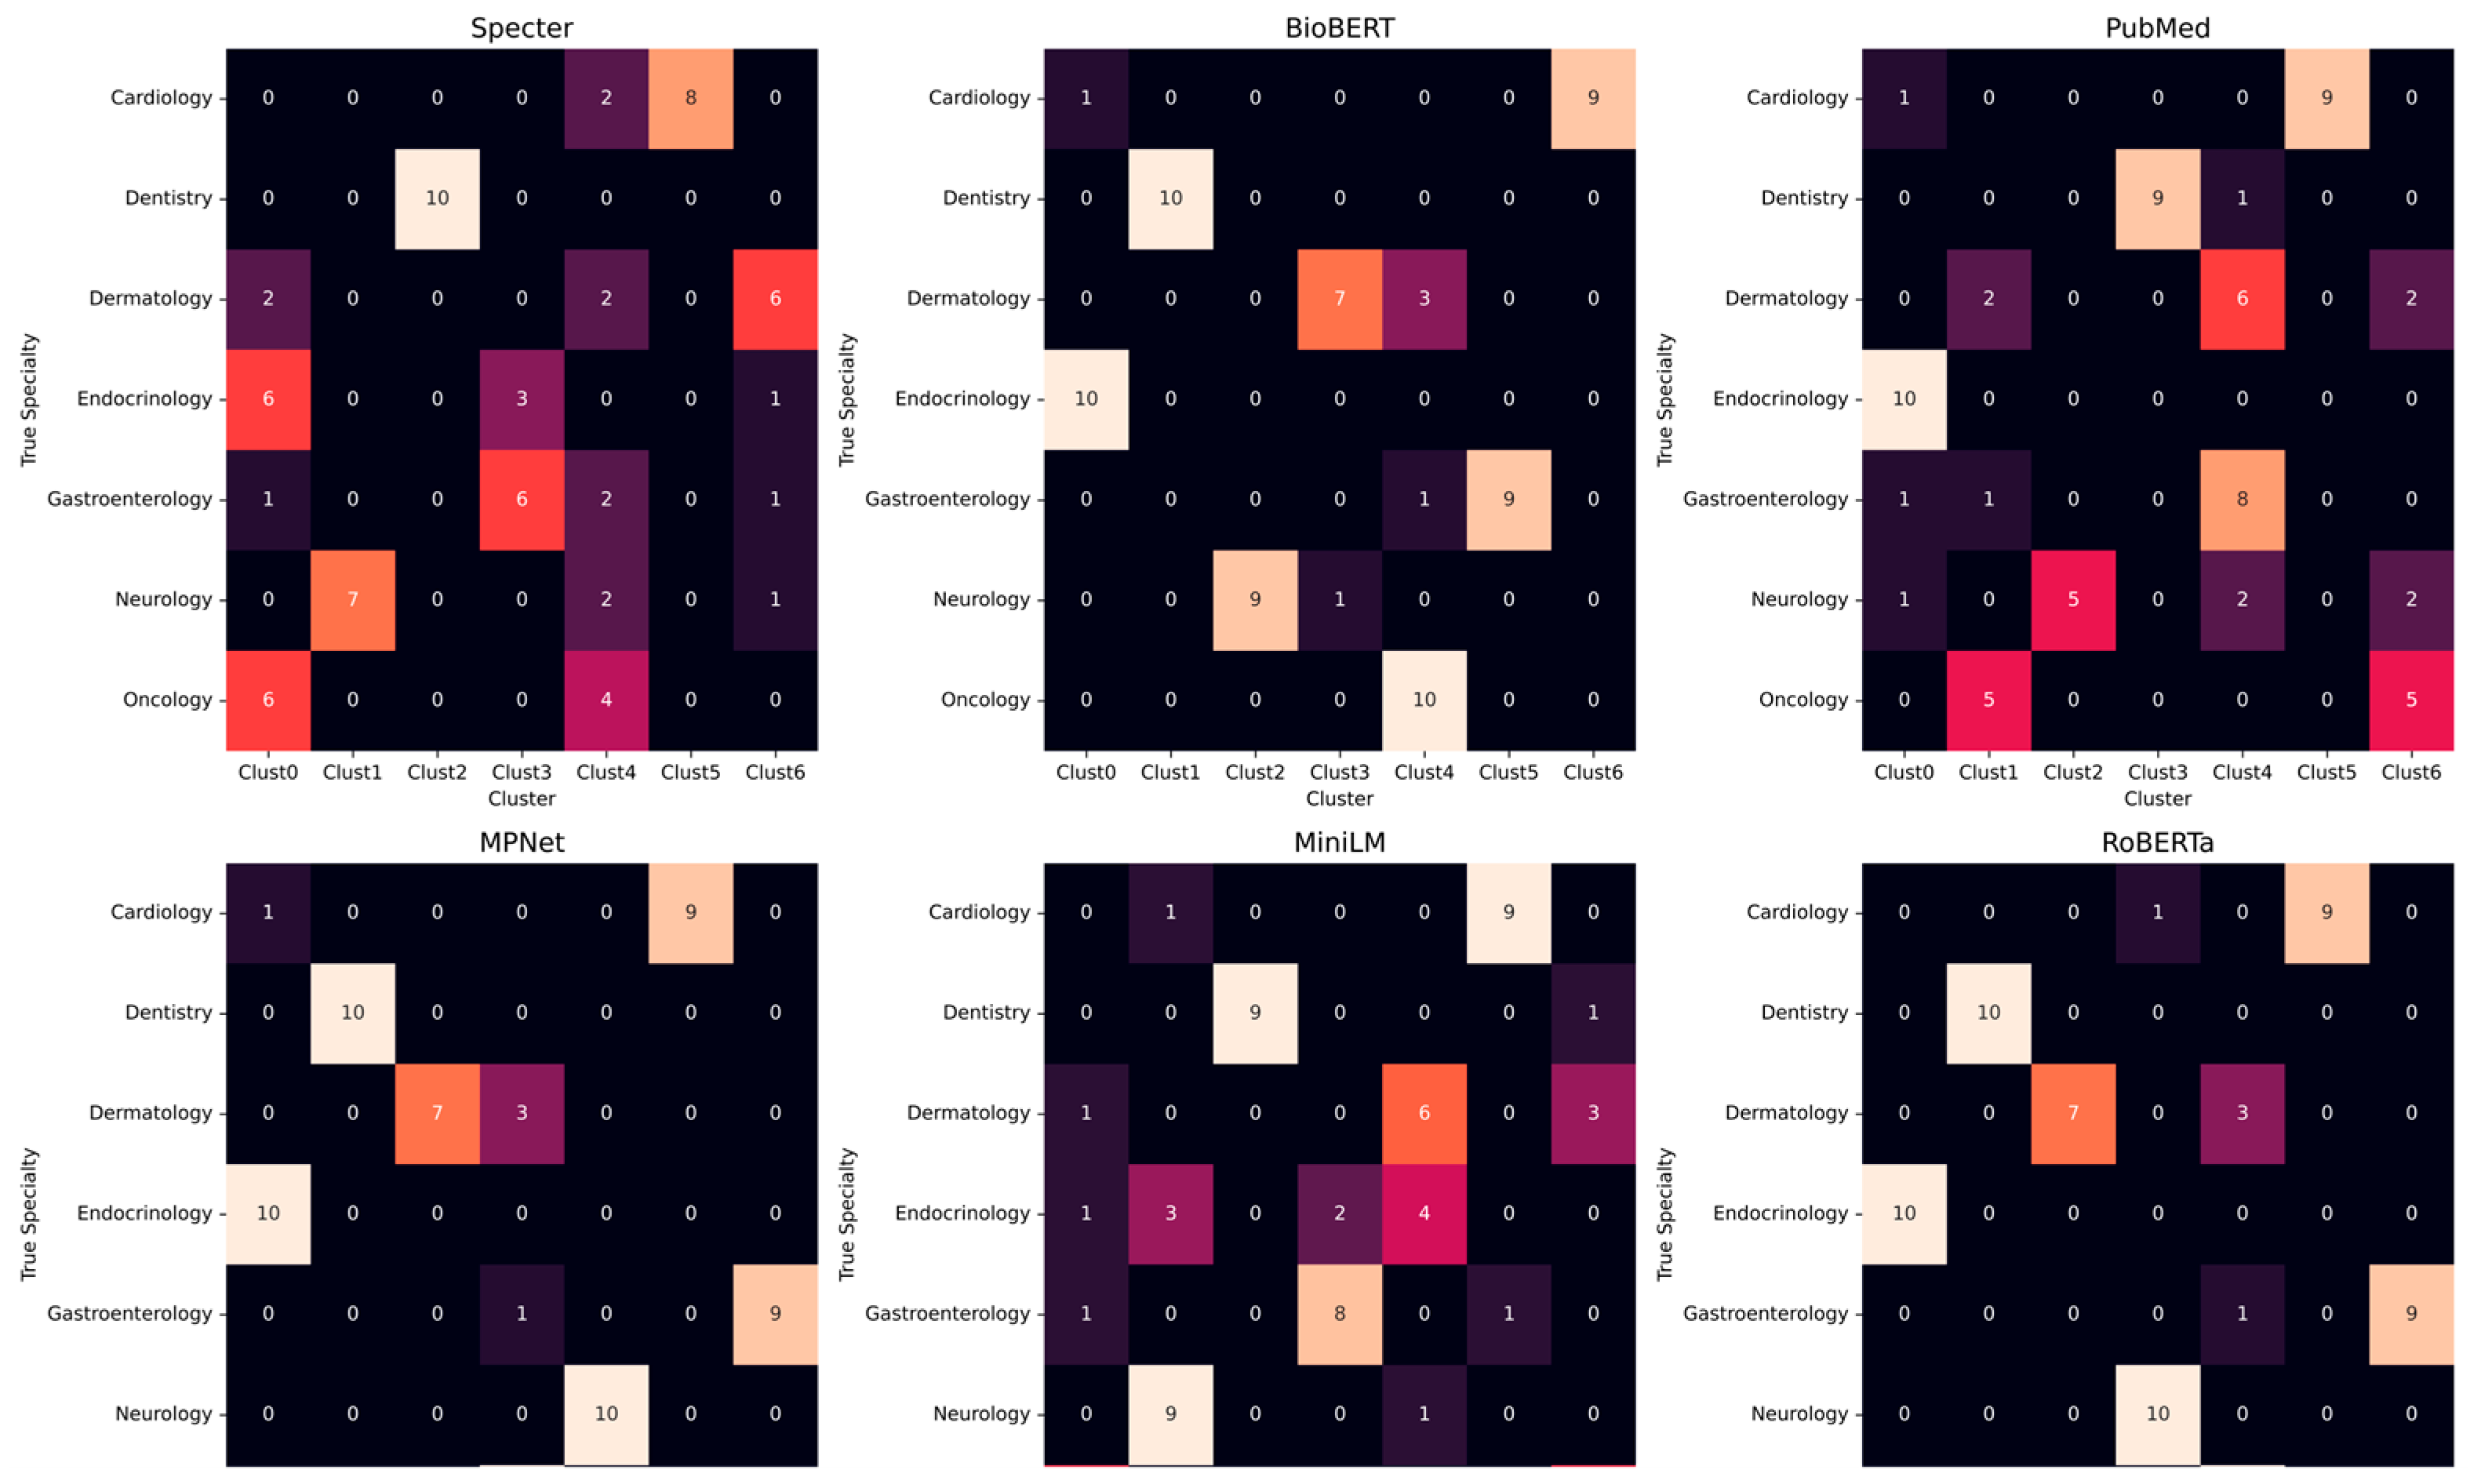
3.5. Cluster Composition and Misclassifications

A detailed analysis of the K-Means cluster composition for each model reinforces the findings from the UMAP visualizations and reveals specific patterns of semantic confusion (Figure 2). For the top-performing models RoBERTa, BioBERT, and MPNet, the confusion matrices confirmed the formation of high-purity clusters. Specialties such as Dentistry, Neurology, and Oncology were consistently partitioned with perfect (or near-perfect) accuracy, with their respective terms assigned to a single, exclusive cluster.
In contrast, the matrices for the poorer-performing models aligned with the previous assessment. The matrix for MiniLM showed high fragmentation for key specialties like Oncology, which was split evenly between two clusters, and Endocrinology, whose terms were scattered across four different clusters. The results for PubMedB and BioClinicalBERT highlighted different degrees of failure. PubMedBERT failed most of the thematic clustering, with a confusion matrix characterized by low diagonal values and a high degree of off-diagonal noise, except for Endocrinology, whose terms were collected in the same cluster. BioClinicalBERT, while still a low-tier performer, had a more mixed result; it accurately partitioned Oncology and formed a strong majority cluster for Gastroenterology, but failed on all other specialties, scattering terms from Neurology and Dermatology across multiple clusters.

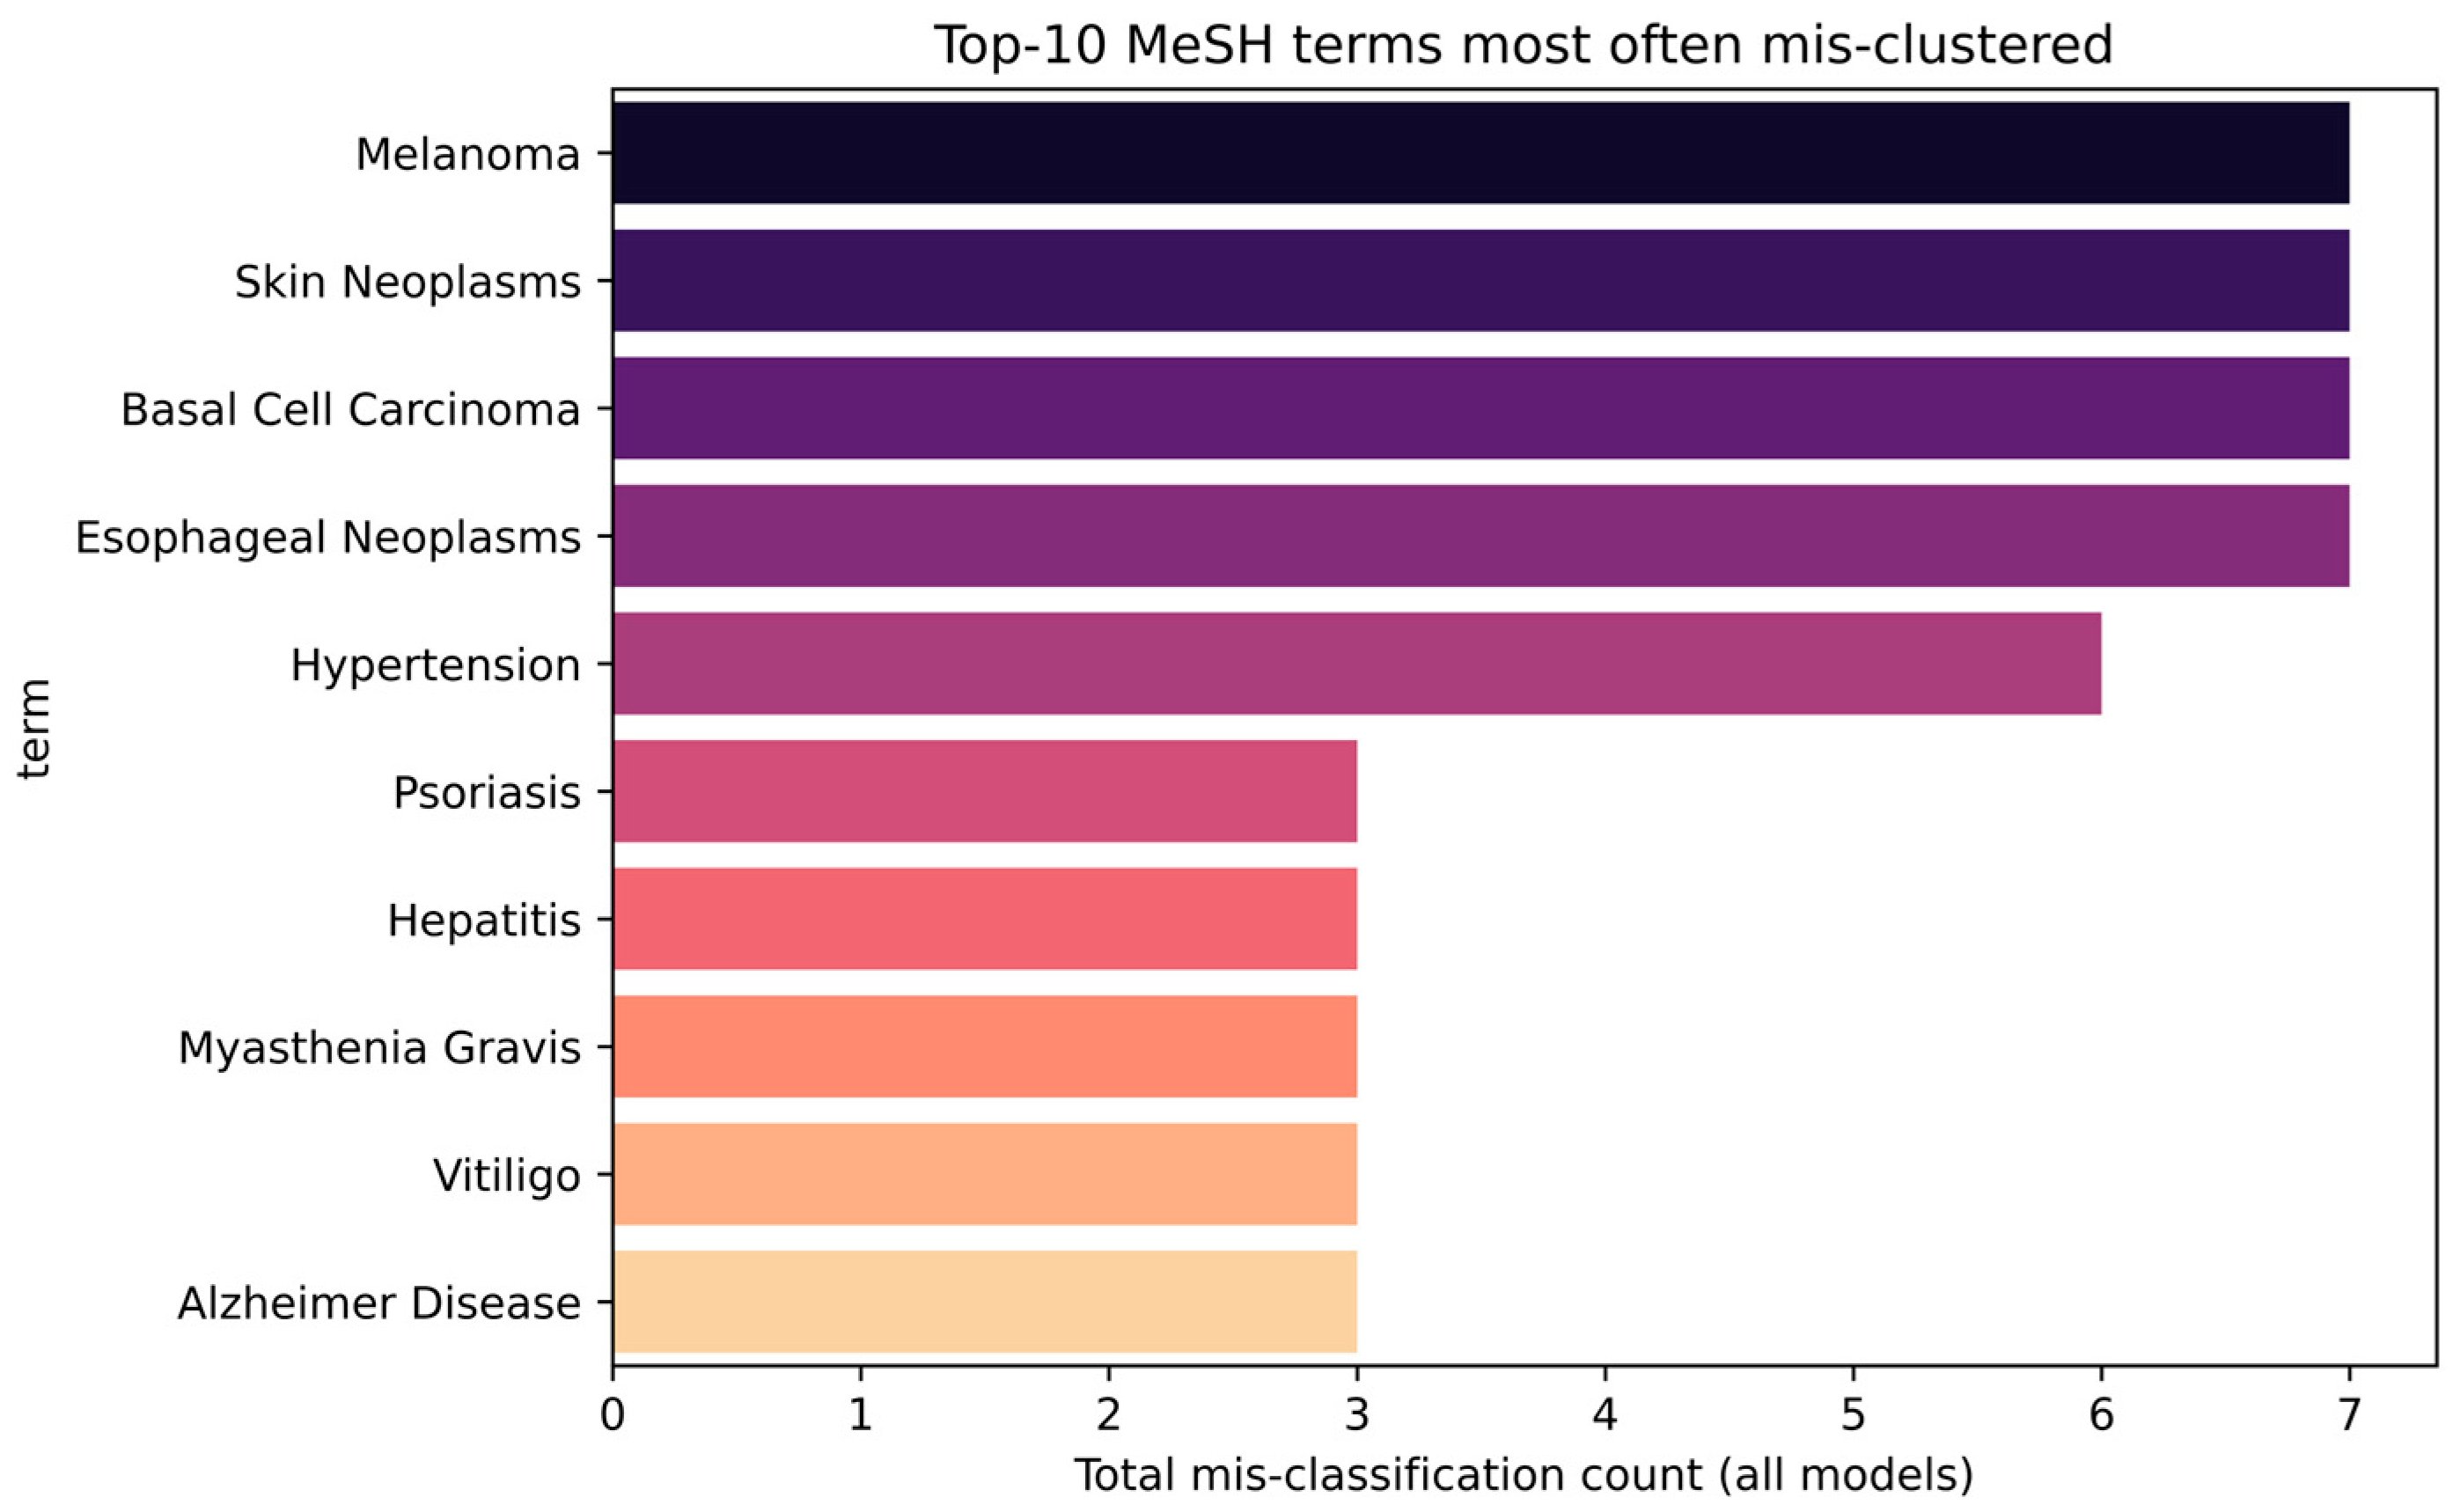
3.6. Analysis of Systematically Misclassified Terms

To further investigate the sources of error, we aggregated the misclassification ledgers from all six models to identify the “hard” terms that were systematically misplaced regardless of the model architecture. This analysis reveals which specific medical concepts were most challenging for the encoders to separate into their correct specialty.
Figure 3 displays the top-10 MeSH terms that were most frequently misclustered. The analysis shows a clear pattern: four terms were misclassified by all six of the evaluated models. These were “Basal Cell Carcinoma”, “Melanoma”, “Esophageal Neoplasms”, andSkin Neoplasms”, which semantically indeed overlap different specialties. These terms are not random mistakes but faithful reflections of their dual taxonomic status. In the MeSH hierarchy, Melanoma (D008545) is a child of Skin Neoplasms (D012878), while Basal Cell Carcinoma (D002280) is likewise nested under Neoplasms and cross-referenced to the skin tree. Clinically, these entities reside at the dermato–oncologic interface: they are skin cancers diagnosed and often treated by dermatologists, yet their pathology, staging, and systemic therapy paradigms are quintessentially oncologic. The top-performing encoders therefore capture a real conceptual overlap rather than committing a semantic error; the apparent “mis-classification” emerges only because our evaluation forces a single-label mapping that ignores legitimate cross-disciplinary ties. The Cardiology term “Hypertension” was also a difficult concept, being misclassified by five models. Other terms that proved consistently challenging for a smaller subset of encoders (two to three models) included Neurology concepts like “Alzheimer Disease” and “Parkinson Disease”, and Dermatology terms such as “Vitiligo” and “Rosacea”. This term-level audit demonstrates that clustering errors were not random but were concentrated on concepts that lie at the established clinical and scientific interface between different medical fields, confirming that the models’ semantic spaces reflect these genuine conceptual overlaps.

3.7. Model-Specific Error Fingerprints

A granular look at the misclassification list reveals distinct error patterns that are characteristic of each model’s performance tier (Table A1). For the top-performing models—RoBERTa, MPNet, and BioBERT—the errors were not only few but also highly systematic. Their misclassifications were dominated by a single, recurring pattern: placing key dermatological and esophageal neoplasms (“Basal Cell Carcinoma”, “Melanoma”, “Skin Neoplasms”, and “Esophageal Neoplasms”) into the Oncology cluster, which cannot actually be considered an error. Their remaining errors were few and isolated, such as the misclassification of a single major Cardiology term.
In stark contrast, the lower-performing models exhibited a much higher volume of errors that were widespread and more irregular. PubMedBERT, for instance, misplaced 19 terms, incorrectly mapping numerous Dermatology concepts to the Gastroenterology cluster and scattering Neurology terms across several unrelated specialties. The failure was most pronounced for BioClinicalBERT, which misclassified 27 of the 70 terms. Its error profile was characterized by a vast disorganization; terms from a single specialty like Dermatology were incorrectly assigned to four different clusters (Oncology, Endocrinology, Dentistry, and Gastroenterology).
To provide a more direct and intuitive summary of performance, we calculated the overall number of misclassified terms, the corresponding error rate, and the final cluster purity for each model. This analysis offers a clear, high-level confirmation of the performance hierarchy established by the other validation metrics.
The top-tier models demonstrated high fidelity in the clustering task (Table 4). MPNet and RoBERTa were tied for the best performance, each misclassifying only 5 of the 70 terms, which corresponds to a low error rate of 7.14% and a cluster purity of 92.86%. BioBERT also performed robustly, with only six misclassifications (8.57% error rate) and a purity of 91.43%.
A stark drop-off in performance was observed for the subsequent models. PubMedBERT and MiniLM were also tied, but for a much weaker performance, each failing to correctly classify 19 terms. This resulted in a substantially higher error rate of 27.14% and a correspondingly lower purity of 72.86%. Finally, BioClinicalBERT was confirmed as the definitive lowest-performing model, misclassifying 27 terms—more than a third of the entire corpus. This yielded a high error rate of 38.57% and a final purity score of only 61.43%. These straightforward metrics align perfectly with the qualitative analyses and external validation indices, clearly separating the models that generated a coherent semantic space from those that did not.

3.8. Robustness of Clustering

Across the seven encoders, the choice of clustering algorithm changes absolute quality scores but leaves the relative ranking of models largely intact (Table A2). K-Means and Ward agglomerative provide almost the same label agreement with the MeSH gold standard (median ΔARI = 0.02, ΔNMI = 0.01); their ARI values are highly correlated across models (Pearson r ≈ 0.98). Average-link agglomerative inflates Silhouette—for example, 0.852 for MPNet and 0.830 for Specter—yet halves ARI and NMI because it fragments single specialties into multiple microclusters. HDBSCAN behaves in the opposite direction: it collapses overlapping regions, yielding the best or near-best Davies–Bouldin scores (e.g., 0.135 for BioBERT, 0.248 for MiniLM) and, in some cases, the highest Silhouette (0.938 for MiniLM), but it lowers ARI by merging genuine classes (≤0.17 for five of the seven encoders). Interestingly, the encoder that performs best under the baseline (MPNet, ARI = 0.835) remains first or second under every alternative algorithm, while the weakest pair (BioClinicalBERT and PubMedBERT) stay at the bottom of the ranking.

4. Discussion

The central finding of this study is the clear stratification of sentence-transformer models according to their ability to organize standardized MeSH concepts. The results establish a performance hierarchy that challenges the assumption that greater domain specialization invariably improves every downstream task [42,43]. A top tier—composed of the general-purpose MPNet and RoBERTa models and the domain-adapted BioBERT checkpoint used here—produced well-separated clusters. These encoders yielded tight, specialty-specific clusters, corroborated by high external scores (Table 3), with ARI = 0.835 for both MPNet and RoBERTa and a purity above 91% for all three models. The BioBERT variant evaluated (pritamdeka/BioBERT-mnli-snli-scinli-scitail-mednli-stsb) had been fine-tuned with a large, contrastive sentence-pair objective in addition to its biomedical masked-language modeling (MLM) [44]. That extra stage explicitly draws semantically related phrases together, possibly explaining why BioBERT rivals the best general encoders despite being domain-adapted rather than domain-exclusive.
MiniLM forms a middle tier. Its distilled architecture—384 hidden dimensions and six transformer layers—reduces latency but sacrifices the representational granularity required to separate closely related biomedical descriptors, yielding a modest ARI of 0.512 and a purity of 72.86%. The model still benefits from contrastive training but cannot match the capacity of its larger peers, resulting in it being quite inadequate to carry out complex semantic tasks in the medical field.
In contrast, encoders pre-trained only with MLM on specialized corpora performed poorly. The PubMedBERT checkpoint we selected (pritamdeka/S-PubMedBert-MS-MARCO) was optimized for passage retrieval rather than semantic similarity and never exposed to a sentence-pair loss. It achieved a low ARI of 0.506 and scattered terms from every specialty across multiple clusters. This outcome shows that in-domain vocabulary alone does not guarantee globally coherent embeddings; the supervisory signal must match the end task.
BioClinicalBERT performed worse still (ARI = 0.350). Two factors contribute: its continued MLM on abbreviation-rich hospital notes shifts the embedding space toward clinical shorthand, and its revised WordPiece vocabulary splits several multitoken MeSH descriptors, fragmenting their semantics [35]. Lacking any contrastive correction, the model delivers a noisy semantic map in which only Oncology forms a stable island, while Cardiology and Dentistry disintegrate.
MPNet’s top Normalized Mutual Information of 0.902 can be traced to its billion-sentence contrastive training, which directly optimizes cosine distance for semantic similarity [31,32]. RoBERTa achieves the same by leveraging a more exhaustive base pre-training schedule that remains robust once a sentence-pair loss is layered on by the sentence-transformer framework [32]. BioBERT blends those strengths, pairing domain MLM with an NLI-style objective that realigns biomedical synonyms after pre-training [22].
One ostensibly paradoxical result demands emphasis. BioClinicalBERT registers a Silhouette coefficient of 0.152—better than that of MiniLM (0.071) and PubMedBERT (0.104)—yet returns the poorest ARI and purity. The model produces geometrically “tight” clusters that are semantically meaningless. This disconnect demonstrates why internal indices alone cannot certify the quality of a biomedical embedding space; without ground-truth labels, spurious structure can be mistaken for meaningful organization.
Misclassification analysis deepens these observations. The best encoders miscluster only a handful of dermatologic neoplasms, placing Basal Cell Carcinoma, Melanoma, and Skin Neoplasms under Oncology. Far from being errors, those placements mirror clinical reality: the MeSH hierarchy lists Melanoma as a child of Skin Neoplasms, and dermatologic oncology is an acknowledged subspecialty [45]. In other words, the “errors” of the highest-scoring models are better viewed as evidence that the embedding space respects genuine conceptual overlap rather than a failure to recognize specialty boundaries. Conversely, lower-tier models distribute whole specialties at random, confirming that their geometric separation is not semantically grounded.
Our capacity-versus-coherence analysis shows that, beyond a baseline of roughly 100 M parameters (≈12 layers), further architectural scaling yields no consistent improvement in clustering quality, underscoring that domain-aligned objectives and fine-tuning choices matter more than raw model size.
Because Ward clustering and K-Means yield almost identical ARI/NMI scores, while density-based HDBSCAN merely rescales them without altering the best-to-worst ordering of models, the specialty structure we report is demonstrably robust to the choice of clustering heuristic. In practical terms, the profile of each algorithm suggests different advantages for downstream use. Partition-based methods such as K-Means or Ward, which preserve mutually exclusive specialty labels and maximize ARI/NMI, are best suited to tasks that require high-precision indexing—curating ontology nodes, generating gold labels for supervised classifiers, or constraining a chatbot’s retrieval set. Average-link agglomerative, by over-segmenting dense neighborhoods, can serve analysts who need very fine topical slices for literature surveillance, albeit at the cost of lower recall. Conversely, HDBSCAN’s habit of merging borderline regions and flagging low-density points as noise raises recall and can therefore improve first-pass clinical triage or broad PubMed searches, where overlooking a relevant paper is riskier than reviewing an extra abstract. Thus, while our main findings are algorithm-agnostic, the choice of clustering heuristic can be tuned to the tolerance for false positives versus false negatives in a specific application.
Our findings have immediate translational value for a range of biomedical-informatics workflows that depend on a reliable semantic organization of the literature. Because each transformer encoder yields a vector space in which sentences gravitate toward discipline-specific centroids aligned with MeSH headings, the resulting clusters can be ingested directly by curation pipelines to pre-classify new PubMed records, thereby reducing manual annotation effort and speeding the creation of up-to-date domain knowledge bases. In parallel, the dense, specialty-aware embeddings facilitate ontology maintenance: by projecting concepts from distinct vocabularies into the same space, curators can identify synonyms and near-duplicates through simple nearest-neighbor queries, streamlining both alignment and gap analysis. When these embeddings are exposed through an API, conversational agents can exploit cluster centroids as grounding anchors, retrieving exemplar sentences that supply high-precision context windows for large-language-model prompts. The coherent neighborhood structure can also enable lightweight triage services: a single cosine-similarity call routes a free-text symptom description toward the most relevant specialty cluster, where fine-tuned classifiers refine the disposition.
Several limitations temper these findings. The study uses only 70 high-level MeSH descriptors, a set chosen for clarity rather than coverage; embedding models confronted with deeper or more granular branches of the hierarchy may behave differently. Our pipeline also fixes one dimensionality-reduction technique (UMAP) and one partitioning algorithm (K-Means); alternative graph-based or density-based clustering schemes could emphasize different aspects of the embedding geometry [46]. Moreover, all evaluations were run on English terminology, leaving open how multilingual or cross-lingual variants would fare [47]. Finally, the contrastive checkpoints compared here were trained on sentence-pair data orders of magnitude larger than any biomedical resource currently available; the degree to which similar gains can be replicated with domain-sized corpora remains uncertain. A decisive unknown is the size of this “contrastive data bottleneck”. The best-performing general encoders benefit from supervision derived from more than a billion sentence pairs, a scale that simply does not exist for biomedical text. Whether tens of millions of carefully curated PubMed or clinical-note pairs could close the gap remains an open question. Preliminary work with BioSimCSE [48] and SapBERT [49] suggests that even modest in-domain contrastive corpora boost clustering, but no study has yet matched the breadth of MPNet-style training signals. Quantifying how performance scales with domain-specific contrastive data therefore represents a critical next step.
Despite those constraints, the findings carry practical weight. Many biomedical informatics applications—rapid literature triage, ontology curation, automatic registry coding—depend on grouping short medical phrases [50]. The present “clean-room” experiment, however, abstracts away from the messy realities of clinical language. MeSH descriptors are orthographically stable and largely free of abbreviations, such as those that could be encountered in published biomedical documents, whereas electronic health records abound with acronyms and misspellings [51]. In such noisy settings, the specialized vocabulary and abbreviation handling embedded in models like BioClinicalBERT may confer advantages that our benchmark cannot capture. An evaluation on raw progress notes or radiology reports could therefore reorder the hierarchy observed here. For such tasks, a contrastively tuned general encoder often delivers cleaner semantic organization than a domain-specific model limited to MLM. At the same time, for supervised token-level tasks like named-entity recognition, relation extraction, and medical question answering, domain-specific encoders fine-tuned on task-specific data regularly outperform their general counterparts [22]. By reconciling these apparently conflicting results, the present study clarifies that task alignment, not domain label, should guide model selection: contrastive supervision is essential when the output is a pre-computed semantic space, whereas domain-specific MLM pre-training shines when the model will be further fine-tuned on labeled examples. Our results suggest that, for such tasks, a large, contrastively tuned general encoder often outperforms a narrowly trained biomedical model, unless the latter is also equipped with sentence-level supervision. This insight can streamline model selection in industry and accelerate prototyping, saving annotation effort and computing resources.
Future studies should extend the descriptor inventory to include hierarchical relationships and synonym sets, allowing measurement of how well embeddings respect the full MeSH graph. Task-adaptive fine-tuning techniques such as SimCSE [52] or TSDAE [53] could be applied directly to MeSH pairs or definitions to test whether lightweight, domain-specific contrastive objectives close the performance gap for models like PubMedBERT. Finally, integrating extrinsic tasks—such as ICD code assignment or question–answer retrieval—would test whether the cluster quality observed here translates into downstream utility [54].

5. Conclusions

This comparative analysis of the performance of six sentence transformers on a medical concept clustering task reveals that the path to effective semantic representation in biomedicine is possibly more nuanced than is often assumed. The superior performance of general-purpose and domain-adapted models challenges the view that greater domain specialization is advantageous for every task. We conclude that the alignment of a model’s training objective with the downstream task, the robustness of its base architecture, and the specific nature of its training corpus are critical determinants of success and confirm the flexibility of MPNet and RoBERTa to successfully carry out classification tasks in the medical field.

Author Contributions

Conceptualization, C.G. and E.C.; methodology, C.G.; software, M.T.C. and C.G.; formal analysis, C.G.; writing—original draft preparation, C.G. and M.T.C.; writing—review and editing, M.M. and E.C. All authors have read and agreed to the published version of the manuscript.

Funding

This research received no external funding.

Data Availability Statement

Data are available upon request.

Conflicts of Interest

The authors declare no conflicts of interest.

Appendix A

Table A1. This appendix table lists every MeSH descriptor that was assigned to a cluster whose majority specialty did not match its true label, for each of the six embedding models.
TermTrue SpecialtyAssigned SpecialtyModel
HypertensionCardiologyEndocrinologyBioBERT
Basal Cell CarcinomaDermatologyOncologyBioBERT
MelanomaDermatologyOncologyBioBERT
Skin NeoplasmsDermatologyOncologyBioBERT
Esophageal NeoplasmsGastroenterologyOncologyBioBERT
Alzheimer DiseaseNeurologyDermatologyBioBERT
HypertensionCardiologyEndocrinologyPubMed
Periodontal DiseasesDentistryGastroenterologyPubMed
Acne VulgarisDermatologyGastroenterologyPubMed
Basal Cell CarcinomaDermatologyOncologyPubMed
Contact DermatitisDermatologyGastroenterologyPubMed
Dermatitis, AtopicDermatologyGastroenterologyPubMed
MelanomaDermatologyOncologyPubMed
PsoriasisDermatologyGastroenterologyPubMed
RosaceaDermatologyGastroenterologyPubMed
Skin NeoplasmsDermatologyOncologyPubMed
UrticariaDermatologyGastroenterologyPubMed
VitiligoDermatologyOncologyPubMed
Esophageal NeoplasmsGastroenterologyOncologyPubMed
HepatitisGastroenterologyEndocrinologyPubMed
Alzheimer DiseaseNeurologyEndocrinologyPubMed
Amyotrophic Lateral SclerosisNeurologyOncologyPubMed
Multiple SclerosisNeurologyOncologyPubMed
Parkinson DiseaseNeurologyGastroenterologyPubMed
Peripheral NeuropathiesNeurologyGastroenterologyPubMed
HypertensionCardiologyEndocrinologyMPNet
Basal Cell CarcinomaDermatologyOncologyMPNet
MelanomaDermatologyOncologyMPNet
Skin NeoplasmsDermatologyOncologyMPNet
Esophageal NeoplasmsGastroenterologyOncologyMPNet
HypertensionCardiologyNeurologyMiniLM
MalocclusionDentistryOncologyMiniLM
Basal Cell CarcinomaDermatologyOncologyMiniLM
MelanomaDermatologyOncologyMiniLM
Skin NeoplasmsDermatologyOncologyMiniLM
VitiligoDermatologyOncologyMiniLM
Adrenal InsufficiencyEndocrinologyNeurologyMiniLM
Cushing SyndromeEndocrinologyNeurologyMiniLM
Diabetes Mellitus, Type 1EndocrinologyGastroenterologyMiniLM
Diabetes Mellitus, Type 2EndocrinologyGastroenterologyMiniLM
HyperparathyroidismEndocrinologyDermatologyMiniLM
HyperthyroidismEndocrinologyDermatologyMiniLM
HypothyroidismEndocrinologyDermatologyMiniLM
Metabolic SyndromeEndocrinologyNeurologyMiniLM
Polycystic Ovary SyndromeEndocrinologyOncologyMiniLM
Thyroid DiseasesEndocrinologyDermatologyMiniLM
Esophageal NeoplasmsGastroenterologyOncologyMiniLM
HepatitisGastroenterologyCardiologyMiniLM
Myasthenia GravisNeurologyDermatologyMiniLM
AtherosclerosisCardiologyNeurologyRoBERTa
MelanomaDermatologyOncologyRoBERTa
Basal Cell CarcinomaDermatologyOncologyRoBERTa
Skin NeoplasmsDermatologyOncologyRoBERTa
Esophageal NeoplasmsGastroenterologyOncologyRoBERTa
Angina PectorisCardiologyEndocrinologyBioclin
Heart FailureCardiologyEndocrinologyBioclin
HypertensionCardiologyEndocrinologyBioclin
PericarditisCardiologyDentistryBioclin
MalocclusionDentistryEndocrinologyBioclin
Acne VulgarisDermatologyEndocrinologyBioclin
Basal Cell CarcinomaDermatologyOncologyBioclin
Contact DermatitisDermatologyDentistryBioclin
Dermatitis, AtopicDermatologyDentistryBioclin
MelanomaDermatologyOncologyBioclin
PsoriasisDermatologyGastroenterologyBioclin
RosaceaDermatologyDentistryBioclin
Skin NeoplasmsDermatologyOncologyBioclin
UrticariaDermatologyDentistryBioclin
VitiligoDermatologyEndocrinologyBioclin
Esophageal NeoplasmsGastroenterologyOncologyBioclin
Peptic UlcerGastroenterologyEndocrinologyBioclin
Alzheimer DiseaseNeurologyEndocrinologyBioclin
Amyotrophic Lateral SclerosisNeurologyGastroenterologyBioclin
EpilepsyNeurologyOncologyBioclin
Migraine DisordersNeurologyEndocrinologyBioclin
Multiple SclerosisNeurologyGastroenterologyBioclin
Myasthenia GravisNeurologyEndocrinologyBioclin
Parkinson DiseaseNeurologyGastroenterologyBioclin
Peripheral NeuropathiesNeurologyEndocrinologyBioclin
StrokeNeurologyDentistryBioclin
Traumatic Brain InjuriesNeurologyDentistryBioclin

Appendix B

Table A2. For each encoder, four algorithms—baseline K-Means, Ward-link agglomerative, average-link agglomerative (cosine), and HDBSCAN—were run on identical 2-D UMAP projections. Columns report Silhouette (higher = better cohesion/separation), Davies–Bouldin (DBI; lower = better), and label-based Adjusted Rand Index (ARI) and Normalized Mutual Information (NMI) against MeSH gold labels (higher = better). Values are rounded to three decimals.
ModelAlgorithmSilhouetteDBIARINMI
BioBERTAgglo-Average0.6881.1280.3340.631
BioBERTAgglo-Ward0.3940.4570.750.842
BioBERTHDBSCAN−0.2800.1350.0940.348
BioBERTK-Means0.4130.4480.7490.833
BioclinAgglo-Average0.7061.660.1960.424
BioclinAgglo-Ward0.2080.7270.2720.464
BioclinHDBSCAN0.2760.6110.0980.326
BioclinK-Means0.0920.7090.3290.526
MPNetAgglo-Average0.8520.9160.520.738
MPNetAgglo-Ward0.5830.4670.780.877
MPNetHDBSCAN0.4630.4330.7260.868
MPNetK-Means0.4820.460.8350.902
MiniLMAgglo-Average0.7401.0070.4890.682
MiniLMAgglo-Ward0.6070.4390.6870.799
MiniLMHDBSCAN0.9380.2480.0740.29
MiniLMK-Means0.6220.4660.7140.808
PubMedAgglo-Average0.7073.3570.240.477
PubMedAgglo-Ward−0.0110.7010.5130.683
PubMedHDBSCAN0.0240.5270.0740.29
PubMedK-Means−0.0540.6310.5570.699
RoBERTaAgglo-Average0.7721.1840.4290.664
RoBERTaAgglo-Ward0.2690.4130.7480.851
RoBERTaHDBSCAN0.6560.3590.3430.659
RoBERTaK-Means0.2690.4130.7480.851
SpecterAgglo-Average0.8301.1910.380.576
SpecterAgglo-Ward0.3540.5350.4950.669
SpecterHDBSCAN0.0440.6090.1730.502
SpecterK-Means0.3570.5470.520.674

References

  1. Landhuis, E. Scientific Literature: Information Overload. Nature 2016, 535, 457–458. [Google Scholar] [CrossRef] [PubMed]
  2. Gurevitch, J.; Koricheva, J.; Nakagawa, S.; Stewart, G. Meta-Analysis and the Science of Research Synthesis. Nature 2018, 555, 175–182. [Google Scholar] [CrossRef] [PubMed]
  3. Garritty, C.; Stevens, A.; Hamel, C.; Golfam, M.; Hutton, B.; Wolfe, D. Knowledge Synthesis in Evidence-Based Medicine. Semin. Nucl. Med. 2019, 49, 136–144. [Google Scholar] [CrossRef] [PubMed]
  4. Sivarajkumar, S.; Mohammad, H.A.; Oniani, D.; Roberts, K.; Hersh, W.; Liu, H.; He, D.; Visweswaran, S.; Wang, Y. Clinical Information Retrieval: A Literature Review. J. Healthc. Inform. Res. 2024, 8, 313–352. [Google Scholar] [CrossRef] [PubMed]
  5. Chigbu, U.E.; Atiku, S.O.; Du Plessis, C.C. The Science of Literature Reviews: Searching, Identifying, Selecting, and Synthesising. Publications 2023, 11, 2. [Google Scholar] [CrossRef]
  6. Tamine, L.; Goeuriot, L. Semantic Information Retrieval on Medical Texts. ACM Comput. Surv. 2022, 54, 1–38. [Google Scholar] [CrossRef]
  7. Yun-tao, Z.; Ling, G.; Yong-cheng, W. An Improved TF-IDF Approach for Text Classification. J. Zhejiang Univ.-Sci. A 2005, 6, 49–55. [Google Scholar] [CrossRef]
  8. Jurafsky, D.; Martin, J.H. Vector Semantics and Embeddings. In Speech and Language Processing; Prentice Hall: Hoboken, NJ, USA, 2019; pp. 1–31. [Google Scholar]
  9. Haider, M.M.; Hossin, M.A.; Mahi, H.R.; Arif, H. Automatic Text Summarization Using Gensim Word2vec and K-Means Clustering Algorithm. In Proceedings of the 2020 IEEE Region 10 Symposium (TENSYMP), Dhaka, Bangladesh, 5–7 June 2020; pp. 283–286. [Google Scholar]
  10. Pennington, J.; Socher, R.; Manning, C.D. GloVe: Global Vectors for Word Representation. In Proceedings of the 2014 Conference on Empirical Methods in Natural Language Processing, Doha, Qatar, 25–29 October 2014; pp. 1532–1543. [Google Scholar]
  11. Noh, J.; Kavuluru, R. Improved Biomedical Word Embeddings in the Transformer Era. J. Biomed. Inform. 2021, 120, 103867. [Google Scholar] [CrossRef] [PubMed]
  12. Wolf, T.; Debut, L.; Sanh, V.; Chaumond, J.; Delangue, C.; Moi, A.; Cistac, P.; Rault, T.; Louf, R.; Funtowicz, M. Transformers: State-of-the-Art Natural Language Processing. In Proceedings of the 2020 Conference on Empirical Methods in Natural Language Processing: System Demonstrations, Online, 16–20 November 2020; pp. 38–45. [Google Scholar]
  13. Devlin, J.; Chang, M.-W.; Lee, K.; Toutanova, K. BERT: Pre-Training of Deep Bidirectional Transformers for Language Understanding. In Proceedings of the 2019 Conference of the North American Chapter of the Association for Computational Linguistics, Minneapolis, MN, USA, 2–7 June 2019; Association for Computational Linguistics: Stroudsburg, PA, USA, 2019; pp. 4171–4186. [Google Scholar]
  14. Liu, Q.; Kusner, M.J.; Blunsom, P. A Survey on Contextual Embeddings. arXiv 2020, arXiv:2003.07278. [Google Scholar] [CrossRef]
  15. Ajallouda, L.; Najmani, K.; Zellou, A.; Benlahmar, E.H. Doc2Vec, SBERT, InferSent, and USE Which Embedding Technique for Noun Phrases? In Proceedings of the 2022 2nd International Conference on Innovative Research in Applied Science, Engineering and Technology (IRASET), Meknes, Morocco, 3–4 March 2022; pp. 1–5. [Google Scholar]
  16. Reimers, N.; Gurevych, I. Sentence-Bert: Sentence Embeddings Using Siamese Bert-Networks. arXiv 2019, arXiv:1908.10084. [Google Scholar] [CrossRef]
  17. Gu, X.; Liu, L.; Yu, H.; Li, J.; Chen, C.; Han, J. On the Transformer Growth for Progressive Bert Training. arXiv 2020, arXiv:2010.12562. [Google Scholar]
  18. Galli, C.; Cusano, C.; Guizzardi, S.; Donos, N.; Calciolari, E. Embeddings for Efficient Literature Screening: A Primer for Life Science Investigators. Metrics 2025, 1, 1. [Google Scholar] [CrossRef]
  19. Džuganová, B. Medical Language—A Unique Linguistic Phenomenon. JAHR 2019, 10, 129–145. [Google Scholar] [CrossRef]
  20. Hunter, L.; Cohen, K.B. Biomedical Language Processing: What’s Beyond PubMed? Mol. Cell 2006, 21, 589–594. [Google Scholar] [CrossRef] [PubMed]
  21. Ngiam, J.; Peng, D.; Vasudevan, V.; Kornblith, S.; Le, Q.V.; Pang, R. Domain Adaptive Transfer Learning with Specialist Models. arXiv 2018, arXiv:1811.07056. [Google Scholar] [CrossRef]
  22. Lee, J.; Yoon, W.; Kim, S.; Kim, D.; Kim, S.; So, C.H.; Kang, J. BioBERT: A Pre-Trained Biomedical Language Representation Model for Biomedical Text Mining. Bioinformatics 2019, 36, 1234–1240. [Google Scholar] [CrossRef] [PubMed]
  23. Sabha, S.U.; Assad, A.; Din, N.M.U.; Bhat, M.R. From Scratch or Pretrained? An in-Depth Analysis of Deep Learning Approaches with Limited Data. Int. J. Syst. Assur. Eng. Manag. 2024, 1–10. [Google Scholar] [CrossRef]
  24. Gu, Y.; Tinn, R.; Cheng, H.; Lucas, M.; Usuyama, N.; Liu, X.; Naumann, T.; Gao, J.; Poon, H. Domain-Specific Language Model Pretraining for Biomedical Natural Language Processing. ACM Trans. Comput. Healthc. 2022, 3, 1–23. [Google Scholar] [CrossRef]
  25. Xia, Y.; Kim, J.; Chen, Y.; Ye, H.; Kundu, S.; Hao, C.C.; Talati, N. Understanding the Performance and Estimating the Cost of LLM Fine-Tuning. In Proceedings of the 2024 IEEE International Symposium on Workload Characterization (IISWC), Vancouver, BC, Canada, 15–17 September 2024; pp. 210–223. [Google Scholar]
  26. Kumar, K.; Ashraf, T.; Thawakar, O.; Anwer, R.M.; Cholakkal, H.; Shah, M.; Yang, M.-H.; Torr, P.H.S.; Khan, F.S.; Khan, S. Llm Post-Training: A Deep Dive into Reasoning Large Language Models. arXiv 2025, arXiv:2502.21321. [Google Scholar] [CrossRef]
  27. Sanchez Carmona, V.; Jiang, S.; Dong, B. A Multilevel Analysis of PubMed-Only BERT-Based Biomedical Models. In Proceedings of the 6th Clinical Natural Language Processing Workshop, Mexico City, Mexico, 20–21 June 2024; Naumann, T., Ben Abacha, A., Bethard, S., Roberts, K., Bitterman, D., Eds.; Association for Computational Linguistics: Mexico City, Mexico, 2024; pp. 105–110. [Google Scholar]
  28. Yang, D.; Zhang, Z.; Zhao, H. Learning Better Masking for Better Language Model Pre-Training. arXiv 2022, arXiv:2208.10806. [Google Scholar]
  29. Colangelo, M.T.; Meleti, M.; Guizzardi, S.; Calciolari, E.; Galli, C. A Comparative Analysis of Sentence Transformer Models for Automated Journal Recommendation Using PubMed Metadata. Big Data Cogn. Comput. 2025, 9, 67. [Google Scholar] [CrossRef]
  30. Lu, Z.; Kim, W.; Wilbur, W.J. Evaluation of Query Expansion Using MeSH in PubMed. Inf. Retr. Boston 2009, 12, 69–80. [Google Scholar] [CrossRef] [PubMed]
  31. Siino, M. All-Mpnet at Semeval-2024 Task 1: Application of Mpnet for Evaluating Semantic Textual Relatedness. In Proceedings of the 18th International Workshop on Semantic Evaluation (SemEval-2024), Mexico City, Mexico, 20–21 June 2024; pp. 379–384. [Google Scholar]
  32. Liu, Y.; Ott, M.; Goyal, N.; Du, J.; Joshi, M.; Chen, D.; Levy, O.; Lewis, M.; Zettlemoyer, L.; Stoyanov, V. Roberta: A Robustly Optimized Bert Pretraining Approach. arXiv 2019, arXiv:1907.11692. [Google Scholar]
  33. Galli, C.; Donos, N.; Calciolari, E. Performance of 4 Pre-Trained Sentence Transformer Models in the Semantic Query of a Systematic Review Dataset on Peri-Implantitis. Information 2024, 15, 68. [Google Scholar] [CrossRef]
  34. Nuthakki, S.; Neela, S.; Gichoya, J.W.; Purkayastha, S. Natural Language Processing of MIMIC-III Clinical Notes for Identifying Diagnosis and Procedures with Neural Networks. arXiv 2019, arXiv:1912.12397. [Google Scholar] [CrossRef]
  35. Ling, Y. Bio+ Clinical BERT, BERT Base, and CNN Performance Comparison for Predicting Drug-Review Satisfaction. arXiv 2023, arXiv:2308.03782. [Google Scholar] [CrossRef]
  36. McInnes, L.; Healy, J.; Melville, J. Umap: Uniform Manifold Approximation and Projection for Dimension Reduction. arXiv 2018, arXiv:1802.03426. [Google Scholar]
  37. McInnes, L.; Healy, J.; Astels, S. Hdbscan: Hierarchical Density Based Clustering. J. Open Source Softw. 2017, 2, 205. [Google Scholar] [CrossRef]
  38. Belyadi, H.; Haghighat, A. Unsupervised Machine Learning: Clustering Algorithms. In Machine Learning Guide for Oil and Gas Using Python; Elsevier: Amsterdam, The Netherlands, 2021; pp. 125–168. [Google Scholar]
  39. Singh, A.K.; Mittal, S.; Malhotra, P.; Srivastava, Y. V Clustering Evaluation by Davies-Bouldin Index(DBI) in Cereal Data Using K-Means. In Proceedings of the 2020 Fourth International Conference on Computing Methodologies and Communication (ICCMC), Erode, India, 11–13 March 2020; pp. 306–310. [Google Scholar]
  40. Warrens, M.J.; van der Hoef, H. Understanding the Adjusted Rand Index and Other Partition Comparison Indices Based on Counting Object Pairs. J. Classif. 2022, 39, 487–509. [Google Scholar] [CrossRef]
  41. McDaid, A.F.; Greene, D.; Hurley, N. Normalized Mutual Information to Evaluate Overlapping Community Finding Algorithms. arXiv 2011, arXiv:1110.2515. [Google Scholar]
  42. Ling, C.; Zhao, X.; Lu, J.; Deng, C.; Zheng, C.; Wang, J.; Chowdhury, T.; Li, Y.; Cui, H.; Zhang, X. Domain Specialization as the Key to Make Large Language Models Disruptive: A Comprehensive Survey. arXiv 2023, arXiv:2305.18703. [Google Scholar]
  43. Zhao, X.; Lu, J.; Deng, C.; Zheng, C.; Wang, J.; Chowdhury, T.; Yun, L.; Cui, H.; Xuchao, Z.; Zhao, T. Beyond One-Model-Fits-All: A Survey of Domain Specialization for Large Language Models. arXiv 2023, arXiv:2305.18703. [Google Scholar]
  44. Sinha, K.; Jia, R.; Hupkes, D.; Pineau, J.; Williams, A.; Kiela, D. Masked Language Modeling and the Distributional Hypothesis: Order Word Matters Pre-Training for Little. arXiv 2021, arXiv:2104.06644. [Google Scholar] [CrossRef]
  45. Soglia, S.; Pérez-Anker, J.; Lobos Guede, N.; Giavedoni, P.; Puig, S.; Malvehy, J. Diagnostics Using Non-Invasive Technologies in Dermatological Oncology. Cancers 2022, 14, 5886. [Google Scholar] [CrossRef] [PubMed]
  46. Ray, P.; Reddy, S.S.; Banerjee, T. Various Dimension Reduction Techniques for High Dimensional Data Analysis: A Review. Artif. Intell. Rev. 2021, 54, 3473–3515. [Google Scholar] [CrossRef]
  47. Piperno, R.; Bacco, L.; Dell’Orletta, F.; Merone, M.; Pecchia, L. Cross-Lingual Distillation for Domain Knowledge Transfer with Sentence Transformers. Knowl. Based Syst. 2025, 311, 113079. [Google Scholar] [CrossRef]
  48. Kanakarajan, K.R.; Kundumani, B.; Abraham, A.; Sankarasubbu, M. BioSimCSE: BioMedical Sentence Embeddings Using Contrastive Learning. In Proceedings of the 13th International Workshop on Health Text Mining and Information Analysis (LOUHI), Abu Dhabi, United Arab Emirates, 7 December 2022; Lavelli, A., Holderness, E., Jimeno Yepes, A., Minard, A.-L., Pustejovsky, J., Rinaldi, F., Eds.; Association for Computational Linguistics: Stroudsburg, PA, USA, 2022; pp. 81–86. [Google Scholar]
  49. Lim, S.; Kim, J. SAPBERT: Speaker-Aware Pretrained BERT for Emotion Recognition in Conversation. Algorithms 2022, 16, 8. [Google Scholar] [CrossRef]
  50. Harrison, C.J.; Sidey-Gibbons, C.J. Machine Learning in Medicine: A Practical Introduction to Natural Language Processing. BMC Med. Res. Methodol. 2021, 21, 158. [Google Scholar] [CrossRef] [PubMed]
  51. Tayefi, M.; Ngo, P.; Chomutare, T.; Dalianis, H.; Salvi, E.; Budrionis, A.; Godtliebsen, F. Challenges and Opportunities beyond Structured Data in Analysis of Electronic Health Records. WIREs Comput. Stat. 2021, 13, e1549. [Google Scholar] [CrossRef]
  52. Gao, T.; Yao, X.; Chen, D. Simcse: Simple Contrastive Learning of Sentence Embeddings. arXiv 2021, arXiv:2104.08821. [Google Scholar]
  53. Wang, K.; Reimers, N.; Gurevych, I. Tsdae: Using Transformer-Based Sequential Denoising Auto-Encoder for Unsupervised Sentence Embedding Learning. arXiv 2021, arXiv:2104.06979. [Google Scholar]
  54. O’Malley, K.J.; Cook, K.F.; Price, M.D.; Wildes, K.R.; Hurdle, J.F.; Ashton, C.M. Measuring Diagnoses: ICD Code Accuracy. Health Serv. Res. 2005, 40, 1620–1639. [Google Scholar] [CrossRef] [PubMed]
Figure 1. Two-dimensional UMAP projections of MeSH descriptor embeddings for six pre-trained transformers—BioBERT, PubMedBERT, MPNet, MiniLM, RoBERTa, and Bio_ClinicalBERT (“Bioclin”). Each point represents one of 70 standardized MeSH terms, colored by its ground-truth specialty.
Algorithms 18 00451 g001
Figure 2. Confusion matrices for K-Means clustering of UMAP-projected MeSH embeddings across six transformer models. Rows correspond to the true specialty labels, and columns represent the seven K-Means clusters (Clust0–Clust6). Each cell shows the number of terms from a given true specialty assigned to a particular cluster.
Algorithms 18 00451 g002
Figure 3. Frequency of the ten MeSH descriptors most often assigned to the wrong cluster across all six embedding models. Each bar represents the total number of misclustering events for a given term—summing errors from BioBERT, PubMedBERT, MPNet, MiniLM, RoBERTa, and Bio_ClinicalBERT.
Algorithms 18 00451 g003
Table 1. List of the high-level MeSH descriptors used in the present study.
CardiologyDentistryNeurologyEndocrinologyDermatologyOncologyGastroenterology
Myocardial InfarctionDental CariesEpilepsyDiabetes Mellitus, Type 1PsoriasisBreast NeoplasmsGastrointestinal Diseases
Heart FailurePeriodontal DiseasesParkinson DiseaseDiabetes Mellitus, Type 2Dermatitis, AtopicLung NeoplasmsInflammatory Bowel Diseases
Arrhythmias, CardiacTooth ExtractionAlzheimer DiseaseThyroid DiseasesAcne VulgarisLeukemiaCrohn Disease
Coronary Artery DiseaseOrthodonticsMultiple SclerosisHyperthyroidismMelanomaLymphomaUlcerative Colitis
HypertensionDental ImplantsMigraine DisordersHypothyroidismBasal Cell CarcinomaColorectal NeoplasmsPeptic Ulcer
CardiomyopathiesEndodonticsStrokeAdrenal InsufficiencyContact DermatitisProstatic NeoplasmsHepatitis
AtherosclerosisMalocclusionPeripheral NeuropathiesCushing SyndromeVitiligoSarcomaPancreatitis
Angina PectorisProsthodonticsAmyotrophic Lateral SclerosisHyperparathyroidismRosaceaGlioblastomaIrritable Bowel Syndrome
Atrial FibrillationOral HygieneMyasthenia GravisPolycystic Ovary SyndromeSkin NeoplasmsOvarian NeoplasmsGastroesophageal Reflux
Table 2. Overview of the embedding models used in the present study.
Model Name
(in Paper)
Hugging Face IDBase ArchitecturePrimary Pre-Training CorpusKey Fine-Tuning ObjectiveEmbedding Dim.
MPNetall-mpnet-base-v2MPNetGeneral Web Text (>1 B sentence-pairs)Contrastive Sentence-Pairs768
RoBERTaroberta-large (in S-T framework)RoBERTaGeneral Web Text (BookCorpus, etc.)MLM (base), then Contrastive768
MiniLMall-MiniLM-L6-v2Distilled BERTGeneral Web Text (>1 B sentence-pairs)Contrastive Sentence-Pairs384
BioBERTpritamdeka/BioBERT-mnli-snli…BERTPubMed/PMCMLM (base), then Contrastive on NLI/STS tasks768
PubMedBERTpritamdeka/S-PubMedBert-MS-MARCOBERTPubMed/PMC (from scratch)MLM (base), then Passage Retrieval (MS-MARCO)768
Table 3. Performance metrics for K-Means clustering of UMAP-projected MeSH embeddings, reported per embedding model.
ModelSilhouetteDBIARINMI
BioBERT0.2930.4890.8060.879
PubMed0.1040.7770.5060.674
MPNet0.3510.4950.8350.902
MiniLM0.0710.5610.5120.667
RoBERTa0.3960.4510.8350.902
Bioclin0.1520.7430.3500.534
Table 4. Summary of clustering purity and error rates for each embedding model.
ModelMisclassifiedError RatePurity
MPNet57.14%92.86%
RoBERTa57.14%92.86%
BioBERT68.57%91.43%
PubMed1927.14%72.86%
MiniLM1927.14%72.86%
Bioclin2738.57%61.43%
Disclaimer/Publisher’s Note: The statements, opinions and data contained in all publications are solely those of the individual author(s) and contributor(s) and not of MDPI and/or the editor(s). MDPI and/or the editor(s) disclaim responsibility for any injury to people or property resulting from any ideas, methods, instructions or products referred to in the content.

