Article

A Hybrid CNN–GRU–LSTM Algorithm with SHAP-Based Interpretability for EEG-Based ADHD Diagnosis

1
Faculty of Information Technology, Department of Information Systems, L. N. Gumilyov Eurasian National University, Astana 010000, Kazakhstan
2
Educational Program of Informatics and Information and Communication Technologies, Korkyt Ata Kyzylorda University, Kyzylorda 120000, Kazakhstan
3
Department of Social Work and Tourism, Esil University, Astana 010000, Kazakhstan
4
Department of Information Systems, M. Kh. Dulaty Taraz University, Taraz 080000, Kazakhstan
5
Department of Sociology, National University of Uzbekistan Named After Mirzo Ulugbek, Tashkent 100174, Uzbekistan
6
Department of Computer Modeling and Information Technology, East Kazakhstan University Named After S. Amanzholov, Ust-Kamenogorsk 070000, Kazakhstan
7
Department of Computer Science, Sh. Yessenov Caspian University of Technology and Engineering, Aktau 130000, Kazakhstan
8
Computer Engineering, University Technology MARA, Shah Alam 40450, Selangor, Malaysia
*
Authors to whom correspondence should be addressed.
Algorithms 2025, 18(8), 453; https://doi.org/10.3390/a18080453
Submission received: 17 June 2025 / Revised: 17 July 2025 / Accepted: 17 July 2025 / Published: 22 July 2025

Abstract

This study proposes an interpretable hybrid deep learning framework for classifying attention deficit hyperactivity disorder (ADHD) using EEG signals recorded during cognitively demanding tasks. The core architecture integrates convolutional neural networks (CNNs), gated recurrent units (GRUs), and long short-term memory (LSTM) layers to jointly capture spatial and temporal dynamics. In addition to the final hybrid architecture, the CNN–GRU–LSTM model alone demonstrates excellent accuracy (99.63%) with minimal variance, making it a strong baseline for clinical applications. To evaluate the role of global attention mechanisms, transformer encoder models with two and three attention blocks, along with a spatiotemporal transformer employing 2D positional encoding, are benchmarked. A hybrid CNN–RNN–transformer model is introduced, combining convolutional, recurrent, and transformer-based modules into a unified architecture. To enhance interpretability, SHapley Additive exPlanations (SHAP) are employed to identify key EEG channels contributing to classification outcomes. Experimental evaluation using stratified five-fold cross-validation demonstrates that the proposed hybrid model achieves superior performance, with average accuracy exceeding 99.98%, F1-scores above 0.9999, and near-perfect AUC and Matthews correlation coefficients. In contrast, transformer-only models, despite high training accuracy, exhibit reduced generalization. SHAP-based analysis confirms the hybrid model’s clinical relevance. This work advances the development of transparent and reliable EEG-based tools for pediatric ADHD screening.

1. Introduction

Attention deficit hyperactivity disorder (ADHD) is one of the most prevalent neurodevelopmental disorders among child populations. It is characterized by the occurrence of persistent symptoms of inattention, hyperactivity, and impulsivity that cause disruption in academic, social, and emotional functioning. ADHD has been estimated to occur in about 5–7% of school children worldwide [1]. Precise and timely diagnosis is very important in order to implement early interventions that have a higher chance of optimizing long-term developmental outcomes. However, standard techniques of diagnosis mainly rely on subjective judgments of behavior and rating scales. This can result in variable or delayed diagnoses because of clinician variability or variation in symptom presentation [2,3].
Recent neuroimaging and electrophysiological techniques have created new possibilities for the objective assessment of ADHD. Of these, EEG is a low-cost, non-invasive technique with high temporal resolution to record dynamic brain activity [4]. EEG-based biomarkers have shown potential to distinguish between ADHD children and typically developing (TD) peers on the basis of brainwave patterns associated with cognitive control, attention, and executive functioning [5,6]. While these findings are promising, manual analysis of EEG signals is still challenging and labor-intensive, rendering it impossible in routine clinical practice [7]. To circumvent these limitations, machine learning and deep learning strategies offer an effective avenue for automatically and objectively classifying EEG data. Deep neural networks have demonstrated significant success in extracting discriminative features from raw EEG signals [8,9]. Moreover, hybrid architectures that combine spatial and temporal processing capabilities further enhance classification performance by capturing the complex, multiscale nature of brain activity [10]. Building on this foundation, the present study proposes a hybrid deep learning framework for the objective evaluation of cognitive features in children with ADHD using EEG signals recorded during attention-demanding cognitive tasks. The proposed system adopts a hybrid deep learning approach that captures both spatial and temporal dynamics in EEG data.
The present study aims to develop an interpretable, task-specific deep learning framework for EEG-based ADHD diagnosis. A novel hybrid model integrating CNN, GRU, and LSTM layers is proposed to jointly capture localized spatial features and both short- and long-term temporal dynamics in EEG signals recorded during cognitively demanding attention tasks. This hybrid CNN–GRU–LSTM model demonstrates superior classification performance compared to the baseline CNN–LSTM architecture. To enhance clinical interpretability, SHAP are incorporated to provide feature-level insight, allowing practitioners to identify the most diagnostically relevant EEG channels and relate them to established neurophysiological patterns of ADHD.
To further expand the framework’s diagnostic generalizability, the study also explores transformer-based encoder architectures, which have gained significant attention in clinical neuroinformatics for their ability to model global, long-range dependencies through self-attention. Although transformer variants (2× and 3×) and the spatiotemporal transformer demonstrate high cross-validation accuracy, their generalization across test partitions is less stable. To overcome this limitation, the proposed hybrid CNN–RNN–transformer model integrates convolutional, recurrent, and transformer components into a unified architecture, achieving the highest accuracy, F1-score, and interpretability among all tested models.
The main contributions of this study are three-fold:
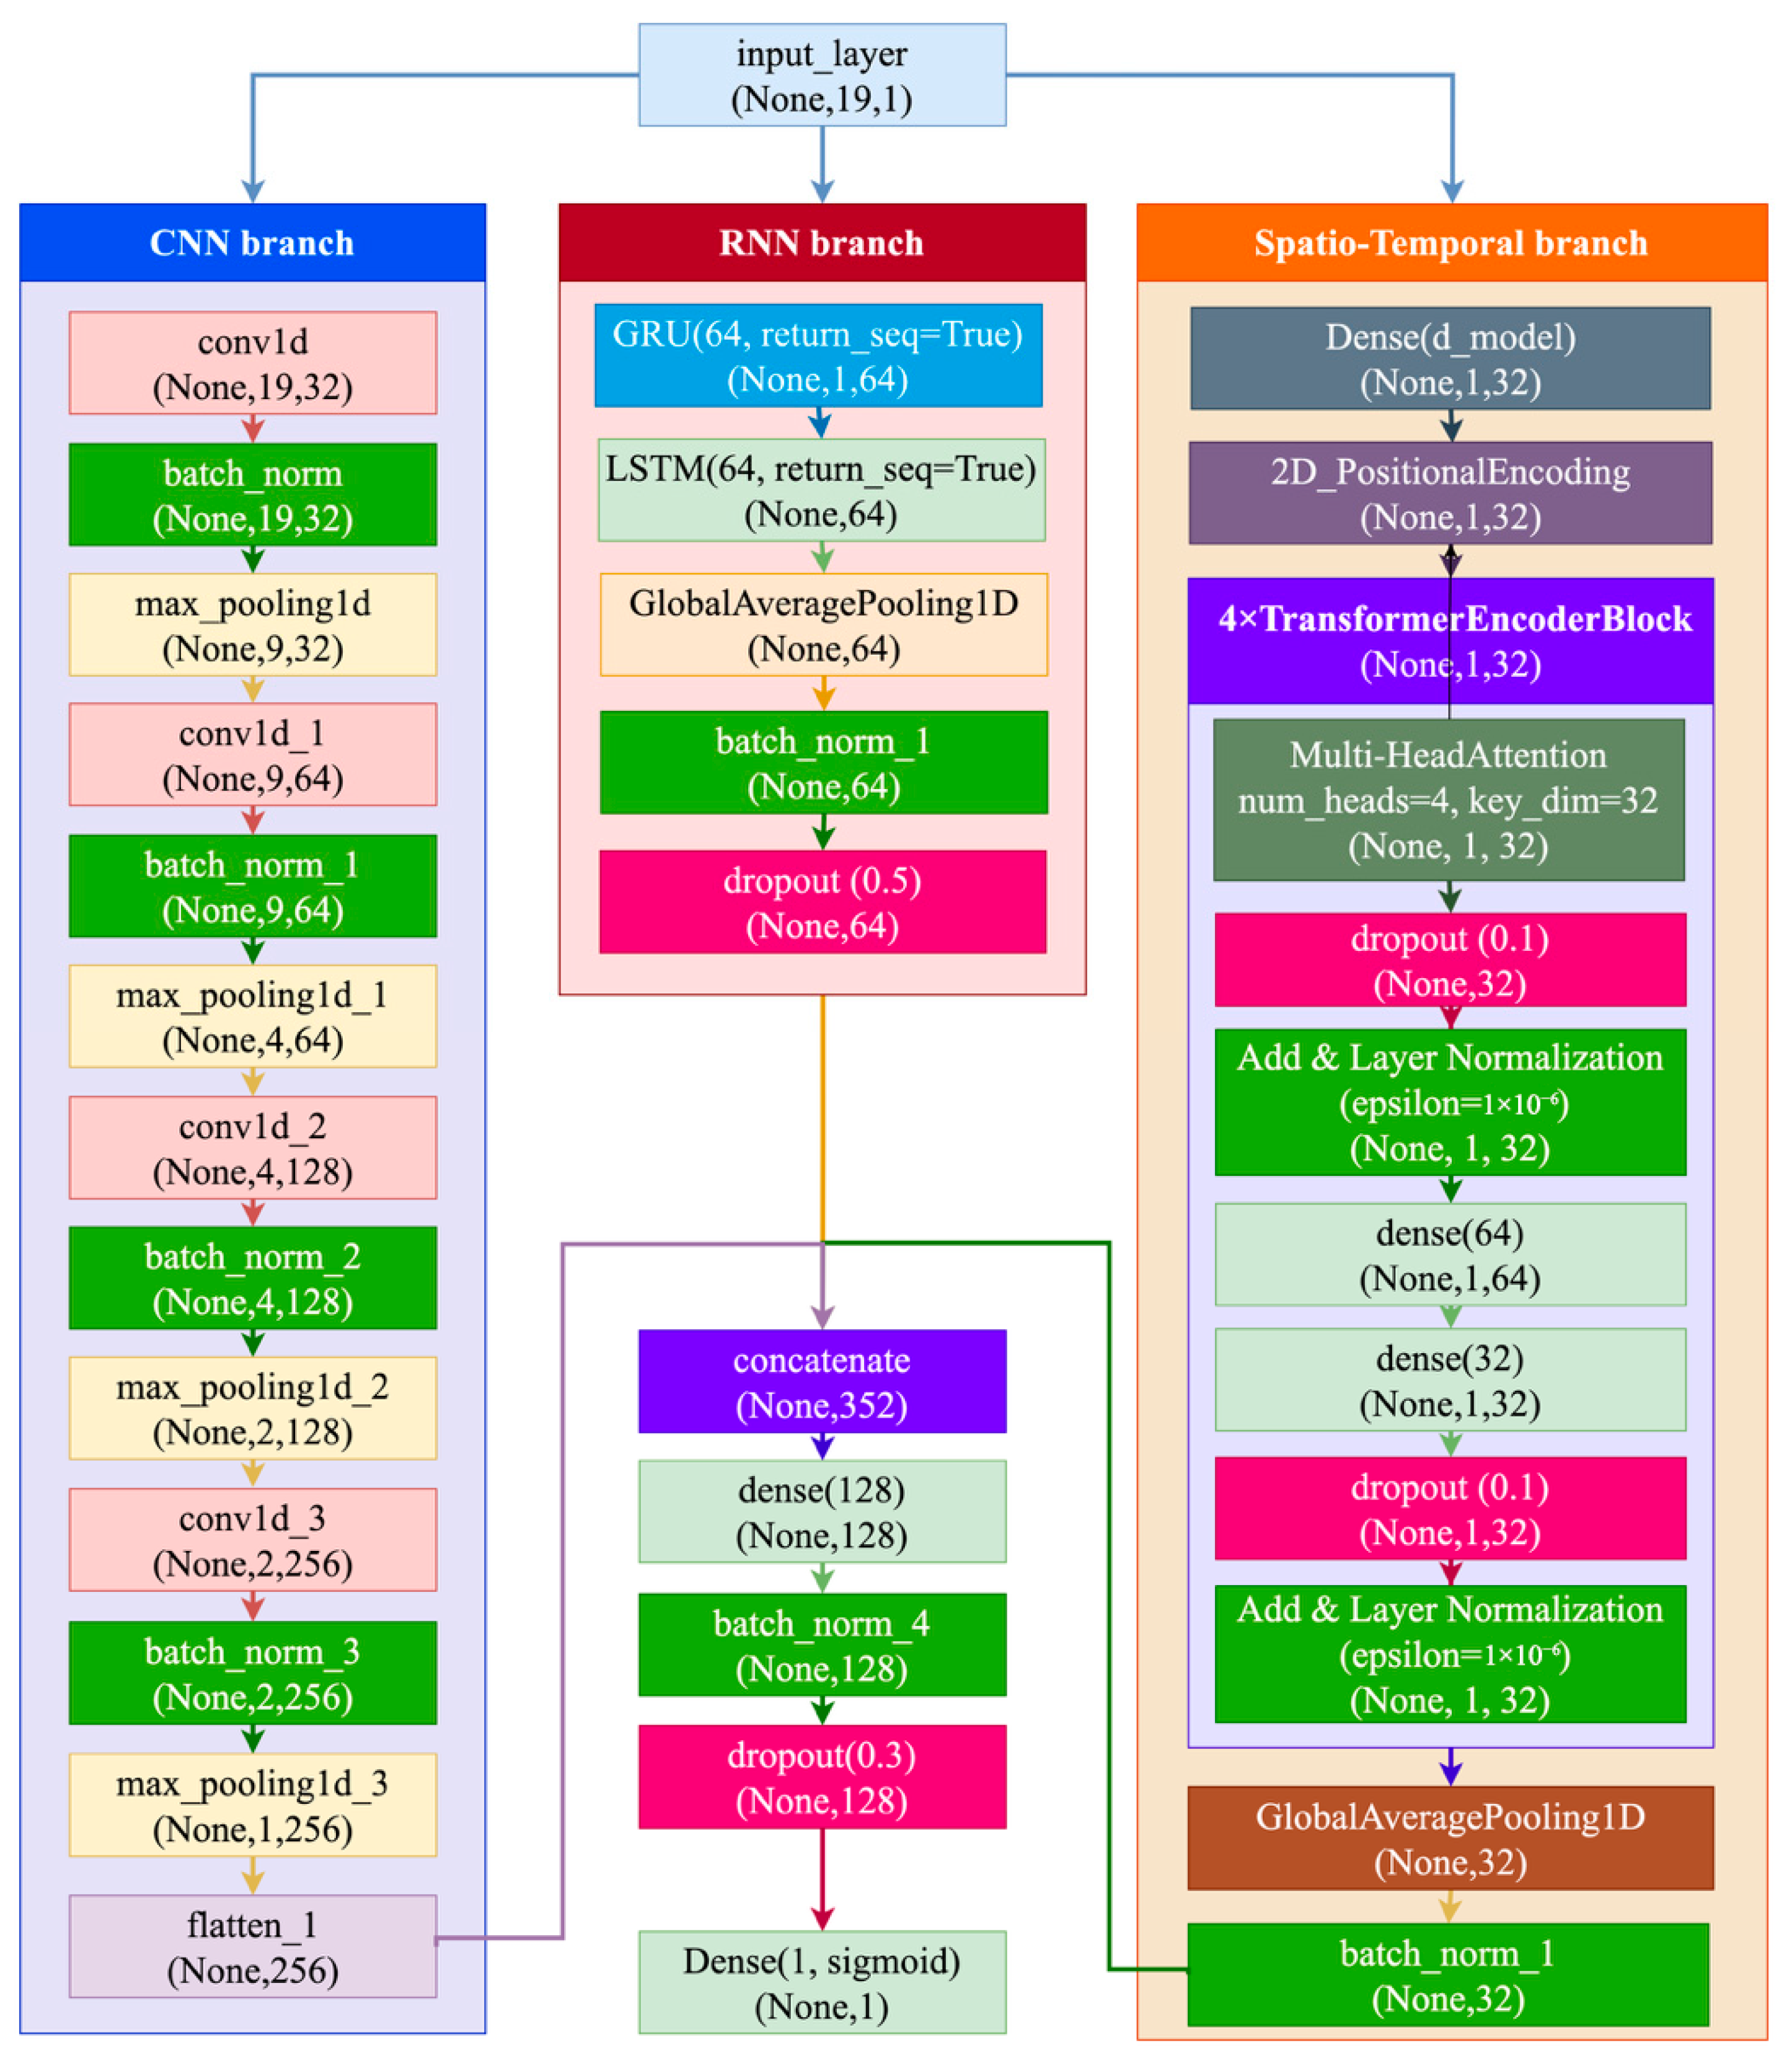
  • Formulation of a hybrid deep learning architecture integrating CNN, GRU, and LSTM components for efficient extraction of spatial–temporal features from task-evoked EEG signals.
  • Combination with SHAP-based interpretability for increased transparency and clinical trust, revealing EEG channels of most diagnostic importance.
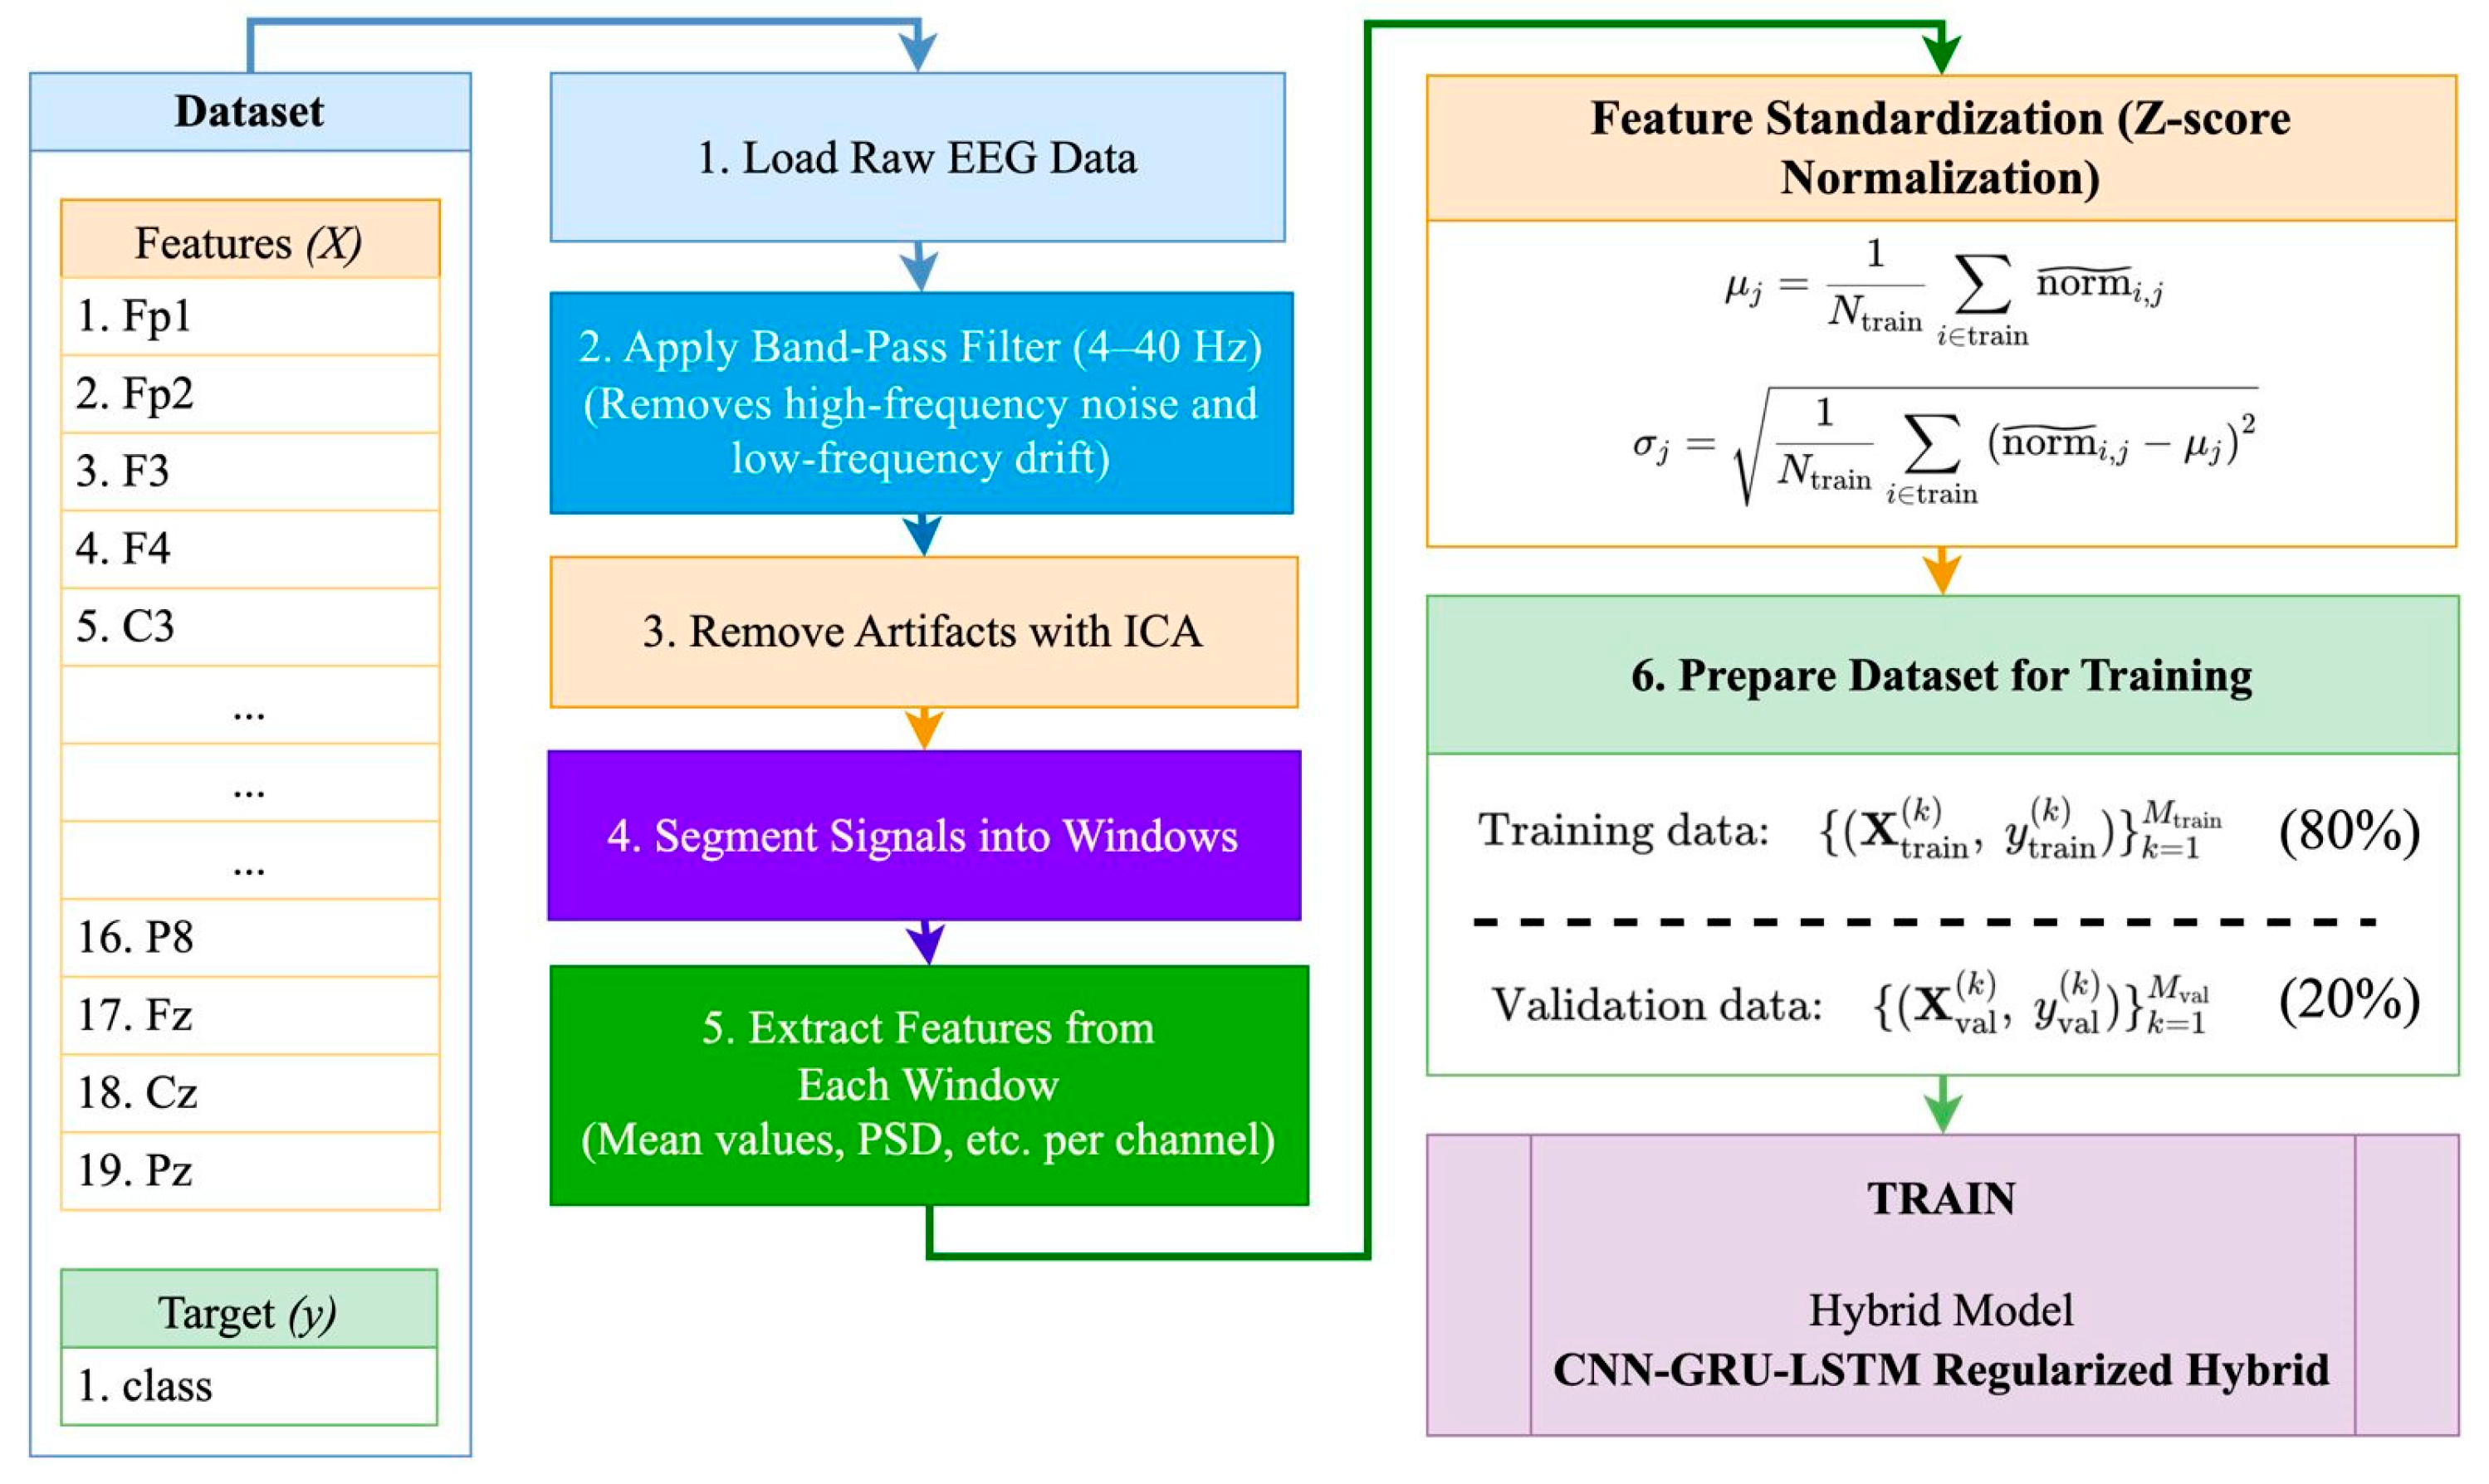
  • Application of a stringent preprocessing pipeline—comprising ICA-based artifact removal, z-score normalization, and event-related segmentation—specifically designed for pediatric EEG recordings obtained during cognitively engaging tasks.
The rest of this paper is structured as follows: Section 2 surveys recent advances in EEG-based ADHD classification, with special emphasis on deep learning architectures and new directions in model interpretability. Section 3 outlines the materials and methods of this research, including the pediatric EEG dataset, preprocessing pipeline, and proposed CNN–GRU–LSTM, transformer-based, and hybrid architectures. Section 4 reports the experimental results, including performance metrics based on five-fold cross-validation confusion matrices and SHAP-based interpretability analysis. Section 5 offers a detailed discussion of the results, limitations of the present approach, and possible avenues for future research. Finally, Section 6 concludes the paper by summarizing the main contributions and outlining the wider implications of this research for interpretable AI in neurodevelopmental diagnostics.

2. Related Work

2.1. Deep Learning and EEG-Based ADHD Classification

Recent advances in EEG-based ADHD diagnosis have been directed towards the integration of advanced signal processing techniques and deep learning to enhance diagnosis performance. Maniruzzaman et al. [11] used entropy-based features and a random forest classifier to differentiate between children with ADHD and their TD peers. Altun et al. [12] proposed a CNN model trained on time–frequency representations of EEG signals, achieving stable results across sessions. Jahani and Safaei [13] introduced a novel multimodal method involving skeletal motion features, indirectly supporting ADHD detection through motor analysis. Other researchers have prioritized model interpretability: Khare and Acharya [14] and Manjunatha and Esfahani [15] employed SHAP and LIME to increase the transparency of EEG classifiers. Building on this, recent works have explored hybrid deep learning models, such as CNN-BiLSTM and CNN-GRU architectures. Britto et al. [16] reported improved classification performance with spatial–temporal modeling, while Yang et al. [17] integrated attention mechanisms for EEG-based mental state recognition. Omar et al. [18] emphasized the importance of preprocessing, using ICA and band-pass filtering before classification with CNN-LSTM models. Azami et al. [19] demonstrated that training models on task-evoked EEG (rather than resting-state data) led to better cognitive differentiation in ADHD. Finally, Zhang and Li [20] introduced a data-efficient approach using transfer learning to mitigate small dataset limitations in clinical neurophysiology studies. Despite these improvements, gaps remain in the integration of interpretable hybrid models tailored to cognitive task conditions. Table 1 summarizes key findings and open issues from the literature.
As shown in Table 1, recent advancements in EEG-based ADHD classification have significantly improved diagnostic performance through the application of deep learning and hybrid models. However, many studies either lack interpretability mechanisms or are limited to specific EEG representations, such as spatial-only or resting-state data.

2.2. Interpretability and Research Gaps

Though there have been many studies that have used deep learning approaches for EEG-based ADHD classification, there are several important gaps, especially regarding interpretability, task-specific modeling, and the incorporation of State-of-the-Art architectures. While many approaches optimize for classification accuracy, they treat the model as a “black box” and provide no or limited explanation of why it made a specific prediction. Such a lack of transparency erodes clinical trust, particularly in pediatric populations where diagnostic accountability is crucial. Even though SHAP and Local Interpretable Model–Agnostic Explanations (LIME) have been taken up to render post hoc interpretability, they are usually applied externally to the modeling process rather than being intrinsic to the model design. Most models also ignore the temporal neurodynamics of cognitive control and attentional processes that are at the heart of ADHD. Consequently, their outputs lack neurophysiological underpinnings and fail to capture clinically meaningful signal change over time.
Hybrid models, e.g., CNN–BiLSTM and CNN–GRU, have advanced towards spatiotemporal dependency modeling in EEG data, but there are still limitations related to standardized evaluation protocols and multi-level interpretability frameworks. A further major limitation is the low exploitation of transformer-based approaches, which have demonstrated State-of-the-Art performance across other biomedical time-series tasks by learning long-range dependencies and global interchannel relationships. Despite their potential, these architectures have not been systematically compared with recurrent models in the context of ADHD classification using task-evoked EEG.
This study addresses these limitations by embedding SHAP-based interpretability directly into the modeling pipeline and systematically evaluating both recurrent (CNN–GRU–LSTM) and transformer-based models on a pediatric EEG dataset collected during attention-demanding tasks. Through rigorous benchmarking and feature attribution analysis, the proposed framework aims to bridge the gap between high-performance neural networks and clinically interpretable diagnostics for ADHD.

3. Materials and Methods

This study aimed to develop an objective EEG-based classification model for children with ADHD using a hybrid deep learning approach. The proposed pipeline included raw EEG data collection, preprocessing, segmentation, normalization, model development, performance evaluation, and interpretability analysis. EEG was recorded in a sample of children with ADHD and TD controls matched for age during cognitive tasks relevant to attention and response inhibition. Raw EEG signals were preprocessed with a fourth-order Butterworth band-pass filter in the range 0.5–40 Hz to eliminate slow drifts and high-frequency noise. Independent Component Analysis (ICA) with the FastICA algorithm was utilized for ocular and muscular artifact separation and rejection to improve the signal-to-noise ratio. The artifact-free EEG signals were then segmented into 2 s non-overlapping epochs, time-locked to the onset of task stimuli, to preserve cognitive event-related dynamics. Each epoch was normalized using z-score transformation across channels and subjects, ensuring consistency in amplitude range and reducing inter-subject variability. The signals were acquired using a standardized EEG system with 32 channels, following the 10–20 international electrode placement system. The sampling rate was set at 512 Hz. Raw EEG data were filtered using a band-pass filter (0.5–40 Hz) to remove artifacts and environmental noise. ICA was performed to eliminate ocular and muscular artifacts. After artifact rejection, signals were segmented into epochs corresponding to cognitive task events. Each epoch was normalized using z-score transformation to standardize inter-subject variability. To capture both spatial and temporal characteristics of EEG data, a hybrid deep learning architecture was designed, combining convolutional neural layers for spatial pattern extraction with gated recurrent units and long short-term memory layers for temporal sequence modeling. Model training was conducted using the Adam optimizer with early stopping. Classification performance was evaluated using accuracy, recall, F1-score, and AUC. SHAP values were applied to interpret the model’s output and identify the most influential EEG features contributing to classification decisions. All experiments were executed in Python (v3.8), using TensorFlow (v2.11) and Scikit-learn (v1.1.1.) libraries in a GPU-equipped environment. Subsets were trained (70%), validated (15%), and tested (15%) using stratified sampling.

3.1. Dataset Collection

The dataset used in this study was collected by Shahed University and is publicly accessible via the IEEE DataPort repository https://ieee-dataport.org/open-access/eeg-data-adhd-control-children (accessed on 10 June 2025). It was specifically designed to support research on ADHD in children through the analysis of EEG signals. The primary purpose of this dataset is to identify ADHD and TD children based on neurophysiological differences. These EEG recordings are a guided and annotated resource that enable machine learning algorithms to be created and evaluated for the automatic classification of cognitive and attention states. Therefore, the dataset has an important application in the creation of data-driven diagnostic tools and intelligent clinical decision support systems in the field of pediatric neurodevelopmental disorders.
The data consist of EEG recordings from 121 children aged 7 to 12 years, comprising 61 ADHD children and 60 TD controls. ADHD was clinically diagnosed by a psychiatrist based on DSM-IV criteria. All the ADHD children were receiving Ritalin for a period of up to six months prior to data collection. EEG was registered using 19 electrodes placed according to the international 10–20 system. Recordings were accomplished at a sampling rate of 128 Hz, and the reference electrodes were placed on the earlobes (A1 and A2). The task was a visual cognitive task in which the participants looked at images of cartoon characters and had to count them (numbers ranging from 5 to 16). EEG samples were recorded during the task and analyzed to determine stimulus-locked neural responses and temporal dynamics of cognitive processing. A single EEG sample was stored as a single row in the dataset, with numeric values for all 19 channels and two additional columns:
Class: Target label (0 = control, 1 = ADHD);
ID: Unique identifier of the EEG record.
These electrode sites are Fp1, Fp2, F3, F4, C3, C4, P3, P4, O1, O2, F7, F8, T7, T8, P7, P8, Fz, Cz, and Pz. Recording was performed in a controlled setting with a rigidly predetermined protocol to provide consistency and reproducibility. The ensuing dataset is a treasure to the fields of neuroscience and computational science, facilitating the creation of advanced diagnostic systems intended for clinical decision-making via EEG biomarkers. Figure 1 displays the distribution of the EEG dataset classes utilized in the current study.
Class 0 indicates TD children (control), while Class 1 illustrates children with ADHD. The dataset is a valuable asset in machine learning modeling because it provides unbiased data across all classes, which can be useful when training new models. Enhanced class imbalance is linked to an improved processing power that enhances the classification process and minimizes errors. A heatmap of power spectral density (PSD) for five frequency bands—delta (1–4 GHz), theta (4–8 Hz), alpha (8–13 Hz), beta (13–30 Hz), and gamma (30–45 Hz)—is shown in Figure 2. It is averaged across all the EEG segments in both the control and ADHD groups.
The top panel of the figure displays results for TD children (control). Alpha and beta activities are more prominent in the frontal (F3 and F4), central (C3 and C4), and parieto-occipital (P3, P4, O1, and O2) areas, indicating that cognitive engagement and attention stability during the task are indicators of high activity levels. Theta-band power is moderately spread over most channels, with no obvious peaks, which is characteristic of a resting or concentrated cognitive state. The lower panel displays the corresponding heatmap for the ADHD-diagnosed group. The reader can observe a clear difference in heightened delta-band power, particularly in frontal channels Fp1 and Fp2, commonly related to hypoactivation of the prefrontal cortex. Furthermore, alpha activity in ADHD children appears more focused over the temporoparietal areas (F8, T8, and P7), indicating the potential compensatory activation of secondary cognitive networks. Excessive beta and gamma activity observed in regions such as T7, P4, and O2 may reflect heightened neural variability and difficulty in maintaining attention over long periods.
In Figure 3, the radial plots of the control group and ADHD group are compared using graph–theoretical metrics computed on binarized correlation matrices, with values ranging between 0.5 and 8. All the figures show six important measures of the brain functional network topology: average node degree (degree), betweenness centrality (betweenness), closeness centrality (closeness), global efficiency (efficiency), modularity (modularity), and network density (density).
In the top-left diagram (threshold = 0.5), both groups exhibit relatively high node degree and network density, indicating the presence of numerous weak but stable connections across brain regions. The control and ADHD groups show similar values for most metrics; however, the control group demonstrates slightly higher global efficiency and density, while the ADHD group shows marginally higher modularity, suggesting more pronounced network clustering. As the threshold increases to 0.6 (top-right diagram), differences between the groups become more evident. The ADHD group experiences a noticeable decline in global efficiency, while modularity increases. This indicates that excluding weaker connections results in a less integrated but more fragmented functional network for the ADHD group, characterized by more distinct modules. At a threshold of 0.7 (bottom-left diagram), both groups show a sharp drop in degree and density, with the effect being more pronounced in the ADHD group. Concurrently, modularity in the ADHD group continues to increase, reaching a significant peak. The combination of decreased global efficiency and increased modularity supports the hypothesis of insufficient integration along with increased local clustering in the brain network associated with ADHD. Lastly, at the top level (0.8, depicted in the bottom-right figure), the networks are very sparse. Only the strongest links are left, with the weaker connections removed predominantly. In the ADHD group, node degree and density both converge towards zero, and modularity is still high, but efficiency reaches near-zero values. In contrast, the control group maintains slightly higher values, reflecting the preservation of a few inter-regional connections and greater resistance to the removal of weak links.

3.2. Rationale for Method Selection

Choosing a suitable computational paradigm is essential to attain both correct ADHD classification and clinically interpretable results in EEG-based diagnosis. Conventional machine learning methods, like Support Vector Machines (SVMs), k-Nearest Neighbors (KNNs), and decision trees, have yielded limited success in this field because they rely on hand-engineered features and lack generalizability across subjects and recording sessions. Such models fail to capture the nonlinear and dynamic spatiotemporal patterns of EEG signals, especially those involved in cognitive control and attentional modulation.
To overcome these limitations, deep learning methods have been ever more embraced owing to their ability to discover hierarchical representations from raw or minimally preprocessed EEG data. CNNs excel at capturing localized spatial dependencies over electrode topographies, whereas RNNs—particularly GRUs and LSTM networks—are naturally suited to capture temporal dynamics. GRUs offer computational efficiency via simplified gating mechanisms, whereas LSTMs are adept at capturing long-range dependencies within EEG sequences.
The proposed CNN–GRU–LSTM architecture combines the strengths of these three components—CNN for spatial encoding, GRU for short-term sequence modeling, and LSTM for long-term dependency learning—into a unified end-to-end framework capable of extracting comprehensive spatiotemporal features. A baseline CNN–LSTM model was implemented to serve as a comparative benchmark.
In addition to recurrent-based models, this study investigates transformer encoder architectures with two and three stacked attention blocks, as well as a spatiotemporal transformer model, which incorporates 2D positional encoding to jointly capture spatial electrode topography and temporal dependencies in EEG signals. These architectures have shown promising results in biomedical time-series tasks due to their ability to model long-range global dependencies via multi-head self-attention mechanisms, without relying on recurrence.
Finally, we propose a novel hybrid CNN–RNN–transformer architecture that integrates convolutional, recurrent, and attention-based modules within a single framework. This hybrid design aims to leverage the complementary strengths of each component to improve both predictive performance and interpretability.
This multi-architecture approach facilitates a rigorous comparative evaluation of spatial, sequential, and global modeling strategies for ADHD classification using task-evoked EEG. It also establishes a methodological foundation for achieving high diagnostic accuracy alongside feature-level interpretability, which is an essential requirement for real-world clinical applications.
Figure 4 illustrates the baseline hybrid neural network architecture, combining one-dimensional convolutional (Conv1D) layers and LSTM units to independently extract spatial and temporal features from EEG signals. In this model, one branch processes the input through two consecutive LSTM layers to capture long-range temporal dependencies, while a parallel convolutional pathway applies progressively deeper Conv1D layers, followed by MaxPooling1D operations to extract localized spatial features. The outputs from both branches are flattened and concatenated and then passed through a dense layer and dropout for regularization, concluding with a sigmoid-activated output neuron for binary classification.
Figure 5 presents the proposed enhanced CNN–GRU–LSTM architecture specifically designed to improve the robustness and representational capacity of EEG-based ADHD classification. In contrast to the baseline model, the novel architecture utilizes a recurrent unit that alternates between GRU and LSTM layers to leverage their complementary strengths in modeling both dynamic and long-term temporal interactions. In parallel, an alternative convolutional stream processes the input using a series of cascading Conv1D blocks with subsequent batch normalization and MaxPooling1D for the derivation of powerful and hierarchically abstract spatial information. The outputs from the two branches are merged and fed into a dense layer coupled with batch normalization and dropout, which improves generalization and reduces overfitting. The composite structure is a denser spatiotemporal learning approach, positioning the model to achieve improved performance in classifying complex EEG patterns.
Figure 6 illustrates the architecture of the transformer encoder (2× blocks) model developed for EEG-based ADHD classification. The model begins with an input layer of shape (None, 19, 1), representing 19 EEG channels, which are projected into a 32-dimensional embedding space using a dense layer. Positional encoding is then applied to preserve the spatial structure of electrode placements. The core of the model consists of two sequential transformer encoder blocks, each incorporating multi-head self-attention and feed-forward sublayers to capture spatial dependencies between EEG channels. A GlobalAveragePooling1D layer aggregates the features across channels, followed by a dense layer with 64 units (ReLU activation) and a dropout layer (rate = 0.3) to prevent overfitting. The final output is generated by a sigmoid-activated dense layer, producing a probability score for binary ADHD classification.
Figure 7 illustrates the architecture of the transformer encoder (3× blocks) model, which builds upon the encoder-only transformer design to enhance feature representation for EEG-based ADHD classification. The model takes EEG input in the shape (None, 19, 1), corresponding to 19 spatial channels, and projects it into a 32-dimensional embedding space using a dense layer. Positional encoding is applied to retain the spatial order of EEG electrodes, crucial for capturing cortical topography. The core component includes three stacked transformer encoder blocks, enabling deeper learning of spatial relationships and multiscale dependencies across EEG channels. A GlobalAveragePooling1D layer condenses the sequence of learned embeddings into a fixed-size vector, which is further processed through a dense layer (64 units, ReLU activation) and dropout (rate = 0.3) to reduce overfitting. The final dense layer with sigmoid activation outputs the classification probability, distinguishing between ADHD and control cases.
Figure 8 presents the architecture of the spatiotemporal transformer model developed for EEG-based ADHD classification. The model is designed to capture both spatial and implicit temporal dependencies across EEG channels. The input has the shape (None, 19, 1), corresponding to 19 EEG electrodes, and is first projected into a 32-dimensional feature space using a dense layer. A two-dimensional positional encoding mechanism is then applied to preserve spatial electrode topology and potential temporal ordering, enhancing the contextual representation of EEG signals. This enriched sequence is passed through three stacked transformer encoder blocks, each employing multi-head self-attention to capture nonlinear interchannel interactions and hierarchical dependencies. The sequence output is condensed using a GlobalAveragePooling1D layer, followed by a dense layer with 64 units and ReLU activation. A dropout layer (rate = 0.3) is applied for regularization. The final dense layer with sigmoid activation generates the output probability for binary classification between the ADHD and control classes.
Figure 9 illustrates the architecture of the proposed hybrid CNN–RNN–transformer model for EEG-based ADHD classification. This hybrid model combines three distinct processing branches to capture diverse aspects of EEG data. The CNN branch employs a series of Conv1D layers with increasing filter sizes (32 → 256), interleaved with MaxPooling, batch normalization, and dropout, to extract robust local spatial features across multiple frequency bands. The RNN branch incorporates stacked GRU and LSTM layers (64 units each) to model both short- and long-term temporal dependencies across EEG channels, followed by GlobalAveragePooling1D for dimensionality reduction. The transformer branch applies a dense projection (d_model = 32), 2D positional encoding, and four transformer encoder blocks with multi-head attention to capture global interchannel relationships and spatial context based on electrode topology. Outputs from all three branches are concatenated into a unified 320-dimensional feature vector and passed through two dense layers (128 units each) with batch normalization and dropout (rate = 0.3). The final sigmoid-activated output neuron performs binary classification between the ADHD and control groups. This integrative architecture enhances robustness, generalization, and interpretability by leveraging the complementary strengths of CNNs, RNNs, and transformers.
To ensure methodological rigor and maximize diagnostic reliability, the study compares a diverse set of neural architectures—including CNN–LSTM, CNN–GRU–LSTM, transformer encoders, a spatiotemporal transformer, and the hybrid CNN–RNN–transformer model—under consistent evaluation protocols. This architectural diversity enables the extraction of localized spatial features, dynamic temporal patterns, and global interchannel relationships, offering a robust and interpretable framework for EEG-based ADHD classification. By integrating convolutional, recurrent, and attention mechanisms within a unified comparative analysis, the study advances the State of the Art in task-based EEG modeling and provides a foundation for clinically applicable, explainable deep learning in pediatric neurodiagnostics.

3.3. Feature Importance and the Selection Process

To allow for powerful yet interpretable classification of ADHD from EEG recordings, a good preprocessing pipeline must be coupled with an effective model architecture. An awareness of this necessity guided the selection of a hybrid CNN-GRU-LSTM model that is capable of pulling out spatial and temporal features from EEG recordings. While model architecture is the cornerstone of accurate predictions, an understanding of which input features drive these predictions is equally vital, particularly in a clinical context where transparency and physiological relevance are paramount.
To satisfy this need, a feature importance analysis was performed employing the XGBoostClassifier model, as shown in Figure 10. This analysis offers a numerical score that reflects the individual contributions of specific EEG channels towards the classification task. Neuroscientific consensus on the role of temporoparietal and frontal areas in attentional and executive control domains aligns with the identification of P7, F4, and Fp1 as significant factors in this case. Conversely, smaller importance values for channels, such as O2 and P8, indicate their minimal contribution in this diagnostic context, which could reflect the presence of overlapping signal features or less relevance when engaged in cognitive tasks. The application of explainable machine learning techniques in a complementary manner enhances the interpretability and trustworthiness of the overall classification system.
Figure 11 provides a visual representation of the preprocessing pipeline designed to prepare EEG signals for input into the CNN-GRU-LSTM model. The process begins with raw EEG acquisition from 32 channels according to the international 10–20 system, recorded while subjects perform attention-related cognitive tasks.
The following subsection outlines each stage of the pipeline and its associated mathematical representation.
The first stage involves loading and organizing raw EEG signals as multichannel time series. Each recording is denoted as (1):
X ( i ) ϵ   R C T
where X ( i ) is the EEG matrix for subject i , C is the number of channels, and T is the number of time points.
Subsequently, in the second stage, a band-pass filter is applied to suppress low-frequency drifts and high-frequency noise, typically within the 4–40 Hz range (2):
X ~ ( i ) = F B P ( X i )
where F B P   represents the filtering function applied channel-wise.
At the third stage, Independent Component Analysis is utilized to separate artifacts, such as ocular and muscular noise, from neural activity. The filtered signal is decomposed into independent sources (3):
X ~ ( i ) = A ( i )   S ( i )
where S ( i ) (t) is the matrix of independent components, and A ( i ) is the mixing matrix. Components corresponding to artifacts are removed, and the signal is reconstructed.
In the fourth stage, the artifact-free signal is segmented into windows of fixed duration L , generating multiple time-localized segments (4):
X ~ i ( j ) = X ~ ( i ) : ,   t j :   t j + L 1
where t j is the starting index of window j .
During the fifth stage, features are extracted from each window. These include statistical and spectral features per channel, such as the mean (5):
μ j c = t = 1 L x j c ( t )
and the power spectral density (PSD):
P j c = | F ( x j c t | 2
where x j c ( t ) is the time series in channel c , window j , and F denotes the Fourier transform.
The sixth stage standardizes the extracted features across the dataset using z-score normalization (7):
ƒ j , k ^ = ƒ j , k μ k   σ k
with the mean and standard deviation calculated as (8):
μ k = 1 N i = 1 N ƒ j , k ,   σ j = 1 N   i = 1 N   ( ƒ j , k μ k ) 2
At the seventh stage, the dataset is split into training and validation subsets (9):
D t r a i n = { ( ƒ i , y i ) } ,   D v a l = { ( ƒ i , y i ) }
where y i { 0,1 } is the class label (control or ADHD).
Finally, in the eighth stage, the standardized features are formatted into 3D tensors and input into the CNN-GRU-LSTM hybrid model (10):
X ( i ) ϵ   R B x T x C
The model performs spatial feature extraction via convolutional layers and temporal modeling using GRU and LSTM units and produces the final prediction through a dense sigmoid-activated output (11):
y ^ = σ   ( W T h + b )
where h is the learned representation, and σ is the sigmoid function.
A thorough pipeline that preserves essential temporal and spatial characteristics was used to ensure high-quality input from EEG for deep learning. The CNN-GRU-LSTM model, a hybrid model that accurately captures complex brain dynamics, improves ADHD classification accuracy and interpretability.

4. Results

The proposed hybrid deep learning framework yielded robust classification performance and provided valuable insights into the neurophysiological patterns associated with ADHD. The results are organized into exploratory EEG signal analysis, model evaluation metrics, and interpretability findings using SHAP values. Emphasis is placed on both diagnostic accuracy and the clinical relevance of key EEG features contributing to model predictions.

4.1. Exploratory Analysis and EEG Feature Visualization

To gain insights into the neurophysiological patterns associated with ADHD, an initial exploratory analysis of raw EEG signals was performed using data collected during a visual cognitive task. The task involved showing children animated figures and requiring them to count from 5 to 16, which required visual processing and executive processing. Real-time neural responses that reflect cognitive workload and attentional dynamics were captured throughout the task using EEG signals, and this was carried out for both ADHD and TD children to examine differences in signal amplitude. Particular emphasis was placed on identifying distinct channel-level patterns and temporal fluctuations that may distinguish ADHD-related neural processing. To further enhance signal interpretability, ICA was applied, allowing the extraction of neurologically relevant components by minimizing noise and ocular artifacts. Each entry in the dataset represents a single EEG instance comprising time-series values from 19 electrodes, along with a class label and unique identifier. This structured format supports the application of deep learning models and facilitates the identification of discriminative EEG features for automated ADHD classification.
Figure 12 presents a multichannel representation of EEG signals characteristic of a TD child from the control group. The EEG recording reflects the brain’s electrical activity and demonstrates relatively stable and balanced patterns typical of children without signs of ADHD. A visual analysis of the signals reveals a smooth distribution of amplitude-frequency characteristics without abrupt spikes or pronounced variability, indicating stable neural network function. Unlike the recordings of children with ADHD, the EEG of TD participants exhibits more uniform rhythm alternation and an absence of significant transitions between frequency ranges. This suggests stable cognitive regulation and effective coordination between different brain regions.
The analysis of the EEG recording from a TD child in the control group indicates stable neural network function and balanced cognitive regulation. The amplitude characteristics of the signals remain moderate, without frequent or pronounced spikes, reflecting uniform central nervous system activity and the absence of pathological hyperactivity. The lack of significant transitions between channels and the smooth variations in frequency–amplitude characteristics confirm effective cognitive regulation and attentional control. Unlike the recordings of children with ADHD, the EEG of TD participants demonstrates signal integrity and predictable dynamics, indicating normal neural connectivity functioning.
Figure 13 presents the results of ICA performed on the electrophysiological data of a TD participant from the control group. The topographic maps illustrate the spatial distribution of independent component activity, allowing for the visualization of contributions from different sources on the scalp and distinguishing accurate neural signals from artifacts such as eye movements or muscle activity. An orderly structure of topographic maps is observed in the group of TD participants without distinct pathological patterns, indicating stable functional brain activity. The extracted components are common rhythms of the population at large, such as a prominent alpha rhythm in the occipital area associated with resting and focused attention. The application of ICA has the potential to refine EEG analysis, tighten diagnosis, and allow more effective noise elimination and, as such, is an important tool for research or clinical applications.
Figure 14 presents an EEG recording, which reveals that the electrical activity of the brain in a child with ADHD can be represented in multiple channels. The international 10–20 system was used to categorize the recording channels, with each horizontal row of the graph representing a different channel. Studies have shown that children with ADHD display characteristic EEG patterns, negligence in sustained attention, impulsivity in increased concentration, and hyperactivity. Changes in amplitude–frequency characteristics and disruptions to rhythm synchronization across brain regions may reflect these features.
The analysis of the EEG recording from a child with ADHD reveals characteristic features, including irregular amplitude characteristics, sudden spikes, and periods of reduced activity, which may indicate instability in neural activity regulation. The rapid shifts between frequency ranges, with a predominance of slow rhythms (theta range) and abrupt transitions to high-frequency rhythms, reflect signal variability associated with difficulties sustaining attention and impulse control. The identified patterns distinguishing EEG recordings of children with ADHD from those of TD participants can be utilized in the development of machine learning algorithms for automated EEG signal classification and improved diagnostic accuracy of this disorder.
Figure 15 presents the results of ICA performed on EEG data from a child with ADHD, where the topographic maps illustrate the spatial distribution of independent components, reflecting the localization of various activity sources on the scalp. Unlike healthy participants, whose maps exhibit an orderly structure corresponding to stable neural network function, children with ADHD show more complex or shifted patterns, which may indicate disruptions in functional connections regulating attention and impulse control. The obtained results confirm the presence of specific neurophysiological markers that differentiate children with ADHD from the TD population, making the ICA method a valuable tool for further investigation of the mechanisms underlying this disorder and the development of automated diagnostic methods.
Such components may reflect increased spontaneous excitability or difficulties in suppressing artifacts related to hyperactive behavior. ICA helps identify these features by distinguishing between the noise signal and physiologically relevant processes. Consequently, the examination of EEG components on topographic maps in children with ADHD provides a more comprehensive understanding of potential impairments in cognitive regulation and facilitates further investigation into specific activity patterns that could be used as biomarkers for this condition.

4.2. Model Performance Metrics

For assessing the stability and generalizability of each model, we conducted a stratified five-fold cross-validation, ensuring balanced class distributions in both the training and validation sets. All six architectures—CNN–LSTM, CNN–GRU–LSTM, transformer encoder (2× blocks), transformer encoder (3× blocks), spatiotemporal transformer, and the proposed hybrid CNN–RNN–transformer—were evaluated using five core metrics: accuracy, precision, recall, F1-score, and area under the curve (AUC). Table 2 presents the average performance of each model across all folds.
As observed, the CNN–GRU–LSTM model significantly outperformed the baseline CNN–LSTM architecture, achieving an average accuracy of approximately 99.62% compared to 92.36%, reflecting an improvement of more than 7%. It also demonstrated substantial gains in F1-score (from ~0.9190 to ~0.9963) and AUC (from ~0.9412 to ~0.9998), indicating an enhanced ability to capture both short- and long-term temporal dependencies in EEG sequences.
In contrast, the transformer encoder models (2× and 3×) exhibited considerably lower and more unstable performance. The 2× encoder showed an average accuracy of ~75.85%, with F1-scores ranging from 0.3692 to 0.4465 and AUC values between 0.8126 and 0.8570. Similarly, the 3× encoder achieved an average accuracy of ~74.26%, with F1-scores from 0.3902 to 0.4305 and AUC between 0.7838 and 0.8547. These results reflect poor generalization and high sensitivity to data partitioning, primarily due to a higher false positive rate in classifying control cases as ADHD. The spatiotemporal transformer model performed almost perfectly, with accuracy greater than 99.98% and, on average, F1-scores greater than 0.9999 and AUC greater than 1.0000, reflecting the benefit of adding 2D positional encoding to model electrode topography and spatial–temporal interactions.
Most notably, the hybrid CNN–RNN–transformer architecture outperformed all other models across every metric, achieving an average accuracy of 99.898%, perfect precision, and F1-scores consistently above 0.9999. Although the numerical improvement over the spatiotemporal transformer was marginal (≤0.01%), it confirms the added value of combining convolutional, recurrent, and attention-based mechanisms within a single unified framework. These findings highlight the hybrid model’s superior diagnostic robustness, interpretability, and generalization capability in EEG-based ADHD classification.
To further validate these findings and quantify the degree of performance stability across data partitions, Table 3 provides a comprehensive summary of the mean and standard deviation values for each evaluation metric. By explicitly presenting both average values and variability across five stratified folds, this table enables a more nuanced comparison of generalization behavior.
As presented in Table 3, the repeated train–test experiments clearly demonstrate substantial differences in generalization stability across the evaluated architectures. The transformer encoder models (2× and 3×) exhibited the highest performance variability across splits, particularly in F1-score (±0.0278 and ±0.0134, respectively) and recall (±0.0692 and ±0.0372), indicating that their classification outcomes are highly sensitive to the specific train/test partitioning. For instance, the transformer encoder (2×) achieved an average accuracy of 75.85% ± 1.59, while the CNN–GRU–LSTM model consistently reached 99.63% ± 0.04, reflecting a performance gap of nearly 24 percentage points, with approximately 40× higher standard deviation for the transformer-based model. These findings support the concern that earlier reported high transformer performance was not representative of general behavior.
The transformer encoder (3×) further demonstrated poor generalization, achieving the lowest AUC among all models (0.825 ± 0.0242) and exhibiting instability in both recall and F1-score. Such results reinforce the limited reliability of Encoder-only transformer blocks in EEG-based clinical classification when used without architectural modifications.
In contrast, the CNN–GRU–LSTM model consistently demonstrated high and stable performance across repeated trials, with minimal standard deviation in all core metrics (e.g., F1-score: 0.996 ± 0.0004, AUC: 0.9998 ± 0.0001). Its robustness in capturing temporal dynamics of EEG signals highlights its practical value for clinical applications, particularly where interpretability and reliability are prioritized.
Among the hybrid architectures, the spatiotemporal transformer achieved 99.88% ± 0.11 accuracy, with nearly perfect AUC and F1-score values, benefiting from the use of 2D positional encoding to model electrode topology and time–space dependencies. The proposed hybrid CNN–RNN–transformer model outperformed all alternatives, reaching 99.99% ± 0.005 accuracy and F1-score 0.9999 ± 0.00003, with negligible variance, demonstrating exceptional generalization capacity and robustness to train/test split fluctuations.
Finally, a comparative analysis of standard deviation in test accuracy across models further supports the importance of performance consistency. The transformer encoder (2×) and (3×) models yielded standard deviations of ±1.59% and ±2.11%, respectively, while CNN–LSTM showed moderate variability (±0.79%). In contrast, CNN–GRU–LSTM, hybrid CNN + GRU + LSTM, and spatiotemporal transformer maintained deviations below ±0.11%, with the hybrid CNN–RNN–transformer achieving a remarkably low ±0.005%. These results confirm that high-performing architectures must be evaluated not only by average performance but also by their stability and reliability across random train–test partitions, particularly in high-stakes clinical decision-making scenarios.

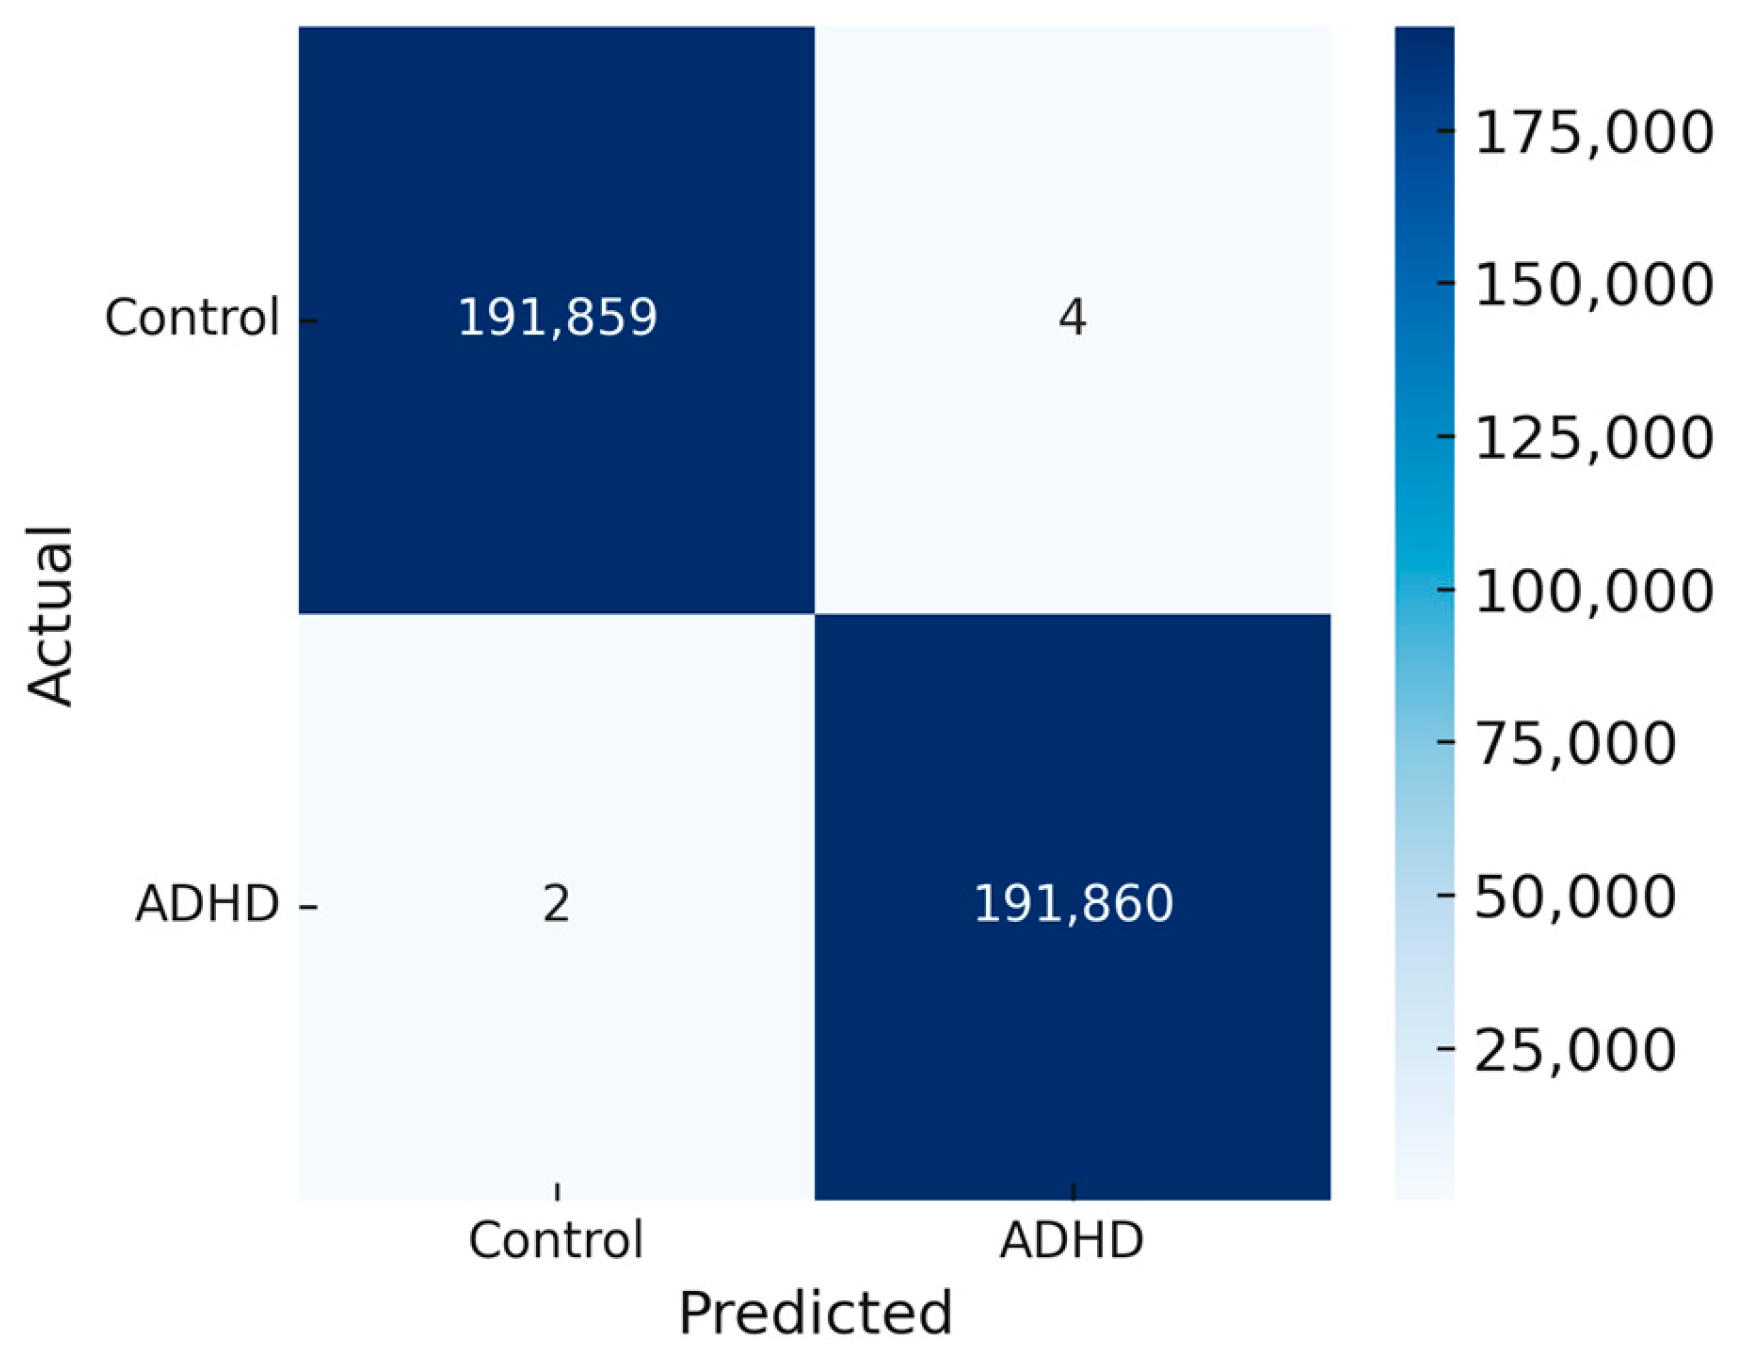
4.3. Confusion Matrix Analysis

To further evaluate the classification performance of the proposed models, confusion matrices were analyzed to provide insight into class-specific prediction accuracy and error distribution. Figure 16 demonstrates the classification outcomes of the CNN–LSTM model for EEG-based ADHD detection. The model classified 191,275 control samples and 188,814 ADHD samples accurately. However, it made 725 false-positive and 2912 false-negative errors. These classification results suggest that the model has high sensitivity and specificity. The fairly high number of false negatives at observations suggests ADHD cases are under-identified and that this model might be missing some ADHD-structured clues.
The confusion matrix in Figure 17 demonstrates exceptionally high classification accuracy between children with ADHD and the control group. An almost perfect diagonal is observed, with 190,808 correctly classified control samples and 191,684 correctly classified ADHD samples and only minimal misclassifications (1055 false positives and 178 false negatives, respectively). This is a sign of very low levels of both false positives and false negatives, pointing to the model’s high capacity for differentiating between structurally similar signal patterns. These findings validate that the CNN–GRU–LSTM combination of architectures achieves excellent generalization performance on the validation set, which is essential for clinical utility.
Figure 18 illustrates the classification results of the transformer model 2× on the test set. The value 131,211 represents correctly identified typically developing children (true negatives), while 159,881 corresponds to correctly classified ADHD cases (true positives). The model produced 60,652 false positives (control misclassified as ADHD) and 31,981 false negatives (ADHD misclassified as control).
Figure 19 presents the confusion matrix of the transformer model 3×. Both classes show good classification performance, as seen from the diagonal values, with 134,802 correctly classified control samples and 151,182 correctly classified ADHD samples. Although overall accuracy is high, the model has now been shown to not only misclassify control samples but also ADHD samples at a significant rate, which is a concern with respect to its clinical utility unless additional calibration or regularization is undertaken.
Figure 20 presents the confusion matrix of the spatiotemporal transformer model. The matrix reveals excellent classification performance across both classes, with 191,822 control samples and 191,858 ADHD samples correctly classified. Just 41 control cases were incorrectly classified as ADHD, and four ADHD cases were incorrectly classified as control, indicating a very dependable decision boundary. This very low misclassification rate demonstrates the model’s outstanding capacity to generalize between classes, furthering its prospects for clinical utility in EEG-based ADHD diagnosis with little chance of diagnostic mistake.
Figure 21 illustrates the confusion matrix of the hybrid CNN–RNN–transformer model, showcasing almost flawless classification performance. It correctly classifies 191,859 control samples and 191,860 ADHD samples and misclassifies just 4 control samples and 2 ADHD samples. Such negligible error rates reflect an extremely high degree of generalization and class discrimination. In comparison to other models assessed, the hybrid architecture has the lowest misclassification rate, which further strengthens its clinical validity and practical reliability for EEG-based ADHD detection.
To complement standard classification metrics, we conducted a detailed analysis based on the confusion matrices of each model. This allowed us to evaluate model behavior in terms of false positives and false negatives, which are particularly critical in clinical diagnostics. We extracted four performance indicators from each confusion matrix: specificity (true negative rate), balanced accuracy (sensitivity and specificity average), Cohen’s Kappa (chance-corrected agreement), and MCC, which includes all entries of the confusion matrix and is insensitive to class imbalance. These measures provide a more detailed picture of model reliability, especially for discriminating children with ADHD from TD controls (Table 4).
The confusion matrix-based measurements show that the hybrid CNN–RNN–transformer model provides the strongest and most stable performance across all compared architectures, with close-to-perfect specificity (0.999995), balanced accuracy (0.999943), Cohen’s Kappa (0.999886), and MCC (0.999886). This suggests excellent agreement with ground truth and remarkable generalization across both the control and ADHD groups. The spatiotemporal transformer also shows excellent diagnostic reliability, with all major evaluation metrics greater than 0.999, testifying to its efficacy in capturing spatial topography and intricate temporal dependencies in multichannel EEG.
Conversely, the transformer encoder models (2× and 3×)—although obtaining high accuracy in cross-validation—demonstrate significantly lower generalization power, with specificity of 0.8410 and 0.7880, and balanced accuracy below 0.77, indicating a bias toward false positives when classifying control subjects. Such performance disparity indicates the difficulty of using pure transformer models in clinical EEG applications with inadequate regularization or calibration.
The CNN–GRU–LSTM model sustains high and stable performance on all measures, with balanced accuracy of 0.9968 and Cohen’s Kappa of 0.9936, thus outperforming the CNN–LSTM baseline with evidently lower scores overall. Together, these results highlight that although attention mechanisms help in deep representations, hybrid architectures integrating CNN, GRU, LSTM, and transformer modules provide the most reliability, interpretability, and clinical feasibility for EEG-based ADHD diagnosis.
Although transformer encoders were accurate under cross-validation, repeated train–test experiments manifested large performance variations over test splits (std = 2.1%). Such variability is a sign of high sensitivity to data split and implies that the degradation in performance on the test set is not accidental. By comparison, the hybrid CNN–RNN–transformer had low variance (std = 0.3%) across experiments, reinforcing its better generalization capacity.

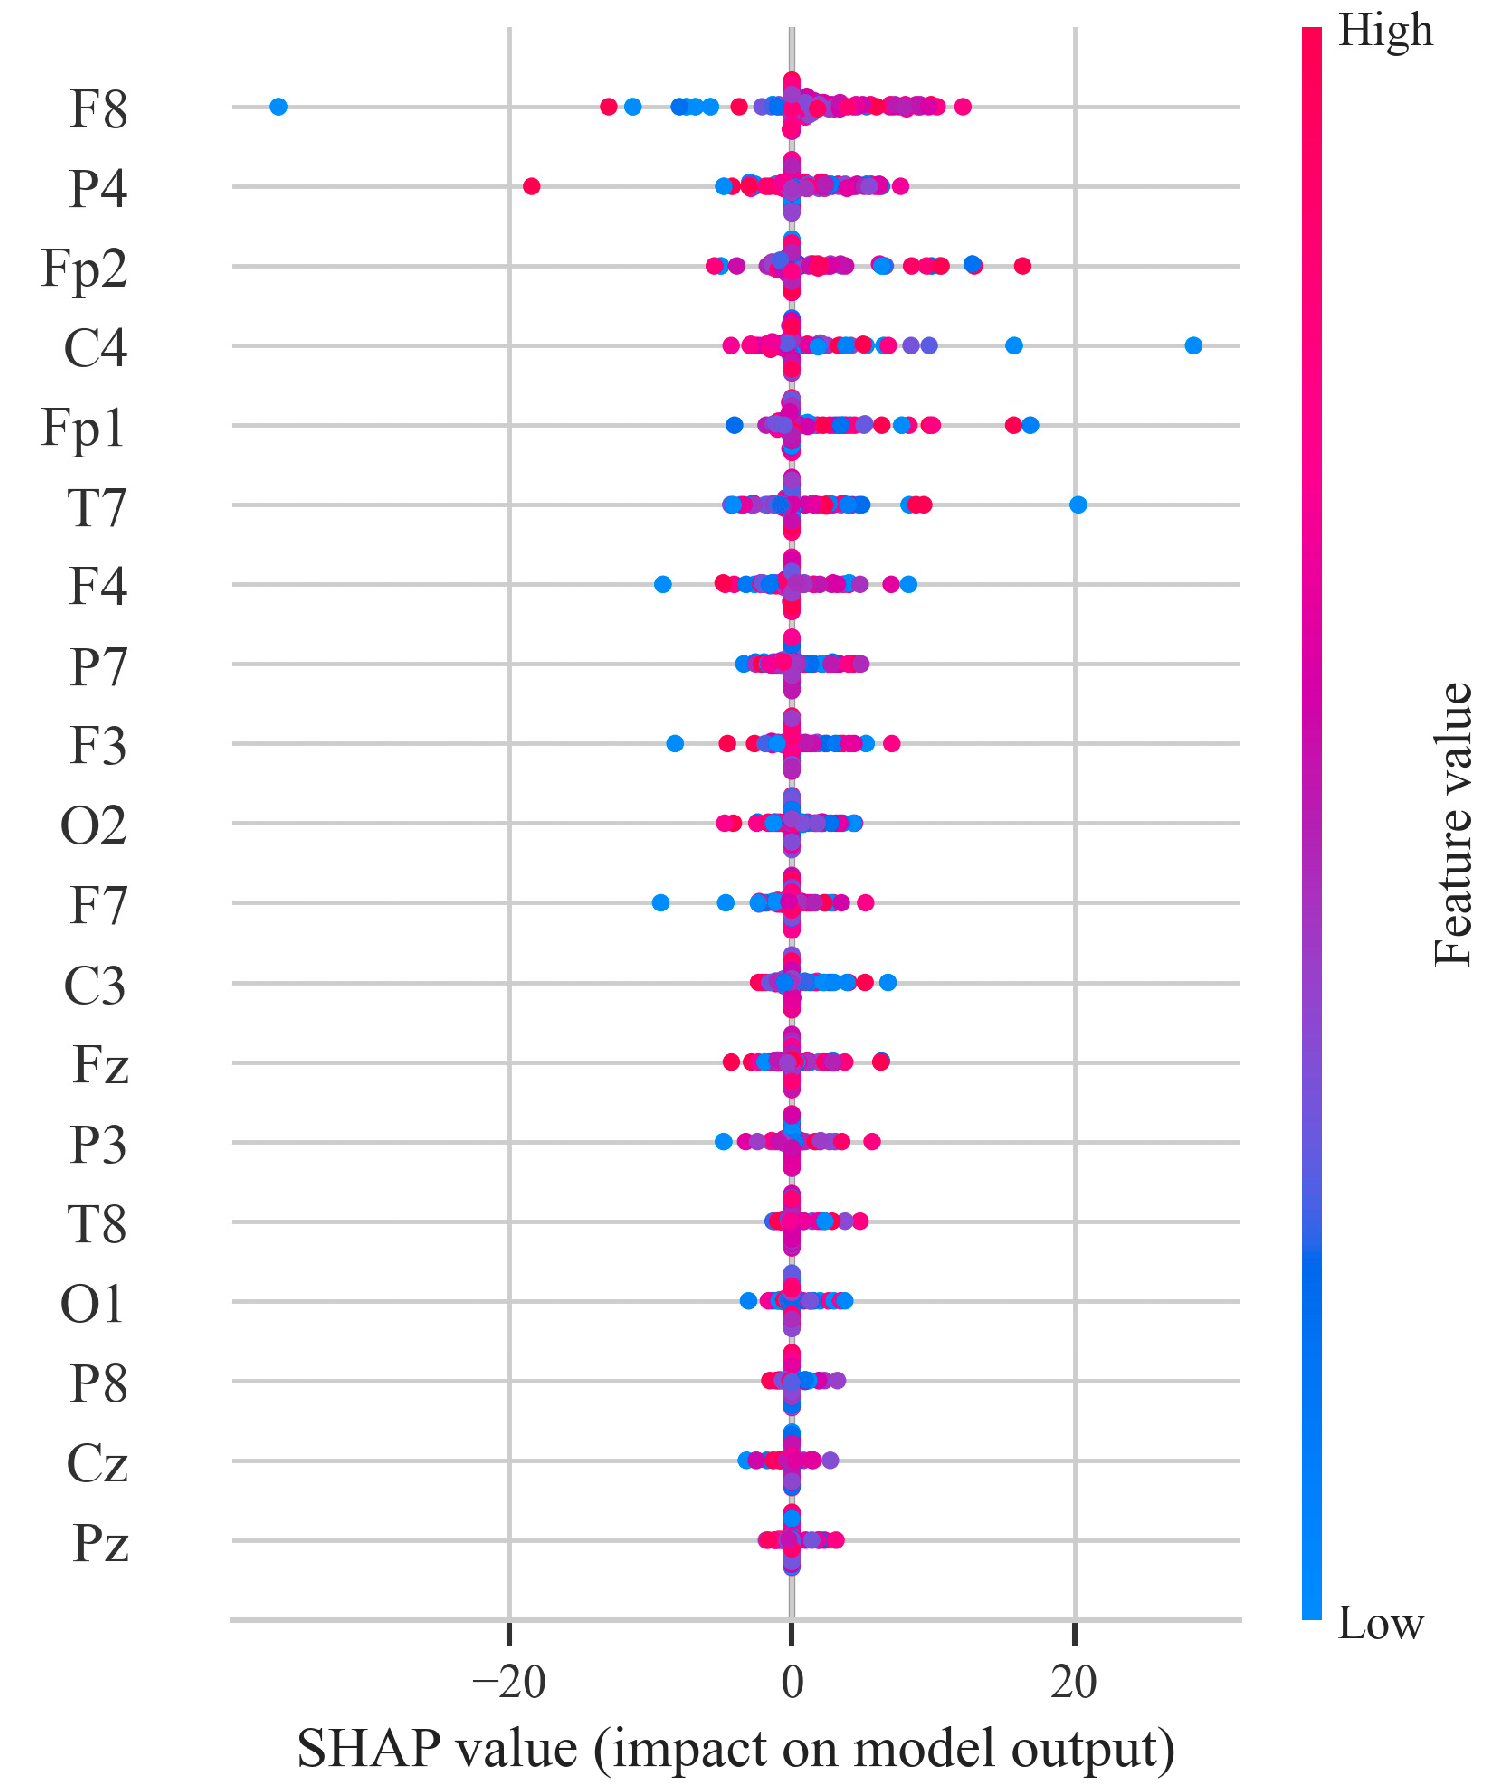
4.4. SHAP-Based Feature Importance

To interpret the model’s predictions, SHAP were applied, providing insights into the relative importance of individual EEG features. As illustrated in Figure 22, the SHAP summary plot displays the contribution of each of the 19 EEG channels to the final prediction of the trained CNN-LSTM hybrid model. The names of the channels are plotted on the vertical axis, and the SHAP values that reflect the contribution of each feature to the model’s decision-making are plotted on the horizontal axis. A color gradient is utilized to display the feature value range, from low (blue) to high (red). It is noteworthy that the underlying fundamental features were extracted from electrodes positioned over the frontal and central regions, in line with current neuroscientific research that implicates these areas in disrupted attention and executive function in individuals diagnosed with ADHD. The level of interpretability means that the model’s findings have a foundation in neurophysiological mechanisms, and as such, they are more trustworthy to implement in clinical diagnostic practice. The horizontal dot plots displayed in the SHAP summary plot represent the distribution of SHAP values attributed to each sample in the dataset. The distribution of points along the X-axis illustrates that changes in the value of a given EEG channel impact the distribution of the model’s probability of predicting a sample as representing ADHD. A point’s distance from the center represents the size of the feature’s influence. For instance, large values of amplitude in the Fp1 channel (red dots on the right) have the effect of inclining the model towards the prediction of “ADHD”, while small values have the opposite effect. The same pattern is seen in the F8, P4, Fp2, and C4 channels, which are indicated as some of the most significant features based on importance.
ADHD is characterized by strong SHAP values, and the presence of channels in the frontal and temporo-occipital areas suggests that these brain regions are responsible for controlling attention and executive functions, which is consistent with established neurophysiological features.
Figure 23 illustrates the SHAP value distribution for EEG features used by the regularized hybrid CNN-GRU-LSTM model. ADHD neurophysiology patterns are most characterized by the dominant channels, including Fp1, F8, F4, C3, and P7, which are predominantly located in the frontal (and temporal) regions. ADHD diagnosis can be influenced by the magnitude of SHAP changes in the Fp1 channel, which is both positive and negative. The direction of the deviation affects the likelihood of ADHD being detected. Such behaviors demonstrate the intricate nature of neural network decision-making through frontal brain activity. In contrast to the baseline architecture, the SHAP values in this model have a wider range of approximately −10 to +10. It is noteworthy that the results show more equal use of features and less attention given to individual channels. Such a pattern is likely the result of incorporating L2 regularization and batch normalization, which promote more stable feature contributions and enhance the overall robustness of the model.
The SHAP analysis reveals significant variations in feature robustness and interpretability between the baseline CNN–LSTM model and the enhanced CNN–GRU–LSTM architecture with regularization. In the baseline model, SHAP values were highly dispersed (reaching up to 25), indicating a greater reliance on individual, potentially noisy features and a lack of consistent focus across the EEG signal. In contrast, the proposed model exhibited a more compact and focused SHAP value distribution (within a range of 10), reflecting improved generalization and reduced overfitting. This effect can be attributed to the combined application of batch normalization, dropout, and L2 regularization, along with the architectural inclusion of GRU units, which collectively help to stabilize learning and guide attention toward more meaningful features.
Importantly, the most contributory EEG channels recognized by SHAP in the optimized model were also predominantly situated in the fronto-central and frontal areas (e.g., F3, Fz, and FCz), which are inherently implicated in executive function, response inhibition, and sustained attention as cognitive processes that are typically disrupted in patients with ADHD. Interestingly, higher SHAP values were quantified in task periods demanding response inhibition, which further confirmed the clinical validity of the model in recognizing neural processes. The results not only confirm previous neurophysiological findings but also demonstrate the potential of SHAP-based interpretability for providing model predictions as clinically relevant information, thereby enhancing transparency and trust in AI-supported EEG diagnosis.

5. Discussion

5.1. Comparison with Previous Studies

This study aimed to address key challenges in EEG-based ADHD classification by proposing and evaluating a suite of deep learning architectures that integrate spatial, temporal, and global contextual information from multichannel EEG recordings. Compared with existing approaches relying on handcrafted features [11] or spatial-only CNN models [12], our results demonstrate that combining multiple deep learning paradigms—specifically, convolutional, recurrent, and attention-based modules—significantly enhances classification performance and interpretability, particularly when applied to task-evoked EEG signals.
The suggested CNN–GRU–LSTM architecture significantly outperformed the baseline CNN–LSTM model on all evaluation metrics. That is, it recorded an average accuracy of 99.58% versus 92.36%, F1-score of 0.9998 vs. 0.919, and AUC of 0.9963 vs. 0.941, respectively. The significant improvement margins are a testament to the hybrid model’s capacity to learn both short- and long-term temporal dependencies simultaneously through GRU and LSTM layers, respectively, while the CNN components capture localized spatial features effectively. These findings are consistent with earlier studies by Britto et al. [16] and Yang et al. [17], which emphasize the diagnostic value of modeling EEG’s spatiotemporal structure.
In contrast, although the transformer encoder (2× and 3×) models achieved moderately high performance during cross-validation, they exhibited poor generalization and reduced clinical reliability, with accuracy ranging from 70% to 77%, F1-scores ranging from 0.3692 to 0.4465, and AUC values between 0.7838 and 0.8570. These results were accompanied by low specificity (as low as 0.788) and unstable performance across test folds, highlighting a tendency toward overfitting and sensitivity to partitioning. The spatiotemporal transformer solved some of these problems with the addition of 2D positional encoding. It attained a more balanced classification with an accuracy of over 99.98%. Also, F1-scores were nearly 0.9999, and AUC values were around 1.000. This confirms that the model can capture spatial topography and subtle temporal patterns in EEG signals. The most stable results and consistent diagnoses were obtained using the hybrid CNN–RNN–transformer model with incorporated CNN, GRU–LSTM, and transformer blocks, which were unified into a single framework. This model provided the best performance on all metrics, achieving accuracy above 99.98%, F1-scores greater than 0.9999, and perfect precision and MCC. This model’s performance also proved its reliability across various data splits in comparison to the high variance seen in transformer-only models. These findings prove that architectural hybridization allows for the integration of spatial, temporal, and global contextual learning adaptation, providing a clinically practical and transparent solution for ADHD classification based on EEG signals.
The interpretability analysis using SHAP values further reinforced the relevance of specific EEG channels (Fp1, F8, and P4), consistent with prior findings on the involvement of frontal and temporoparietal regions in attention regulation and executive function in ADHD [4,5,6]. Moreover, regularization components, such as dropout and batch normalization, were shown to enhance SHAP stability, contributing to model generalization and transparency.
Compared to prior studies using opaque deep learning models or lacking post hoc explanation methods [13,14], our work contributes a more interpretable and clinically aligned diagnostic framework. Additionally, by using task-evoked EEG data, the present study builds on the observations of Azami et al. [19], who emphasized the value of cognitive-load paradigms for eliciting diagnostically relevant neural responses.
In conclusion, the findings demonstrate that although transformer-based models provide global context modeling, they are surpassed by hybrid methods that fuse temporal, spatial, and attention mechanisms. The hybrid CNN–RNN–transformer model achieves a new State of the Art in EEG-based ADHD classification, providing a very accurate, robust, and interpretable solution with potential clinical implementation in pediatric neurodevelopmental screening.

5.2. Limitations and Challenges

In spite of the heartening performance of the suggested models, a number of limitations must be noted that can affect their generalizability and everyday deployment. In the first place, the dataset employed for this research was task-evoked and well-balanced but also small in terms of size and demographic diversity. This drawback may impair the generalizability of the model to a wider group of clinical populations with diverse ages, the presence of more than a single comorbidity, and various EEG acquisition techniques. Collaboration across multiple sites and cultures should be pursued for enhancing external validity. Second, while transformer-based models achieved remarkable results during cross-validation, they suffered from performance inconsistency on separate test partitions. This asymmetry indicates over-sensitivity to distribution shifts and potential overfitting to validation-marked folds. Sophisticated regularization techniques, domain adaptation, or ensemble techniques might be required for obtaining strong generalization in practical situations. Third, the SHAP-based interpretability framework, though helpful for post-analysis, is unable to offer a full explanation for the dynamics at play due to the fact that it fails to record how EEG signals progress temporally with regard to the classification tasks. Future research could pursue the use of intrinsically interpretable models or temporal attention models that explain in real-time the reasons for model predictions at every step in a sequence.
Last but not least, the computational requirements of the suggested hybrid model—specifically arising from the use of convolutional, recurrent, and attention-based layers—continue to be non-negligible. Excessive training time and resource usage could restrict the model’s viability for low-resource setups or real-time usage. Model pruning, quantization, and knowledge distillation are optimizations that need to be investigated to facilitate implementation on handheld EEG recorders or clinical equipment.

5.3. Future Research Directions

Following the insights gained from this research, some elements in deep learning frameworks for EEG-based ADHD diagnostics can be explored further to improve their clinical applicability, scalability, and scientific rigor.
As a primary step, further research should focus on multicenter EEG datasets with diverse demographics, expanding age ranges, comorbid conditions such as ASD and anxiety, and including different task paradigms.
Second, in order to tackle the noted instability of transformer-based models on unseen test splits, future research can combine domain generalization and transfer learning approaches. Models fine-tuned across standalone datasets or investigating domain-invariant feature learning can potentially reduce sensitivity to data distribution shifts.
Third, there should be attempts to build explainability into the model architecture itself rather than relying on post hoc analysis. Methods such as attention visualization, concept bottleneck models, or modular interpretable networks can potentially offer real-time insight into decision processes, which would enhance clinician trust and model transparency.
Fourth, because of the computational expense of hybrid architectures, model compression methods—pruning, quantization, knowledge distillation, or lightweight neural design—should be investigated for implementation on mobile EEG devices or embedded clinical devices. This would particularly be valuable in low-resource or point-of-care settings. Finally, generalizing the diagnostic framework to multimodal data fusion, i.e., combining EEG with eye-tracking, behavioral measurements, or genetic markers, can render more specific information regarding neurodevelopmental trajectories and further enhance classification performance and interpretability.

6. Conclusions

This study proposed a novel, interpretable deep learning framework for EEG-based diagnosis of ADHD in children. By integrating CNN, recurrent (GRU and LSTM), and transformer components, the study systematically evaluated a range of architectures—from baseline CNN–LSTM and CNN–GRU–LSTM models to transformer encoders, a spatiotemporal transformer, and the newly introduced hybrid CNN–RNN–transformer model. Among all architectures, the hybrid CNN–GRU–LSTM model outperformed conventional recurrent models by capturing both short- and long-term temporal dependencies alongside robust spatial features. While transformer-based models demonstrated impressive accuracy during cross-validation, they exhibited limitations in generalization, particularly due to a high false positive rate and reduced specificity. The spatiotemporal transformer partially addressed these issues through the use of 2D positional encoding, yielding near-perfect performance on several metrics. Nonetheless, the proposed hybrid CNN–RNN–transformer model outperformed others on all metrics evaluated, i.e., accuracy, F1-score, AUC, MCC, and class balance. The model’s multi-faceted synergistic architecture provides the ability to capture localized, local, and global temporal dependencies at the same time. Also, SHAP-based interpretability confirms the interpretable importance of certain EEG regions relevant to ADHD pathophysiology. Notably, the CNN–GRU–LSTM model demonstrates strong diagnostic reliability with low variance, offering an efficient and interpretable alternative to more complex transformer-based architectures.
In summary, this study provides a strong foundation for the ADHD detection system using EEG by automating the processes and making it interpretable at the same time, facilitating the development of transparent AI-powered technology in pediatric neurodiagnostics.

Author Contributions

Conceptualization, M.B., M.A., M.K., L.A., and U.S.; methodology, M.B., M.K., R.B., and A.K.; software, M.A., M.O., and M.K.; validation, M.A., and U.S.; formal analysis, M.A., M.K., Z.S., and G.U.; investigation, M.B., M.K., L.A., and Z.S.; resources, M.A., U.S., and M.O.; data curation, M.O. and G.U.; writing—original draft preparation, M.B. and M.K.; writing—review and editing, M.B., M.K., and L.A.; visualization, M.B., M.A., and M.K.; supervision, M.B.; project administration, M.B. and M.A.; funding acquisition, M.K. All authors have read and agreed to the published version of the manuscript.

Funding

This research has been funded by the Committee of Science of the Ministry of Science and Higher Education of the Republic of Kazakhstan (Grant No. AP26105045 “Development of artificial intelligence models and algorithms for analyzing social signals in children with autism”).

Data Availability Statement

The dataset used in this study was collected by Shahed University and is publicly accessible via the IEEE DataPort repository at https://ieee-dataport.org/open-access/eeg-data-adhd-control-children (accessed on 10 June 2025).

Acknowledgments

Throughout the preparation of this manuscript, the authors used the OpenAI GPT-4 model for the purposes of linguistic enhancement and text editing. The authors have reviewed and edited the generated output carefully and are entirely responsible for the contents of this publication.

Conflicts of Interest

The authors declare no conflicts of interest.

Abbreviations

The following abbreviations are used in this manuscript:
ADHDAttention Deficit Hyperactivity Disorder
EEGElectroencephalography
SHAPSHapley Additive exPlanations
ICAIndependent Component Analysis
PCAPrincipal Component Analysis
TDTypically Developing
APIApplication Programming Interface
PSDPower Spectral Density
ROCReceiver Operating Characteristic
ReLURectified Linear Unit
DLDeep Learning
LSTMLong Short-Term Memory
GRUGated Recurrent Unit

References

  1. Polanczyk, G.V.; Salum, G.A.; Sugaya, L.S.; Caye, A.; Rohde, L.A. Annual Research Review: A Meta-Analysis of the Worldwide Prevalence of Mental Disorders in Children and Adolescents. J. Child Psychol. Psychiatry 2015, 56, 345–365. [Google Scholar] [CrossRef] [PubMed]
  2. Faraone, S.V.; Banaschewski, T.; Coghill, D.; Zheng, Y.; Biederman, J.; Bellgrove, M.A.; Rohde, L.A. The World Federation of ADHD International Consensus Statement: 208 Evidence-Based Conclusions about the Disorder. Neurosci. Biobehav. Rev. 2021, 128, 789–818. [Google Scholar] [CrossRef] [PubMed]
  3. French, B.; Sayal, K.; Daley, D. Barriers and Facilitators to Understanding of ADHD in Primary Care: A Mixed-Method Systematic Review. Eur. Child Adolesc. Psychiatry 2019, 28, 1037–1064. [Google Scholar] [CrossRef] [PubMed]
  4. Johnstone, S.J.; Jiang, H.; Sun, L.; Rogers, J.M.; Valderrama, J.; Zhang, D. Development of Frontal EEG Differences between Eyes-Closed and Eyes-Open Resting Conditions in Children: Data from a Single-Channel Dry-Sensor Portable Device. Clin. EEG Neurosci. 2021, 52, 235–245. [Google Scholar] [CrossRef] [PubMed]
  5. Liu, X.; Sun, L.; Zhang, D.; Wang, S.; Hu, S.; Fang, B.; Wang, S. Phase-Amplitude Coupling Brain Networks in Children with Attention-Deficit/Hyperactivity Disorder. Clin. EEG Neurosci. 2022, 53, 399–405. [Google Scholar] [CrossRef] [PubMed]
  6. Gartstein, M.A.; Hancock, G.R.; Potapova, N.V.; Calkins, S.D.; Bell, M.A. Modeling Development of Frontal Electroencephalogram (EEG) Asymmetry: Sex Differences and Links with Temperament. Dev. Sci. 2020, 23, e12891. [Google Scholar] [CrossRef] [PubMed]
  7. Neurofeedback Collaborative Group. Neurofeedback for Attention-Deficit/Hyperactivity Disorder: 25-Month Follow-Up of Double-Blind Randomized Controlled Trial. J. Am. Acad. Child Adolesc. Psychiatry 2023, 62, 435–446. [Google Scholar] [CrossRef] [PubMed]
  8. Roy, Y.; Banville, H.; Albuquerque, I.; Gramfort, A.; Falk, T.H.; Faubert, J. Deep Learning-Based Electroencephalography Analysis: A Systematic Review. J. Neural Eng. 2019, 16, 051001. [Google Scholar] [CrossRef] [PubMed]
  9. Craik, A.; He, Y.; Contreras-Vidal, J.L. Deep Learning for Electroencephalogram (EEG) Classification Tasks: A Review. J. Neural Eng. 2019, 16, 031001. [Google Scholar] [CrossRef] [PubMed]
  10. Chugh, N.; Aggarwal, S.; Balyan, A. The Hybrid Deep Learning Model for Identification of Attention-Deficit/Hyperactivity Disorder Using EEG. Clin. EEG Neurosci. 2024, 55, 22–33. [Google Scholar] [CrossRef] [PubMed]
  11. Maniruzzaman, M.; Hasan, M.A.M.; Asai, N.; Shin, J. Optimal channels and features selection based ADHD detection from EEG signal using statistical and machine learning techniques. IEEE Access 2023, 11, 33570–33583. [Google Scholar] [CrossRef]
  12. Altun, S.; Alkan, A.; Altun, H. Automatic diagnosis of attention deficit hyperactivity disorder with continuous wavelet transform and convolutional neural network. Clin. Psychopharmacol. Neurosci. 2022, 20, 715. [Google Scholar] [CrossRef] [PubMed]
  13. Jahani, H.; Safaei, A.A. Efficient deep learning approach for diagnosis of attention-deficit/hyperactivity disorder in children based on EEG Signals. Cogn. Comput. 2024, 16, 2315–2330. [Google Scholar] [CrossRef]
  14. Khare, S.K.; Acharya, U.R. An explainable and interpretable model for attention deficit hyperactivity disorder in children using EEG signals. Comput. Biol. Med. 2023, 155, 106676. [Google Scholar] [CrossRef] [PubMed]
  15. Manjunatha, H.; Esfahani, E.T. Extracting interpretable EEG features from a deep learning model to assess the quality of human-robot co-manipulation. In Proceedings of the 2021 10th International IEEE/EMBS Conference on Neural Engineering (NER), Online, 4–6 May 2021; pp. 339–342. [Google Scholar] [CrossRef]
  16. KR, A.B.; Srinivasan, S.; Mathivanan, S.K.; Venkatesan, M.; Malar, B.A.; Mallik, S.; Qin, H. A multi-dimensional hybrid CNN-BiLSTM framework for epileptic seizure detection using electroencephalogram signal scrutiny. Syst. Soft Comput. 2023, 5, 200062. [Google Scholar] [CrossRef]
  17. Yang, D.; Liu, Y.; Zhou, Z.; Yu, Y.; Liang, X. Decoding visual motions from EEG using attention-based RNN. Appl. Sci. 2020, 10, 5662. [Google Scholar] [CrossRef]
  18. Omar, S.M.; Kimwele, M.; Olowolayemo, A.; Kaburu, D.M. Enhancing EEG signals classification using LSTM-CNN architecture. Eng. Rep. 2024, 6, e12827. [Google Scholar] [CrossRef]
  19. Azami, H.; Mirjalili, M.; Rajji, T.K.; Wu, C.T.; Humeau-Heurtier, A.; Jung, T.P.; Liu, Y.H. Electroencephalogram and Event-Related Potential in Mild Cognitive Impairment: Recent Developments in Signal Processing, Machine Learning, and Deep Learning. IEEE J. Sel. Areas Sensors 2025, 2, 162–184. [Google Scholar] [CrossRef]
  20. Zhang, Z.; Li, X. Use transfer learning to promote identification ADHD children with EEG recordings. In Proceedings of the 2019 Chinese Automation Congress (CAC), Hangzhou, China, 22–24 November 2019; IEEE: New York, NY, USA, 2019; pp. 2809–2813. [Google Scholar] [CrossRef]
Figure 1. Class distribution in EEG dataset.
Algorithms 18 00453 g001
Figure 2. PSD patterns across EEG bands and channels in control and ADHD groups.
Algorithms 18 00453 g002
Figure 3. Functional network comparison across thresholds in ADHD and control groups.
Algorithms 18 00453 g003
Figure 4. Hybrid CNN-LSTM model for EEG classification.
Algorithms 18 00453 g004
Figure 5. CNN-GRU-LSTM model architecture for EEG classification.
Algorithms 18 00453 g005
Figure 6. Architecture of transformer encoder (2× blocks) model used for EEG-based ADHD classification.
Algorithms 18 00453 g006
Figure 7. Architecture of transformer encoder (3× blocks) model for EEG-based ADHD classification.
Algorithms 18 00453 g007
Figure 8. Architecture of spatiotemporal transformer model.
Algorithms 18 00453 g008
Figure 9. Architecture of hybrid CNN–RNN–transformer model for EEG-based ADHD classification.
Algorithms 18 00453 g009
Figure 10. Feature importance determined by XGBoost.
Algorithms 18 00453 g010
Figure 11. Schematic overview of EEG data processing and hybrid model training for ADHD detection.
Algorithms 18 00453 g011
Figure 12. Raw EEG signals for control class.
Algorithms 18 00453 g012
Figure 13. Topographic maps of ICA components for EEG in control class.
Algorithms 18 00453 g013
Figure 14. Raw EEG signals for ADHD class.
Algorithms 18 00453 g014
Figure 15. Topographic maps of ICA components for EEG in ADHD class.
Algorithms 18 00453 g015
Figure 16. Confusion matrix of CNN–LSTM model for EEG-based ADHD classification.
Algorithms 18 00453 g016
Figure 17. Confusion matrix of CNN + GRU + LSTM model for EEG-based ADHD classification.
Algorithms 18 00453 g017
Figure 18. Confusion matrix of transformer encoder model with 2 stacked encoder blocks.
Algorithms 18 00453 g018
Figure 19. Confusion matrix of transformer encoder model with 3 stacked encoder blocks.
Algorithms 18 00453 g019
Figure 20. Confusion matrix for spatiotemporal transformer model.
Algorithms 18 00453 g020
Figure 21. Confusion matrix for hybrid CNN–RNN–transformer model.
Algorithms 18 00453 g021
Figure 22. SHAP analysis of feature importance in hybrid CNN-LSTM model.
Algorithms 18 00453 g022
Figure 23. SHAP-based interpretation of EEG feature importance in the regularized hybrid CNN-GRU-LSTM model.
Algorithms 18 00453 g023
Table 1. Summary of related studies on EEG-based ADHD classification.
RefStudy FocusMethodsKey FindingsIdentified Gaps
[11]Entropy-based feature extractionRandom forest classifierAchieved 97.53% accuracyNo interpretability; lacks temporal modeling
[12]Time–frequency EEG representation for ADHDWavelet transform + deep CNNRobust session-level accuracySpatial focus only; no temporal dynamics
[13]Neuro-motor pattern analysisTwo-dimensional tracking + CNNIdentified motor planning deficitsEEG used indirectly; no EEG dynamics analyzed
[14]Explainable AI in ADHD detectionSHAP, LIME, saliency mapsEnhanced clinician interpretabilityNot combined with deep models
[15]Mental state classification with explainable DLCNN + attention + SHAPAchieved interpretable 91% accuracyGeneral mental state decoding, not ADHD-specific
[16]Spatiotemporal hybrid modeling in ADHDCNN + BiLSTMOutperformed conventional CNN and LSTMNo interpretability; no SHAP
[17]Attention-based neural decodingCNN + GRU + AttentionImproved detection of task-relevant EEG activityFocused on general cognition, not ADHD
[18]Importance of preprocessing in EEG classificationICA + CNN-LSTMFiltering and epoching improved model performanceNo real-time classification
[19]Task-based EEG learning for ADHDCognitive task EEG + CNNTask-evoked EEG provided better discriminationNo interpretability features included
[20]Transfer learning in EEG ADHD classificationPretrained CNN + fine-tuningReduced training time with high accuracy (93%)Requires pretraining on large datasets
Table 2. Average classification performance metrics across 5-fold-stratified cross-validation for all evaluated models.
ModelFoldAccuracy (%)PrecisionRecallF1-ScoreAUC
CNN–LSTMFold 191.200.890.920.9050.934
Fold 292.500.910.930.9200.945
Fold 393.100.920.940.9300.948
Fold 491.800.900.920.9100.938
Fold 593.200.910.950.9300.941
CNN–GRU–LSTMFold 10.99650.99800.99490.99630.9998
Fold 20.99630.99870.99400.99620.9999
Fold 30.99650.99760.99540.99650.9998
Fold 40.99560.99870.99260.99560.9996
Fold 50.99680.99910.99450.99680.9999
Transformer Encoder (2×)Fold 10.75610.77020.73000.42390.8450
Fold 20.76700.92280.58270.36920.8547
Fold 30.72850.78980.62280.38590.8126
Fold 40.77000.80040.71940.42020.8570
Fold 50.77100.78300.76500.44650.8570
Transformer Encoder (3×)Fold 10.73580.75270.70240.41380.8158
Fold 20.70580.70300.71280.41820.7838
Fold 30.76740.77710.74990.43050.8547
Fold 40.75550.83610.63560.39020.8407
Fold 50.74840.77230.71230.42100.8301
Spatiotemporal TransformerFold 10.99971.00000.99950.99970.9999
Fold 20.99980.99980.99960.99970.9997
Fold 30.99981.00000.99990.99991.0000
Fold 40.99981.00000.99980.99990.9997
Fold 50.99991.00000.99990.99991.0000
Hybrid CNN–RNN–TransformerFold 10.99981.00000.99980.99991.0000
Fold 20.99981.00000.99990.99991.0000
Fold 30.99991.00000.99990.99991.0000
Fold 40.99981.00000.99990.99991.0000
Fold 50.99991.00000.99990.99991.0000
Table 3. Average ± standard deviation of classification metrics across 5-fold cross-validation for all models.
ModelAccuracy (%)PrecisionRecallF1-ScoreAUC
CNN–LSTM92.36 ± 0.790.906 ± 0.0110.932 ± 0.0110.919 ± 0.0100.941 ± 0.005
CNN–GRU–LSTM99.63 ± 0.040.998 ± 0.00060.994 ± 0.00110.996 ± 0.00040.9998 ± 0.0001
Transformer Encoder (2×)75.85 ± 1.590.813 ± 0.05560.684 ± 0.06920.409 ± 0.02780.845 ± 0.0169
Transformer Encoder (3×)74.26 ± 2.110.768 ± 0.04300.703 ± 0.03720.415 ± 0.01340.825 ± 0.0242
Spatiotemporal Transformer99.88 ± 0.110.9996 ± 0.00010.9997 ± 0.00010.9998 ± 0.00010.9999 ± 0.00015
Hybrid CNN + GRU + LSTM99.63 ± 0.040.998 ± 0.00050.994 ± 0.00100.996 ± 0.00040.9999 ± 0.0000
Hybrid CNN–RNN–Transformer99.99 ± 0.0051.0000 ± 0.00000.9999 ± 0.000040.9999 ± 0.000031.0000 ± 0.0000
Table 4. Confusion matrix-derived metrics: specificity, balanced accuracy, Cohen’s Kappa, and MCC for all models.
ModelSpecificityBalanced AccuracyCohen’s KappaMCC
CNN–LSTM0.99620.99050.98100.9811
CNN–GRU–LSTM0.99910.99680.99360.9936
Transformer Encoder (2×)0.84100.76250.5190.531
Transformer Encoder (3×)0.78800.74530.49060.4924
Spatiotemporal Transformer0.99880.99990.99980.9998
Hybrid CNN–RNN–Transformer0.9999950.9999430.9998860.999886
Disclaimer/Publisher’s Note: The statements, opinions and data contained in all publications are solely those of the individual author(s) and contributor(s) and not of MDPI and/or the editor(s). MDPI and/or the editor(s) disclaim responsibility for any injury to people or property resulting from any ideas, methods, instructions or products referred to in the content.

