Abstract
As a key node in port logistics systems, ship anchorage is often faced with congestion caused by ship flow fluctuations, multi-priority scheduling imbalances and the poor adaptability of scheduling models to complex environments. To solve the above problems, this paper constructs a ship scheduling algorithm based on a Markov-modulated fluid priority queue, which describes the stochastic evolution of the anchorage operation state via a continuous-time Markov chain and abstracts the arrival and service processes of ships into a continuous fluid input and output mechanism modulated by the state. The algorithm introduces a multi-priority service strategy to achieve the differentiated scheduling of different types of ships and improves the computational efficiency and scalability based on a matrix analysis method. Simulation results show that the proposed model reduces the average waiting time of ships by more than 90% compared with the M/G/1/1 and RL strategies and improves the utilization of anchorage resources by about 20% through dynamic service rate adjustment, showing significant advantages over traditional scheduling methods in multi-priority scenarios.
1. Introduction
Against the background of economic globalization, the scale of international trade is growing rapidly. As a key hub in global logistics, the operation efficiency of ports is very important to the stability of regional and global supply chains and economic development. Ship transportation is responsible for more than 80% of global cargo transportation, and anchorage, as an important transition space before ships enter port, plays a key role in alleviating ship flow fluctuations and coordinating port operation rhythms. With the increasing frequency of shipping activities, the anchorage congestion problem is becoming more serious, which not only leads to long waiting times for ships [1] and low resource utilization [2] but also increases the operating costs and affects the timeliness of the supply chain. Especially in the case of multi-type ships arriving at the port, reasonably arranging the dispatching sequences of multi-priority ships becomes the key to improving the operation efficiency of anchorage. Therefore, the modeling and optimization of ship scheduling in anchorage is of great significance to alleviate congestion, reduce waiting costs, realize the efficient utilization of resources, and improve the port throughput capacity and service level.
The complexity of anchorage scheduling is mainly reflected in the need to satisfy multiple constraints and optimization objectives simultaneously. Anchorage scheduling should strictly follow the port operation plan and coordinate the waiting order and service priority among all types of ships. Because large container ships and tankers are highly sensitive to time and the anchorage capacity is relatively fixed, scheduling tasks face serious challenges. Ports are usually equipped with anchorage areas with different functions, and the use plan will be adjusted according to temporary needs to cope with the concentrated arrival of ships. In the anchorage dispatching system, the service capacity is often limited by natural conditions, which means that waiting ships often have to queue up. Therefore, three key dimensions need to be understood in the formulation of an anchorage dispatching scheme. The first one is the time window constraint [3]. The waiting time tolerance varies significantly among different types of ships, especially among refrigerated container ships and dangerous goods carriers. A slight scheduling delay may cause significant economic losses. The second one is the anchorage congestion problem. Due to the uncertainty of ship arrival times and the fluctuations in service times, congestion occurs from time to time. This delay will produce obvious conduction effects when ships arrive at ports in a dense manner, which will reduce the operation efficiency of the whole port system [4]. The third is the priority conflict problem; in the case of resource constraints, it is necessary to establish a scientific trade-off mechanism between the immediate service requirements of high-priority ships and the fair waiting rights of low-priority ships [5]. Current anchorage scheduling research still has obvious shortcomings in dealing with multi-priority dynamic balance and accurately predicting the waiting time. These limitations restrict the practical application effects of the scheduling system.
For the anchorage scheduling problem, traditional methods have obvious limitations in dealing with ship arrival randomness, uncertainty in service times, and multi-priority scheduling requirements. Based on Markov decision process theory [6,7], a novel anchorage scheduling optimization method is proposed in this paper. The Markov property [8] provides an important idea in solving this problem. By modeling the complex anchorage scheduling process as a decision-making process based on the current system state [9], the dynamic characteristics of the ship arrival and service process can be effectively captured. In particular, a continuous-time Markov chain (CTMC) model [10,11] can accurately describe the random evolution law of the anchorage resource allocation state and provide theoretical support for scheduling decisions. A ship scheduling algorithm based on a Markov-modulated fluid priority queue (SSA-BMMFPQ) is proposed based on the CTMC strategy. The main contributions are as follows:
(1) An anchorage resource scheduling framework based on fluid queue theory is proposed. The ship arrival and service process is modeled as a fluid input and output modulated by the state of the anchorage scheduling system. The exponential computation of the discrete queue model is avoided by continuous processing, and the scheduling computation complexity in complex scenarios is reduced.
(2) A CTMC is introduced to model the state change of the anchorage scheduling system, and the ship arrival process is modulated by the state transition matrix and rate matrix to describe the coupling relationship between the service capability and arrival flow, so as to improve the accuracy of environment modeling and the scheduling response capabilities.
(3) A priority queue service mechanism is designed to solve the resource competition problem in multi-priority ship scheduling at anchorage. By assigning independent fluid input and service weights to ships of different priority classes, the service rates of ships of different priority classes can be reasonably allocated under the condition of limited resources.
2. Materials and Methods
As a bottleneck in port efficiency, anchorage scheduling is a typical NP-hard problem whereby it is necessary to optimize the mooring sequence and service priority dynamically under the uncertainty of ship arrival and service durations and multi-priority constraints. From the perspective of research and development, this field has formed two major research paradigms: mathematical analytical modeling methods and intelligent algorithm methods.
Scheduling research based on mathematical analytical modeling methods laid an important theoretical foundation for this field. Early stochastic programming provided a potential solution for the high-dimensional cargo transportation resource allocation problem under a dynamic information environment by utilizing the natural structure of transportation problems [12]. By using the LP [13] and IP [14] mathematical programming techniques, a systematic theoretical framework for anchorage resource optimization was provided by constructing objective functions containing constraints, such as constraints on the ship arrival timing and service duration. Later, queuing theory was also applied to ship scheduling methods. Queuing theory provides systematic solutions to port congestion problems by analyzing ship arrival and service patterns, and it proposes policy recommendations to improve the port efficiency and competitiveness [15]. The M/M/1 and M/D/1 mixed queuing systems constructed by Hu et al. not only provide analytical optimization paths with deterministic service time modeling, but also effectively reduce the computational complexity [16]. Shi et al. introduced a general service time distribution based on the M/G/1 model, which significantly improved the adaptability to fluctuations in the actual operation time [17]. Moltzler et al.’s M/G/1/1 queuing model achieves theoretical efficiency optimization with fixed priorities and provides a reliable quantitative analysis tool for dealing with ship scheduling problems under multi-source input scenarios [18]. The method based on intelligent algorithms is also helpful for anchorage scheduling. Heuristic algorithms such as genetic algorithms [19] and particle swarm optimization [20] realize anchorage scheduling optimization by simulating natural evolution mechanisms, and they have feasibility in small and medium-sized scenes. The improved simulated annealing algorithm, ISA-CO, proposed by İlhan provides a new idea for anchorage scheduling. Its strategy of integrating crossover operators and local search can not only optimize the anchoring order and resource allocation but also effectively avoid premature convergence [21]. Y Nov proved that FCFS provides the optimal throughput under a certain compatibility graph in FCFS fluid model research, which provides important theoretical support for anchorage scheduling strategy optimization [22]. The SDQ test platform proposed by Aiman Nait Abbou reduces load imbalances through flow queue and path optimization, providing a technical reference for ship anchoring path planning and resource balance allocation in anchorage scheduling [23].
Although the traditional method has achieved some results in anchorage dispatching, it still has obvious shortcomings. Mathematical analytical modeling methods have limited adaptability to the randomness of ship arrivals and often face the problem of a rapid increase in computational complexity under multi-priority constraints, making it difficult to meet the real-time requirements of large-scale dynamic scheduling. Intelligent algorithms lack theoretical convergence proof, complex dynamic scenes make it easy to fall into local optima, the multi-priority hard constraint modeling ability is insufficient, the parameter dependence is strong, and scene migration is difficult. In recent years, the application of artificial intelligence technology in anchorage dispatching has shown new potential. For example, Hamdi constructed an online heuristic algorithm and an adaptive scheme based on reinforcement learning through decoupling subproblems in the green LoRa network, which could not only realize the reasonable allocation of multi-priority ship resources but also effectively balance the system energy consumption [24]. The deep learning model developed by Vadim et al. can accurately predict ship arrivals and service times, providing intelligent support for real-time scheduling decisions [25]. Christian et al. proposed a data-driven dynamic system modeling method to predict the evolution of the anchorage state by constructing a state space model, showing good prediction accuracy under conventional operation scenarios [26]. However, the existing intelligent methods still have the problem of insufficient adaptability when dealing with complex priority rules; moreover, there are limitations in data privacy protection, the generalization ability of the model is limited, the interpretability of the decision process is poor, it is difficult to respond to dynamic changes in priority in time, the assumption of system stationarity makes the prediction error larger in unexpected cases, and there is no effective priority guarantee mechanism. Table 1 shows the advantages and disadvantages of these methods for anchorage scheduling.

Table 1.
Comparison of ship dispatching methods.
Aiming at the problem of anchorage scheduling, the SSA-BMMFPQ model was further proposed on the basis of studying priority service multi-type fluid queues in the literature [27]. Through sensing the anchorage operation state, the ship input intensity is dynamically adjusted, and a priority adaptive service resource allocation mechanism is incorporated. While ensuring high-priority ship response efficiency, a fairness constraint is used to avoid low-priority queue jumping, so as to realize the collaborative optimization of the anchorage resource efficiency and service fairness.
3. Problem Modeling and Algorithm Modeling
3.1. Problem Description
In the process of ship anchorage dispatching, ships arrive at port anchorage one after another through multiple channels to wait for berthing. The scheduling system needs to make decisions based on the ship priority type (the higher the value, the higher the priority), the arrival rate of each type of ship, and the current system state of the anchorage . This covers different states, such as the remaining number of anchorages, the occupancy of berths, the queue lengths of ships with different priorities, and the port service efficiency. The generation matrix of the continuous-time Markov chain (CTMC) is used to determine, under this state, whether to arrange for the ship to enter the anchorage and wait, receive services immediately, or temporarily stay in the open sea. Due to the limited resources of the anchorage, when ships of type arrive continuously, their higher service priority means that they will quickly occupy the anchorage resources, causing ships of type to enter the anchorage in a disorderly manner. This will lead to the unreasonable occupation of resources and delay the system’s response to ships of type . This complex queuing phenomenon caused by the contradiction between the dynamic arrival of ships and the limited service resources makes it difficult for traditional scheduling methods to accurately predict the waiting times of ships, thus affecting the overall scheduling efficiency. In extreme cases, it may trigger a chain reaction delay in port operations.
3.2. Algorithm Modeling and Parameter Setting
The SSA-BMMFPQ proposed in this study realizes a priority response and the orderly control of the overall load for high-priority ships by modeling ships of different priority as independent fluid inputs modulated by the state and assigning service rates. Ships arrive from different channels, and the console controls them to enter the anchorage according to their arrival conditions. The anchorage condition is regulated by SSA-BMMFPQ. The algorithm model integrates a state transition table, a priority controller, model parameters, and control logic. Ships of different priority levels all operate under this system, as shown in Figure 1.
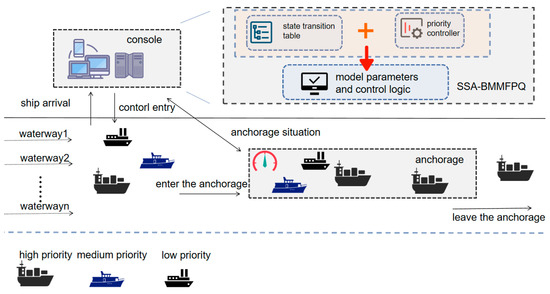
Figure 1.
Schematic diagram of multi-priority ship anchorage dispatching system.
SSA-BMMFPQ firstly introduces different task flows into corresponding service queues through a priority mechanism; each queue consists of multiple service nodes and processes tasks according to the set service rate. Based on this, the queue length is calculated by the matrix method, and the service time distribution is approximated by the Erlang method, so that the exact queue performance index is obtained. The waiting time is analyzed based on the queue length information, and the Laplace transform (LST) of the waiting time is obtained through the reward accumulation method; finally, the actual waiting time is calculated and evaluated, as shown in Figure 2.
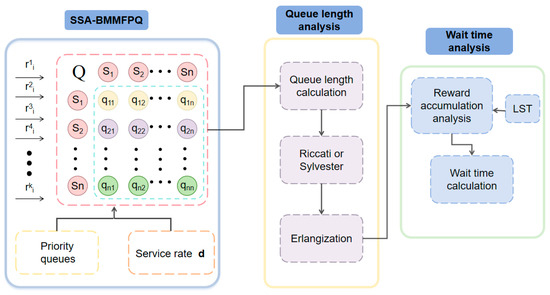
Figure 2.
SSA-BMMFPQ framework.
Table 2 shows the model parameter design of SSA-BMMFPQ.

Table 2.
Parameter table of algorithm model.
3.3. Construction of SSA-BMMFPQ
In SSA-BMMFPQ, the arrival process of ships is reconstructed as a fluid-input process modulated by the state of the anchorage, and the service process should be a fluid-output process with a controllable rate. Considering the situation of multi-priority ships, it is assumed that ships are divided into priority classes, and the -th priority class has a higher priority than the -th priority class. The CTMC is used to describe the changes in the system state, and its set of states is . In the state , the arrival rate of ships of the -th class is , and these arrival rates form the arrival rate matrix . The states in are interconnected through , and the probability of transitioning from state to state per unit time is . The in the CTMC is used to describe the dynamic transition characteristics of the system state, recording the rules regarding how quickly the anchorage transitions from one working state to another under different operation situations (such as the entry and exit of ships). further affects the arrival rate matrix and reduces the arrival rate of ships. Let be a constant, and ships with higher priority are served first. Using a fluid level similar to the length of the ship queue, under the state , the rate of change in the length of the queue of ships of the -th class can be expressed as
Formula (1) clarifies the dynamic changes in the queue length under different conditions, laying a foundation for the subsequent analysis of the system’s stability and performance indicators. In the steady-state condition, all states and parameters of the entire system no longer change with time, which means that the arrival and departure of ships reach stability, and the queue length also tends to be stable. Meanwhile, for the arrival process of ships of the -th class, the following relationship exists between and under steady-state conditions:
When the system operation tends to be stable, the boundary condition
needs to be satisfied to ensure that the outflow rate of ships is greater than the inflow rate. Only when this condition is met can the system maintain stable operation and avoid the infinite growth of the queue. At this time, the expected value of the rate of change in the queue length of ships of the -th class is 0—that is, the equilibrium condition is satisfied:
The boundary condition is
Through the above equilibrium condition and boundary condition, key performance indicators, such as the queue lengths and waiting times of various types of ships, can be further solved, providing a solid theoretical basis for the optimized scheduling of the system and the rational allocation of resources.
3.4. Queue Length Analysis
In the management of the ship queue in the anchorage, for the queue length distribution at the departure time in the anchorage system, considering that there are types of ships with different priorities in the system, the problem of the queue length of the -th type of ships is transformed into the problem of reward accumulation during the busy period of a special Markov fluid model. The LST expression of the queue length at the departure time is
where is obtained by solving a non-symmetric algebraic Riccati equation, and is obtained by solving a non-symmetric algebraic Riccati equation constructed by , which is used to analyze the performance of the waiting time in the anchorage. When analyzing the statistical characteristics of the queue length, the moment information can be used to measure characteristics such as the degree of dispersion of the queue length. Through the derivation of Formula (6), the calculation formula of the m-th moment of the queue length at the departure time is obtained:
where is derived from the non-symmetric algebraic Riccati equation constructed by the CTMC generator matrix and is obtained by solving recursively in combination with the Sylvester equation, which is used to calculate the m-th moments, such as the waiting time and queue length. In order to more effectively process and analyze the distribution function of the queue length, the Erlangization method is used for approximation:
where is affected by . As n continues to increase, the approximation accuracy will continue to improve, so that the results can more accurately approximate the true queue length distribution function.
There is a close relationship between the queue length distribution at a random time and the queue length distribution at the departure time. The relationship between the queue length distributions at a random time and the departure time is
In the LST domain, Formula (9) can be further expressed as
Secondly, based on the -class queue length embedded at the departure time, the expression of the -class queue length is derived, and the moment is obtained by taking the derivative of the LST:
3.5. Waiting Time Analysis
In SSA-BMMFPQ, the waiting time of ships of the -th class consists of two parts: one is the workload of ships with a priority no lower than that of the -th class ships already existing in the system at the arrival time; the other is the workload brought by newly arrived ships of the ()-th priority class during the waiting process. Among them, the joint probability that the system workload is 0 and the background process state is is stored by , and its elements are expressed as
According to the above formula derivation, the boundary condition is
and (for : ). Through the above formulas, the stationary density and the probability mass at 0 are given in matrix-exponential forms.
When ships of the -th class arrive at the queue, they face the workload of existing ships of the ()-th class in the system, and there may be an increase in the workload of ships of the ()-th class during the waiting process. By combining this with of SSA-BMMFPQ, constructing the dynamic equilibrium equation of the fluid queue, and deriving it through the LST, we get
According to the mathematical relationship between the LST and matrices, taking the m-th derivative of and substituting s = 0, the m-th moment can be obtained:
An approximation method is adopted to construct the waiting time distribution function . Combining the initial state and the dynamic cumulative effect, we can get
In terms of the arrival rate, if the arrival rate of a certain type of ship increases while the service rate at the anchorage remains unchanged, according to the relationship between the arrival rate and the workload in SSA-BMMFPQ, the workload in the system when this type of ship arrives will increase. It can be seen from Formulas (14)–(16) that this will lead to an increase in the waiting time.
By following these steps to understand the situation of ships at the anchorage, the data can be used to better manage ship traffic. The pseudocode for the entire ship anchorage algorithm design process is presented below, as shown in Algorithm 1.
| Algorithm 1. SSA-BMMFPQ Design Pseudocode |
| BEGIN |
| Determine_CTMC_model(Q,R1,R2,R3) |
| Build_system_parameters () |
| K = 3 |
| d = 4 |
| R_plus=array(K) |
| π=solve(πQ==0,sum(π)==1) |
| for k from 1 to K |
| R_plus[k]=sum(R(l) for l from k to K) |
| end |
| END Build_system_parameters |
| Analyze_workload(R_plus,Q,d) |
| for k from 1 to K |
| C=R_plus[k]/d-I |
| (kappa[k],K_matrix[k],A_matrix[k])=Solve_steady_density(C,Q) |
| alpha[k] = kappa[k] * A_matrix[k] * inv(-K_matrix[k]) |
| end |
| END Analyze_workload |
| Analyze_queue_length() |
| for k from 1 to K |
| fX_star=Compute_departure_lst(kappa[k],Q,R_plus[k],d) |
| mean_X[k]=-Derivative(fX_star,s) |
| Phi_n=Compute_erlang_approx(n,k) |
| lambda_k=π*R^(k+)*Ones_vector() |
| fY_star[k]=Solve_lst_equation(fX_star,s*R_plus[k]-Q,lambda_k*s) |
| mean_Y[k]=-Derivative(fY_star[k],s) |
| end |
| END Analyze_queue_length |
| Analyze_waiting_time() |
| for k form 1 to K |
| fT_star=Compute_waiting_lst(kappa[k],Q,R_plus[k],d) |
| mean_T[k]=-Derivative(fT_star) |
| FT_n[k]=alpha_k*Ones_vector()+kappa_k*Phi_n*Ones_vector() |
| end |
| END Analyze_waiting_time |
| Generate_optimization_strategy() |
| if mean_T[K]>threshold_urgent then |
| d=High(d) |
| else if mean_Y[1]>queue_threshold_Llow then |
| update_Q_matrix(Q) |
| end |
| END Generate_optimization_strategy |
| END |
4. Experiments and Simulations
In order to verify the applicability and performance advantages of SSA-BMMFPQ proposed in this paper in ship anchorage scheduling, experiments are conducted to analyze the three dimensions of the waiting time, anchorage utilization, and priority scheduling mechanism and evaluate the computational efficiency and scheduling effect in a complex environment. The experimental environment is a 64-bit Windows system with an Intel Core i9-11900K processor and 64 GB memory. The program is based on MATLAB R2019b. We compare the average waiting times of LP, GA, RL, M/G/1/1, and SSA-BMMFPQ. In the experiment, the system performance under a fixed service rate and dynamic state adjustment service rate is further compared, and a priority weight mechanism is introduced to investigate its effect on mitigating scheduling imbalances and improving service fairness, thus verifying the feasibility and scheduling advantages of SSA-BMMFPQ in ship anchorage systems.
4.1. Experimental Parameter Setting
In this study, numerical experiments are conducted to simulate port operation scenarios, and an ideal ship arrival and anchorage state transition model is constructed to obtain data. The parameters of the model are set according to specific rules and assumptions, which are used to fit the ship arrival data generated by simulations and the preset state transition rules. The performance advantage of the algorithm in dynamic scheduling is verified by theoretical model numerical derivation. The model parameters have been scientifically configured as detailed in Table 3.

Table 3.
Experimental parameters.
4.2. Analysis of Experimental Results
4.2.1. Cumulative Distribution Function (CDF) of Waiting Time for Different Priority Tasks
CDF curves are used to compare the waiting times for ships of different priority classes. In Figure 3, we can see that the curve for priority 3 rises significantly faster than that for priority 1 and priority 2, indicating that priority 3 ships have shorter waiting times.
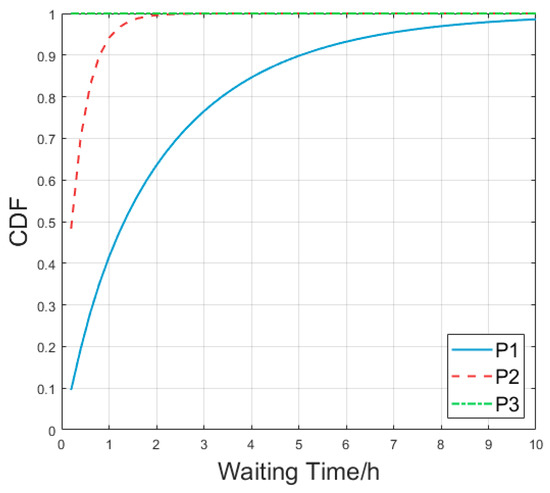
Figure 3.
Comparison of CDFs of priority 1 with those of priority 2 and priority 3.
Comparing the relative positions of the priority curves, the curves with the higher-priority ships above in Figure 4 generally have shorter waiting times. Focusing on the region with long waiting times, if the cumulative distribution function of a priority increases slowly, it indicates that there are more ships in the priority class that need to wait for a long time, and the scheduling strategy of the priority ships can be optimized or the related resource allocation can be increased.
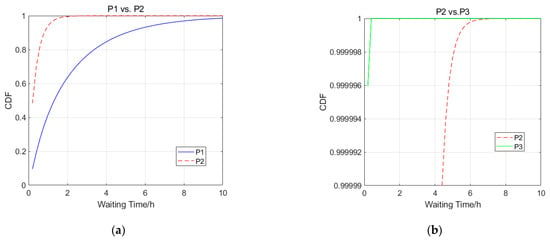
Figure 4.
Comparison of CDFs: (a) priority 1; (b) priority 2.
4.2.2. Influence of Anchorage Utilization Rate and Scale of Number of Ships on Computational Execution Time
Under the same conditions, the anchor utilization ratios were set to 0.1, 0.5, and 0.9, respectively. Figure 5 shows that the computational execution time increases significantly as the number of ships increases. As the number of ships increases from smaller to larger, the computational execution time may rise. When the anchorage utilization rate increases, the computational execution time may also increase, as shown in Figure 5.
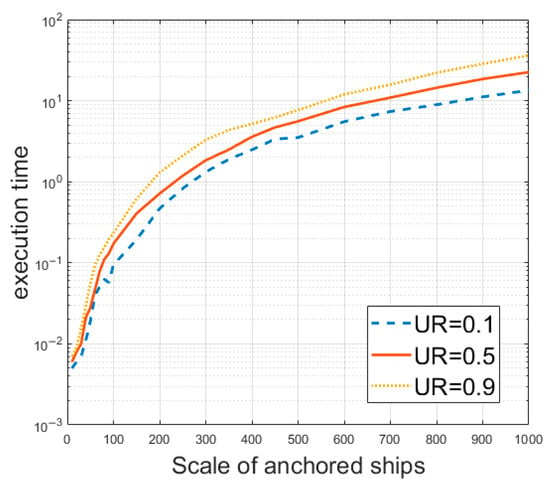
Figure 5.
Influence of anchorage utilization rate on calculation execution time.
4.2.3. Comparison of Scheduling Strategies
Under the M/M/1 strategy, high-priority ships may still wait longer in some cases due to the inherent queuing rules of the system, which affects the overall efficiency. SSA-BMMFPQ, by virtue of its preferential treatment of high-priority ships, can significantly reduce the waiting times of high-priority ships, thereby improving the overall operational efficiency.
Figure 6 shows a comparison of the average waiting times of M/M/1 and SSA-BMMFPQ at different priority levels. At most time points, the average waiting time of SSA-BMMFPQ is lower than that of the M/M/1 strategy. This shows that SSA-BMMFPQ has a greater advantage than the M/M/1 strategy in most scenarios, especially in the case of strict operational efficiency requirements, and can better meet actual operational requirements.
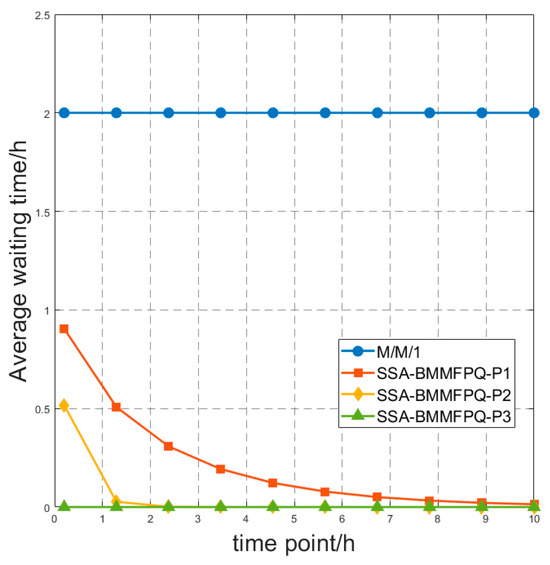
Figure 6.
Comparison of average waiting times between M/M/1 and SSA-BMMFPQ.
Figure 7 compares the average waiting times of LP, GA, RL, M/G/1/1, and SSA-BMMFPQ. The results show that SSA-BMMFPQ has the shortest average waiting time. LP has poor flexibility, GA is affected by randomness, RL has a time delay in dealing with complex scenes, and all three perform poorly. M/G/1/1 fluctuates significantly due to insufficient priority consideration. SSA-BMMFPQ can be dynamically sequenced, is adaptable, and effectively reduces the waiting time.
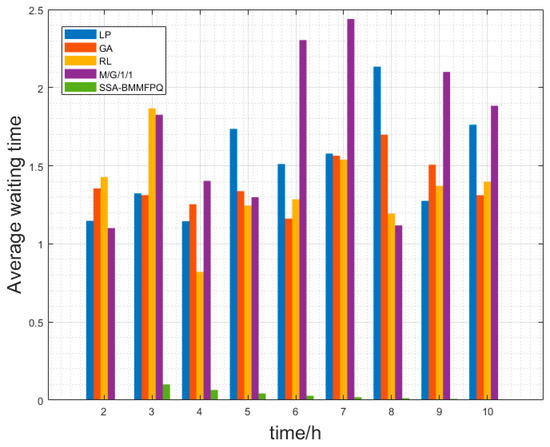
Figure 7.
Comparison of average waiting times under different strategies.
SSA-BMMFPQ enables high-priority ships to receive service first through reasonable priority scheduling, effectively reducing the waiting times of high-priority ships. In scenarios with clear priority requirements, SSA-BMMFPQ better meets the operational efficiency requirements, as shown in Table 4.

Table 4.
Data table of average waiting times under different strategies.
4.2.4. Comparison of Fixed and Dynamic Service Rates
In order to simulate the actual situation, the service rate is invoked according to different anchorage states to reduce the waiting times of ships. The dynamic process of peak periods is presented by changing the service rate. The average waiting times of ships under fixed and dynamic service rates are compared to evaluate the effect of the dynamic service rate strategy. A comparison of the cumulative average waiting times of different-priority ships under a fixed service rate and dynamic service rate in shown in Figure 8. This shows that the waiting time of low-priority ships decreases after about 2.5 h, and the cumulative average waiting time is almost unchanged. It also prevents the situation in which low-priority ships have no resource service for a long time and increases the fairness.
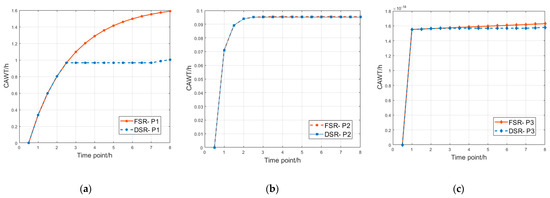
Figure 8.
Comparison of cumulative average waiting times under different service rate strategies: (a) priority 1; (b) priority 2; (c) priority 3.
4.2.5. Normal Priority Scheduling Versus Weighted Multi-Priority Scheduling
In the face of unique circumstances, emergency ships need to pass immediately, so the first time arrangement is needed, which requires weight setting for the priority of ships. For each time point t, the weighted average waiting time of each priority level is summed according to the weight to obtain the weighted average waiting time of the time point. The calculation formula is as follows:
SSA-BMMFPQ is used for both normal priority scheduling and weighted multi-priority scheduling. It can be seen from Figure 9 that, under the normal priority scheduling policy, due to the fixed priority order, ships still need to wait according to the fixed priority, resulting in longer average waiting times. Under the weighted multi-priority scheduling policy, the priority can be increased by increasing its weight, and the average waiting time can be reduced.
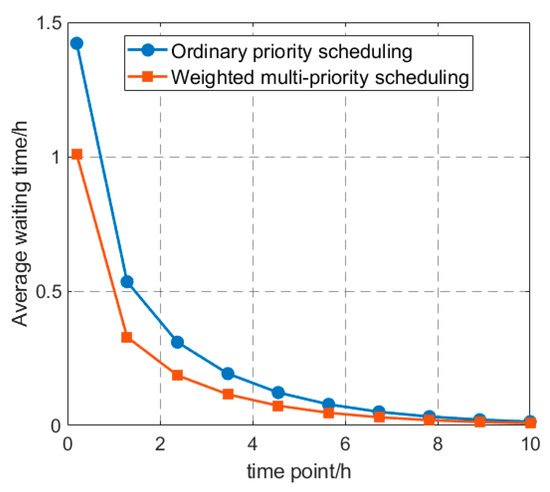
Figure 9.
Comparison of average times with different priority configurations.
5. Conclusions
In this paper, the SSA-BMMFPQ algorithm is proposed to solve the problems of resource allocation and ship priority scheduling in a ship anchorage system. By analyzing the ship queue length and waiting time, the influence mechanism of the priority structure on system performance is clarified. Through experiments, its advantages in shortening the average waiting time and alleviating the detention of high-priority ships are verified, providing support for anchorage and port resource allocation. However, the algorithm has some limitations; for example, the priority weight setting is not dynamically coupled with the CTMC, it cannot respond to the real-time changes in state parameters such as the ship arrival rate, and the state transition rule does not consider the non-stationary fluctuations in the fluid input and service rate, failing to reflect the randomness of actual ship arrivals. Future research will improve on these aspects, construct a CTMC state-dependent dynamic weight model, embed parameters such as the ship emergency degree into the generator matrix, and realize the real-time adjustment of the priority weights with the CTMC state. Based on the matrix analysis, the CTMC state space is extended to represent the dynamic changes in the fluid input rate, so as to improve the adaptability to non-stationary scenarios. Combined with other optimization algorithms, real-time data are used to calibrate the reward accumulation parameters of the fluid queue busy period, so as to enhance the support ability of the algorithm for actual anchorage scheduling.
Author Contributions
Conceptualization, J.D., Y.S., L.L. and Y.L.; methodology, J.D., Y.S., L.L. and Y.L.; software, S.L.; validation, J.D., Y.S., Y.L. and S.L.; formal analysis, S.L.; investigation, X.W.; resources, X.L.; data curation, X.W. and X.L.; writing—original draft preparation, S.L.; writing—review and editing, S.L.; visualization, J.D. and Y.L.; supervision, J.D.; project administration, J.D., Y.L., X.W. and X.L.; funding acquisition, J.D., Y.L., X.W. and X.L. All authors have read and agreed to the published version of the manuscript.
Funding
This research was funded by the Guangxi Major Science and Technology Project, grant number GuikeAA23062035-2; the Guangxi Major Science and Technology Project, grant number GuikeAA24263038; and the Tianjin Science and Technology Plan Project, grant number 22YDPYGX00070.
Institutional Review Board Statement
Not applicable.
Informed Consent Statement
Not applicable.
Data Availability Statement
The original contributions presented in this study are included in the article. Further inquiries can be directed to the corresponding author.
Conflicts of Interest
Authors Xiaolin Wang and Xinzhi Liu were employed by the company Guangxi Datengxia Water Conservancy Hub Development Co., Ltd. The remaining authors declare that the research was conducted in the absence of any commercial or financial relationships that could be construed as a potential conflict of interest.
References
- Elmi, Z.; Li, B.; Liang, B.; Lau, Y.-Y.; Borowska-Stefańska, M.; Wiśniewski, S.; Dulebenets, M.A. An epsilon-constraint-based exact multi-objective optimization approach for the ship schedule recovery problem in liner shipping. Comput. Ind. Eng. 2023, 183, 109472. [Google Scholar] [CrossRef]
- Liu, S.; Zhang, Y.; Guo, W.; Tian, H.; Tang, K. Ship scheduling problem based on channel-lock coordination in flood season. Expert Syst. Appl. 2024, 254, 124393. [Google Scholar] [CrossRef]
- Yang, A.; Cao, Y.; Chen, K.; Zeng, Q.; Chen, Z.; Wang, Y. An optimization model for tramp ship scheduling considering time window and seaport operation delay factors. J. Adv. Transp. 2021, 2021, 6650097. [Google Scholar] [CrossRef]
- Elmi, Z.; Singh, P.; Meriga, V.K.; Goniewicz, K.; Borowska-Stefańska, M.; Wiśniewski, S.; Dulebenets, M.A. Uncertainties in liner shipping and ship schedule recovery: A state-of-the-art review. J. Mar. Sci. Eng. 2022, 10, 563. [Google Scholar] [CrossRef]
- Jia, S.; Meng, Q.; Kuang, H. Equitable vessel traffic scheduling in a seaport. Transp. Sci. 2022, 56, 162–181. [Google Scholar] [CrossRef]
- Lauri, M.; Hsu, D.; Pajarinen, J. Partially observable Markov decision processes in robotics: A survey. IEEE Trans. Robot. 2022, 39, 21–40. [Google Scholar] [CrossRef]
- Roy, A.; Borkar, V.; Karandikar, A.; Chaporkar, P. Online reinforcement learning of optimal threshold policies for Markov decision processes. IEEE Trans. Autom. Control 2021, 67, 3722–3729. [Google Scholar] [CrossRef]
- Lu, J.; Han, L.; Wei, Q.; Wang, X.; Dai, X.; Wang, F.-Y. Event-triggered deep reinforcement learning using parallel control: A case study in autonomous driving. IEEE Trans. Intell. Veh. 2023, 8, 2821–2831. [Google Scholar] [CrossRef]
- Chu, N.H.; Hoang, D.T.; Nguyen, D.N.; Phan, K.T.; Dutkiewicz, E.; Niyato, D.; Shu, T. Metaslicing: A novel resource allocation framework for metaverse. IEEE Trans. Mob. Comput. 2023, 23, 4145–4162. [Google Scholar] [CrossRef]
- Lin, L.; Cao, J.; Lam, J.; Rutkowski, L.; Dimirovski, G.M.; Zhu, S. A bisimulation-based foundation for scale reductions of continuous-time Markov chains. IEEE Trans. Autom. Control 2024, 69, 5743–5758. [Google Scholar] [CrossRef]
- Ghosh, D.; Pandey, M.; Gautam, C.; Vidyarthi, A.; Sharma, R.; Draheim, D. Utilizing Continuous Time Markov Chain for analyzing video-on-demand streaming in multimedia systems. Expert Syst. Appl. 2023, 223, 119857. [Google Scholar] [CrossRef]
- Yang, B.; Tang, G.C. Stochastic optimization model for container shipping of sea carriage. J. Transp. Syst. Eng. Inf. Technol. 2010, 10, 58–63. [Google Scholar]
- Garau-Luis, J.J.; Torrens, S.A.; Vila, G.C.; Pachler, N.; Crawley, E.F.; Cameron, B.G. Frequency plan design for multibeam satellite constellations using integer linear programming. IEEE Trans. Wirel. Commun. 2023, 23, 3312–3327. [Google Scholar] [CrossRef]
- Cho, J.; Papavasiliou, A. Exact mixed-integer programming approach for chance-constrained multi-area reserve sizing. IEEE Trans. Power Syst. 2023, 39, 3310–3323. [Google Scholar] [CrossRef]
- Oyatoye, E.O.; Adebiyi, S.O.; Okoyee, J.C.; Amole, B.B. Application of Queueing Theory to Port Congestion Problem in Nigeria; European Journal of Business and Management: London, UK, 2011. [Google Scholar]
- Hu, L.; Chen, Z.; Dong, Y.; Jia, Y.; Liang, L.; Wang, M. Status update in IoT networks: Age-of-information violation probability and optimal update rate. IEEE Internet Things J. 2021, 8, 11329–11344. [Google Scholar] [CrossRef]
- Shi, B.; Zheng, F.-C.; She, C.; Luo, J.; Burr, A.G. Risk-resistant resource allocation for eMBB and URLLC coexistence under M/G/1 queueing model. IEEE Trans. Veh. Technol. 2022, 71, 6279–6290. [Google Scholar] [CrossRef]
- Moltafet, M.; Leinonen, M.; Codreanu, M. Moment generating function of age of information in multisource M/G/1/1 queueing systems. IEEE Trans. Commun. 2022, 70, 6503–6516. [Google Scholar] [CrossRef]
- Cao, Z.; Lin, C.; Zhou, M.; Wen, X. Learning-based genetic algorithm to schedule an extended flexible job shop. IEEE Trans. Cybern. 2024, 54, 6909–6920. [Google Scholar] [CrossRef]
- Yu, Z.; Si, Z.; Li, X.; Wang, D.; Song, H. A novel hybrid particle swarm optimization algorithm for path planning of UAVs. IEEE Internet Things J. 2022, 9, 22547–22558. [Google Scholar] [CrossRef]
- İlhan, İ.L.H.A.N. An improved simulated annealing algorithm with crossover operator for capacitated vehicle routing problem. Swarm Evol. Comput. 2021, 64, 100911. [Google Scholar] [CrossRef]
- Nov, Y.; Weiss, G.; Zhang, H. Fluid models of parallel service systems under FCFS. Oper. Res. 2022, 70, 1182–1218. [Google Scholar] [CrossRef]
- Abbou, A.N.N.; Taleb, T.; Song, J. A software-defined queuing framework for QoS provisioning in 5G and beyond mobile systems. IEEE Netw. 2021, 35, 168–173. [Google Scholar] [CrossRef]
- Hamdi, R.; Baccour, E.; Erbad, A.; Qaraqe, M.; Hamdi, M. LoRa-RL: Deep reinforcement learning for resource management in hybrid energy LoRa wireless networks. IEEE Internet Things J. 2021, 9, 6458–6476. [Google Scholar] [CrossRef]
- Borisov, V.; Leemann, T.; Seßler, K.; Haug, J.; Pawelczyk, M.; Kasneci, G. Deep neural networks and tabular data: A survey. IEEE Trans. Neural Netw. Learn. Syst. 2022, 35, 7499–7519. [Google Scholar] [CrossRef]
- Legaard, C.M.; Schranz, T.; Schweiger, G.; Drgoňa, J.; Falay, B.; Gomes, C.; Iosifidis, A.; Abkar, M.; Larsen, P.G. Constructing neural network based models for simulating dynamical systems. ACM Comput. Surv. 2023, 55, 1–34. [Google Scholar] [CrossRef]
- Horváth, G. Waiting time and queue length analysis of Markov-modulated fluid priority queues. Queueing Syst. 2020, 95, 69–95. [Google Scholar] [CrossRef]
Disclaimer/Publisher’s Note: The statements, opinions and data contained in all publications are solely those of the individual author(s) and contributor(s) and not of MDPI and/or the editor(s). MDPI and/or the editor(s) disclaim responsibility for any injury to people or property resulting from any ideas, methods, instructions or products referred to in the content. |
© 2025 by the authors. Licensee MDPI, Basel, Switzerland. This article is an open access article distributed under the terms and conditions of the Creative Commons Attribution (CC BY) license (https://creativecommons.org/licenses/by/4.0/).