Article

An Approach to Trustworthy Article Ranking by NLP and Multi-Layered Analysis and Optimization

Department of Computer Science, University of Idaho, Moscow, ID 83844, USA
*
Author to whom correspondence should be addressed.
Algorithms 2025, 18(7), 408; https://doi.org/10.3390/a18070408
Submission received: 13 June 2025 / Revised: 1 July 2025 / Accepted: 2 July 2025 / Published: 3 July 2025

Abstract

The rapid growth of scientific publications, coupled with rising retraction rates, has intensified the challenge of identifying trustworthy academic articles. To address this issue, we propose a three-layer ranking system that integrates natural language processing and machine learning techniques for relevance and trust assessment. First, we apply BERT-based embeddings to semantically match user queries with article content. Second, a Random Forest classifier is used to eliminate potentially problematic articles, leveraging features such as citation count, Altmetric score, and journal impact factor. Third, a custom ranking function combines relevance and trust indicators to score and sort the remaining articles. Evaluation using 16,052 articles from Retraction Watch and Web of Science datasets shows that our classifier achieves 90% accuracy and 97% recall for retracted articles. Citations emerged as the most influential trust signal (53.26%), followed by Altmetric and impact factors. This multi-layered approach offers a transparent and efficient alternative to conventional ranking algorithms, which can help researchers discover not only relevant but also reliable literature. Our system is adaptable to various domains and represents a promising tool for improving literature search and evaluation in the open science environment.

1. Introduction

The scientific research landscape is drowning in papers. A survey showed that the number of new scientific publications per year had already increased to more than seven million in the late 2010s [1], leaving researchers struggling to separate reliable work from questionable studies. This literature flood coincides with a troubling rise in retractions, where flawed or fraudulent research is pulled from the record after publication. Traditional search tools excel at finding relevant papers but fall short in helping scholars assess whether those papers deserve their trust. Several obstacles make this problem particularly hard to solve. The overwhelming publication volume means no researcher can thoroughly evaluate every potentially relevant article. While peer review serves as the primary quality filter, its effectiveness varies wildly across journals and fields [2]. Properly judging an article’s trustworthiness demands both time and specialized knowledge. Beyond academia’s walls, public confidence in science relies only on researchers citing dependable sources.
To address the challenge of finding trustworthy publications, we proposed an optimized literature search system with three distinct layers that work together. Unlike approaches that focus solely on finding relevant content or just on assessing quality metrics, our system combines both. It uses BERT’s language understanding capabilities to match content to queries, then applies a machine learning filter to screen out problematic papers and finally ranks results using both relevance and trustworthiness signals. We have collected abundant datasets to test the proposed approach and achieved positive outputs. A complete pipeline merging semantic search with quality assessment was built and thoroughly tested. Experiments revealed which factors most strongly signal article trustworthiness, with citation behavior proving more indicative than journal reputation. The development of a ranking method successfully balances finding relevant and reliable papers. This approach was validated using a substantial dataset containing both retracted and non-retracted articles across multiple disciplines.
Our research responds to a genuine need in science: helping researchers more efficiently find trustworthy publications relevant to their work. The following sections detail how we gathered our data, built our three-layer approach, and measured its performance, and what our results mean for improving how scientists find and evaluate research literature.

2. Related Work

2.1. Similarity Comparison

Handling the user-input questions and needs is a crucial first step in a search engine ranking algorithm. A similarity comparison process is typically used to find the database’s most relevant results based on user input [3]. In this research, a scenario is that we will compare the user-input data with the metadata of the article, which includes the title, abstract, and keywords. Determining the best procedure for our similarity comparison is essential to reducing false positives. Word embedding and similarity computation in natural language processing (NLP) are the two basic steps in establishing a comparison procedure [4]. The most common similarity computation methods include the Euclidean distance [5] and cosine similarity [6]. The Euclidean distance (demonstrated in Equation (1)) measures the distance between two vectors using the formula
d x , y =   x i y i 2
where
x = (x1, x2,…, xn) and y = (y1, y2,…, yn) are the two vectors being compared;
xi and yi are the individual elements at position i in vectors x and y, respectively.
Cosine similarity (demonstrated in Equation (2)) measures the cosine of the angle between two vectors: the smaller the angle, the higher the similarity. The cosine similarity is given by
cos θ = x · y / x × y
where
x = (x1, x2,…, xn) and y = (y1, y2,…, yn) are the two vectors being compared;
θ is the angle between vectors x and y;
x·y is the dot product: ∑(xi × yi)—the sum of products of corresponding elements;
xi and yi are the individual elements at position i in vectors x and y, respectively;
||x|| and ||y|| are the magnitudes (Euclidean norms): √∑(xi2) and √∑(yi2).
There are also other methods for similarity computation, such as Jaccard and Hamming, but they are more suitable for binary strings and thus not applicable in our situation [7]. We choose to use cosine similarity because it is scale-invariant—it measures the angle between vectors rather than their absolute differences. This characteristic is particularly important when comparing user-input keywords with article abstracts, as different textual features (such as term frequencies, semantic weights, and metadata elements) often exist at vastly different numerical scales. The Euclidean distance would allow features with larger numerical ranges to disproportionately influence the similarity calculation, potentially masking important relationships in other dimensions [8]. Although there are many new ways to compare document similarity, such as Fuzzy String matching [9] and Graph-based Methods [10], we keep this part standard to focus on other research areas.
For the word embedding process, common NLP methods include TF-IDF, Word2vec, DOC2vec, and Transformers. TF-IDF (term frequency-inverse document frequency) determines a word’s importance based on its frequency in the document relative to its frequency across all documents [11]. Word2vec, developed by Google, uses neural networks to capture contextual meanings with methods like Continuous Bag of Words and Skip-gram [12]. DOC2vec extends Word2vec to document-level embeddings [13]. Transformers represent the state-of-the-art methods such as BERT [14], excelling in embedding long sentences.

2.2. Trustworthiness in Article Discovery

In article discovery, “trustworthiness” refers to the reliability and validity of information contained in the retrieved scholarly articles. Scientists must have confidence in the papers that they read and use in their research activities. The academic community is aware of the importance of reliability in article discovery. In the past decades, many research studies [15,16,17] have been conducted to address such concerns. In general, those works have developed their own systems and criteria to determine the trustworthiness of an article. These criteria comprise the standard of the peer review procedure, the credibility of the source, the credentials and work history of the writers, and the number of citations the article has received. Among those metrics, citation is a common way for academics to gauge whether a work is well-liked and influential.

2.3. Classification Models for Trust Assessment

Classification models are frequently employed to evaluate a news article’s credibility. In those models, attributes such as content correctness, author credentials, and source reputation are used to classify the article’s trustworthiness. For example, Castillo et al. [18] pioneered influential work on classification models for credibility assessment, particularly in social media contexts. Their model considered various elements including propagation patterns, external references, and author characteristics to determine content credibility. Pérez-Rosas et al. [19] demonstrated the effectiveness of linguistic feature-based classification models for detecting fake news, in which stylistic elements and content patterns are used to determine credibility. These models provide a static measure of trustworthiness that enables readers to quickly determine the credibility of an article. Their results showed that automated systems could effectively distinguish between credible and non-credible information by analyzing these multi-dimensional features, providing a framework that has influenced subsequent approaches to news trustworthiness classification.

2.4. Ranking Systems in Academic Article Repositories

Major article repositories like Google Scholar and Web of Science use various ranking mechanisms to organize search results. Google Scholar combines citations and relevance to match a user’s query, where citations serve as a proxy for an article’s impact, and relevance ensures the search results pertain to the user’s needs [20]. However, Google Scholar operates as a “black box” with a proprietary ranking algorithm that is not disclosed to the public, making it difficult for users to understand the criteria influencing the ranking of search results. In comparison, Web of Science offers single criteria ranking systems such as relevance, citation count, and date posted [21]. While these methods effectively highlight certain aspects of an article, they often overlook other factors contributing to the overall trustworthiness. For instance, a highly cited article may be influential but not necessarily the most current or accurate. Other repositories follow similar approaches. PubMed, for example, primarily ranks articles by relevance and date [22], which can sometimes prioritize newer articles over those that are more impactful or thoroughly reviewed.
While these single-criteria and opaque ranking methods have their merits, they fall short in providing a comprehensive measure of an article’s trustworthiness. Users are often left without clear insights into why certain articles are ranked higher than others, which can lead to confusion and potential misjudgment of the quality of the information. To address these limitations, there is a growing need for a transparent, multi-criteria ranking system that integrates various trust indicators. Such a system would consider not only citations and relevance but also factors like the authors’ credentials, the reputation of the publication source, the thoroughness of the peer review process, and the article’s content quality and recency. We integrated all those considerations into the design of our system, which makes the following contributions:
  • Integrated Semantic Relevance and Trust Assessment: Combines BERT-based semantic matching with trustworthiness evaluation to retrieve articles that are both topically relevant and scientifically reliable.
  • Robust Problematic Article Filtering: Applies a Random Forest classifier trained on retracted and non-retracted articles to effectively eliminate unreliable publications with 90% overall accuracy.
  • Transparent Multi-factor Ranking Strategy: Introduces a scoring model that merges citation, Altmetric, and impact factor data to produce an interpretable and adjustable trustworthiness ranking.
  • Validated on Large Cross-domain Dataset: Demonstrates a consistent performance using over 16,000 articles across diverse scientific fields, supporting generalizability and applicability to real-world literature discovery tasks.
The proposed three-layer system will be explained in detail in Section 4. Before illustrating the workflow of that system, we will first introduce the data resources used in this work.

3. Data Retrieval and Pre-Processing

Our study utilized two primary datasets: the Retraction Watch database [23] and a curated collection from Web of Science. The Retraction Watch database, which has garnered significant attention in the scientific community for its insights into publication integrity [24], initially contained 12,195 retracted articles with comprehensive metadata including retraction reasons and citation metrics both pre-retraction and post-retraction. To establish a comparative baseline for non-retracted articles, we also collected 10,000 non-retracted articles from the Web of Science on 3 June 2024. Our sampling strategy employed a systematic approach focusing on five pairs of related research domains, with 1000 articles selected for each domain among the following pairs:
  • Photosynthesis and Cellular Respiration;
  • Quantum Mechanics and Quantum Computing;
  • Ecology and Environmental Science;
  • Virology and Epidemiology;
  • Bacteria and Viruses.
This paired-topic approach ensured a balanced representation across different scientific disciplines while maintaining thematic coherence within each pair. However, the fragmented nature of scholarly metadata across different platforms presented a significant challenge. While repositories such as Google Scholar provide citation metrics and h-indexes, they lack alternative metrics and impact factor data. For the data sources of this study, the Web of Science and Retraction Watch databases also presented limitations in metadata completeness, particularly regarding journal impact factors and alternative metrics. To address these gaps, we implemented a multi-source data enrichment process:
  • Altmetric Data Integration: We utilized the Altmetric API to retrieve attention scores for articles using their Digital Object Identifiers (DOIs).
  • Impact Factor Collection: Journal impact factors were obtained through the Journal Citation Reports (JCR) database, supplemented by direct extraction from journal websites when necessary.
Following the initial data collection, we conducted a thorough pre-processing phase to address missing values, particularly in impact factor and Altmetric scores. After removing entries with incomplete metadata, our final dataset (Table 1) was reduced to 16,052 articles (11,649 from Retraction Watch and 4403 from Web of Science), providing a robust foundation for our subsequent analysis.

4. Methodology

Based on the survey of the existing methods and the analysis of data resources, our proposed system consists of a three-layer architecture to provide users with relevant and trustworthy academic article search results. As shown in Figure 1, the system processes user queries through sequential stages of increasing refinement. In layer 1, BERT embeddings are deployed for semantic similarity matching; in layer 2, a Random Forest classifier is applied to eliminate potentially problematic articles; and in layer 3, a novel ranking mechanism is implemented to balance relevance with trustworthiness. Each layer builds on the output of the preceding steps and fulfills a specific function. This multi-layered strategy ensures that the search results uphold the highest criteria of scientific credibility in addition to semantic relevance. The following sections detail each layer of this architecture, from initial query processing to the recommendation result ranking.

4.1. BERT Embedding and Similarity Comparison

In our approach to semantic text analysis, we employ the BERT model, a popular method in NLP, to generate dense vector representations of both user queries and academic articles. The bidirectional nature of BERT allows it to consider the full context of each word, making it particularly effective for understanding complex academic text and technical terminology.
We specifically selected the “BERT-base-uncased” model over other available variants for several reasons. First, we chose BERT-base over BERT-large because the latter’s 340 M parameters (compared to BERT-base’s 110 M) would significantly increase computational overhead without proportional performance gains for our similarity task. Second, we opted for the uncased version because academic abstracts often contain inconsistent capitalization patterns, and treating terms like “Machine Learning” and “machine learning” as equivalent is more appropriate for semantic similarity matching. Finally, while domain-specific variants like SciBERT exist, BERT-base-uncased provides better generalizability across multiple academic disciplines, which aligns with our cross-domain article retrieval system.
In our work, the selected “BERT-base-uncased” model creates 768-dimensional embeddings that effectively capture the semantic relationships within the text. The initial step involves concatenating each article’s title and abstract into a unified text string before generating the embedding. This approach ensures that the full topic and context of the article are captured in the vector representation.
After generating BERT embeddings for both the user queries and the articles, we implement a similarity comparison using cosine similarity measurements. Cosine similarity serves as an effective metric for comparing high-dimensional vectors as it measures the cosine of the angle between two vectors, producing a normalized similarity score ranging from −1 to 1. A score of 1 indicates perfect similarity, while lower scores suggest decreasing degrees of semantic relevance. This normalization makes the metric particularly suitable for comparing texts of different lengths. In our implementation, we select the top 10% of articles with the highest cosine similarity scores for further analysis and refinement. This filtering step ensures that we maintain a manageable set of highly relevant articles while retaining enough diversity for subsequent analysis stages.

4.2. Elimination of Problematic Articles

This stage aims to develop a systematic pipeline to identify and filter out potentially problematic articles. Hence, we design an article elimination process following the similarity comparison to enhance the trustworthiness of our results, based on the observation that not all articles with high similarity scores necessarily represent reliable scientific contributions. We deploy a Random Forest classifier for this task, because of its ability to handle non-linear relationships and provide easy-to-understand feature importance for future analysis (see Layer 2 in Figure 1). Due to the characteristics of our data, the Random Forest classifier can help us solve the following problems. First, this model is effective at handling multiple features without making assumptions about the feature distributions. Second, this model demonstrates robustness against overfitting and shows the capability to capture complex interactions between different article metrics. Third, it provides feedback on feature importance to help identify the key indicators of article trustworthiness.
In our design, the Random Forest classification model incorporates article metrics such as the journal impact factor, citation count (pre-retraction for retracted articles), and Altmetric scores. We split the dataset into training (80%) and testing (20%) sets, maintaining the class distribution through stratification. All features are then standardized using StandardScaler. We implement the model with 100 estimators and default parameters to establish a baseline, followed by hyperparameter fine-tuning using cross-validation to optimize model performance. To establish a filtering mechanism that could be applied to new articles during the user search interaction, the model is trained to classify articles into two categories: those likely to be problematic and those otherwise. To validate our approach, we conduct preliminary evaluations using standard machine learning metrics, such as precision, recall, F1-score, etc. Detailed performance metrics are provided in Section 5. Overall, this elimination process provides an additional layer of validation beyond the content similarity, creating a more robust and trustworthy result for the user.

4.3. Final Result Ranking

While it is important to classify the articles, for search engine applications, users also need the ability to understand the relative trustworthiness among the article results. Hence, we add an additional layer of trust scoring system to address this gap (see Layer 3 in Figure 1). We first convert our retraction severity scores to a 1–100 scale and divide them into 5 severity levels to create a more detailed ranking framework. Using these scores, we train a LightGBM ranking model with the lambdarank objective to optimize the ranking performance. The features include percentile ranks for impact factors, citation counts, and Altmetric scores, along with metrics showing relationships between these values.
In our initial experiment results, citation rank was the most important feature (254.78), followed by relative citation impact (227.88) and impact factor rank (186.03). While the model achieved reasonably good NDCG scores (NDCG@5 of 0.8141, NDCG@10 of 0.8490), analysis of sample rankings revealed limitations. When comparing actual versus predicted ranks for 10 random papers, only 1 had a perfect rank match, and 4 were within one rank position of their true standing. The Spearman rank correlation of 0.443 showed only a moderate relationship between predicted and actual trustworthiness. Given these limitations, we decided to use the feature importance insights to create a simpler, more transparent trust score function for articles:
T(a) = w1CR(a) + w2RCI(a) + w3IFR(a),
This function (Equation (3)) incorporates the citation rank CR(a), relative citation impact RCI(a), and impact factor rank IFR(a). The weights w1 (0.25), w2 (0.23), and w3 (0.19) reflect the relative importance of each component based on our empirical analysis of feature importance scores from the LightGBM model. To create our final ranking mechanism, we create a score that merges relevance and trustworthiness:
R(a) = α × S(a) + (1 − α) × T(a),
In Equation (4), S(a) measures the query–article similarity, while α balances relevance against trustworthiness. This approach proves particularly valuable for academic searches where both aspects matter significantly. When α equals 0.5, relevance and trustworthiness contribute equally to the final score. Adjusting α to be higher prioritizes relevance, while a lower value emphasizes trustworthiness. This flexibility helps prevent situations where highly relevant but questionable articles or trustworthy but less relevant papers dominate the results.

5. Expanded Experiments, Results, and Discussion

To validate the effectiveness of the proposed three-layer system, we implemented a list of experiments with the dataset collected in Section 3. In the first layer, to evaluate and determine the model used for the word embedding, we trained and tested both BERT and TF-IDF models with the 10,000 articles collected from Web of Science. In the second layer, we trained and evaluated the Random Forest model with the 16,052 articles collected from both the Retraction Watch dataset and Web of Science. In the third layer, the ranking algorithm in Section 4.3 was applied to the result from the second layer and then the ranking result was generated. In the below, Section 5.1, Section 5.2 and Section 5.3 will give details about the experimental results in the first and second layers. The steps in the third layer are the same as Section 4.3 and we will omit the details of the workflow here, but in Section 5.5, we will present an exemplar result and discuss the future work of implementing the three-layer system in real-world applications, especially how to assess the ranking results in the third layer with reference data provided by experts.

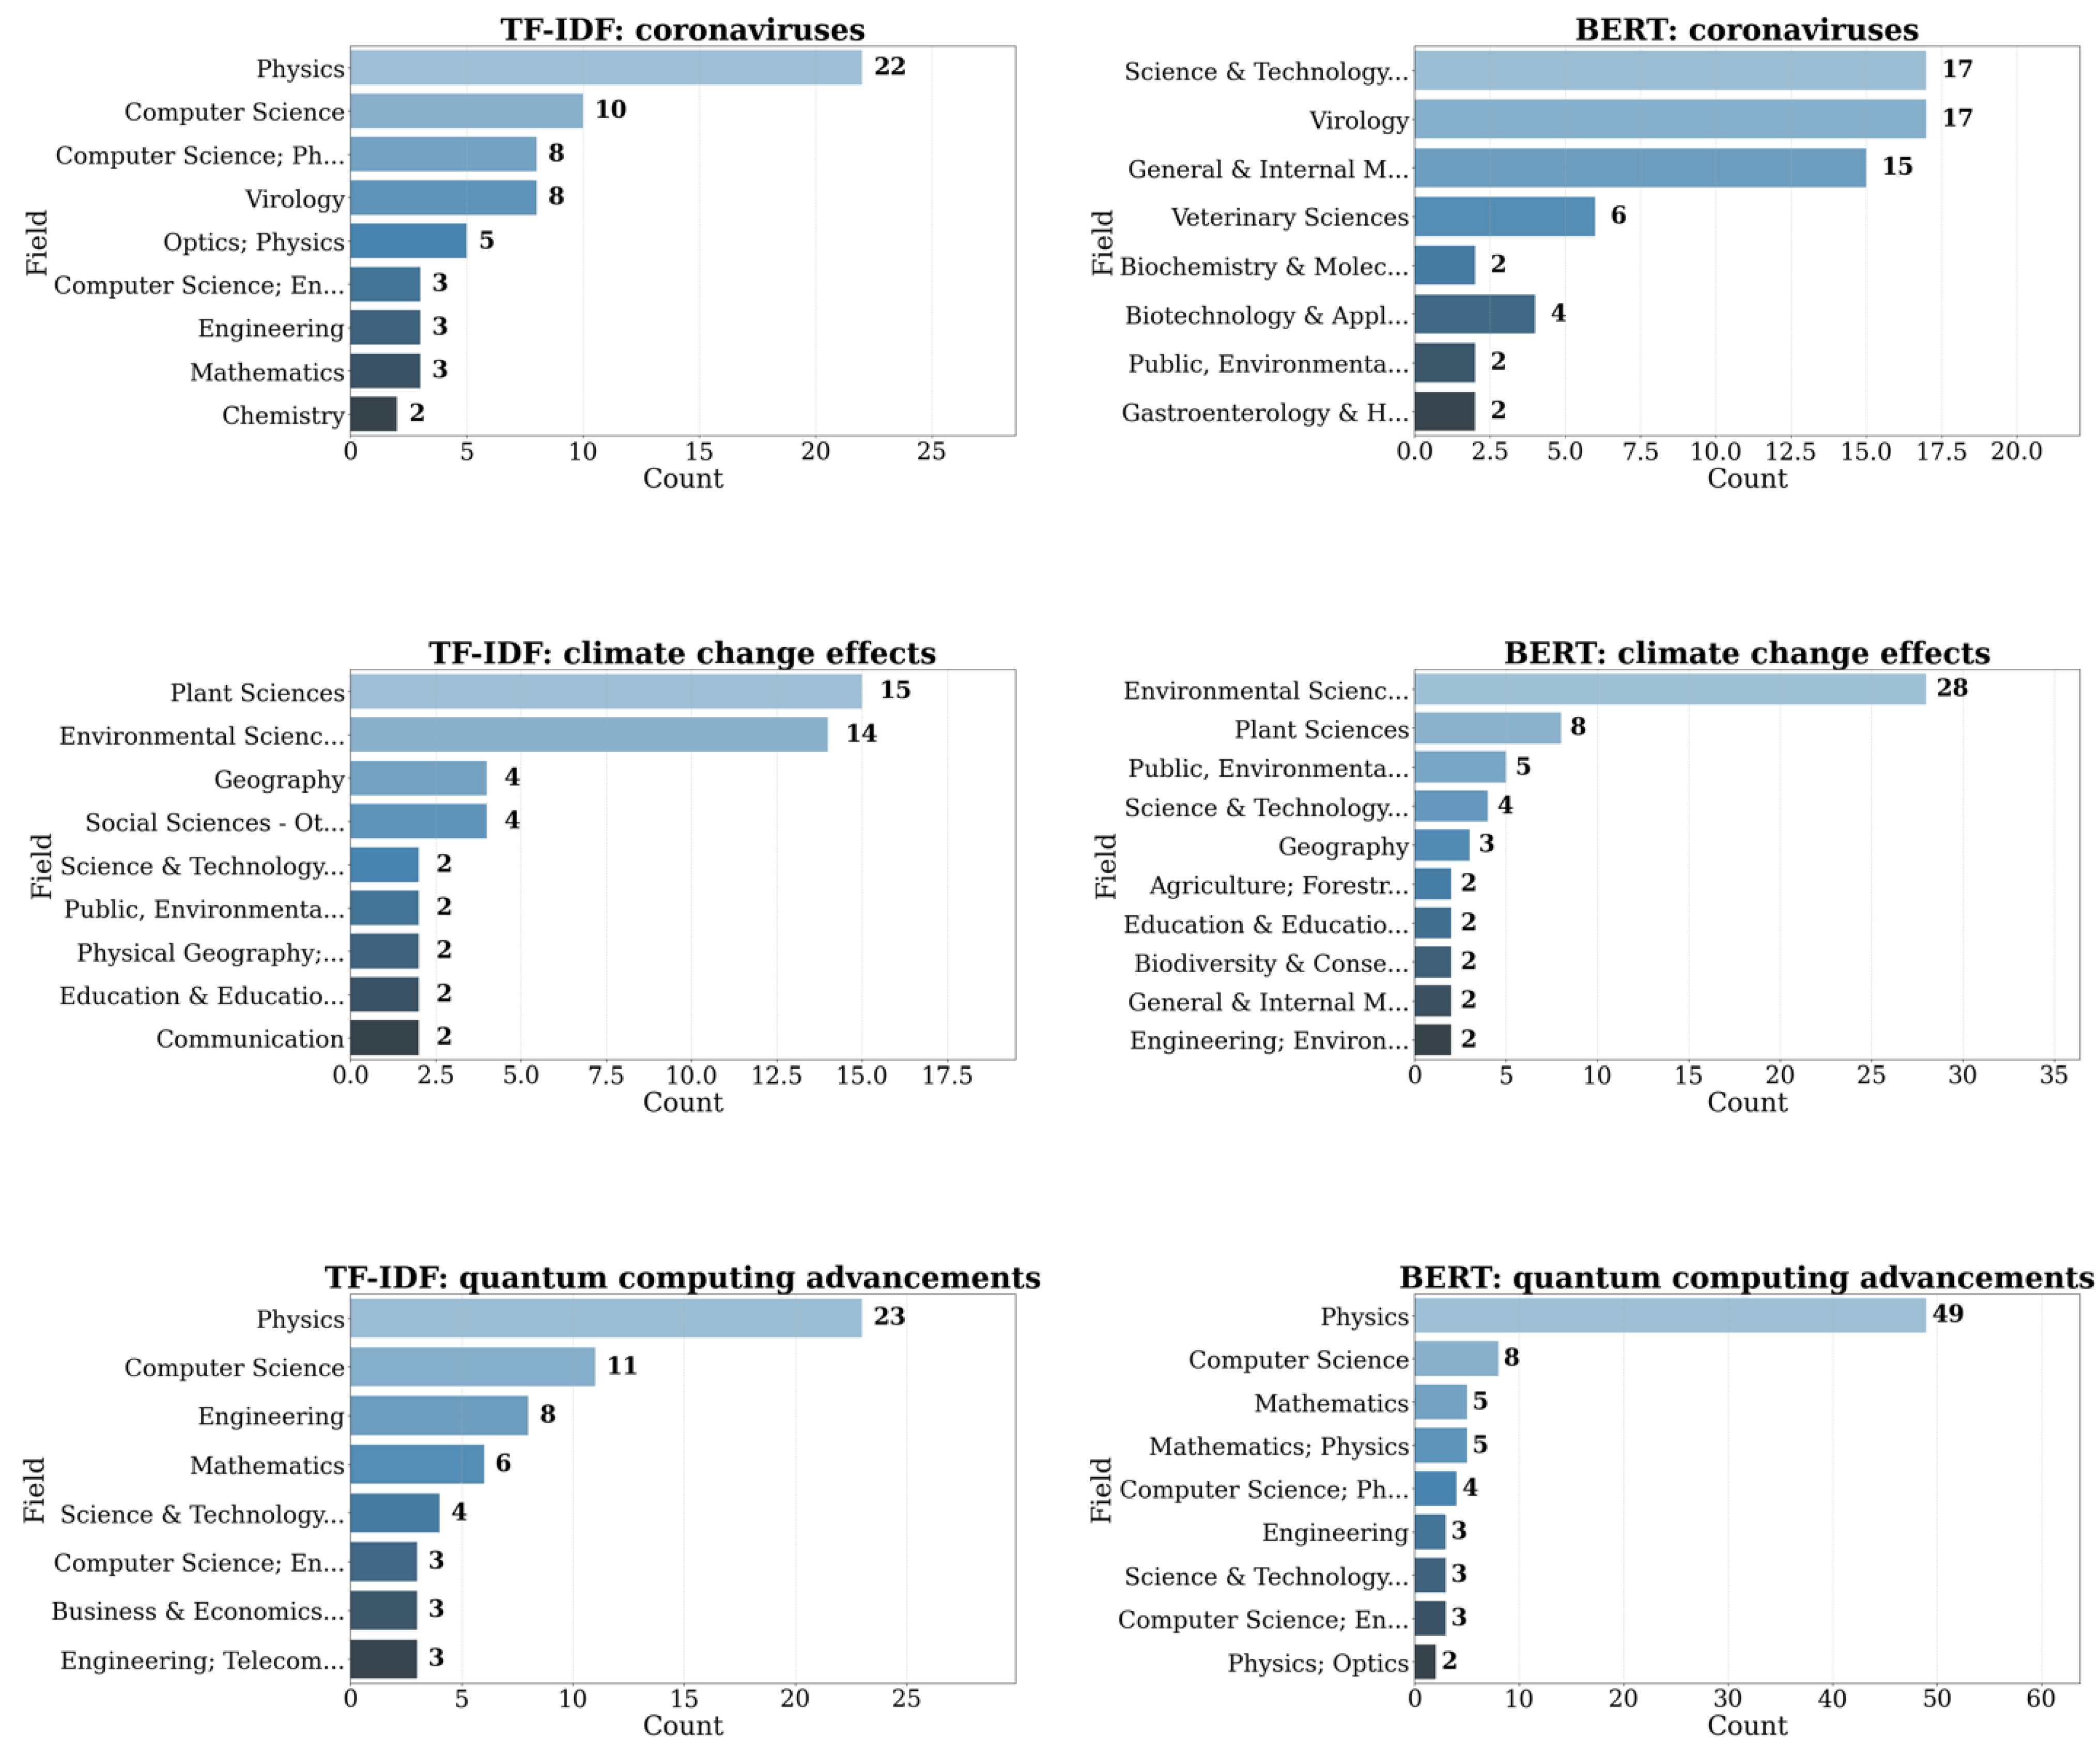
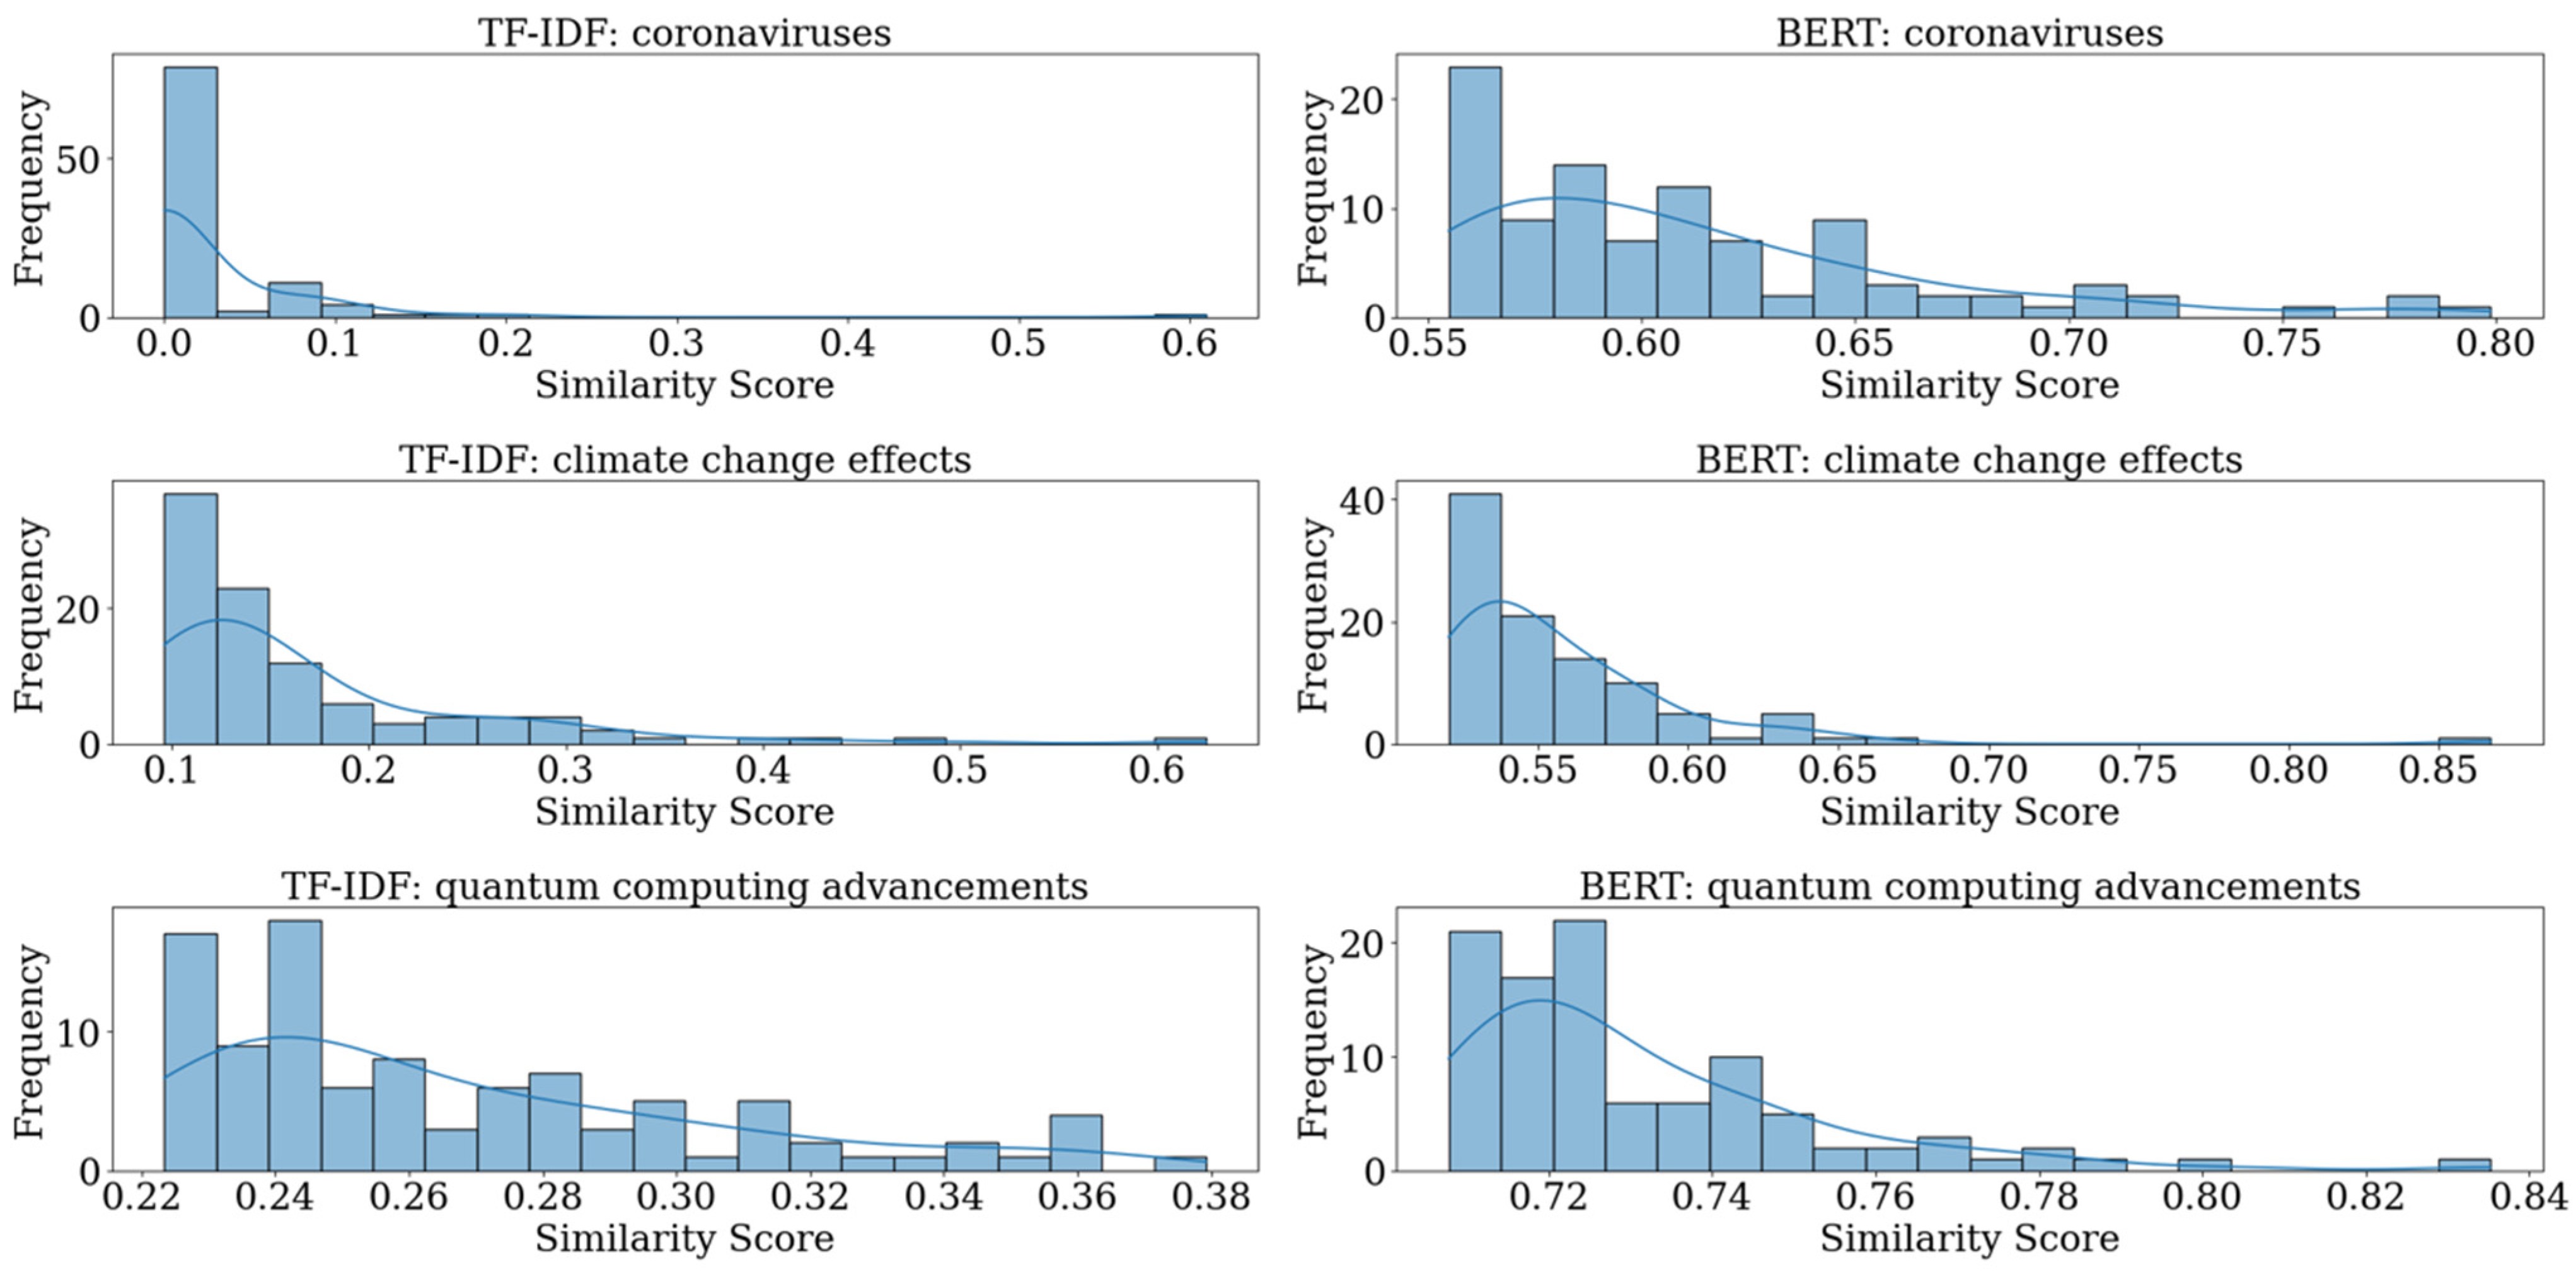
5.1. Evaluation of TF-IDF and BERT Model Performance

To evaluate the effectiveness of different word embedding techniques, we conducted a comparative analysis of TF-IDF with default parameters of scikit-learn’s tfidfVectorizer and BERT models using cosine similarity across various scientific topics. Three article queries of the topics “coronaviruses”, “climate change effects”, and “quantum computing advancements” were implemented to the raw data of 10,000 articles described in Section 3. For the results, we examined the distribution of top research fields (Figure 2), result overlap (Figure 3), and similarity score distribution and decay (Figure 4 and Figure 5). The patterns in the results demonstrated BERT’s superiority in capturing semantic nuances and contextual relationships. When analyzing similarity scores across the three topics—“coronaviruses”, “climate change effects”, and “quantum computing advancements”—BERT consistently produced better results. For instance, in the “coronaviruses” query, BERT’s similarity scores ranged from 0.55 to 0.80, while TF-IDF’s scores rapidly dropped below 0.2 after the top few results (Figure 5). Similarly, for “quantum computing advancements”, BERT maintained scores between 0.72 and 0.84, compared to TF-IDF’s range of 0.22–0.38. BERT also showed a more gradual decline in similarity scores as the rank increased, indicating better relevance even for lower-ranked results. Both methods demonstrated high result diversity, but BERT’s top results differed significantly from TF-IDF’s, with only 14–23% overlap across queries (Figure 4). This low overlap suggests BERT’s ability to identify relevant but less obviously related fields. For example, for the “coronaviruses” query, while TF-IDF heavily favored “Physics”, BERT highlighted a broader range including “Science & Technology—Other Topics” and “Virology”. These findings consistently demonstrate BERT’s enhanced capability in understanding context and semantic relationships, making it particularly valuable for complex scientific literature search and recommendation systems where nuanced topic analysis is crucial. However, it is important to note that TF-IDF’s execution time is significantly faster than BERT’s, which could be a crucial factor in applications where the processing speed is a priority.

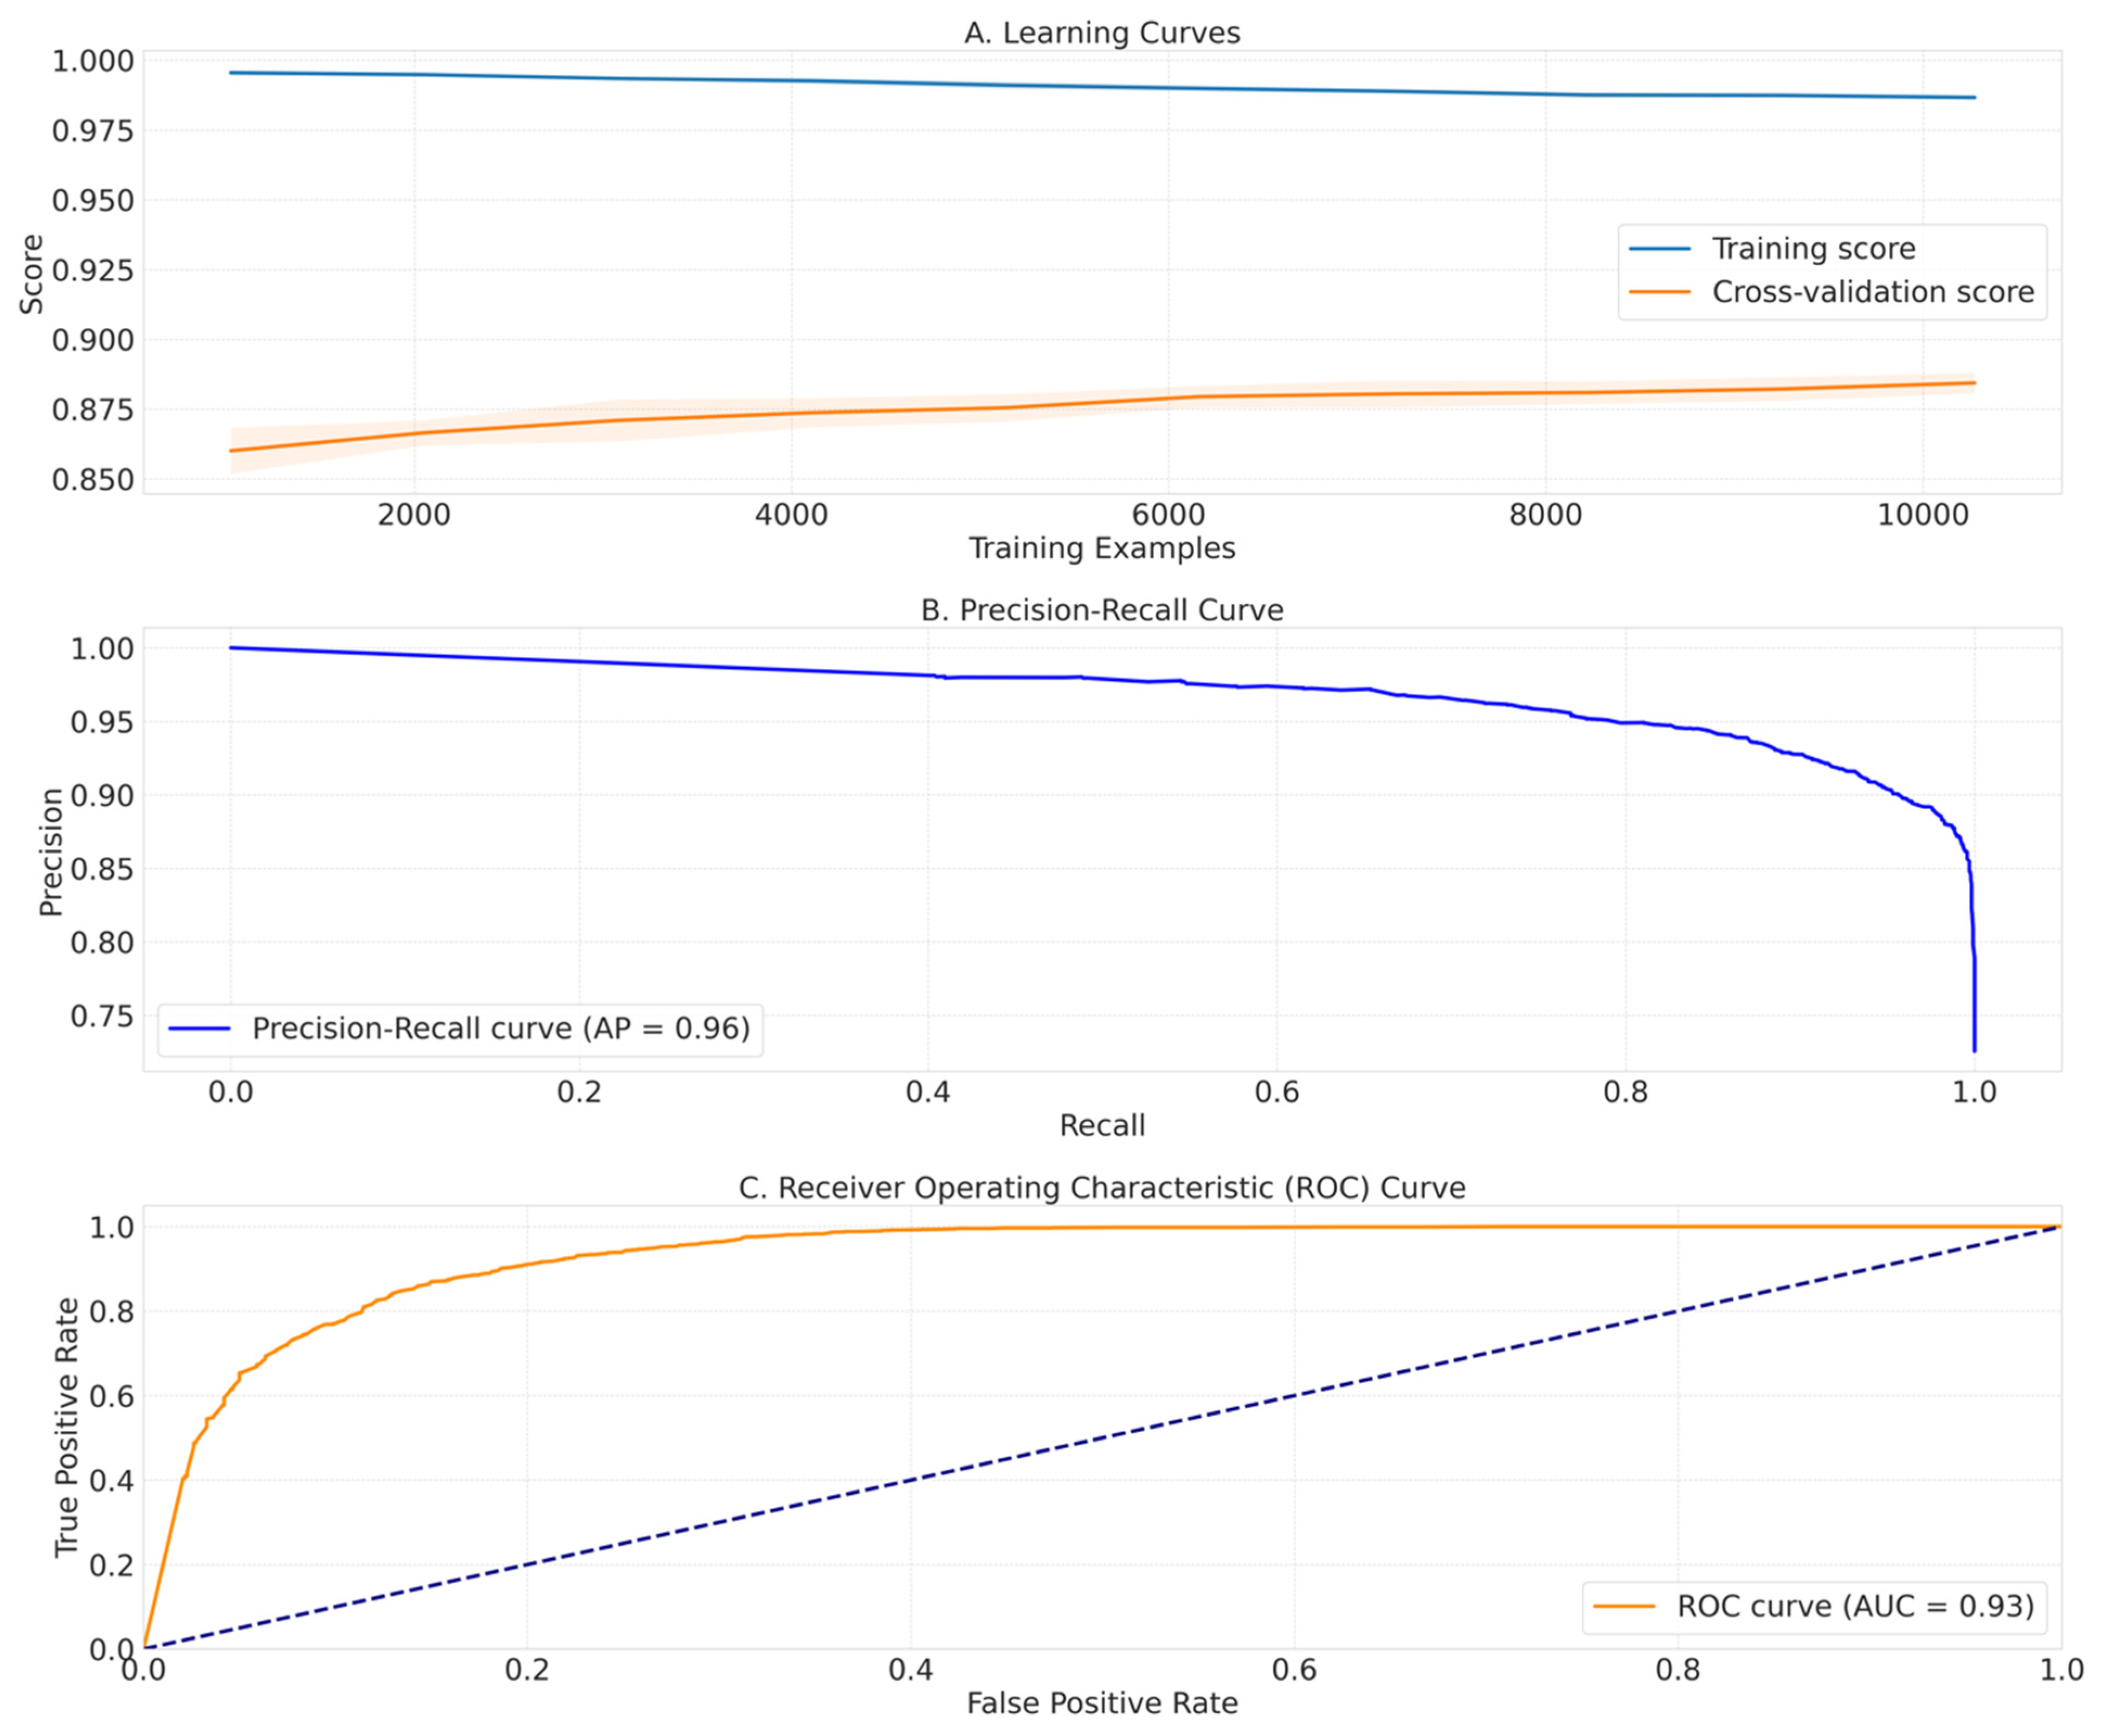
5.2. Evaluation of Random Forest Model Performance

For the Random Forest classifier, we performed hyperparameter tuning using GridSearchCV with 5-fold cross-validation to optimize model performance. The parameter grid included n_estimators = [50, 100, 200], max_depth = [10, 20, None], min_samples_split = [2, 5, 10], min_samples_leaf = [1, 2, 4], and max_features = [‘sqrt’, ‘log2’]. The F1-score was used as the evaluation metric to account for the class imbalance in our dataset. The optimal parameters found were max_depth = None, max_features = ‘sqrt’, min_samples_leaf = 1, min_samples_split = 10, and n_estimators = 100, achieving a cross-validation F1-score of 0.9275.
Our Random Forest classifier performed well in identifying retracted and non-retracted papers, with an overall accuracy of 90% on the test set of 16,052 articles (for more details for the test dataset, see the end of Section 3). From our experiment results (Table 2), we were able to determine that the model is good at detecting problematic papers. For retracted papers, the model showed a high precision (0.90) and recall (0.97), giving an F1-score of 0.93. For non-retracted papers, the model had good precision (0.89) but lower recall (0.71), with an F1-score of 0.79. The Area Under the ROC Curve (AUC) was 0.93, showing a strong ability to separate the two classes. We will give more details of the AUC in Section 5.2.
The confusion matrix (Figure 6A) shows the details of correct and incorrect predictions. The model correctly identified 97% of retracted papers, missing only 3%. For non-retracted papers, 71.0% were correctly classified, while 29.0% were wrongly marked as retracted. This pattern matches our goal of catching most problematic articles, even if some good papers are wrongly flagged.
For the feature importance (Figure 6B), we found that the citation count is the most important factor (53.26%), followed by the Altmetric score (30.19%) and impact factor (16.55%). This suggests that the level to which an article is cited and discussed matters more for predicting retraction than the reputation of the journal where the article is published.

5.3. Random Forest Model Validation

We tested the Random Forest model thoroughly to check its stability. The learning curves (Figure 7A) showed some gap between training accuracy (about 0.90) and cross-validation scores (about 0.88). This gap suggests some overfitting, but not enough to harm practical use, as the cross-validation scores remained steady (mean: 0.884, standard deviation: 0.0049). Moreover, the precision–recall curve (Figure 7B) stayed above 0.90 precision until the recall reached about 0.80, with an average precision (AP) of 0.96. This means the model maintains high-quality predictions across different settings. The ROC (Receiver Operating Characteristic) curve (Figure 7C) showed a quick rise and high AUC (0.93), further proving the model’s strong performance. The steep initial part of the ROC curve shows that the model can find many retracted papers with few false alarms.
To validate our modeling approach for retraction prediction, we conducted a comprehensive comparison of ten machine learning algorithms (results shown in Table 3): Random Forest, Gradient Boosting, XGBoost, Logistic Regression, Support Vector Machine, Neural Network (MLP), AdaBoost, K-Nearest Neighbors, Decision Tree, and Naive Bayes. All models underwent hyperparameter tuning using 5-fold cross-validation with the F1-score as the evaluation metric to account for the class imbalance in our dataset. Our experimental results show that Gradient Boosting achieved the highest performance with a test F1-score of 0.9336 and AUC of 0.9477, followed closely by XGBoost (F1-score: 0.9333, AUC: 0.9452) and Random Forest (F1-score: 0.9305, AUC: 0.9377). Statistical significance testing using McNemar’s test revealed that the differences between these top three models were not statistically significant (Gradient Boosting vs. XGBoost: p = 1.0000; Gradient Boosting vs. Random Forest: p = 0.1980), indicating comparable predictive capabilities. Despite Gradient Boosting’s marginally superior performance (0.31% improvement), we selected Random Forest as our primary classifier due to its superior interpretability through intuitive feature importance rankings, computational efficiency with faster training times and lower hyperparameter tuning requirements, and greater stability with a more consistent cross-validation performance. For scientific retraction detection, the model interpretability and ease of explanation are crucial for gaining trust from the research community, making Random Forest’s transparent decision-making process more valuable than the negligible performance difference. The comparison results validate that ensemble methods significantly outperform traditional machine learning approaches, with all three top models achieving F1-scores above 0.93 and demonstrating the effectiveness of tree-based algorithms for this classification task.
To validate our feature selection and model design, we conducted an ablation study examining individual feature contributions and model component sensitivity (shown in Table 4). Individual feature analysis revealed that citations achieved the highest standalone performance (F1-score: 0.8690), significantly outperforming the Altmetric score (0.8246) and impact factor (0.8348), confirming citation patterns as the strongest predictor of retraction. Feature combination analysis showed that the optimal two-feature combination of citations + Altmetric score (F1-score: 0.9334) slightly outperformed our full three-feature model (0.9305), with feature removal analysis revealing that removing citations caused the largest performance drop (10.70%) while removing the Altmetric score decreased the performance by 4.58%. Notably, removing the impact factor actually improved the performance by 0.31%, suggesting that it introduces predictive noise; however, we retained the impact factor in our model because it represents an important journal-level quality assessment that complements article-level metrics, provides valuable context for understanding retraction patterns across different journal tiers, enables a comprehensive analysis of institutional factors in research integrity, and maintains consistency with existing retraction studies that consider journal prestige as a relevant factor. Parameter ablation confirmed that the performance stabilized at 100 estimators with minimal variation across different max_features settings, validating our parameter choices and demonstrating model robustness, while the marginal performance cost (0.31%) of including the impact factor was acceptable given its important analytical benefits beyond the pure predictive performance.

5.4. Class Imbalance Mitigation and Impact Assessment

Our dataset exhibits a natural class imbalance, with retracted papers comprising 72.6% and non-retracted papers 27.4% of the total samples. To evaluate whether this imbalance poses a significant problem, we analyzed its specific performance impacts and found that while the distribution is mathematically imbalanced, it may not be as problematic as initially perceived. The original model achieved a strong overall performance (F1-score: 0.9305), with the primary impact being lower recall for non-retracted papers (70.8% vs. 96.6% for retracted papers), translating to approximately 29% of legitimate papers being incorrectly flagged for editorial review. Overall, this class distribution reflects the current natural retraction patterns in academic publishing data we retrieved, and forcing a perfect balance would artificially distort realistic scenarios.
Rather than employing synthetic data generation techniques that could introduce artificial bias, we implemented cost-sensitive learning (Table 5) with balanced class weights to address this imbalance while preserving authentic data distribution. We evaluated four different weighting strategies, with the balanced weights approach demonstrating the optimal performance by improving minority class recall from 70.8% to 78.1% (10.9% relative improvement) while maintaining a strong overall model performance with only a 0.62% decrease in F1-score. This reduced the false positive rate from 29% to 22%, demonstrating that the imbalance effects are addressable through established techniques without compromising core model functionality.

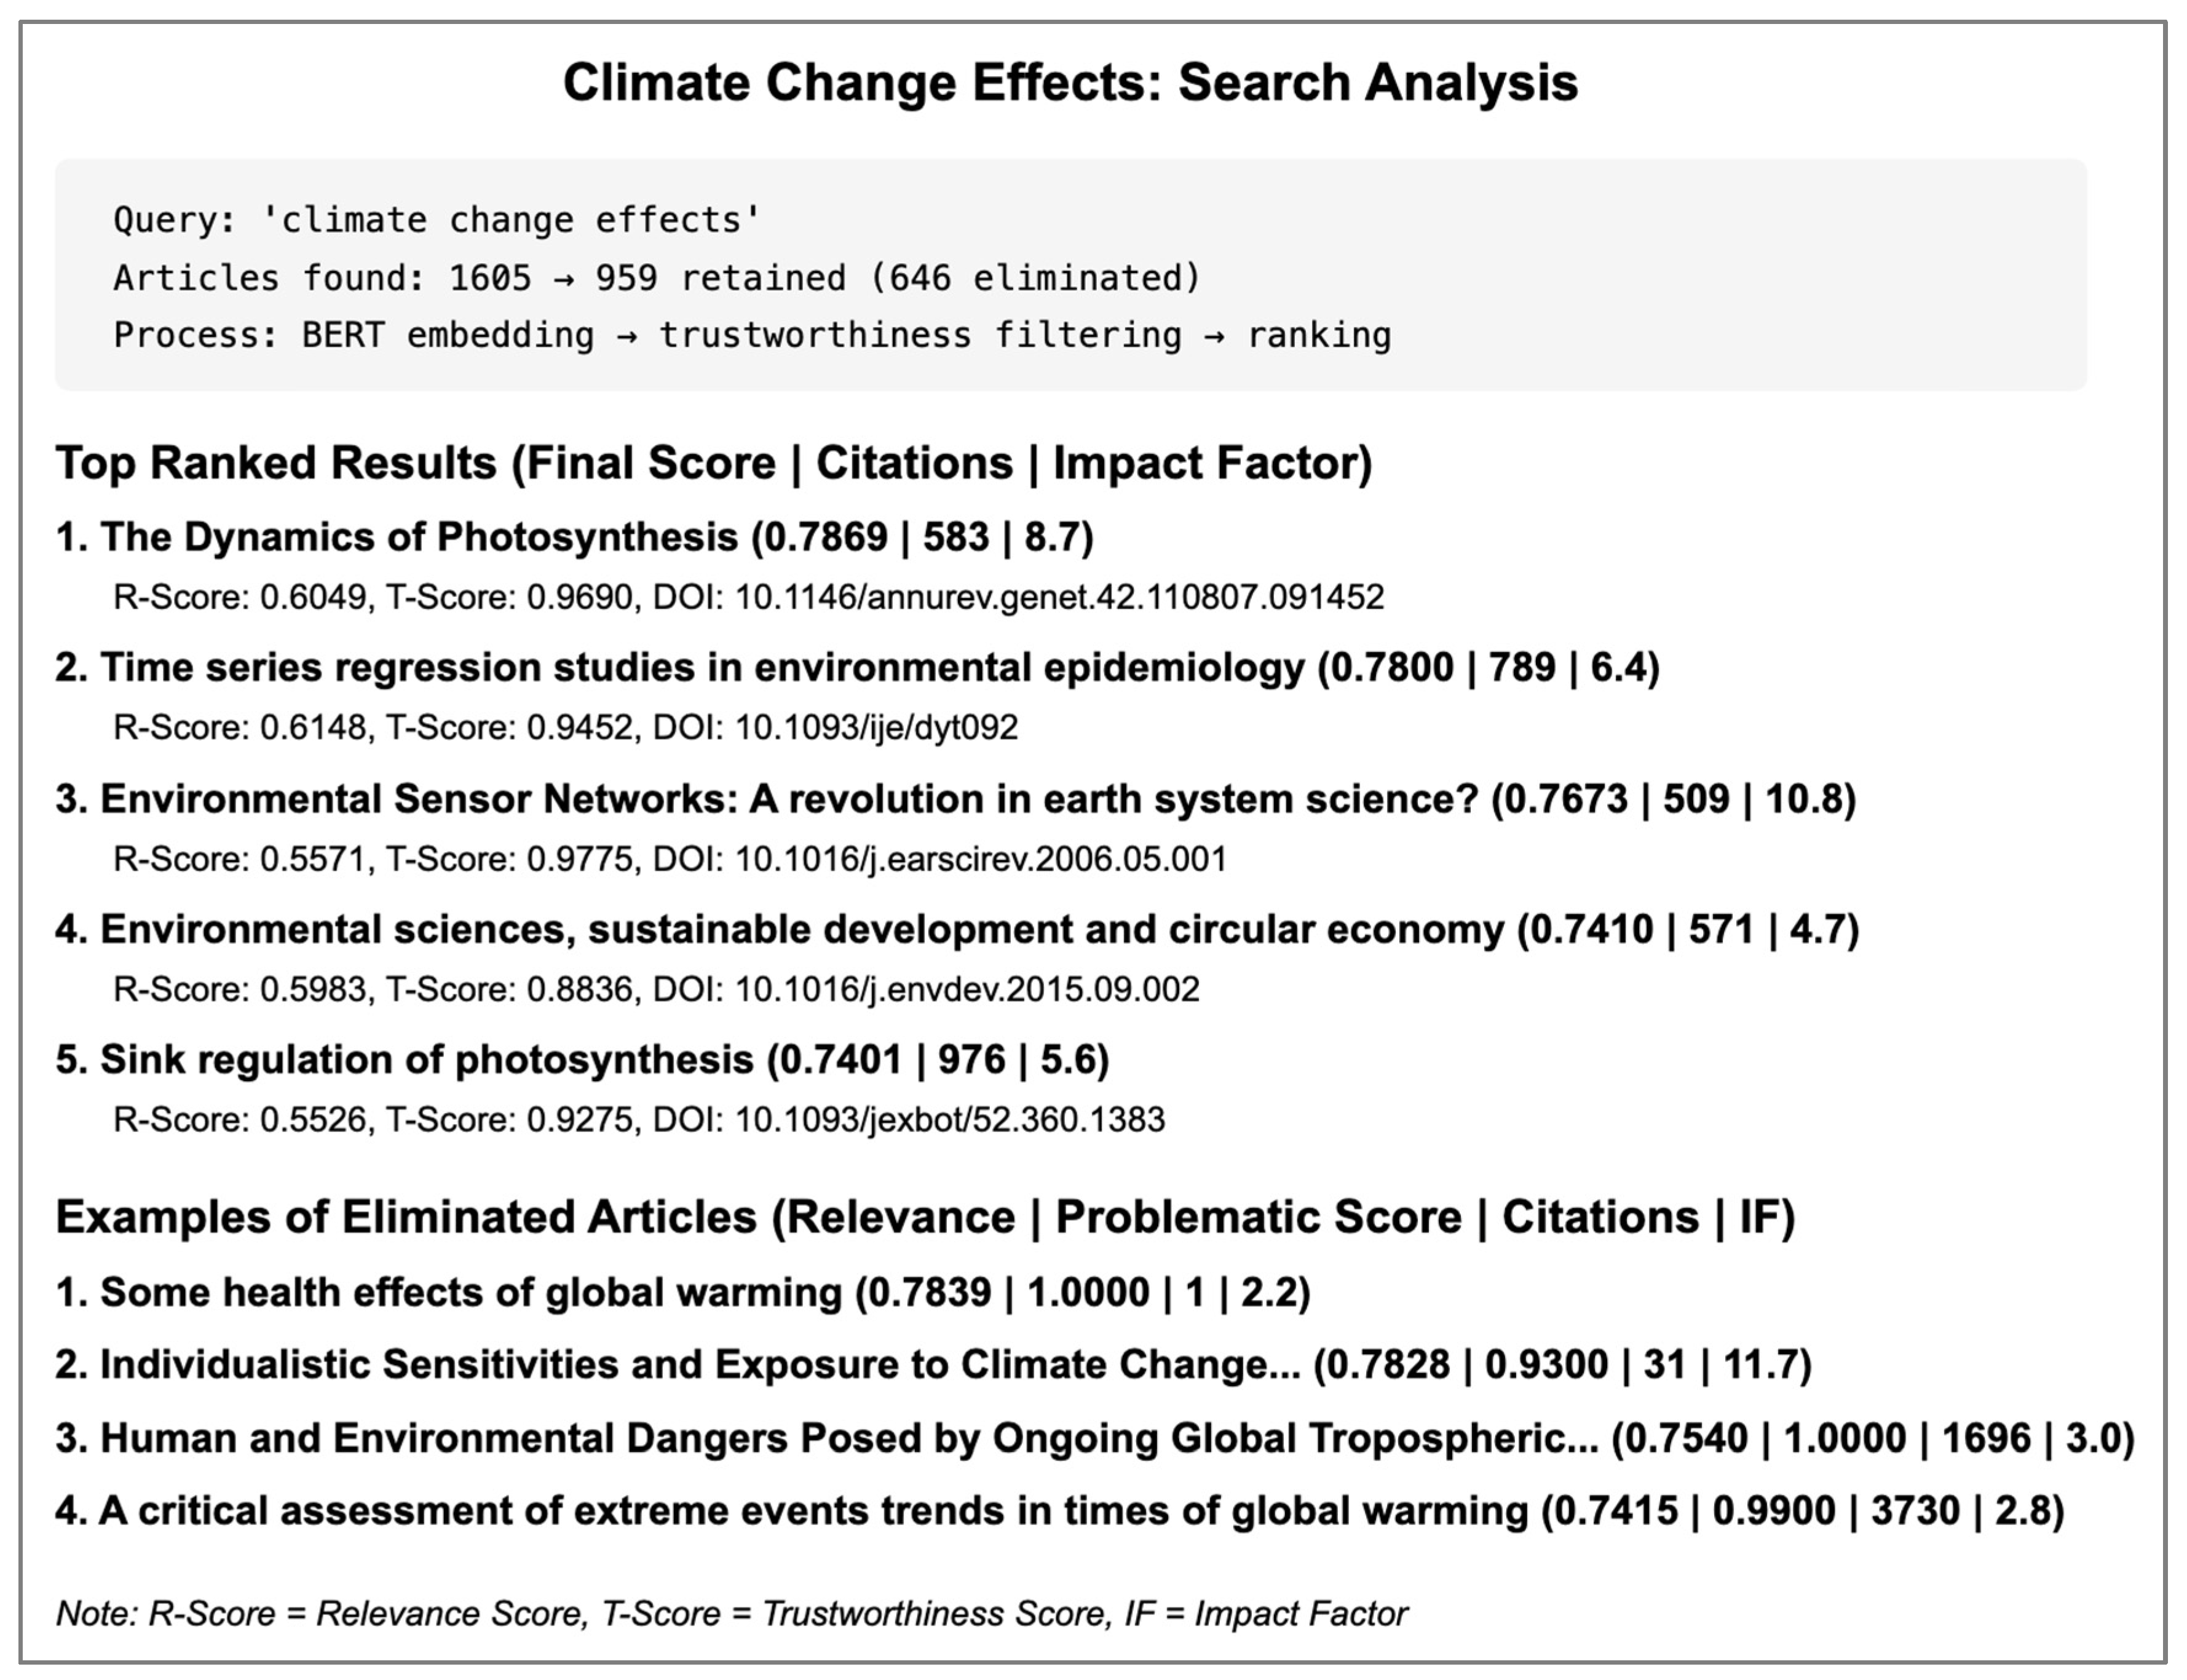
5.5. Exemplar Result and Discussion

In our designed three-layer architecture, the ranking mechanism serves as the final layer, following the BERT-based similarity comparison and article elimination stages as mentioned above in Section 5.1, Section 5.2 and Section 5.3. Figure 8 shows an exemplar result in our work after all the steps in the three layers are finished. In this example, “climate change effects” was the input keyword for the literature search. A total of 1605 similar articles were retrieved from the database based on a similarity comparison in the first layer. In the second layer, the filtering algorithm eliminated 646 retracted articles, leaving 959 valid results. Finally in the third layer, based on the proposed ranking method, the top five most relevant articles were presented to the user. This sequential approach ensures that search results are first filtered for relevance, then screened for trustworthiness, and finally, ranked according to our composite scoring system. Overall, the result demonstrates how multi-factor analysis can improve the search result quality beyond simple relevance matching.
After evaluating the experiment results, we were able to summarize the findings and potential limitations of each layer. In Layer 1, from the experiments we conducted in Section 5.1, we found that using BERT embedding with cosine similarity is the best approach for finding the most relevant articles based on the user-input keywords. In Layer 2, while our Random Forest classification model performed well overall, we found several issues that should be noted. First, our dataset had a significant imbalance, with 72.57% retracted papers and only 27.43% non-retracted papers. This uneven split likely affected how the model learned and may explain why it performed differently in each class. Second, the model was very good at finding retracted papers (97% recall) but less effective at correctly identifying non-retracted papers (71.0% recall). This means that 29.0% of good papers were wrongly flagged as problematic. In real use, this could cause valid research to be unfairly questioned. However, this tendency is suitable for our main goal of filtering out questionable articles from search results. Third, we saw a gap between how well the model performed on training data versus testing data, suggesting some overfitting. Though this did not greatly harm the model’s usefulness, it indicates that some patterns the model learned might be specific to our dataset and might not work as well with new data. In Layer 3, our ranking algorithm remains in early experimental stages and requires further validation and refinement with reference data from experts, to determine its effectiveness in real-world applications.
This study holds both theoretical and practical significance for the fields of information retrieval, scholarly communication, and research integrity. Theoretically, it contributes to the advancement of trust-aware search systems by demonstrating how semantic similarity, classification models, and composite ranking functions can be joined in a multi-layer structure to address the challenges of relevance and trustworthiness in academic article discovery. Unlike traditional search systems that rely on single-criterion ranking or opaque algorithms, our method introduces a more interpretable and systematic approach grounded in modern NLP and machine learning. It provides a framework that can be extended to evaluate not only articles but also other scholarly objects such as datasets and software packages. Practically, the system addresses a growing need in the research community for tools that help users confidently identify high-quality literature amid rising publication volumes and concerns about misinformation and retractions. The modular design allows for easy adaptation across disciplines and use cases, while the use of open data sources and transparent scoring functions supports reproducibility and user trust. By placing indicators of scientific reliability alongside topical relevance, this system empowers users to make more informed decisions about what research to read, cite, and build upon. Furthermore, researchers, librarians, and research administrators can use the system to streamline literature reviews, examine citations, and support quality assurance processes in their work.
Based on these findings, we see several ways to improve our work in the future. A fundamental opportunity is to enhance the feature dataset by collecting and developing additional indicators that capture new dimensions of article quality, such as the h-index indicating the impact and productivity of authors, author network analysis, institutional affiliations, and other publication metadata. We will also address the dataset imbalance more fundamentally by expanding our dataset through collaboration with additional journals and academic institutions, with a particular focus on increasing the representation of non-retracted papers. This approach will naturally improve class balance while maintaining data authenticity and ensuring that the model reflects genuine publication patterns rather than artificially modified distributions. For the final ranking (Layer 3), we plan to obtain expert validation through structured surveys to determine the effectiveness of the ranking system across diverse research domains and publication types. The other way to address this problem is to use Large Language Models [25] to determine the effectiveness of the ranking models. To improve accessibility, we will develop an intuitive web interface where researchers can easily find trustworthy articles and understand the process of why those articles are chosen. For example, the trust ranking scores will be shown alongside their search results. Finally, a list of user studies can be conducted with researchers from various disciplines to gather feedback on the system’s usability. We hope these enhancements will transform our current research prototype into a practical tool that helps researchers to navigate the ever-expanding scientific literature with greater confidence and discover more trustworthy articles.

6. Conclusions

This study developed a three-layered system to help researchers find trustworthy academic articles. Our system first used BERT embedding to identify relevant articles, then applied a Random Forest classifier to filter out questionable papers and finally ranked results using a custom scoring system that balanced relevance with trustworthiness. The classification model performed well in our experiments, with a 90% overall accuracy, and was especially good at finding retracted papers (97% recall). We found that citation counts were the strongest signs of article trustworthiness (53.26% importance), followed by Altmetric scores (30.19%) and journal impact factors (16.55%). This finding suggests that how the academic community engages with an article may be more important than where it was published when assessing its reliability. While our system performed well in the experiments, it also showed some limitations. The model was more likely to wrongly flag good papers (29.0% false positive rate) than to miss problematic ones. This result matches our goal of filtering out questionable research but also shows that we can improve the method of handling good papers. We hope that this work will be of interest to practitioners in the fields of open data and open science, especially those working on technical systems.

Author Contributions

Conceptualization, X.M. and C.L.; methodology, C.L.; software, C.L.; validation, X.M., J.Z. and W.C.; formal analysis, C.L.; writing—original draft preparation, C.L.; writing—review and editing, X.M., J.Z. and W.C.; funding acquisition, X.M. All authors have read and agreed to the published version of the manuscript.

Funding

This research was funded by National Science Foundation (U.S.) grant numbers 2019609 and 2126315. The APC was waived by MDPI.

Data Availability Statement

The data and code supporting the findings of this study are available in the GitHub repository: https://github.com/Akaoreo/Trust_CF_ranking (accessed on 2 July 2025).

Conflicts of Interest

The authors declare no conflict of interest.

References

  1. Fire, M.; Guestrin, C. Over-optimization of academic publishing metrics: Observing Goodhart’s Law in action. GigaScience 2019, 8, giz053. [Google Scholar] [CrossRef] [PubMed]
  2. Kelly, J.; Sadeghieh, T.; Adeli, K. Peer Review in Scientific Publications: Benefits, Critiques, & A Survival Guide. EJIFCC 2014, 25, 227–243. Available online: https://www.ncbi.nlm.nih.gov/pmc/articles/PMC4975196/ (accessed on 28 March 2025). [PubMed]
  3. Pal, S. What is Text Similarity and How to Implement it ? MLSAKIIT. Available online: https://medium.com/msackiit/what-is-text-similarity-and-how-to-implement-it-c74c8b641883 (accessed on 28 March 2025).
  4. Intellica.AI. Comparison of Different Word Embeddings on Text Similarity—A Use Case in NLP. Medium. Available online: https://intellica-ai.medium.com/comparison-of-different-word-embeddings-on-text-similarity-a-use-case-in-nlp-e83e08469c1c (accessed on 28 March 2025).
  5. Liberti, L.; Lavor, C.; Maculan, N.; Mucherino, A. Euclidean distance geometry and applications. arXiv 2012, arXiv:1205.0349. [Google Scholar] [CrossRef]
  6. Steck, H.; Ekanadham, C.; Kallus, N. Is Cosine-Similarity of Embeddings Really About Similarity? In Proceedings of the Companion ACM Web Conference, Singapore, 13–17 May 2024; pp. 887–890. [Google Scholar] [CrossRef]
  7. Neha. A Simple Guide to Metrics for Calculating String Similarity. Analytics Vidhya. Available online: https://www.analyticsvidhya.com/blog/2021/02/a-simple-guide-to-metrics-for-calculating-string-similarity/ (accessed on 28 March 2025).
  8. Qian, G.; Sural, S.; Gu, Y.; Pramanik, S. Similarity Between Euclidean and Cosine Angle Distance for Nearest Neighbor Queries. In Proceedings of the 2004 ACM Symposium on Applied Computing, in SAC ’04, Nicosia, Cyprus, 14–17 March 2004; Association for Computing Machinery: New York, NY, USA, 2004; pp. 1232–1237. [Google Scholar] [CrossRef]
  9. Bosker, H.R. Using fuzzy string matching for automated assessment of listener transcripts in speech intelligibility studies. Behav. Res. Methods 2021, 53, 1945–1953. [Google Scholar] [CrossRef] [PubMed]
  10. Shimomura, L.C.; Oyamada, R.S.; Vieira, M.R.; Kaster, D.S. A survey on graph-based methods for similarity searches in metric spaces. Inf. Syst. 2021, 95, 101507. [Google Scholar] [CrossRef]
  11. Sammut, C.; Webb, G.I. (Eds.) TF–IDF. In Encyclopedia of Machine Learning; Springer: Boston, MA, USA, 2010; pp. 986–987. [Google Scholar] [CrossRef]
  12. Mikolov, T.; Chen, K.; Corrado, G.; Dean, J. Efficient Estimation of Word Representations in Vector Space. arXiv 2013, arXiv:1301.3781. [Google Scholar] [CrossRef]
  13. Le, Q.V.; Mikolov, T. Distributed Representations of Sentences and Documents. arXiv 2014, arXiv:1405.4053. [Google Scholar] [CrossRef]
  14. Devlin, J.; Chang, M.-W.; Lee, K.; Toutanova, K. BERT: Pre-training of Deep Bidirectional Transformers for Language Understanding. arXiv 2019, arXiv:1810.04805. [Google Scholar] [CrossRef]
  15. Bornmann, L.; Daniel, H. What do citation counts measure? A review of studies on citing behavior. J. Doc. 2008, 64, 45–80. [Google Scholar] [CrossRef]
  16. Ioannidis, J.P.A. Why Most Published Research Findings Are False. PLoS Med. 2005, 2, e124. [Google Scholar] [CrossRef] [PubMed]
  17. Kousha, K.; Thelwall, M. Are wikipedia citations important evidence of the impact of scholarly articles and books? J. Assoc. Inf. Sci. Technol. 2017, 68, 762–779. [Google Scholar] [CrossRef]
  18. Castillo, C.; Mendoza, M.; Poblete, B. Information Credibility on Twitter. In Proceedings of the 20th International Conference on World Wide Web, in WWW ’11, Hyderabad, India, 28 March–1 April 2011; Association for Computing Machinery: New York, NY, USA, 2011; pp. 675–684. [Google Scholar] [CrossRef]
  19. Pérez-Rosas, V.; Kleinberg, B.; Lefevre, A.; Mihalcea, R. Automatic Detection of Fake News. In Proceedings of the 27th International Conference on Computational Linguistics; Bender, E.M., Derczynski, L., Isabelle, P., Eds.; Association for Computational Linguistics: Santa Fe, NM, USA, 2018; pp. 3391–3401. Available online: https://aclanthology.org/C18-1287/ (accessed on 28 March 2025).
  20. Beel, J.; Gipp, B. Google Scholar’s Ranking Algorithm: The Impact of Citation Counts (An Empirical Study). In Proceedings of the 2009 Third International Conference on Research Challenges in Information Science, Fez, Morocco, 22–24 April 2009; pp. 439–446. [Google Scholar] [CrossRef]
  21. Falagas, M.E.; Pitsouni, E.I.; Malietzis, G.A.; Pappas, G. Comparison of PubMed, Scopus, Web of Science, and Google Scholar: Strengths and weaknesses. FASEB J. Off. Publ. Fed. Am. Soc. Exp. Biol. 2008, 22, 338–342. [Google Scholar] [CrossRef] [PubMed]
  22. Lu, Z. PubMed and beyond: A survey of web tools for searching biomedical literature. Database J. Biol. Databases Curation 2011, 2011, baq036. [Google Scholar] [CrossRef] [PubMed]
  23. Retraction Watch. Available online: https://retractionwatch.com/ (accessed on 28 March 2025).
  24. Nature Editorial. Why retractions data could be a powerful tool for cleaning up science. Nature 2025, 638, 581. [Google Scholar] [CrossRef] [PubMed]
  25. Gu, J.; Jiang, X.; Shi, Z.; Tan, H.; Zhai, X.; Xu, C.; Li, W.; Shen, Y.; Ma, S.; Liu, H.; et al. A Survey on LLM-as-a-Judge. arXiv 2025, arXiv:2411.15594. [Google Scholar] [CrossRef]
Figure 1. Detailed steps in the three-layer architecture of our proposed system for the trustworthiness ranking and recommendation of academic articles.
Algorithms 18 00408 g001
Figure 2. The top fields/topics of three different queries using TF-IDF and BERT methods. The detailed fields/topics in each diagram are from the metadata of the retrieved articles.
Algorithms 18 00408 g002
Figure 3. The overlap ratio between TF-IDF and BERT top 100 results for three different queries.
Algorithms 18 00408 g003
Figure 4. Distribution of similarity scores for query results of three different topics using TF-IDF and BERT.
Algorithms 18 00408 g004
Figure 5. Patterns of cosine similarity decay for query results of three different topics using TF-IDF and BERT.
Algorithms 18 00408 g005
Figure 6. Confusion matrix and feature importance of the Random Forest classification model. The percentage of the model’s correct and incorrect predictions is shown in the confusion matrix. The impact of each feature on the model’s predictions is shown in the feature importance.
Algorithms 18 00408 g006
Figure 7. Metrics used to validate the performance of the Random Forest model. The learning curve shows the model’s performance with different iterations. The precision–recall curve shows the relationship between precision and recall under different classification thresholds. The ROC curve shows the true positive rate against the false positive rate across different thresholds, the dash line represents the line of no discrimination.
Algorithms 18 00408 g007
Figure 8. An exemplar result following the three-layer architecture of our proposed system. The result shows not only the top recommended articles with additional metadata but also some eliminated articles. It is noteworthy that the eliminated articles shown in this result are all retracted in the real world.
Algorithms 18 00408 g008
Table 1. Example of the final dataset.
Article TitleCitedImpact FactorAltmetric ScoreDOIRetractedSeverity Category
Zika virus: Current concerns in India29.02.76.610.4103/ijmr.IJMR_1160_17nogood
Emergence of H3N2pM-like and novel reassortant H3N1 swine viruses possessing segments derived from the A (H1N1)pdm09 influenza virus, Korea17.04.38.24210.1111/irv.12154nogood
ICTV Virus Taxonomy Profile: Virgaviridae85.03.63.010.1099/jgv.0.000884nogood
Taming influenza viruses13.02.50.510.1016/j.virusres.2011.09.035nogood
Down-regulation of the long noncoding RNA-HOX transcript antisense intergenic RNA inhibits the occurrence and progression of glioma3.031.010.1002/jcb.30040yescritical
Interleukin-6 promotes the migration and cellular senescence and inhibits apoptosis of human intrahepatic biliary epithelial cells2.031.010.1002/jcb.30039yescritical
MicroRNA-205 acts as a tumor suppressor in osteosarcoma via targeting RUNX22.03.87.3310.3892/or.2021.8106yescritical
MiR-132 inhibits cell proliferation, invasion, and migration of hepatocellular carcinoma by targeting PIK3R31.04.50.2510.3892/ijo.2021.5238yescritical
Table 2. Performance of Random Forest classification.
Classification Report
ClassPrecisionRecallF1-ScoreSupport
00.890.710.79881
10.900.970.932330
Accuracy 0.893211
Macro Avg.0.880.840.863211
Weighted Avg.0.890.900.893211
Table 3. Performance comparison of machine learning models for retraction prediction.
ModelCV F1-ScoreTest F1-ScoreAUCRank
Gradient Boosting0.93040.93360.94771
XGBoost0.92960.93330.94522
Random Forest0.92750.93050.93773
Decision Tree0.91850.92660.89424
AdaBoost0.90610.91180.89695
K-Nearest Neighbors0.90550.91140.89316
Neural Network0.90520.90920.86577
SVM0.87060.86850.79568
Logistic Regression0.84850.84810.74769
Naive Bayes0.12270.12860.582110
Table 4. Ablation study results for feature contributions.
ConfigurationFeaturesTest F1Performance Drop
Full ModelCitations + Altmetric + Impact0.9305-
Best Two-FeatureCitations + Altmetric0.93340.29%
Without CitationsAltmetric + Impact0.831−10.70%
Without Altmetric ScoreCitations + Impact0.888−4.58%
Without Impact FactorCitations + Altmetric0.93340.31%
Citations OnlyCitations0.869−6.62%
Altmetric Score OnlyAltmetric Score0.8246−11.38%
Impact Factor OnlyImpact Factor0.8348−10.29%
Table 5. Model cost-sensitive learning results.
ApproachF1-ScorePrecision
(Non-Retracted)
Recall
(Non-Retracted)
Precision
(Retracted)
Recall
(Retracted)
Balanced
Accuracy
No Weights (Original)0.93050.88760.70830.89750.96610.8372
Balanced Weights0.92430.80940.78090.91830.93050.8557
Custom Weights (Conservative)0.92030.79090.78550.91910.92150.8535
Custom Weights (Moderate)0.92660.83440.75480.91050.94330.8491
Disclaimer/Publisher’s Note: The statements, opinions and data contained in all publications are solely those of the individual author(s) and contributor(s) and not of MDPI and/or the editor(s). MDPI and/or the editor(s) disclaim responsibility for any injury to people or property resulting from any ideas, methods, instructions or products referred to in the content.

