You are currently viewing a new version of our website. To view the old version click .
Algorithms
  • Article
  • Open Access

7 June 2025

Effective Detection of Malicious Uniform Resource Locator (URLs) Using Deep-Learning Techniques

,
,
and
1
Department of Information Technology, Injibara University, Injibara 40, Ethiopia
2
Department of Computer Engineering, Bahir Dar Institute of Technology, Bahir Dar 26, Ethiopia
*
Author to whom correspondence should be addressed.
This article belongs to the Collection Feature Papers in Algorithms for Multidisciplinary Applications

Abstract

The rapid growth of internet usage in daily life has led to a significant increase in cyber threats, with malicious URLs serving as a common cybercrime. Traditional detection methods often suffer from high false alarm rates and struggle to keep pace with evolving threats due to outdated feature extraction techniques and datasets. To address these limitations, we propose a deep learning-based approach aimed at developing an effective model for detecting malicious URLs. Our proposed method, the Char2B model, leverages a fusion of BERT and CharBiGRU embedding, further enhanced by a Conv1D layer with a kernel size of three and unit-sized stride and padding. After combining the embedding, we used the BERT model as a baseline for comparison. The study involved collecting a dataset of 87,216 URLs, comprising both benign and malicious samples sourced from the open project directory (DMOZ), PhishTank, and Any.Run. Models were trained using the training set and evaluated on the test set using standard metrics, including accuracy, precision, recall, and F1-score. Through iterative refinement, we optimized the model’s performance to maximize its effectiveness. As a result, our proposed model achieved 98.50% accuracy, 98.27% precision, 98.69% recall, and a 98.48% F1-score, outperforming the baseline BERT model. Additionally, the false positive rate of our model was 0.017 better than the baseline model’s 0.018. By effectively extracting and utilizing informative features, the model accurately classified URLs into benign and malicious categories, thereby improving detection capabilities. This study highlights the significance of our deep learning approach in strengthening cybersecurity by integrating advanced algorithms that enhance detection accuracy, bolster defense mechanisms, and contribute to a safer digital environment.

1. Introduction

The proliferation of internet usage in our daily lives has introduced a surge in cyber threats, with malicious uniform resource locators being a prevalent vehicle for cybercrimes like phishing attacks and malware distribution [,]. A malicious URL has been designed to disseminate viruses, ransomware, spyware, malware, phishing, and other threats. By clicking on an infected URL, a user may download malware that could negatively influence the computer or be tricked into giving personal information to a fraudulent website that could result in significant losses. These threats need to be recognized and dealt with quickly and effectively. Traditionally, the blacklist method is used, which matches keywords with known malicious domain names kept in a repository used for detection. This approach has the benefit of low false positive rates concerning previously identified malicious URLs, and it is quick and simple to use. Nevertheless, this technique is unable to identify recently created malicious URLs. To address these challenges, contemporary researchers employ classical machine learning methodologies [].
The increasing digitization of daily activities including banking, social networking, e-commerce, and business operations is accompanied by a corresponding escalation in cybercrime risks. Malicious actors routinely weaponize URLs as attack vectors, employing them to deceive users and facilitate unauthorized system access or data breaches. This growing threat landscape underscores the critical importance of robust URL security measures. While established protocols and legal frameworks provide some protection for client-server communications, determined adversaries continue to exploit vulnerabilities. These threats manifest in various forms, including phishing, spam, and adware, collectively categorized as malware. Annually, malicious URL schemes defraud unsuspecting users worldwide, resulting in financial losses exceeding billions of dollars. In response, the cybersecurity community has implemented blacklisting services that catalog known malicious URLs [,]. However, these reactive measures primarily address previously identified threats, leaving systems vulnerable to novel attack vectors.
Detecting and mitigating malicious URLs is a critical aspect of maintaining online security. Traditional methods for identifying malicious URLs such as rule-based or signature-based techniques have been widely used to detect known threats. However, these approaches often fall short in the face of the rapidly evolving tactics employed by cybercriminals. As new and uniquely crafted malicious URLs continue to emerge, conventional detection methods struggle to keep pace, resulting in reduced effectiveness. This highlights a critical need for more sophisticated and adaptive detection approaches that can respond to the dynamic nature of cyber threats. Advanced, robust techniques are essential for accurately identifying and mitigating these threats in real-time [].
While existing machine learning and deep learning models have shown promise in detecting malicious URLs, they often face several limitations. Traditional machine learning approaches heavily depend on manually engineered features, which are prone to obsolescence as cybercriminals continually evolve their tactics. Deep learning models, such as those relying solely on character-level or word-level embedding, may struggle to capture both fine-grained structures and contextual relationships in URLs, leading to reduced generalizability and susceptibility to attacks like typo squatting and character substitution []. To address these shortcomings, we propose a hybrid deep learning framework, Char2B, that integrates BERT embedding for capturing contextual, sub-word-level relationships and CharBiGRU embedding for capturing fine-grained character-level features. By fusing these, with embedding using a Conv1D layer, the model effectively combines local and global URL characteristics. This dual-level representation enables the model to adapt to novel attack patterns and outperform existing models in accuracy, recall, and robustness across diverse datasets.
Generally, this study aims to explore the integration of deep learning methodologies specifically tailored for the detection of malicious URLs. By delving into the nuances of URL structures, content, and behavioral patterns, the study seeks to devise an advanced deep learning-based approach capable of swiftly and accurately identifying and categorizing potentially harmful URLs. Therefore, the main contributions of this work can be summarized as follows:
(1)
Development of a hybrid deep learning model (Char2B): This study introduces a novel Char2B model that fuses BERT and CharBiGRU embedding, enhanced with a Conv1D layer, to effectively extract both character-level and contextual features from URLs for accurate classification.
(2)
High performance in malicious URL detection: The proposed model achieved 98.50% accuracy, outperforming the baseline BERT model in all key metrics, including precision, recall, F1-score, and false positive rate (0.017 vs. 0.018), demonstrating its effectiveness in real-world detection tasks.
(3)
Comprehensive dataset and evaluation: A substantial dataset of 87,216 URLs was collected from reliable sources (DMOZ, PhishTank, and Any.Run). The study applied rigorous training, evaluation, and optimization techniques, using standard metrics to validate the model’s generalizability and practical utility in cybersecurity.
(4)
Empirical comparison with baseline methods to highlight the effectiveness of the fusion-based approach.
Lastly, this article organized into the following sections: Section 2 focuses on related works, Section 3 discusses the research methodology, Section 4 presents the results and discussion, and the final section provides the conclusion and future research directions.

3. Research Methodology

3.1. Dataset Selection

Selecting a URL dataset for this purpose involves selecting a dataset that comprises a list of web addresses, or URLs. Many scholars select publicly available datasets, including Kaggle, Mendeleyev, and Gram-bedding and some of the other researchers use DMOZ, PhishTank, and UNB datasets. There are a few things to consider while choosing a URL dataset: quality, integrity, reliability, trustworthiness, dataset size, and the diversity of the data. The dataset must be pertinent to the particular domain or topic of interest in the first place. The likelihood of receiving comprehensive and representative information increases with a larger and more diverse collection [].

3.1.1. Legitimate Dataset

DMOZ dataset
The DMOZ dataset derived from the Open Directory Project is a sizable collection of URLs arranged according to predetermined categories. It was initially designed as a human-curated directory of websites, with volunteers evaluating and classifying pages according to their content. Because the DMOZ initiative sought to incorporate reliable and high-quality resources, the dataset mostly consists of legitimate links. A hierarchical structure is reflected in the categories, but many versions simplify this by flattening it into single-level classes. About 205,627 entries in 15 categories make up the particular version of the DMOZ dataset that is accessible on Kaggle, which makes it appropriate for tasks like web categorization, URL classification, and natural language processing. Even if dangerous links are intended to be included, researchers who work with URL data should nonetheless verify links and use caution, particularly when working with external or out-of-date URLs. Overall, the DMOZ dataset provides a varied and properly labeled set of data for study and real-world uses [].

3.1.2. Malicious Dataset

PhishTank dataset
PhishTank is a free, community-driven service that maintains a dataset of verified spoof websites. An experienced team verifies the dataset, which is assembled from user reports of dubious websites. Information found in the PhishTank dataset includes the URL of the phishing website when it was initially reported, and if it is still operational. You can download the dataset as a CSV file or access it via an API. Its planned applications include DL model training and testing, as well as research and development related to anti-phishing. Utilizing the most recent dataset is essential because it is updated every hour. These datasets have eight attributes and we only selected URL attributes []. Moreover, the following attributes were considered:
PhishID: This is the special code that PhishTank uses to recognize phishing submissions. This ID functions as a link to all PhishTank data.
URL phishing specifics: By going to the PhishTank descriptive URL for the website, you may read information about a phish, including screenshots and user comments.
URL: This is always a string, even if the XDL feeds may have a CDATA part.
Submission time: PhishTank is informed of this phish at this date and time. The date is formatted using ISO8601.
Verified: This shows whether our community has validated this fraud. These datasets contain a yes string because they contain validated phishes.
Verification time: This is the day and time that our community decided the fraud was genuine. The date is formatted using ISO8601.
Online: This shows if the phish is operational and reachable online. This string is always “yes” since we only provide web-based PHPs in this metadata.
Target: If the firm or brand that the phish is impersonating identified, this is its name.
Any.Run dataset.
Any.Run is an interactive online malware analysis platform designed to help users analyze and investigate malicious intents and gather information via an automated examination of dubious files and URLs as well as user contributions. The technology runs in a protected sandbox environment after users report URLs they believe might be phishing attempts. This environment keeps an eye on how the given content behaves, recording network requests, redirection, and script executions to produce comprehensive results. Any.Run uses many verification techniques, such as tracking malicious activity like credential harvesting and mimicking real-world settings during analysis, to guarantee data accuracy and dependability. Community contributions also enable users to comment on the results, which helps with cross-verification and improves the intelligence of the platform. Any.Run efficiently validates and enhances its dataset on phishing risks by fusing user insights, automated behavioral analysis, and community comments, offering cybersecurity experts useful insights []. We gathered malicious datasets from the PhishTank and Any.Run websites and all pertinent facts described in the above details. It is crucial to remember that these data are updated frequently, and we chose this dataset for detecting URL links.

3.2. Preprocessing

As shown in Figure 1, the proposed system architecture of our study includes many techniques. This figure presents the overall architecture of the malicious URL detection framework using deep learning techniques, specifically the BERT model and the proposed Char2B model. The figure begins with dataset preparation, where both legitimate and malicious URLs are collected and merged into a single dataset. The preprocessing stage includes several critical steps such as data imbalance handling, cleaning, normalization, tokenization, and dataset validation to ensure data quality and consistency. Following preprocessing, the dataset is split into training and testing sets to facilitate model learning and performance evaluation.
Figure 1. Proposed system architecture.

3.2.1. Dataset Imbalance Handling Mechanism

In this study, the number of legitimate datasets is significantly larger than the malicious dataset, which indicates a class imbalance. Dealing with class imbalance is important because models trained on imbalanced datasets are biased towards the majority class, leading to suboptimal performance in detecting the minority class (i.e., the malicious URLs). There are different data imbalance handling mechanisms, including over-sampling minority samples, under-sampling majority samples, and class weight balancing (assigning a higher weight for minority classes) []. In our case, we have used an under-sampling of the legitimate URL samples, which have higher values, and balanced these with the malicious samples, which are minor samples in our dataset.

3.2.2. Data Cleaning

Tasks specific to URL dataset cleaning include handling missing values, removing redundant URLs, removing trailing slashes, removing leading and trailing dots, removing whitespaces, and removing control characters from the URL datasets. By performing these tasks, the dataset’s quality and reliability are enhanced, ensuring accurate and functional URLs for classification.

3.2.3. Normalization

Firstly, URL formatting issues addressed and URLs standardized by applying consistent rules for capitalization. This creates a uniform representation across URLs. Secondly, encoding normalization applied to handle non-ASCII characters like diacritics markers to ensure consistent encoding standards. By following these normalization steps, URL datasets transformed into a standardized format, ensuring consistency, and facilitating meaningful analysis and insights.

3.3. Model Construction

The tenet of our proposed architecture is to alleviate the problem of tricking the user into malicious activities by incorporating various deep learning architectures, such as CNN, BiGRU, attention mechanisms, and fully connected layers, to effectively learn and classify malicious URLs.
Figure 1 illustrates the workflow of our proposed system, which incorporates different phases, including a dataset collection phase from the reputation website, the preprocessing of the prepared dataset, a data validation phase, a splitting phase, an embedding (BERT and CharBiGRU) layer, an encoder phase, classifiers, an evaluation phase, and a target prediction phase. By combining the strengths of these components, our proposed system aims to improve the accuracy, efficiency, and adaptability of URL classification. The combination of contextual, sequential, and attention-based information enables the model to capture complex patterns and dependencies, leading to more robust and accurate classifications.

3.4. Embedding Layer

As shown in Figure 2, a key function of the embedding layer is to convert tokenized URL tokens into dense numerical vectors. By collecting semantic similarities between tokens and enabling a deeper comprehension of the context within the neural network model, these vectors offer a richer representation of the input text.
Figure 2. Demonstration of the embedding layer [].

3.4.1. BERT Embedding

BERT embedding is a technique used to convert tokens into dense, low-dimensional vector representations that capture the semantic meaning and contextual information. By encoding the tokenized URLs into BERT embedding, the model can benefit from the pre-trained knowledge of BERT, which captures the relationships between tokens and the context in which they appear. To represent tokenized URL input data, BERT relies on three distinct types of embedding: token embedding, position embedding, and token-type embedding []. In the model construction phase, the data are passed through embedding layers that feed into two distinct encoder components: the BERT encoder layer, which captures contextual and semantic relationships, and the Char2B encoder layer, which focuses on extracting character-level features. The BERT and Char2B models, respectively, then utilize these encoded representations. The final outputs are directed to a classification layer that predicts the target labels and performs evaluation. This architecture enables comprehensive feature extraction and enhances the model’s ability to distinguish accurately between legitimate and malicious URLs.

3.4.2. Token Embedding

Token embedding is the numerical representation of tokens (words, sub-words, or characters) in a continuous vector space. Each token in a vocabulary is mapped to a fixed-size vector of real numbers, which captures semantic information about the token.

3.4.3. Position Embedding

This method incorporates information on the fixed, relative positions of tokens within a sequence into transformer-based models, like BERT. Positional embeddings were added to the token embedding to give the model information about the relative positions of tokens within the sequence, as BERT processes input tokens in parallel and lacks an innate understanding of token order. This enables BERT to recognize connections between characters at various points in the sequence and comprehend the input text’s sequential structure. By adding the positional embedding vectors to the token embedding element by element, BERT effectively models contextual interactions between tokens and can handle variable-length sequences.

3.4.4. Token-Type Embedding (Segment Embedding)

This component is used in models like BERT to handle tasks involving multiple segments or tokens within a single URL input. It helps the model distinguish between different segments and capture their interactions and relationships. Segment embedding, along with token embedding and positional embedding, contributes to the overall representation.

3.5. CharBiGRU Embedding

After the character tokenization process, each of the characters is then mapped to embedding vectors using a lookup table or embedding layer, capturing the semantics of individual characters. The character embeddings are passed through a BiGRU layer, which processes the character sequence in both forward and backward directions to capture contextual dependencies among the characters. CharBiGRU embedding can be highly effective for URL classification due to their ability to capture both the structural and contextual nuances at a character level. URLs often contain strings that do not follow standard language patterns, such as abbreviations, concatenated words, numbers, special characters, and domain-specific jargon. Traditional word-based models may struggle with this kind of input since URLs often contain many rare or out-of-vocabulary tokens and its ability to process text at the character level, combined with its deep contextual understanding at the word level, allows it to generalize better and handle diverse URL formats. It commonly used in natural language processing tasks, particularly when dealing with out-of-vocabulary (OOV) words or when fine-grained representations of words are required. The BERT embedding has the limitation of OOV and sub-word embedding. Therefore, to alleviate this issue, we used CharBiGRU embedding to capture sub-word-level and char-level information and create more expressive char representations. Instead of treating words as atomic units, CharBiGRU embedding breaks down each word into its constituent characters and represents them using character-level embedding. This allows the model to capture morphological and structural information within words.

3.6. Fusion Layer

Following the processing of the CharBiGRU and BERT embedding, which have a dimension of [batch_size, seq_length, hidden_size], we applied separate linear transformations (word_linear and char_linear), each mapping its respective input to a common hidden size. Once the embedding transformed, we concatenated them along the feature dimensions, resulting in a shape of [batch_size, seq_length, hidden_size × 2], which maintains their compatibility as illustrated in Figure 3.
Figure 3. The fusion word and char representations [].
Since the Conv1D expects the shape [batch_size, hidden_size, seq_length], we transposed the concatenated tensors before passing them to the fusion layer. In our case, the transposed tensor has the shape [8, 768 × 2, and 200], and then we passed it to the fusion layer with the help of a filter size of 3. The Conv1D has different filter sizes, such as 3 × 3, 5 × 5, and 7 × 7, among the common filter sizes. We selected a filter size of 3, considering the reduction in the complexity of our proposed model and capturing local interactions of both character (CharBiGRU) and word (BERT) level representations with a unit size of padding selected to maintain the sequence length unchanged. After this tensor passes through the fusion layer, it re-transposed back to the original shape for downstream tasks. Conv1D used to enhance the fused representation of BERT and CharBiGRU by preserving sequence length and lowering dimensional complexity while extracting significant local patterns like n-gram linkages and structural dependencies.

3.7. Feature Extraction Technique

Transformers have seen tremendous growth in recent years and excel in feature extraction techniques rather than traditional methods. Due to its multilayer architecture, the transformer extracts multiple features without any intervention through its hierarchical structure and layer-aware and attention-based feature extraction approaches used to extract features. The BERT and CharBiGRU can extract features from raw datasets using hierarchical, layer-aware, and cross attention-based feature extraction techniques, which allow them to model the relationships between tokens at multiple levels of granularity. In hierarchical feature techniques, it identifies patterns at various levels, from smaller units (like characters or sub-words) to larger structures (like words or full URL segments). By tokenizing URLs into sub-words, BERT can identify associations at the phrase and sub-word levels. By incorporating character-level features, Char2B improves and can identify fine-grained patterns, including identifying subtle differences in a URL.
In a layer-aware technique, features extracted at lower, middle, and upper layers of the transformer architecture. In the lower layer, it extracts common URL prefixes (“http://”, “https://”, and “www.”), sub-words (“login-secure”), and special characters (dots, hyphens, and slashes). In the middle layer, it emphasizes capturing broader relationships and multi-token dependencies, which includes identifying sequences of tokens that imply their intent or specific phrases like suspicious word combinations (“secure-login” and “account-verify”) and keyword positioning (“secure-update” + “account-check”). In the upper layers, an understanding of the structure and purpose of a URL is enhanced by aggregating broader contextual information across the sequence. This captures high-level intent and the overall meaning, such as the global structure of the URL (for instance, legitimate URLs are often straightforward, while phishing URLs may use numerous subdomains or nested paths to mimic legitimate sites, e.g., “account-update.bank-name.example.com”).
Additionally, it identifies top-level domain relevance, detecting anomalies and verifying whether the overall URL structure aligns with known patterns of legitimate or phishing URLs. The CLS token embedding further summarizes the entire sequence, capturing the holistic meaning of the URL. The cross-attention feature extraction method integrates and correlates characteristics from two different embedding’s, BERT and Char2B, using attention mechanisms. This method efficiently combines data from multiple feature spaces, incorporating both character-level representations from Char2B and sub-word-level representations from BERT to enhance the model’s understanding and detection capability.

3.8. Model Training

As shown in Figure 4, the outputs of each encoder fed into the BERT model and the Char2B model for further processing leverage contextualized and sequential dependency representations, respectively. In the transformer architecture, the encoder-only part corresponds to the BERT model, while the GPT-2 model, as detailed in [], exemplifies the decoder-only part. BERT, being an encoder-based model, is well suited for classification tasks. It is a pre-trained on a large text corpus using the masked language-modeling objective, which enables it to generate contextualized token representations. These representations capture both semantic and contextual information, allowing the model to understand relationships within the input. In contrast, the decoder section of a transformer, as used in models like GPT-2, is designed for autoregressive tasks such as language generation, where the model predicts the next token in a sequence. However, for malicious URL detection, the goal is to classify a URL based on its features, not to generate text.
Figure 4. The transformer-encoder model [].
Therefore, using the decoder would introduce unnecessary computational overhead and complexity without benefiting the task. The Char2B model is the fusion model resulting from the BERT and Char2B encoder, which is the combined effect of BERT and CharBiGRU embedding, and this means it has both word-level and char-level representation. In both models, we applied the attention layer to obtain the attention weight across the layer’s head, and following this, we used the FC classier with the sigmoid activation function. Thus, the model contextualizes and captures vital information across each layer between tokens in a given sequence. This enables the model to capture intricate patterns and understand the context of the tokenized URLs, which can be essential for distinguishing between the impacts of the link.

4. Result and Discussion

4.1. Dataset Preparation

We collected 38,387 and 7993 malicious URL samples from two independent cloud platforms, PhishTank and Any.Run, respectively, along with 205,628 legitimate URLs from DMOZ. Since the number of malicious samples is smaller than the number of legitimate samples, we merged additional data from Any.Run to enhance the malicious dataset. After collecting the datasets, we performed preprocessing steps including removing duplicate links, missing values, null values, and control characters, trimming leading/trailing slashes and whitespace, normalizing URLs to lowercase, and decoding encoded URLs into ASCII characters. Following preprocessing, the legitimate dataset contained 205,628 samples, and the malicious dataset contained 46,380 samples. This imbalance between the two classes could bias the model during training and testing. To address this, we shuffled the datasets by label and performed class balancing through under-sampling, selecting the minimum number of samples from each class to achieve balance. Before proceeding to tokenization and downstream tasks, we validated the dataset using transformation techniques and the interquartile range (IQR) to ensure quality and consistency.

4.2. Dataset Validation

To ensure the quality and appropriateness of our dataset, we implemented the preprocessing techniques and visualized the skewness levels [,]. Figure 5 shows the distribution of URL lengths in the dataset. The tallest bar falls within the 0–50 character range, indicating a significant concentration of shorter URLs. This suggests that the majority of URLs in the sample are relatively short. Only a small number of URLs exceed 200 characters, and very long URLs (over 400 characters) are rare, with the frequency declining sharply as URL length increases. These longer URLs likely originate from specific types of web pages, such as those generated by content management systems or containing complex query parameters. Investigating these outliers could reveal distinctive patterns or behaviors. Overall, the distribution demonstrates that the dataset is predominantly composed of short URLs, displaying a right-skewed pattern. This skewness could adversely affect the model’s detection performance. To mitigate this, we applied the Box-Cox transformation, a technique effective for outlier detection and skewness reduction, helping to normalize the dataset and improve model training.
Figure 5. The skewness level of our original dataset.

4.2.1. Log Transformation

In data analysis, log transformation is a powerful technique used to stabilize variance, normalize distributions, and enhance linearity. In our case, as observed, the dataset exhibits right skewness with a skewness value of 0.338. As shown in Figure 6, we present the implementation of the log transformation to address this skewness. The left plot displays the original URL length distribution (right-skewed) and the right plot displays the log-transformed URL length distribution (more normalized). This shows how log transformation helps in stabilizing variance and reducing skewness.
Figure 6. The skewness level of the log transformation vs. the original dataset.

4.2.2. Box-Cox Transformation

Figure 7 demonstrates the Box-Cox transformation, a statistical method in machine learning that stabilizes variance and makes the data more closely approximate a normal distribution compared to the log transformation. The implementation results in a lower level of skewness, approximately 0.012, bringing the data closer to symmetry, with the mean, median, and mode aligning more closely in terms of URL length.
Figure 7. The skewness level of Box-Cox transformed data vs. original dataset.

4.2.3. Removal of Outlier from Box-Cox URL Length

All of the transformation methods discussed above can reduce the impact of the skewness of the dataset, and the skewed data negatively affect the detection performance of our model.
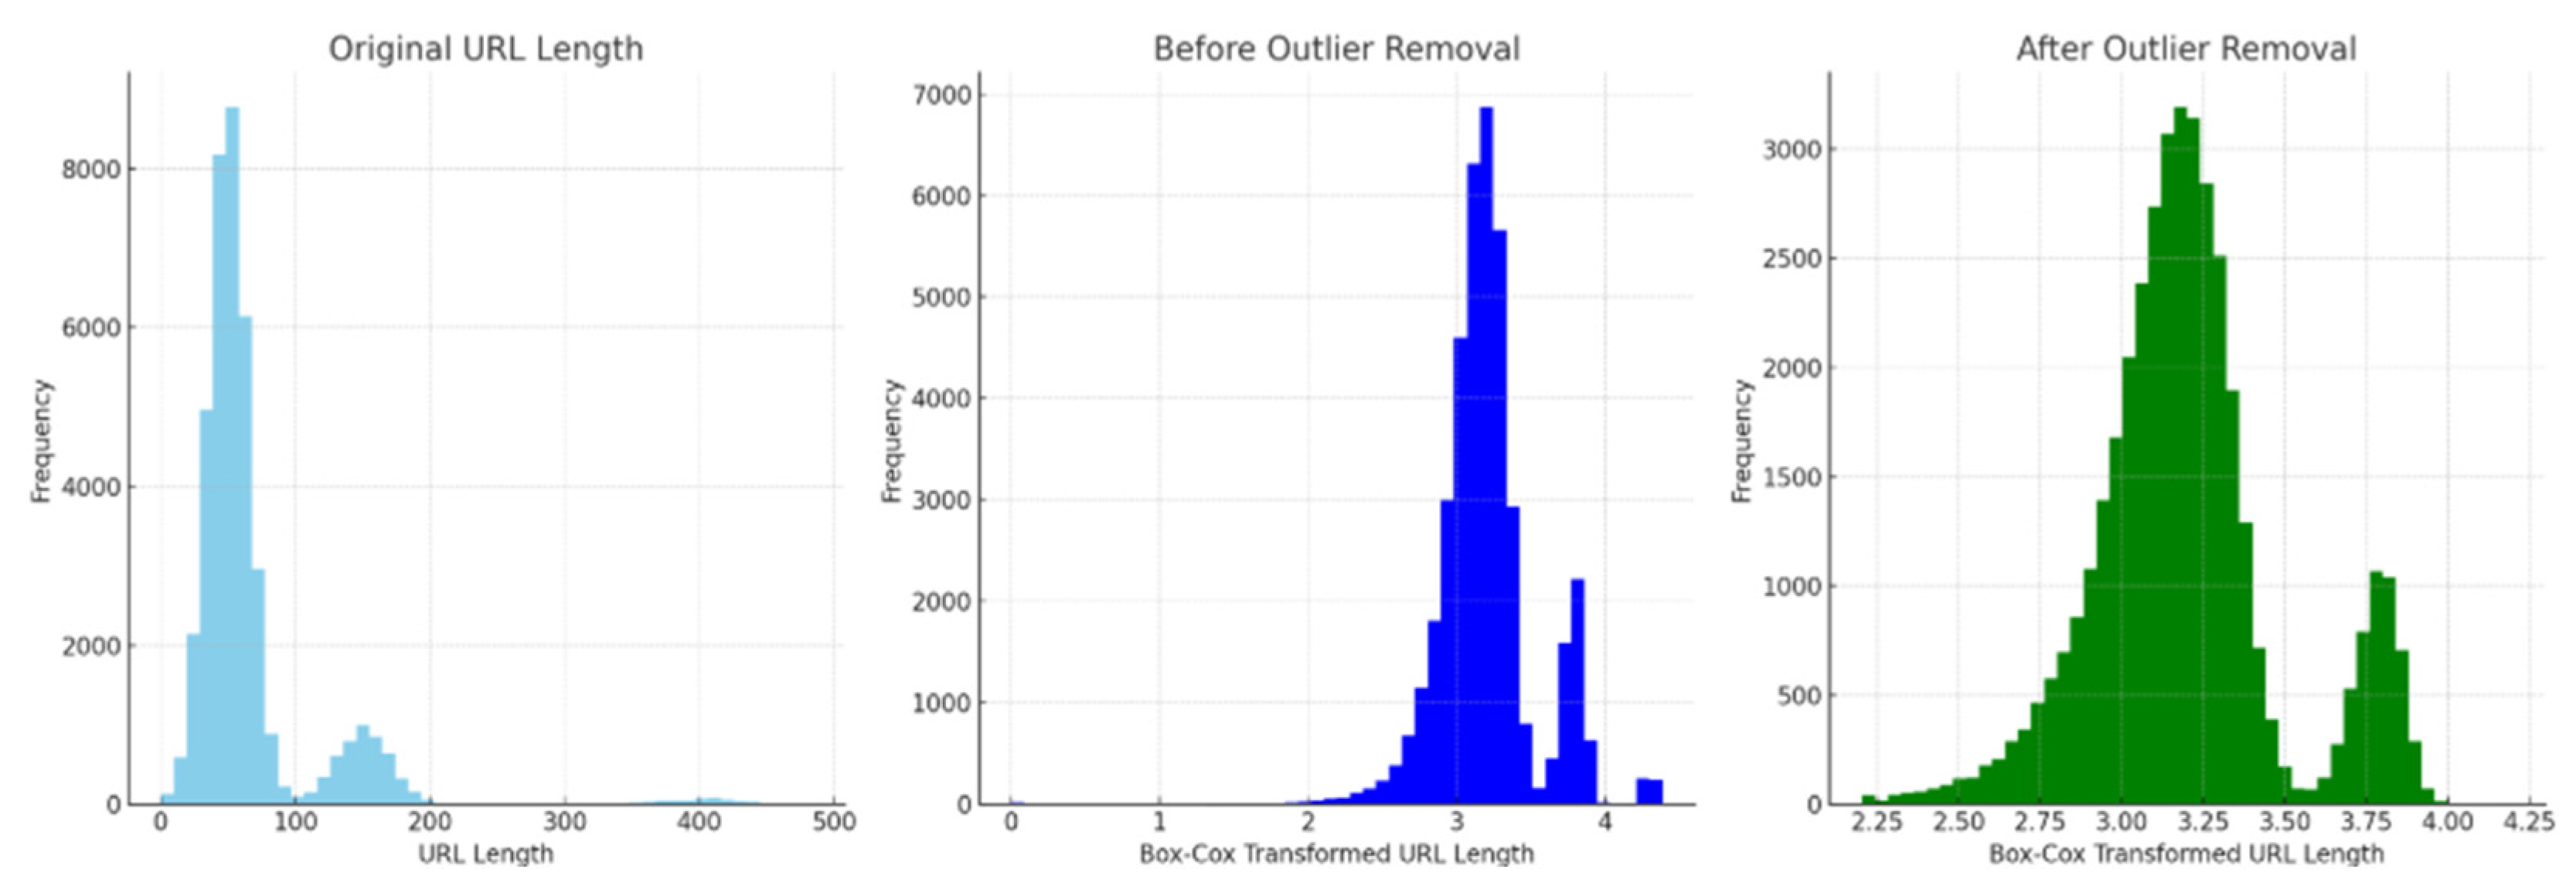
Therefore, we need to remove such outliers in our dataset. To remove such outliers, we used interquartile range techniques. The skewness level of the Box-Cox transformation technique has 0.01186 outliers and the frequency of lengthy URL occurrences is reduced to 8000. This indicates that the outliers in our custom dataset removed and achieves effective detection accuracy. Moreover, with the original URL length, the distribution is heavily right-skewed with most URLs being short and with few very long URLs. After applying the Box-Cox transformation, the data become more symmetric, but some outliers remain. Finally, after outlier removal, the distribution looks much more normal (bell-shaped), which is ideal for model training as shown in Figure 8.
Figure 8. The result of the outlier removal using IQR.

4.2.4. Performance Evaluation Metrics

For this study, evaluation metrics used to measure the performance of our models included the confusion matrix, accuracy, precision, recall, and F1-scores.
Accuracy: Accuracy measures the overall correctness of the model by calculating the ratio of correctly predicted instances (both true positives and true negatives) to the total number of predictions.
A c c u r a c y = T F + T N T P + T P + F P + F N
where TP (true positive): the model correctly predicted the positive class, TN (true negative): the model correctly predicted the negative class, FP (false positive): the model incorrectly predicted the positive class, and FN (false negative): the model incorrectly predicted the negative class.
Precision: Precision measures the accuracy of the positive predictions. It indicates how many of the predicted positive results were correct. High precision means that when the model predicts a positive, it is usually correct.
P r e c i s i o n = T P T P + F P
Recall: Recall measures the ability of the model to identify all relevant instances (positives). It indicates how many actual positive cases were correctly predicted. High recall means the model captures most of the actual positives.
R e c a l l = T P T P + F N
F1-score: The F1-score is the harmonic mean of precision and recall. It provides a single metric that balances both precision and recall, which is especially useful when the class distribution is imbalanced. A high F1-score indicates a good balance between precision and recall.
F1-score = 2 × P r e c i s i o n × R e c a l l P r e c i s i o n + R e c a l l
Moreover, the Matthews correlation coefficient (MCC), which provides a comprehensive measure of classification performance considering all categories in the confusion matrix, and the area under the ROC curve (AUC-ROC), summarizing model performance across various thresholds also used. Each of these metrics plays a vital role in evaluating and interpreting the effectiveness of classification.

4.3. Experimental Setup

The experimental setting for training the suggested model was a Google cloud GPU called Colab. Tensor-based data structures supported and the proposed model constructed using a variety of neural network modules and tools, with PyTorch, Numpy, Pandas, and transformers among the libraries that used to vectorize the data at the tensor level.

4.4. Hyperparameter Selection

Table 2 shows the hyperparameters that were configured before the training began and that control how the model learns. Unlike model parameters, which are learned from the training data, hyperparameters are set to guide the learning process.
Table 2. Hyperparameters for BERT and Char2B models.
The model cannot learn them by fitting the model to the data; instead, their value is pre-determined before the model begins the training process. The best hyperparameter values found via trial and error [] by changing or tailoring their values for a particular task. We used a trial and error method, and after several adjustments, specifically for learning rate, weight decay, optimizer, epoch, batch size, and scheduler and patient, we obtained the optimal values []. During this process, we executed the training loop using the training dataset and testing loop using the testing dataset; after each epoch, the training and testing results were printed and visualized. Then, we tuned the Hyperparameters until we obtained the optimal values.

4.5. Experimental Results and Discussions

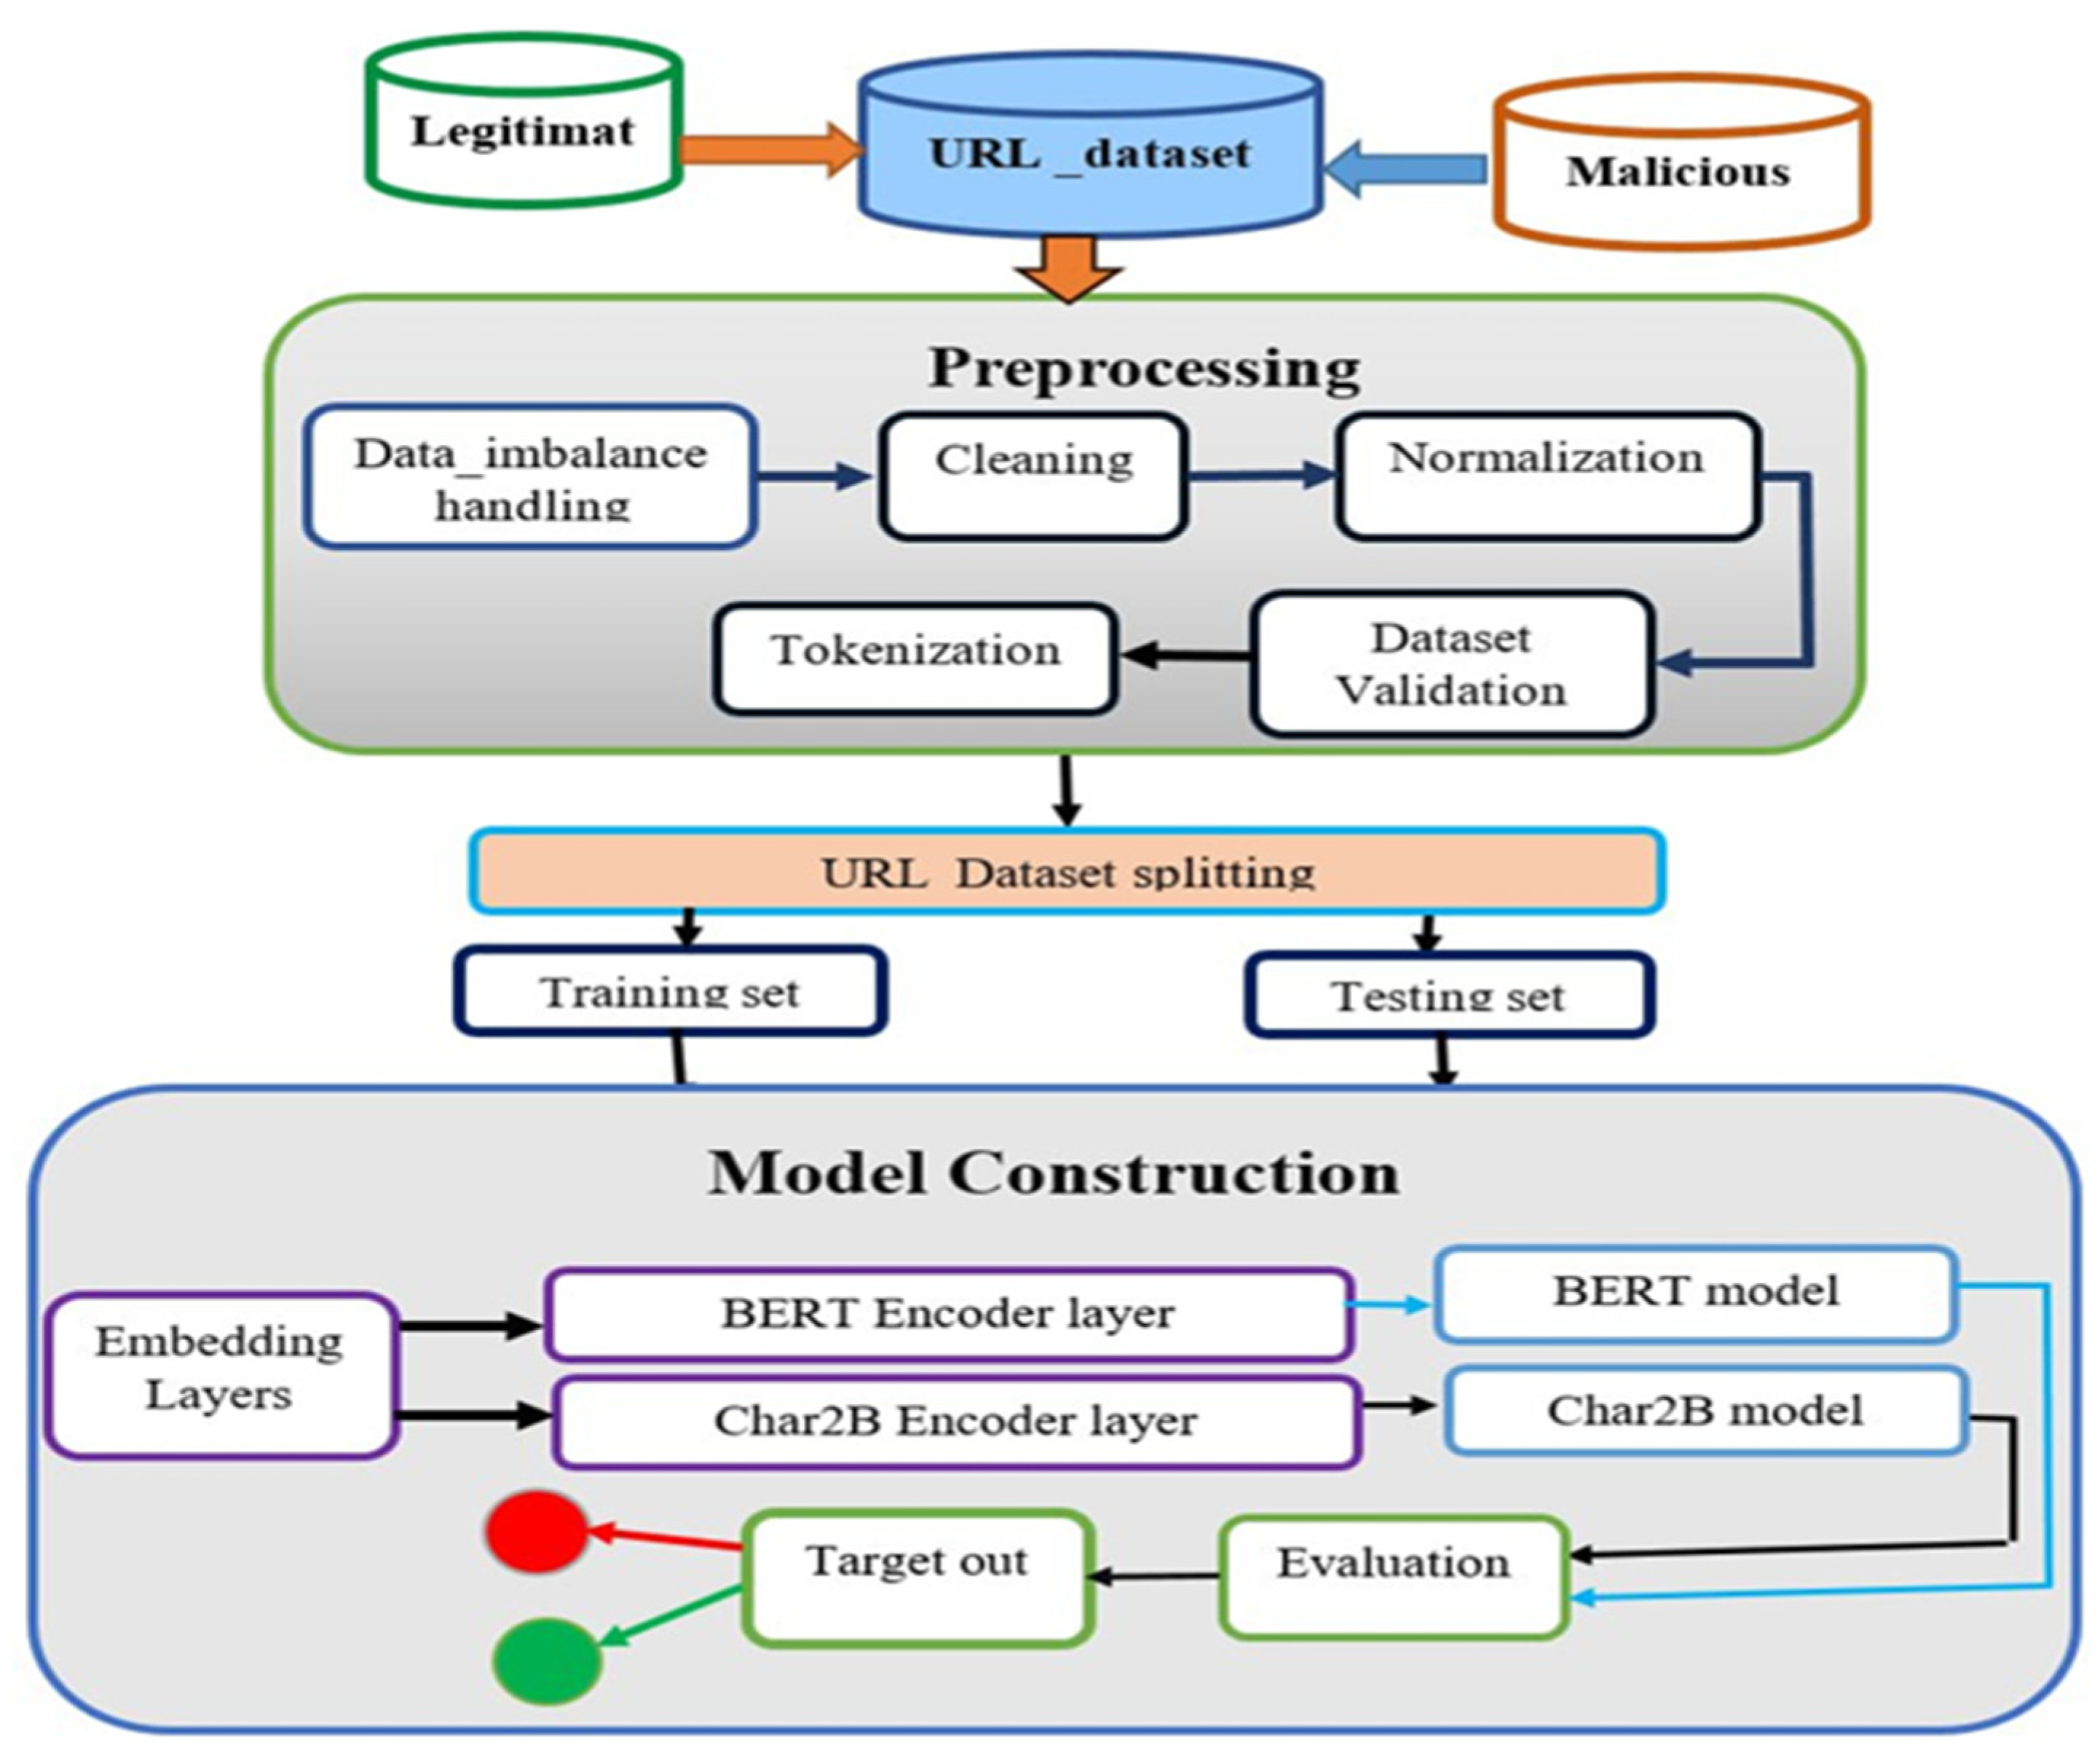
Our proposed model used the training and testing datasets to assess its performance. The processed dataset split in an 80/20% splitting ratio for training and testing sets, respectively. We used the BERT model as the base model that used to drive the Char2B model.
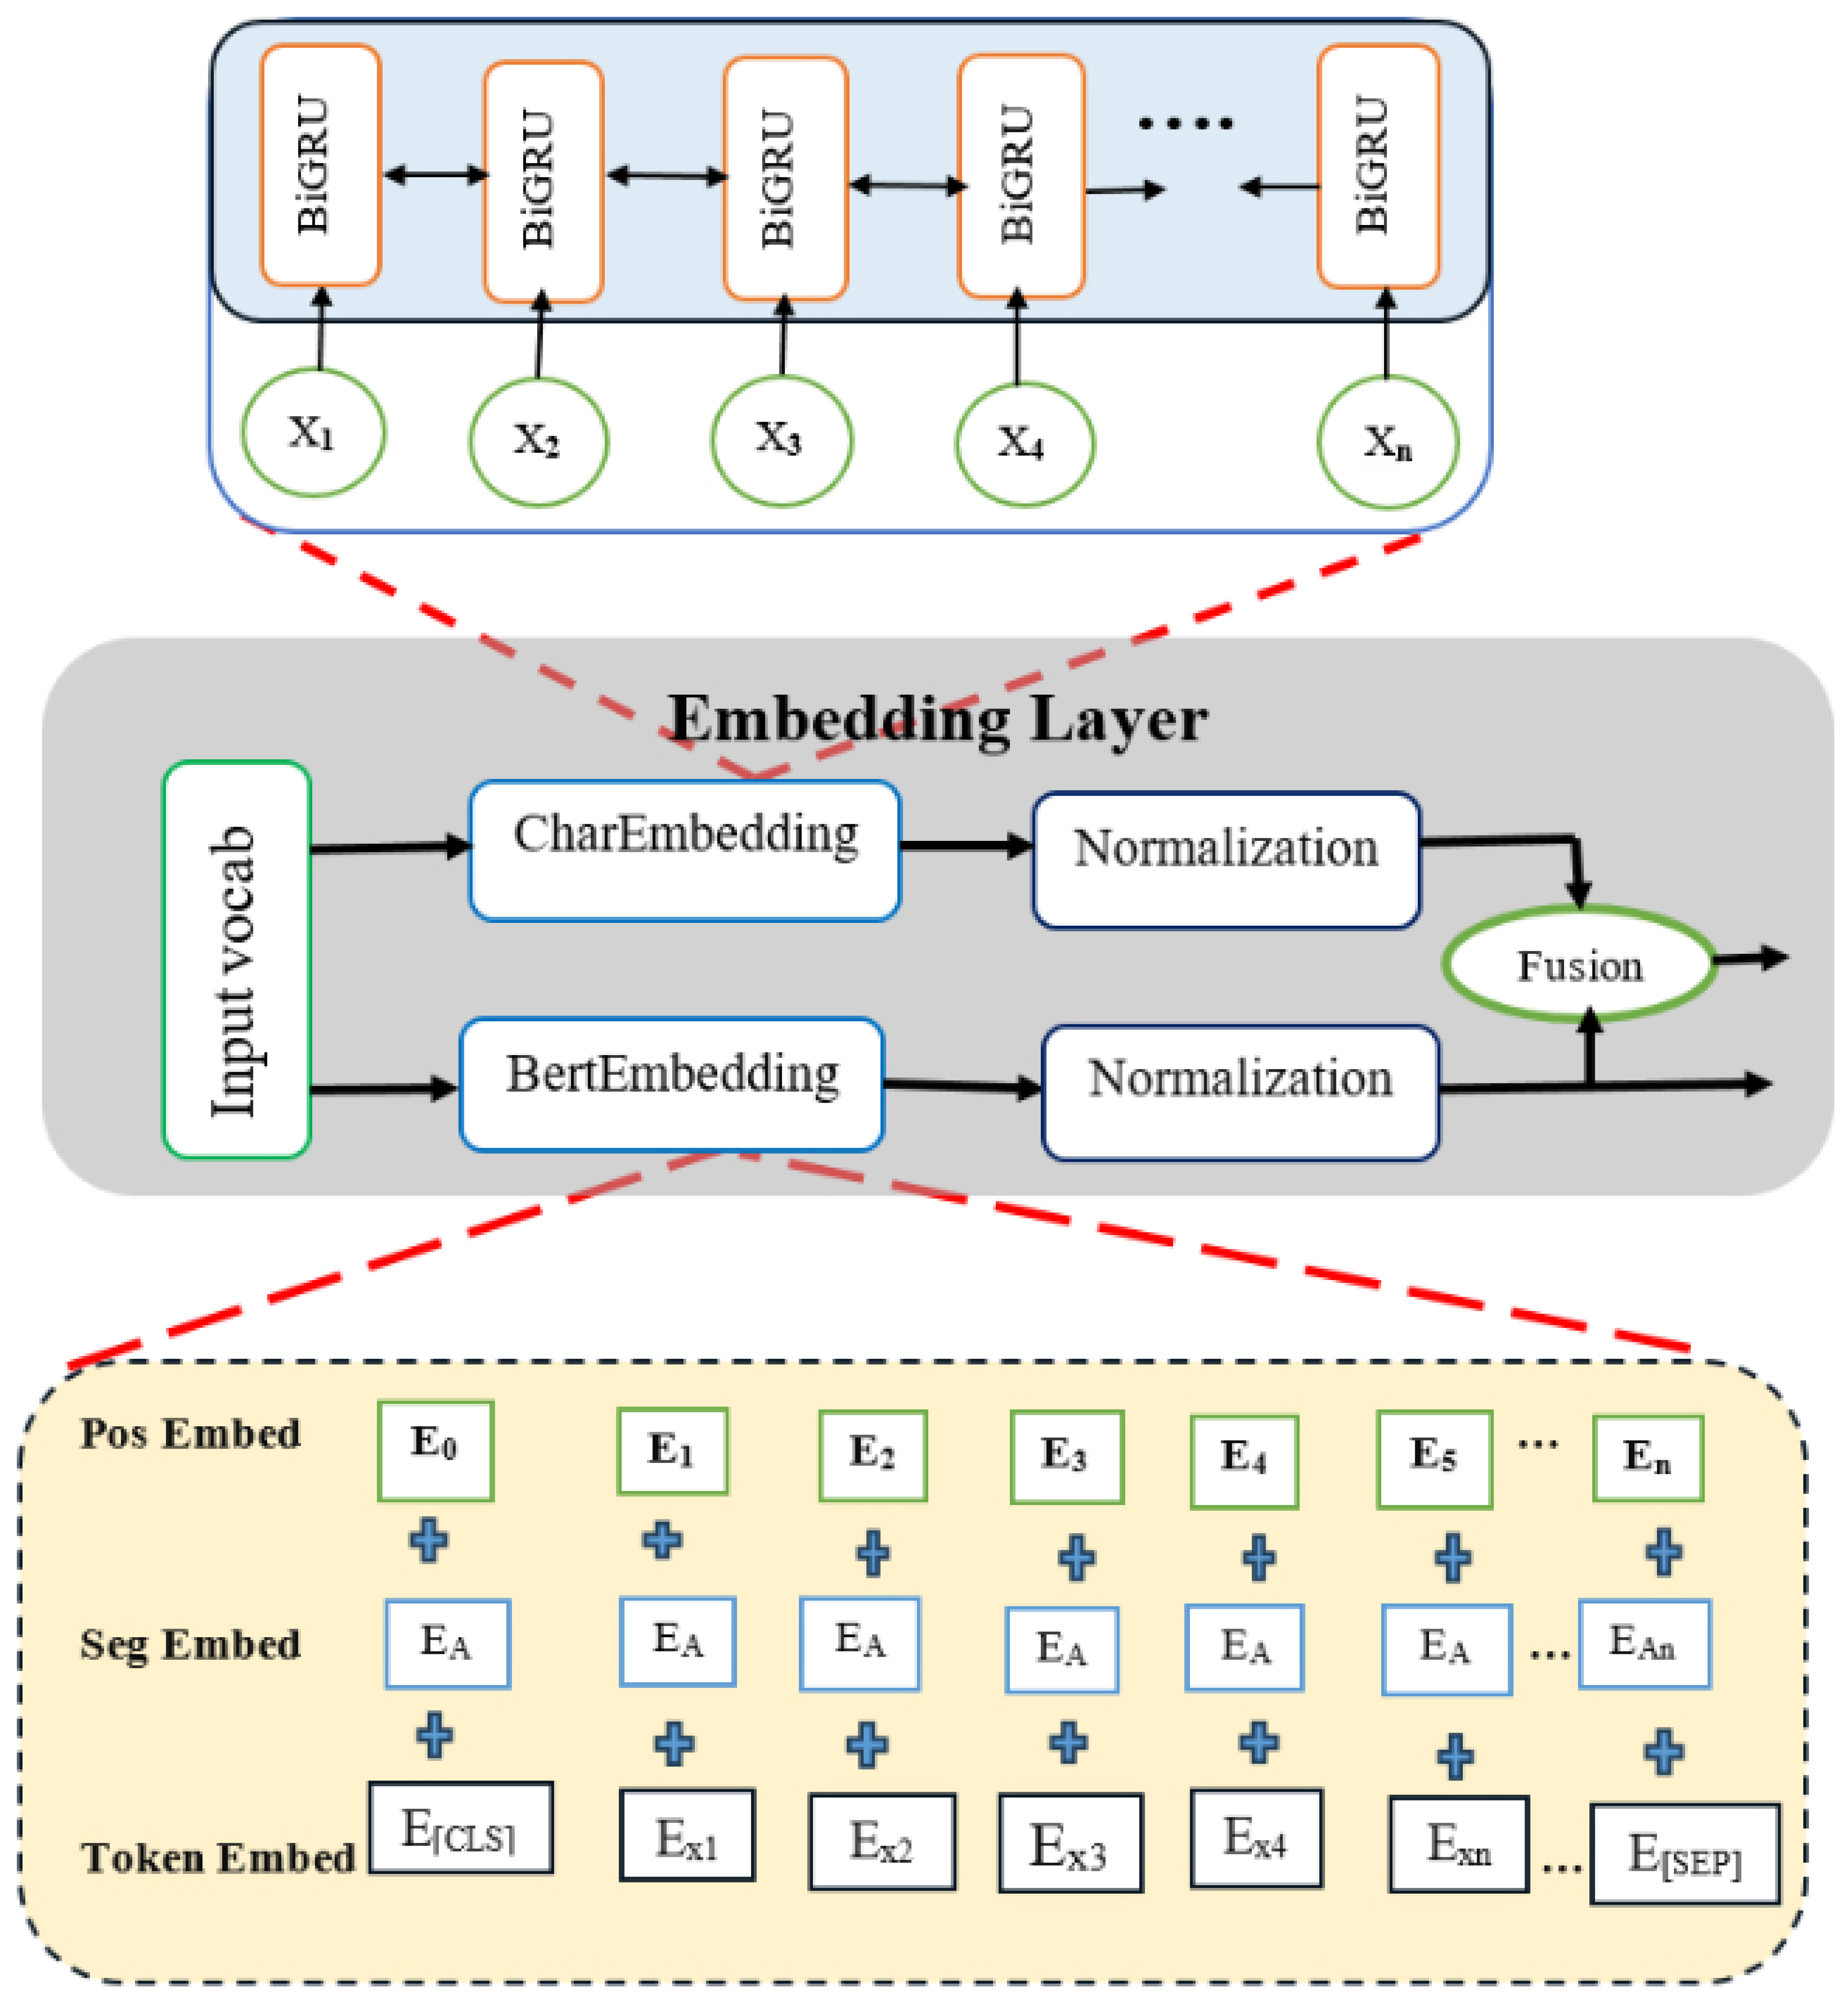
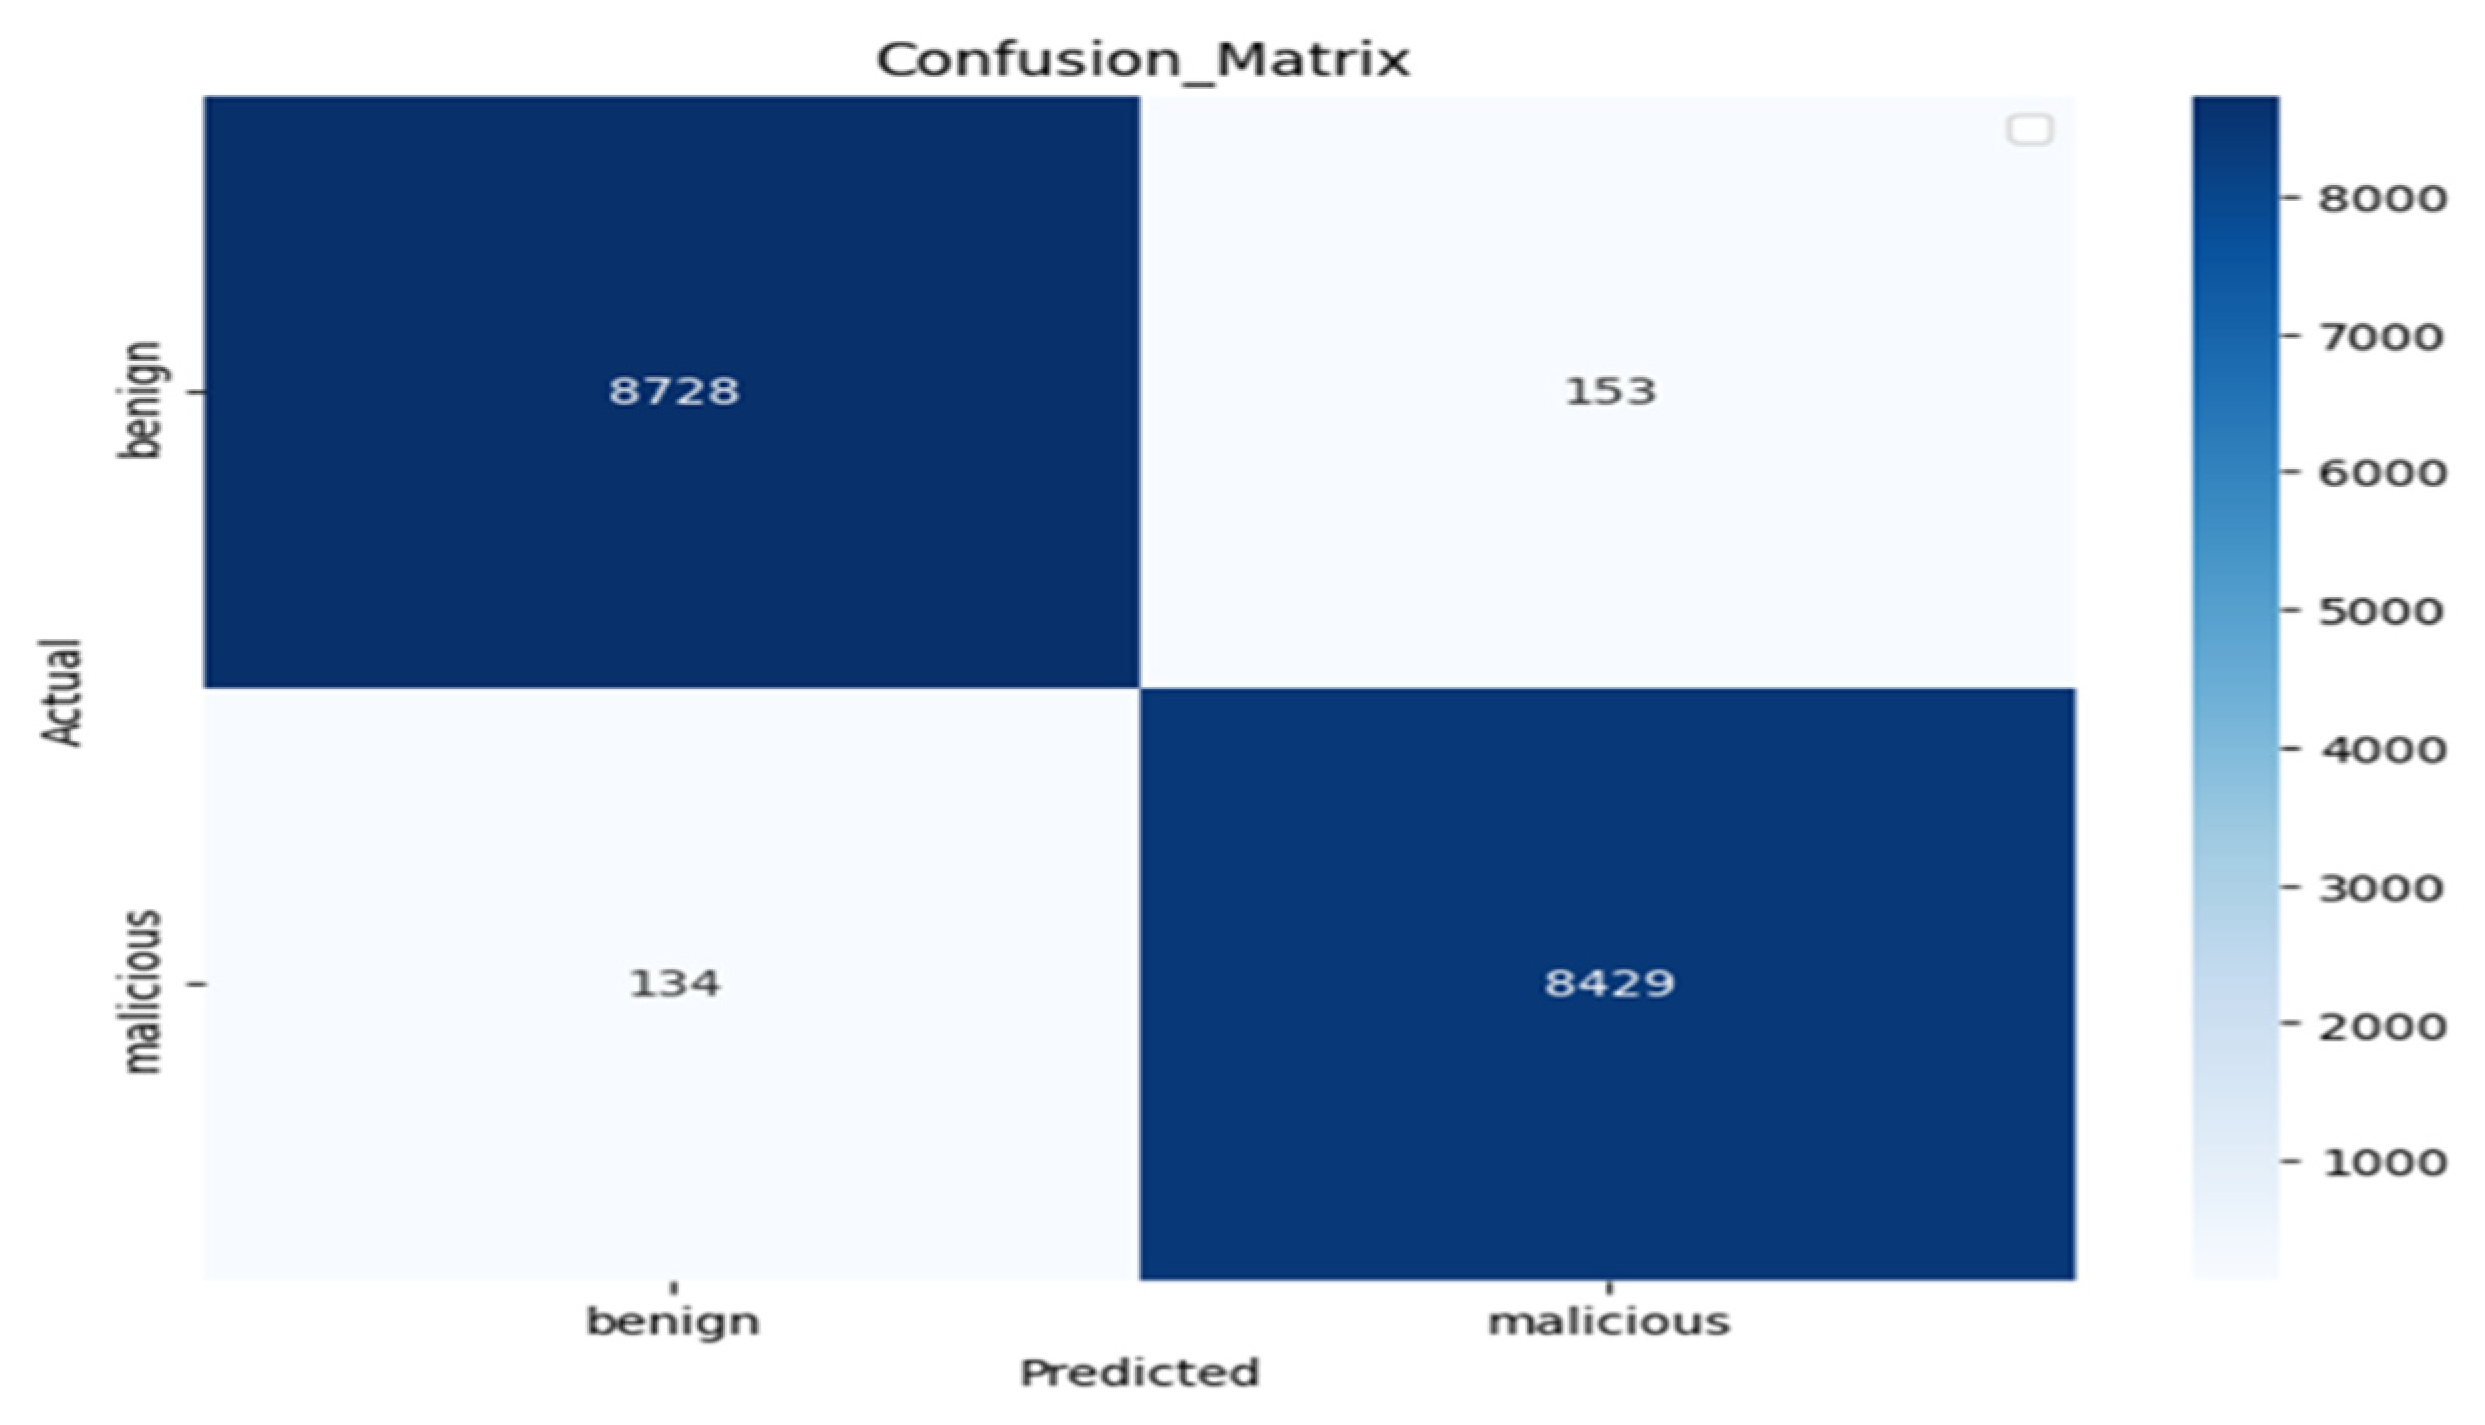
Experiment 1: We used the BERT model as the base model to construct the fusion of BERT embedding with CharBiGRU to obtain the Char2B model. The BERT model’s performance was rigorously evaluated on the test dataset using multiple metrics: a confusion matrix, classification report, and ROC curve analysis. These evaluations were conducted using consistent epoch settings across both training and testing phases, while employing different batch sizes for optimization. Therefore, as shown in Figure 9, the number of correctly predicted negative (benign) samples out of all negative samples is 8728 with 153 samples misclassified as positive samples and the number of correctly predicted positive (malicious) samples out of the total positive samples is 8429 with 134 misclassified as negative samples.
Figure 9. Confusion matrix of the BERT model evaluation result.
Table 3 illustrates the training and testing performance of the base model using our dataset. Figure 10 depicts the trade-off between the TPR and the FPR across different threshold settings, which is an essential tool for evaluating a binary classifier’s performance. In Figure 10, the Y-axis shows the true positive rate, which is the percentage of actual positive instances that are correctly detected, while the X-axis shows the false positive rate, which is the percentage of actual negative cases that are mistakenly categorized as positive. The curve displays the classifier’s performance at various thresholds; an ideal model is represented by a TPR of one and an FPR of zero in the upper left corner of the graph.
Table 3. Performance of the base model on the custom dataset.
Figure 10. The ROC-AUC in the BERT model of TPR vs. FPR.
The diagonal dashed line in the ROC graph represents a random classifier where the TPR and FPR are equal; any model along this line performs no better than chance. The model performs well in this particular curve, as seen by its placement close to the upper left corner. The classifier has a reported AUC of 0.9898, which indicates that it is quite good at differentiating between the two classes with little overlap. This high AUC value, which shows a high probability of ranking a randomly selected positive case higher than a randomly selected negative instance, supports the finding that the model is excellent at accurately recognizing positive examples while limiting false positives, with a result of 0.018. Overall, the ROC curve and its AUC offer a thorough assessment of the model’s capacity to distinguish between benign and malicious events.
Moreover, Table 4 shows the classification report precision, recall, and F1-score: All values are 0.98 for both classes (zero and one), indicating a strong balance between correctly identifying positives and negatives. The accuracy of the overall model accuracy is 98%, meaning it correctly classified 17,444 out of 17,444 samples.
Table 4. The classification report for the base model.
The macro and weighted averages are also both 0.98, suggesting consistent performance across classes, even with slight class imbalance (8881 vs. 8563 samples). Therefore, the classification report shows high and consistent performance and the model performs reliably and robustly, with excellent predictive ability and no sign of bias toward either class.
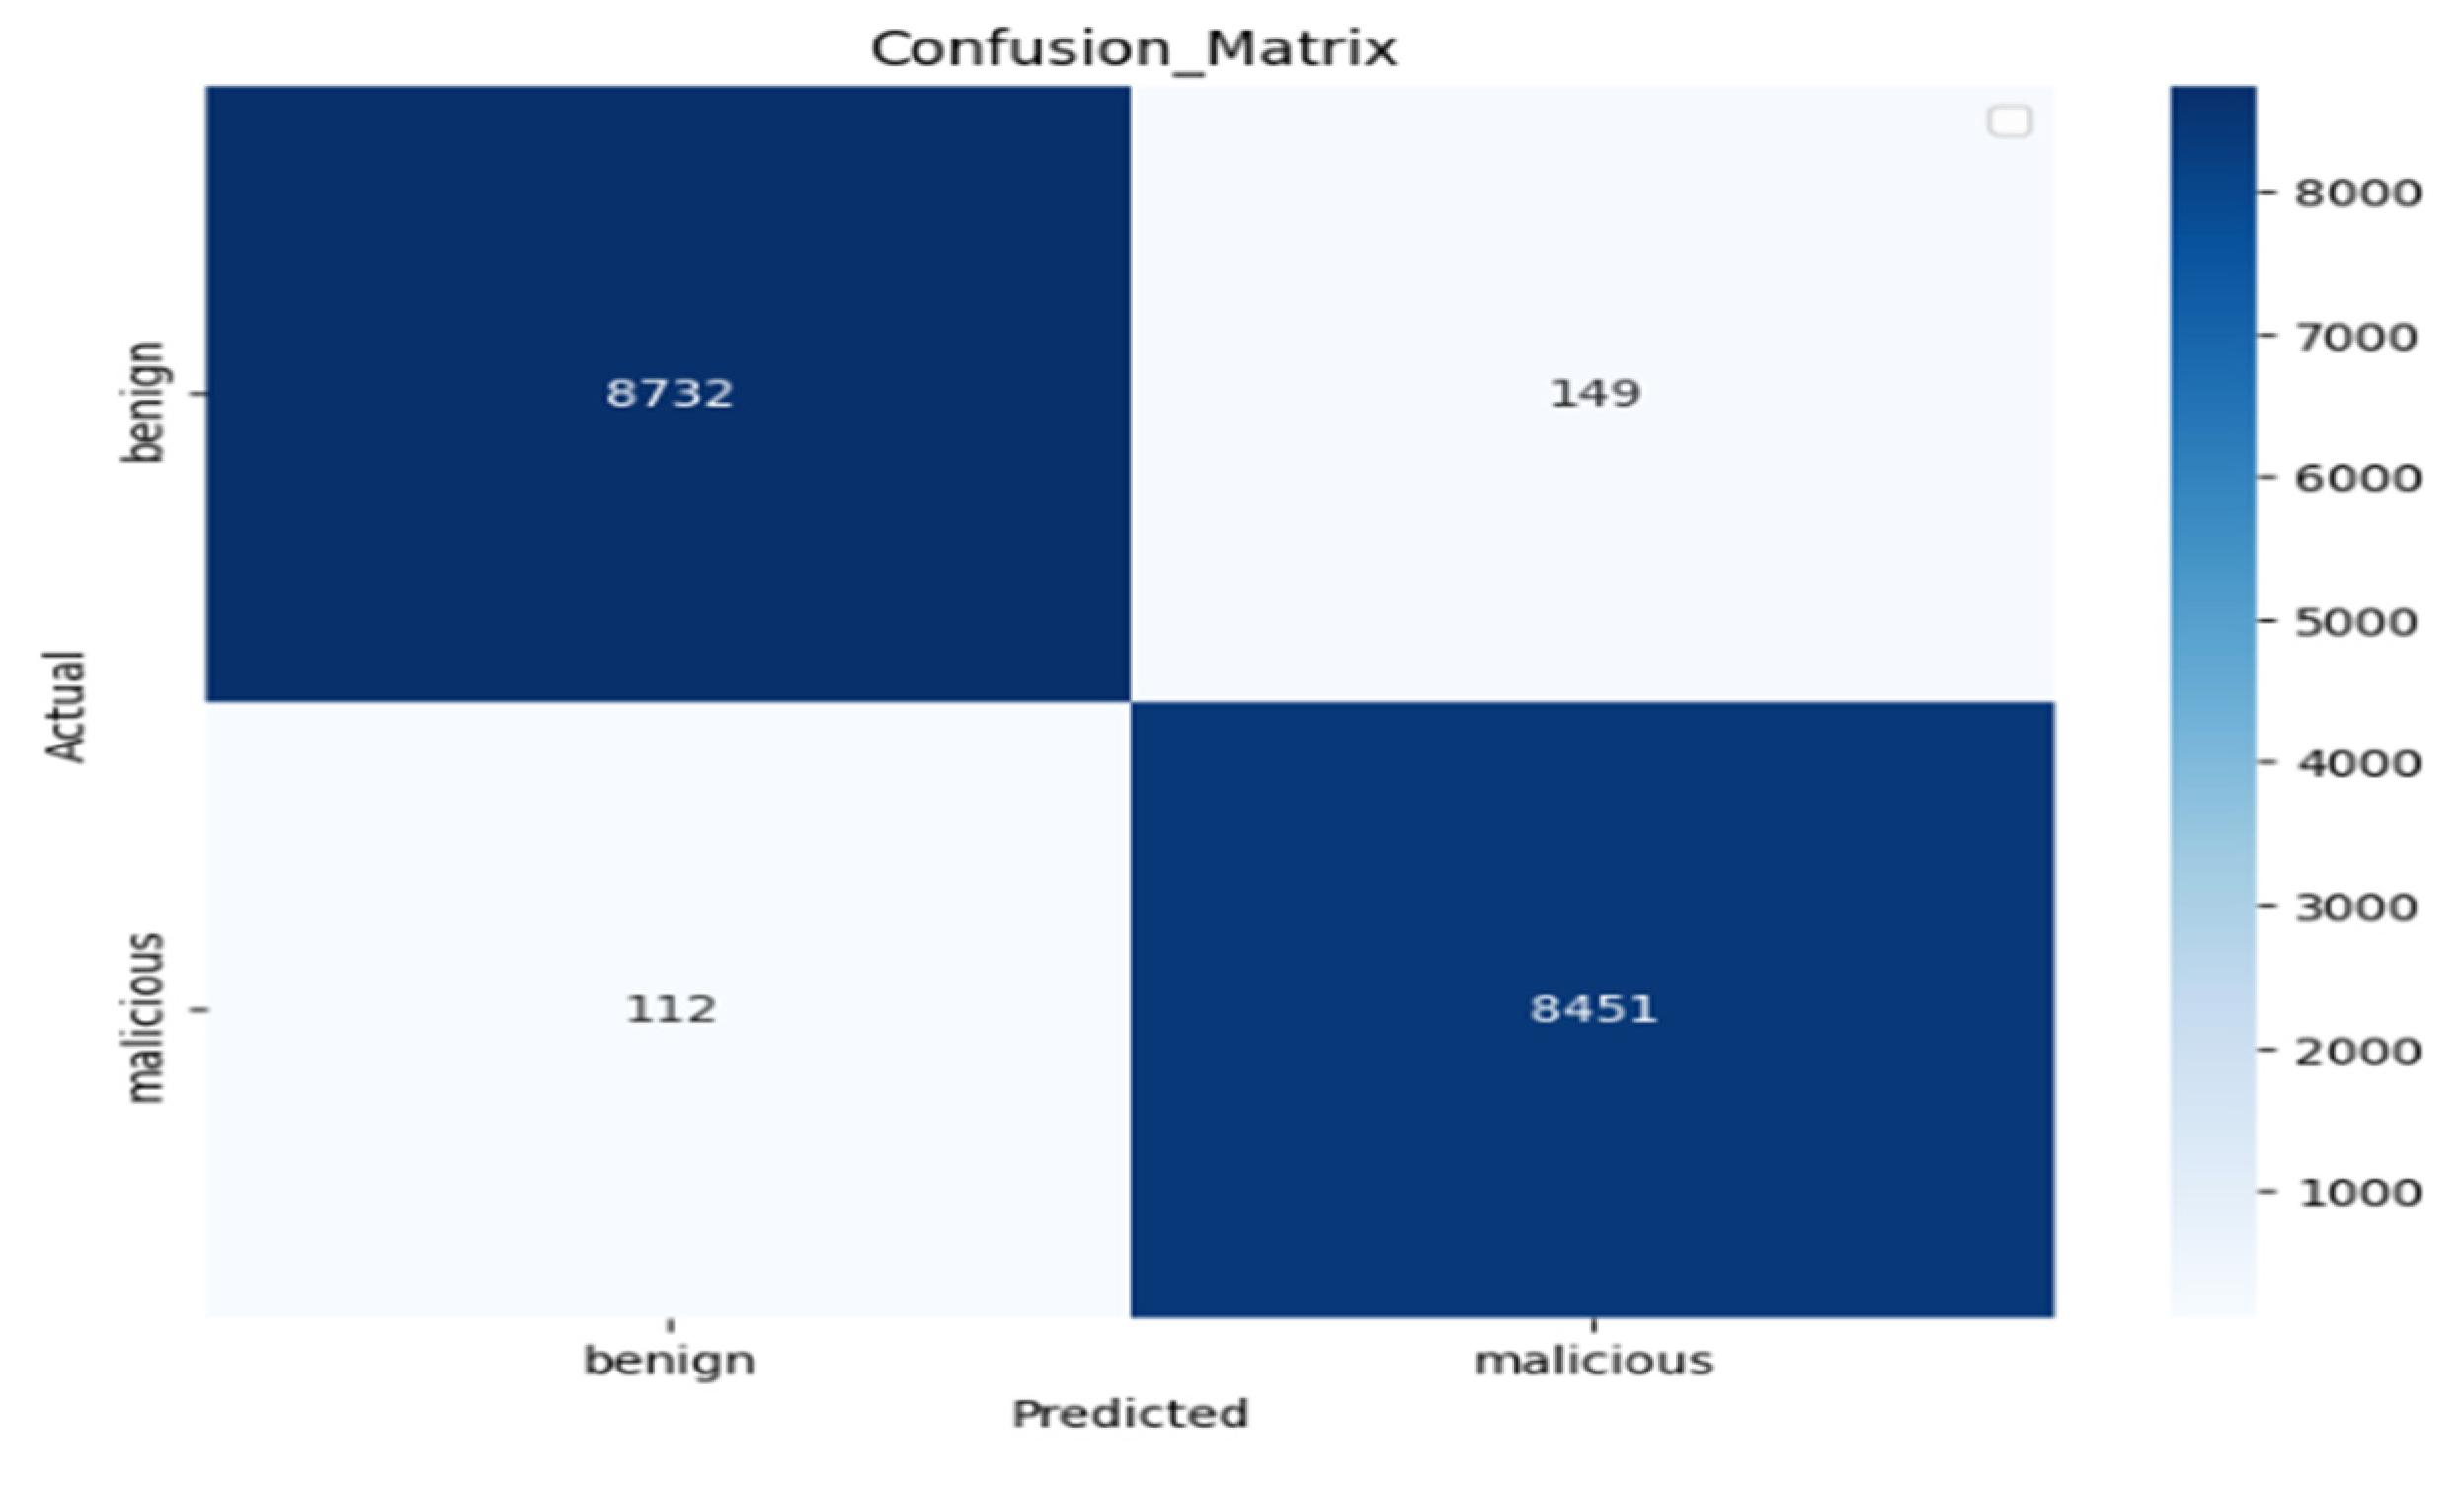
Figure 11 illustrates the classification report of our performance evaluation result. Out of 8881 benign test dataset samples, 98% of the dataset is correctly predicted as actually negative (benign) samples, and out of 8563 malicious test, dataset samples, 98% of samples are correctly predicted as actually positive (malicious) samples. The vertical axis displays the actual labels of the data, while the horizontal axis shows the model’s predictions, which are either benign or malicious.
Figure 11. Confusion matrix of the Char2B model evaluation result.
The number of cases correctly predicted as benign (true negatives) is 8732, and these are located in the top left quadrant. This high number indicates that the model can accurately identify benign situations. There are 149 false positives in the upper right quadrant, which represent innocuous cases that were mistakenly labeled as malicious. Since it indicates fewer incorrect classifications of benign cases, a lower value is better in this case. The 112 false negatives that were mistakenly classed as benign are found in the bottom left quadrant. In this instance, a lower number is also preferable since it shows that harmful situations were successfully detected. The final quadrant, the bottom right one, displays 8451 true positives, or the cases that accurately classified as malicious. This high number indicates that the model can accurately detect harmful cases. We summarize the performance of the proposed model on the custom dataset using the classification report as shown in Table 5.
Table 5. Performance of the proposed model on the custom dataset.
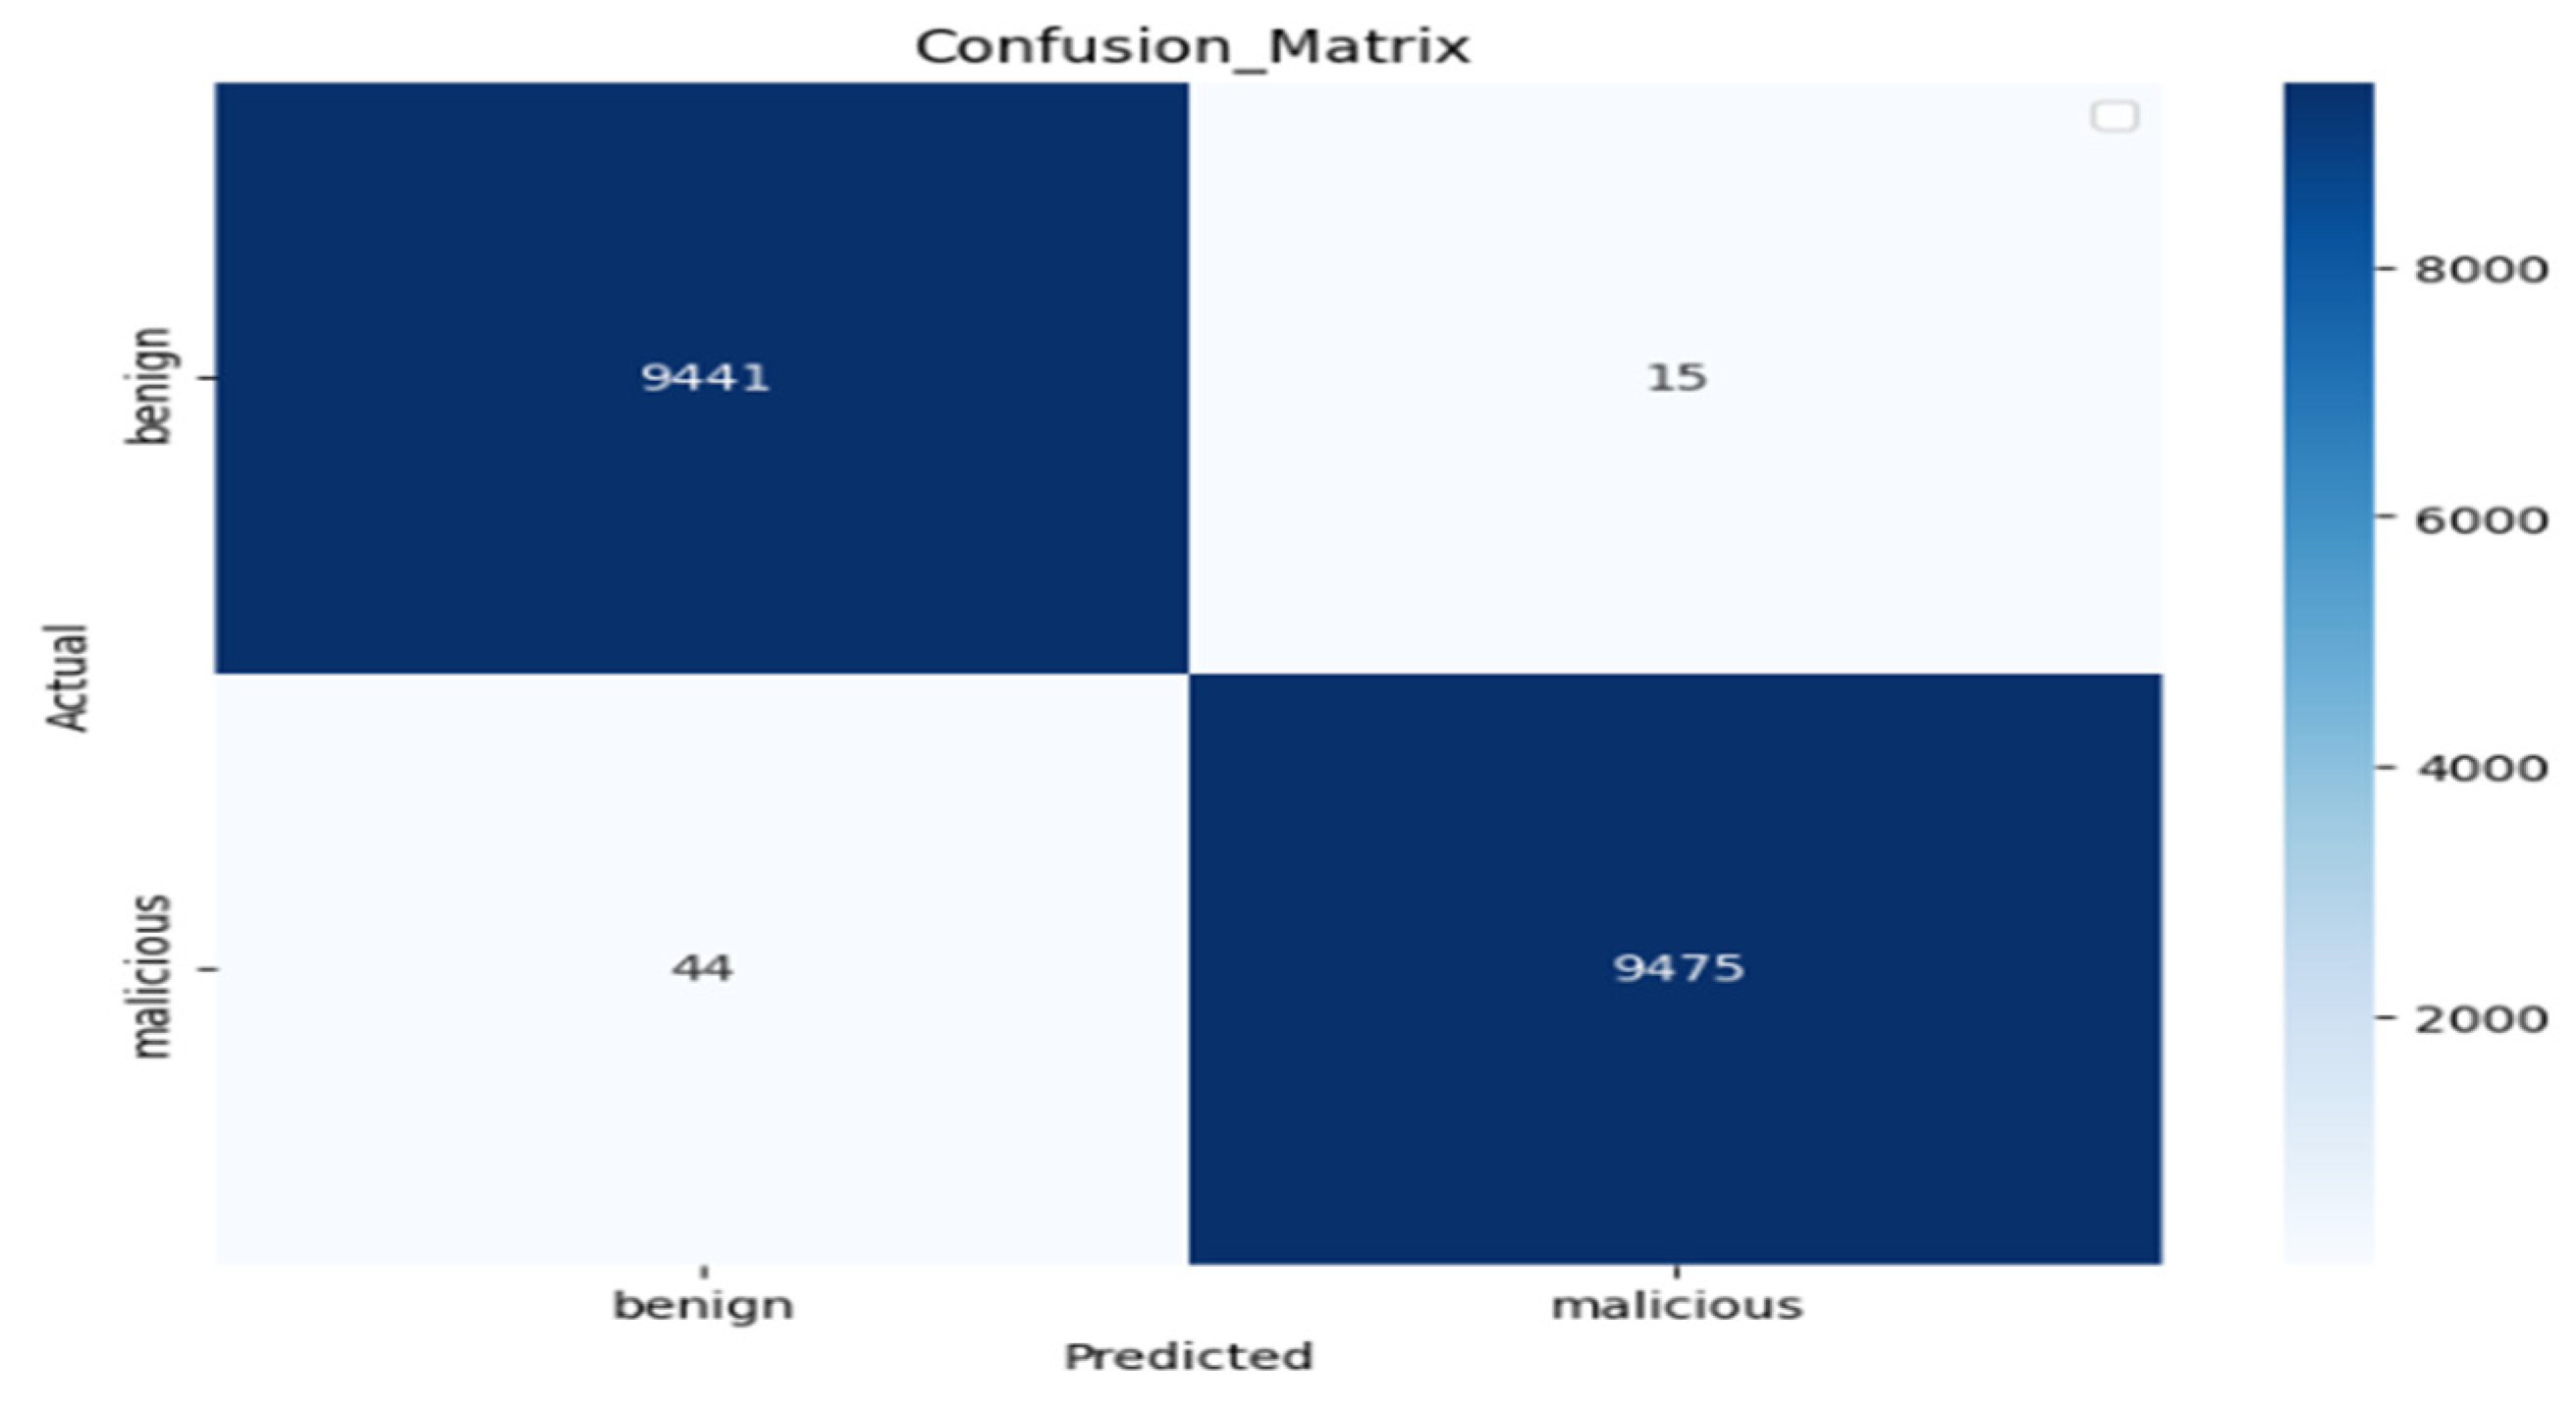
Experiment 2: We obtained our proposed Char2B model using our training dataset as well as by testing the dataset and visualizing the confusion matrix result. The confusion matrix offers a comprehensive perspective on how well a classification model performs, particularly when it comes to differentiating between benign and malicious classifications.
Next to the visualization of the performance metrics of the Char2B model using the classification report and confusion matrix, we used the ROC curve to illustrate how the model accurately distinguishes the positive (malicious) and negative (benign) samples using TPR and FPR. The ROC curve is a graphical tool used to evaluate the performance of a binary classifier by illustrating the trade-off between the TPR and the FPR at various threshold levels.
On the graph shown in Figure 12, the x-axis represents the FPR of 0.017, measuring the proportion of actual negatives that incorrectly classified as positives, while the y-axis indicates the TPR, measuring the proportion of actual positives that were correctly identified. A diagonal dashed line represents a scenario where TPR equals FPR, indicating that a model performing no better than random guessing would lie along this line. The model’s closeness to the upper left corner of this particular ROC curve indicates that it has a high capacity for accurately classifying occurrences. Excellent discrimination between the positive and negative classes indicated by the reported AUC of 0.9965. This high AUC value indicates that there is little overlap between the classes and that the classifier is very good at differentiating between benign and malicious instances. Overall, the ROC curve and its AUC offer a thorough assessment of the model’s performance, emphasizing how well it distinguishes between the two classes while reducing incorrect classifications.
Figure 12. The ROC-AUC curve of the Char2B model of TPR vs. FPR.
We summarized the performance of proposed model on the custom dataset using the classification report shown in Table 6. The precision of 0.99 for class 0 and 0.98 for class 1 indicates very few false positives. The recall of 0.98 for class 0 and 0.99 for class 1 indicates very few false negatives. The F1-scores of 0.99 (class 0) and 0.98 (class 1) confirm a strong balance between precision and recall. The overall accuracy is 99%, correctly predicting 17,444 out of 17,444 samples. Finally, macro and weighted averages both are 0.99, demonstrating consistent and unbiased performance across classes. Therefore, this report reflects excellent model performance with near-perfect metrics and the model is highly effective and well generalized, showing minimal error across both classes.
Table 6. The classification report for the proposed model.

4.6. Performance Evaluation on Other Datasets

We also evaluated our proposed model on the Kaggle dataset and the Gram-bedding dataset [,,]. Due to the storage constraints and the time limitation on the Google Colab working environment, we took 0.15 datasets out of their total dataset [,].

4.6.1. Kaggle Dataset

The Kaggle platform is a well-known community center for experts and hobbyists in data science, machine learning, and artificial intelligence. Kaggle datasets are collections of data that are shared and hosted on the network. These datasets are publicly available for educational, research, and competitive purposes and are contributed to by a variety of entities, including Kaggle itself, organizations, and individual users. Numerous fields are covered by Kaggle datasets, including financial forecasting, sentiment analysis, image classification, virus detection, and fraud detection. They are simple to utilize in data analysis and machine learning models since they are available in common forms such as CSV, Excel, JSON, image files, and audio files. We downloaded a dataset of 632,503 URLs, which comprised both benign and malicious URLs. The benign samples have 316,252 URLs and the malicious samples have 316,251 URLs []. Out of 632,503 URL samples, we used 15% of the dataset, which resulted in 94, 875 samples. We used this dataset to assess our proposed model and we obtained 99.69% accuracy and a loss of 0.016. This indicates that the proposed model is capable of accurately classifying the malicious and legitimate links as shown in Table 7.
Table 7. Performance of the proposed model on the Kaggle dataset.
Figure 13 visualizes the confusion matrix of the performance of a binary classifier in predicting two classes: benign and malicious. Each cell in the matrix represents the number of instances where the model made a specific prediction, providing insight into its accuracy.
Figure 13. The confusion matrix of the Kaggle dataset.
In the top-left corner, we saw 9441 TNs, indicating that the model correctly classified 9441 benign samples. Similarly, the bottom-right corner shows 9475 TPs, meaning that 9475 malicious samples were correctly identified. The misclassification rates are impressively low. The top-right corner displays 15 FPs, which are benign samples incorrectly predicted as malicious. On the other hand, the bottom-left corner shows just 44 FNs, representing malicious samples incorrectly classified as benign. These low misclassification rates highlight the precision and sensitivity of the model, ensuring that both benign and malicious samples were accurately identified in most cases.
Overall, the classifier demonstrates better performance with minimal errors. This is critical in high-stakes applications like malicious detection, where false negatives (missed malicious) could compromise security, and false positives (misclassified benign samples) could lead to unnecessary actions. The balance between true positives, true negatives, and minimal misclassifications reflects the robustness and reliability of the classifier in handling this binary classification task. The ROC curve, shown in Figure 14, illustrates the performance of the binary classifier in differentiating between two classes. The FPR was 0.002. The TPR, shown on the y-axis, is the percentage of real positive samples that the classifier correctly detected. Additionally, there is a dashed diagonal line on the graph where the TPR and FPR are equal at all points, acting as the baseline for random prediction. The orange ROC curve of the classifier exhibits a sharp increase toward the upper-left corner and rises well over this diagonal baseline. This demonstrates the model’s outstanding predictive ability by showing that it can achieve a high true positive rate with a comparatively low false positive rate.
Figure 14. The ROC–AUC curve of the Kaggle dataset.
Moreover, we summarized the performance of proposed model over Kaggle dataset using the classification report as shown in Table 8. The precision, recall, and F1-score all are 1.00 for both classes (0 and 1), indicating that the model makes no errors in prediction. The accuracy value is 100% with the model correctly classifying all 18,975 instances. The macro and weighted averages are both are also 1.00, showing balanced performance across classes regardless of class distribution. Therefore, the classification report demonstrates perfect model performance across all metrics.
Table 8. The classification report for the Kaggle dataset.

4.6.2. Gram-Bedding Dataset

We assessed our model using a Gram-bedding dataset with the same parameter, which offered a thorough summary of how well the model performs in identifying events as harmful or benign []. As shown in Figure 15, from the top-left corner of the matrix, 9172 cases accurately classified as benign, whereas 491 benign instances mistakenly classed as malicious. On the other hand, 499 harmful occurrences mistakenly classified as benign in the bottom-left quadrant, whereas 9038 malicious instances accurately recognized in the bottom-right corner. With a high true positive rate of 0.9477and comparatively few false positives, at a rate of 0.0508, and false negatives, at a rate of 0.0522, the model does well overall, especially when it comes to detecting harmful instances. This suggests that there is a high potential for precise classification between the two groups.
Figure 15. Confusion matrix of the Gram-bedding dataset.
The training and testing performance evaluation of our proposed model on the Gram-bedding dataset shown in Table 9. Hence, 94.25 and 94.84 accuracy was registered for the training and testing sets, respectively.
Table 9. Performance of the proposed model on the Gram-bedding dataset.
Figure 16 presents a plot of the TPR against the FPR and gives information about how well the model can differentiate between benign and malicious cases. This curve is noteworthy for being close to the upper-left corner of the plot, which signals outstanding model performance due to its high true positive rate and low false positive rate. With an area under the ROC curve (AUC) of 0.9890, the model has a 98.90% chance of accurately differentiating between the two groups. This high AUC value demonstrates the model’s great discriminatory capacity in recognizing harmful instances while limiting false alarms, hence reinforcing its usefulness. The diagonal line in the ROC curve indicates that the random line is used as the boundary between two classes. If the TRP and FPR curve lay in this line, the class is not classified properly or the dataset contains a single class.
Figure 16. ROC-AUC curve of the embedding dataset.
We summarize the performance of the proposed model on the Gram-bedding dataset using the classification report as shown in Table 10. The classification report shows that the model performs consistently well across both classes (zero and one) as precision, recall, and F1-score are all 0.95 for both classes, indicating balanced performance.
Table 10. The classification report for the Gram-bedding dataset.
Moreover, accuracy is also 95%, meaning the model correctly predicted 95% of all 19,200 samples. The macro and weighted averages match individual class metrics, confirming no significant class imbalance or bias. Therefore, the model demonstrates strong, uniform performance in classifying both categories, suggesting it is reliable and well generalized for the task. Further improvements may focus on boosting accuracy beyond 95% or testing robustness on unseen datasets.

4.7. Performance Comparison with the Recent Related Works

The performance of our proposed model was compared with recent state-of-the-art approaches in the domain of cybersecurity. As shown in Table 11, we evaluated our model on two public datasets Gram-bedding and Kaggle in addition to our custom dataset. Notably, the Kaggle and Gram-bedding datasets were applied to the Char2B model without any data validation processes. The LogBERT-BiLSTM model demonstrated exceptional performance on the CSIC 2010 dataset, achieving 99.50% accuracy with flawless precision and recall rates of 100%, yielding a perfect F1-score of 100%. These results underscore the efficacy of its integrated architecture. Similarly, the CharBiLSTM-Attention model attained marginally higher performance on a custom dataset, achieving 99.55% accuracy, with 99.64% precision and 99.43% recall, resulting in an F1-score of 99.54%. The model’s attention mechanism likely enhanced its feature extraction capabilities.
Table 11. Model comparison with related works.
In contrast, the BERT model exhibited inconsistent performance across datasets on the GitHub dataset; it achieved 96.71% accuracy, with 96.25% precision and 96.50% recall (F1-score not reported). On the ISX 2016 dataset, it reached 99.98% accuracy, though precision and recall metrics were unavailable.
Our proposed Char2B model delivered robust results on the custom dataset: 98.50% accuracy, 98.27% precision, 98.69% recall, and 98.48% F1-score. On the Kaggle dataset, it had 99.69% accuracy, 99.84% precision, 99.54% recall, and a 99.69% F1-score, demonstrating strong adaptability across diverse contexts.
Collectively, these findings indicate that Char2B competes effectively with state-of-the-art benchmarks like LogBERT-BiLSTM and CharBiLSTM-Attention, particularly in scenarios where its hybrid architecture leverages dataset-specific features.
This study aimed to develop a deep learning model capable of detecting malicious URLs that pose significant cybersecurity threats. The Char2B model developed from the baseline BERT model to evaluate whether a fused architecture could yield superior performance. Using the same dataset, our proposed model outperformed the baseline in terms of detection accuracy and FPR efficiency. For instance, the study in [] achieved a detection accuracy of 96.71%. Using this as a baseline, our model achieved 98.35% detection accuracy with a 0.018 FPR and a 98.98% ROC-AUC, effectively distinguishing between malicious and legitimate URLs even when tested on unseen data. Compared to the baseline, our model achieved an improvement of 0.15% on the custom dataset and 2.98% on the Kaggle dataset. Overall, these experiments suggest that fusing deep learning models, as done in Char2B, offers enhanced performance compared to relying on a single model architecture.

5. Conclusions

In this study, we applied a Char2B model for malicious URL detection. A dataset of 87,216 URLs comprising both malicious and legitimate links collected and preprocessed to remove noise. The quality of the dataset validated using the Box-Cox transformation technique. We performed BERT and character-level tokenization, generating vocabularies of 15,911 and 64, respectively, to create rich embedding. The CharBiGRU and BERT embedding were fused using a Conv1D layer (kernel size = 3; stride and padding = 1), effectively capturing local features at the character level. Both the baseline BERT model and the fused Char2B model trained and evaluated separately. The Char2B model integrates both character-level and word/sub-word information, enabling it to extract hierarchical and contextual features through cross-attention mechanisms. After hyperparameter tuning and model training, the Char2B model achieved 98.50% accuracy and a false positive rate (FPR) of 0.017, outperforming the baseline model in Experiments 1 and 2. This fusion approach effectively detects attacks such as typo squatting, morphological, and substitution attacks by capturing comprehensive URL features. Furthermore, current URL analysis often overlooks the fragment section, which may include page-specific content or redirect information. While our model processes up to 200 tokens, BERT supports up to 512 tokens, suggesting the potential benefit of incorporating longer sequences. Lastly, while we normalized diacritics and capitalization in English-based URLs, this study did not explore multilingual URLs. Future research should address this gap by extending the model to support URLs in multiple languages and by incorporating the fragment section to enhance URL detection accuracy and generalization. Moreover, adversarial samples, in which character substitution, typo squatting, or homoglyph attacks alter a URL link, are also as recommended as a focus for future work.

Author Contributions

The work presented here carried out in collaboration among all authors. Conceptualization, Y.Y.M. and A.B.W.; formal analysis, Y.Y.M. and Y.B.C.; methodology, A.M.M. and Y.Y.M.; supervision, A.B.W.; visualization, Y.Y.M. and A.B.W.; writing—original draft, A.B.W.; writing—review and editing, Y.B.C. and A.M.M., Fund Acquisition, Y.Y.M. Finally, All authors have read and agreed to the published version of the manuscript.

Funding

This research received no external funding.

Data Availability Statement

The dataset can be available upon request.

Acknowledgments

The authors acknowledge the internet resources provided by the Bahir Dar Institute of Technology and Injibara University.

Conflicts of Interest

The author reported no potential conflict of interest.

References

  1. Sun, N.; Ding, M.; Jiang, J.; Xu, W.; Mo, X.; Tai, Y.; Zhang, J. Cyber Threat Intelligence Mining for Proactive Cybersecurity Defense: A Survey and New Perspectives. IEEE Commun. Surv. Tutorials 2023, 25, 1748–1774. [Google Scholar] [CrossRef]
  2. Hong, J.; Kim, T.; Liu, J.; Park, N.; Kim, S.-W. Phishing URL detection with lexical features and blacklisted domains. In Adaptive Autonomous Secure Cyber Systems; Springer: Berlin/Heidelberg, Germany, 2020; pp. 253–267. [Google Scholar]
  3. Atrees, M.; Ahmad, A.; Alghanim, F. Enhancing Detection of Malicious URLs Using Boosting and Lexical Features. Intell. Autom. Soft Comput. 2022, 31, 1405–1422. [Google Scholar] [CrossRef]
  4. Aljabri, M.; Altamimi, H.S.; Albelali, S.A.; Al-Harbi, M.; Alhuraib, H.T.; Alotaibi, N.K.; Alahmadi, A.A.; Alhaidari, F.; Mohammad, R.M.A.; Salah, K. Detecting Malicious URLs Using Machine Learning Techniques: Review and Research Directions. IEEE Access 2022, 10, 121395–121417. [Google Scholar] [CrossRef]
  5. Admass, W.S.; Munaye, Y.Y.; Diro, A.A. Cyber security: State of the art, challenges and future directions. Cyber Secur. Appl. 2024, 2, 100031. [Google Scholar] [CrossRef]
  6. Aslan, Ö.; Aktuğ, S.S.; Ozkan-Okay, M.; Yilmaz, A.A.; Akin, E. A comprehensive review of cyber security vulnerabilities, threats, attacks, and solutions. Electronics 2023, 12, 1333. [Google Scholar] [CrossRef]
  7. Dixit, P.; Silakari, S. Deep Learning Algorithms for Cybersecurity Applications: A Technological and Status Review. Comput. Sci. Rev. 2021, 39, 100317. [Google Scholar] [CrossRef]
  8. Zheng, F.; Yan, Q.; Leung, V.C.; Yu, F.R.; Ming, Z. HDP-CNN: Highway deep pyramid convolution neural network combining word-level and character-level representations for phishing website detection. Comput. Secur. 2022, 114, 102584. [Google Scholar] [CrossRef]
  9. Ramos Júnior, L.S.; Macêdo, D.; Oliveira, A.L.I.; Zanchettin, C. LogBERT-BiLSTM: Detecting malicious web requests. In Artificial Neural Networks and Machine Learning—ICANN 2022; Springer: Berlin/Heidelberg, Germany, 2022; pp. 704–715. [Google Scholar]
  10. Yuan, L.; Zeng, Z.; Lu, Y.; Ou, X.; Feng, T. A character-level BiGRU-attention for phishing classification. In Proceedings of the Information and Communications Security: 21st International Conference, ICICS 2019, Beijing, China, 15–17 December 2019; Springer: Berlin/Heidelberg, Germany, 2020; pp. 746–762. [Google Scholar]
  11. Aljabri, M.; Alhaidari, F.; Mohammad, R.M.A.; Mirza, S.; Alhamed, D.H.; Altamimi, H.S.; Chrouf, S.M.B. An Assessment of Lexical, Network, and Content-Based Features for Detecting Malicious URLs Using Machine Learning and Deep Learning Models. Comput. Intell. Neurosci. 2022, 2022, 3241216. [Google Scholar] [CrossRef] [PubMed]
  12. Yuan, J.; Liu, Y.; Yu, L. A Novel Approach for Malicious URL Detection Based on the Joint Model. Secur. Commun. Networks 2021, 2021, 4917016. [Google Scholar] [CrossRef]
  13. Krishna, V.A.; Sahitya, G.; Kishore, P.V.V.; Bhargava, N.S.R.C.; Deepthi, K.; Sumana, S. Phishing detection using machine learning based URL analysis: A survey. Int. J. Eng. Res. Technol. 2021, 10, 1–9. [Google Scholar]
  14. Manyumwa, T.; Chapita, P.F.; Wu, H.; Ji, S. Towards Fighting Cybercrime: Malicious URL Attack Type Detection using Multiclass Classification. In Proceedings of the 2020 IEEE International Conference on Big Data (Big Data), Atlanta, GA, USA, 10–13 December 2020; pp. 1813–1822. [Google Scholar]
  15. Su, M.-Y.; Su, K.-L. BERT-Based Approaches to Identifying Malicious URLs. Sensors 2023, 23, 8499. [Google Scholar] [CrossRef] [PubMed]
  16. Tinkerd. BERT Embedding’s. Mar. 2023. Available online: https://tinkerd.net/blog/machine-learning/bert-embeddings/ (accessed on 30 April 2025).
  17. Shawon10. URL classification dataset (DMOZ). Kaggle, 2021. Available online: https://www.kaggle.com/datasets/shawon10/url-classification-dataset-dmoz (accessed on 25 December 2024).
  18. PhishTank. PhishTank: Online phishing database. OpenDNS, 2025. Available online: https://phishtank.org (accessed on 25 December 2024).
  19. ANY.RUN. Interactive malware analysis service. ANY.RUN, 2025. Available online: https://app.any.run (accessed on 27 December 2024).
  20. Ahmad, A.; Awan, I. Feature selection and hyperparameter tuning for phishing detection using random forest. J. Cybersecur. 2021, 5, 45–60. [Google Scholar]
  21. Kumar, V. Data transformations in ML: Log transformer. Medium, 2023. Available online: https://medium.com/@vinodkumargr/09-data-transformations-in-ml (accessed on 25 February 2025).
  22. Kosar, V. Encoder-only vs decoder-only vs encoder-decoder transformer. Personal Blog, 2023. Available online: https://vaclavkosar.com/ml/Encoder-only-Decoder-only-vs-Encoder-Decoder-Transfomer (accessed on 25 March 2025).
  23. Santos, J.; Lima, J. Tuning machine learning models for cybersecurity using genetic algorithms. IEEE Trans. Inf. Forensics Secur. 2020, 15, 1234–1245. [Google Scholar]
  24. Sadiq, S. Benign and malicious URLs. Kaggle, 2023. Available online: https://www.kaggle.com/datasets/samahsadiq/benign-and-malicious-urls (accessed on 15 May 2025).
  25. Dalgiç, F.C.; Bozkır, A.S.; Aydos, M. Grambeddings dataset. Hacettepe Univ., 2022. Available online: https://web.cs.hacettepe.edu.tr/~selman/grambeddings-dataset/ (accessed on 26 October 2024).
  26. Smith, J.; Johnson, A.; Lee, K. Efficient real-time URL threat detection using stratified subsampling. J. Cybersecur. 2022, 15, 245–260. [Google Scholar]
  27. He, T.; Zheng, Y.; Ma, Z. Study of network time synchronisation security strategy based on polar coding. Comput. Secur. 2021, 104, 102214. [Google Scholar] [CrossRef]
Disclaimer/Publisher’s Note: The statements, opinions and data contained in all publications are solely those of the individual author(s) and contributor(s) and not of MDPI and/or the editor(s). MDPI and/or the editor(s) disclaim responsibility for any injury to people or property resulting from any ideas, methods, instructions or products referred to in the content.

Article Metrics

Citations

Article Access Statistics

Multiple requests from the same IP address are counted as one view.