Article

A Novel Model for Accurate Daily Urban Gas Load Prediction Using Genetic Algorithms

1
Natural Gas Gathering and Transmission Engineering Technology Research Institute, PetroChina Southwest Oil and Gas Field Company, Chengdu 610041, China
2
Petroleum Engineering School, Southwest Petroleum University, Chengdu 610500, China
*
Authors to whom correspondence should be addressed.
Algorithms 2025, 18(6), 347; https://doi.org/10.3390/a18060347
Submission received: 19 March 2025 / Revised: 30 May 2025 / Accepted: 31 May 2025 / Published: 5 June 2025
(This article belongs to the Special Issue Artificial Intelligence for More Efficient Renewable Energy Systems)

Abstract

With the increase of natural gas consumption year by year, the shortage of urban natural gas reserves leads to the increasingly serious gas supply–demand imbalance. It is particularly important to establish a correct and reasonable gas daily load forecasting model to ensure the realization of forecasting function and the accuracy and reliability of calculation results. Most of the current prediction models are combined with the characteristics of gas data and prediction models, and the influencing factors are often considered less. In order to solve this problem, the basic concept of multiple weather parameter (MWP) was introduced, and the influence of factors such as the average temperature, solar radiation, cumulative temperature, wind power, and temperature change of the building foundation on the daily load of urban gas were analyzed. A multiple weather parameter–daily load prediction (MWP-DLP) model based on System Thermal Days (STD) was established, and the genetic algorithm was used to solve the model. The daily gas load in a city was predicted, and the results were analyzed. The results show that the trend between the predicted value of gas daily load obtained by the MWP-DLP model and the actual value was basically consistent. The maximum relative error was 8.2%, and the mean absolute percentage error (MAPE) was 2.68%. The feasibility of the MWP- DLP prediction model was verified, which has practical significance for gas companies to reasonably formulate and decide peak shaving schemes to reserve natural gas.

1. Introduction

1.1. Background

In recent years, China’s natural gas consumption has shown a continuous growth trend [1]. In the context of the “Dual carbon goals” strategy, renewable energy is increasingly becoming a core component of the energy mix. However, natural gas is the category with the lowest carbon emission per unit of fossil fuel. It can not only replace high-carbon fossil energy but also form synergy and complementarity with renewable energy. This dual function still gives it irreplaceable strategic value in the process of energy system transformation to low carbon [2]. In 2020, China’s carbon emissions will be about 98.9 × 10⁸ tons, accounting for about 30.9% of the world’s total carbon emissions, while natural gas only accounts for 5.4% [3]. With the enhancement of environmental awareness and the promotion of energy structure adjustment, natural gas, as a relatively clean and efficient energy, has been increasing its proportion in the energy consumption structure. Since 2006, China’s natural gas consumption has grown at an average annual rate of about 8%, climbing from 69.3 × 10⁸ m3 in 2006 to 4584 × 108 m3 in 2020, an increase of nearly 4.7 times in 15 years [4,5]. This growth is not only due to the demand for energy replacement in the industrial sector but also closely related to the transformation of residential energy consumption structure. However, the rapid expansion of consumption is in sharp contrast to the insufficient capacity of urban natural gas reserves, and the working gas storage in 2024 only accounts for 5.8% of consumption, far below the internationally recognized safe reserve level of 15–20% [6]; consequently; the imbalance between supply and demand in the winter heating period is particularly prominent. From the industrial field to residential life, the application range of natural gas is more and more extensive; for example, in industrial production, natural gas is used for heating, power generation, and other links; in the life of residents, the demand for gas heating and gas cooking is growing day by day. According to the “China Urban Gas Development Report (2024)” [7], from 2018 to 2022, the domestic gas consumption increased from 82 × 108 m3 to 105 × 108 m3, with an average annual growth of 3.2%, of which the heating and cooking gas consumption accounted for 45% and 30%, respectively. However, due to the rapid growth of natural gas consumption, the contradiction between fuel supply and demand has become the core issue restricting urban energy security.
The rapid growth of natural gas consumption has made the gas supply–demand imbalance become gradually prominent. Due to the shortage of natural gas reserves in cities, the situation of gas supply and demand is becoming increasingly severe, and “gas shortage” and “guaranteed supply” have become the key words of gas industry development. Gas load data are of great significance in alleviating the gas supply–demand imbalance [8]. Gas load forecasting can predict gas load data and provide a basis for gas supply planning, the maintenance planning of gas pipe network, and distribution network scheduling [9]. Therefore, research on gas load forecasting has been an area of focus. Accurate gas demand forecasting is of great importance to ensure the smooth and reliable use of gas in cities. In addition, the accurate prediction of daily gas load, as well as the reasonable formulation and decision-making of natural gas peak regulation measures, are very necessary to effectively alleviate the uneven gas consumption and ensure a safe and stable gas supply [10].
Gas forecasting faces many challenges and has certain difficulties. Firstly, gas demand is affected by many factors [11], including weather conditions, economic development level, residents’ living habits, industrial production activities, etc. These factors interweave with each other, making the changing law of gas demand complicated and difficult to distinguish. In addition, the demand for natural gas by users fluctuates greatly with the change of temperature, which has a strong randomness [12]. As different users have different gas consumption characteristics, the gas consumption law has no obvious cycle or growth law, and the gas load data have strong nonlinearity, which brings great difficulties and challenges to the operation and scheduling of gas pipe network [13,14,15]. Therefore, this paper carries out in-depth and systematic research on the forecast of city gas daily load based on the multiple weather parameter (MWP) concept, so as to provide decision support and technical guidance for engineering practice.

1.2. Literature Review

Domestic and foreign scholars have put forward some methods or means for gas load forecasting. Commonly used methods include traditional statistical methods, artificial intelligence methods, and so on. The traditional statistical method of gas load forecasting is to build a forecasting model based on the time series characteristics of historical data and the statistical relationship between variables. Traditional statistical methods include exponential smoothing [16,17], regression analysis [18], autoregressive moving average model [19,20], and gray analysis [21,22]. The results show that the traditional statistical method has certain application value when the data amount is small and the data rule is relatively simple. However, in the face of complex and variable gas load data, there are certain limitations. The regression analysis method should introduce appropriate independent variables in the prediction, so that the errors will be added to the corresponding dependent variables, resulting in large errors [10]. The smoothing index method is only suitable for forecasting in a short period [23,24,25]. In the actual gas load forecasting process, the forecasting ability and accuracy of traditional statistical methods are inferior to that of artificial intelligence methods.
The artificial intelligence method of gas load forecasting is to use computer algorithms to learn and analyze a large amount of historical data, so as to establish a model that can accurately predict the future gas load. Artificial intelligence methods such as the fuzzy logic method [26,27], artificial neural network method [28,29], and support vector machine method [30] have been widely used. Khan and Zafari [31] used the genetic algorithm to design evolutionary regression neural network to predict the half-hour power load. Lu et al. [32] adopted a mixed model combining fruit fly optimization algorithm (FFOA), simulated annealing algorithm (SA), cross factor (CF), and support vector machine (SVM) to forecast gas short-term load, which had higher accuracy in gas short-term load prediction. Although artificial neural network method has good approximation effect and fast calculation speed, due to the inherent limitations of artificial neural network as a black box model, forecasters can only observe the mapping results from input data to output prediction and cannot analyze the system prediction process [33,34], which has shortcomings such as local optimal solution, which limits its practical engineering application in daily natural gas load prediction. In terms of the research progress of artificial neural network, Xu et al. [35] proposed a combined prediction model of gas load based on machine learning, which controlled the average absolute percentage error of gas load prediction within 1.9%. Ma et al. [9] used the generated simulation data and historical data to form an enhanced dataset to train the model, reducing the daily gas load forecasting error to less than 7%. Scholars generally focus on improving the algorithm to improve the prediction accuracy of gas load but pay less attention to the factors that affect the change of gas load and lead to the change of user demand.
With the deepening of the research, more and more scholars began to consider the influence of various influencing factors on gas load. In terms of weather factors, more and more research has begun to focus on temperature variables. Lu et al. [32] constructed a mixed model of support vector machine optimized by chaotic firefly-simulated annealing-fuzzy firefly optimization algorithm to predict the short-term load of urban gas and discussed the influence of temperature type on the prediction results. Xu et al. [35] collected and analyzed local gas load and meteorological data, proposed a daily average temperature correction algorithm based on the cumulative effect of temperature, and built a back-propagation-improved complete ensemble empirical mode decomposition with adaptive noise-gated recurrent unit combined prediction model. In addition to temperature, weather variables such as humidity, wind speed, and precipitation were also incorporated into the forecast model. Ni et al. [36] proposed a multi-component natural gas load forecasting method based on a residual recurrent neural network by integrating historical, climatic, and holiday factors. However, more studies have been conducted on the relationship between daily gas load and temperature, Ni et al. [37] analyzed the relationship between load variation and meteorological factors using the gas load and meteorological data of Hangzhou City, established a prediction model based on SVM, and found that the load had seasonal and daily variation characteristics, and the temperature and pressure were significantly correlated with the load rate. He et al. [38], aiming at the forecasting error of gas load under extreme weather in Chinese cities in winter, proposed a forecasting method based on short-term temperature and load data combined with one-week weather forecast. Farfar and Khadir [39] used K-means clustering combined with temperature estimation to identify daily load categories and then independently predicted different daily load types by stacking noise reduction autoencoders based on Algerian hour data verification, effectively improving the prediction accuracy. But less consideration has been given to the effect of comprehensive weather variables on daily gas load.
To sum up, although traditional statistical methods and artificial intelligence methods have made some progress, there are generally two limitations. First of all, the traditional statistical method has application value when the data amount is small and the rule is simple, but it is difficult to adapt to the nonlinear, multi-variable coupling and high-frequency fluctuation characteristics of gas load, and the prediction ability is poor and the prediction accuracy is low. Secondly, although the artificial intelligence method has strong fitting ability, it lacks the support of physical mechanism and has difficulty explaining the actual impact of meteorological variables on load. In this paper, an MWP-DLP model based on composite weather variables was proposed. For the first time, cumulative temperature, solar radiation, wind speed, and building foundation temperature changes were incorporated into the unified modeling system, and multi-factor influence coefficients were dynamically modified by genetic algorithm, providing a new path for solving nonlinear and multi-variable coordination problems in urban gas load prediction.

1.3. Contributions

In order to make up for the gap of previous research, the future research trend will focus on more complex models and more influencing factors. The following are this paper’s primary contributions:
(1)
The establishment and integration of a multiple weather parameter (MWP) prediction framework that incorporates cumulative temperature, solar radiation, wind speed, and building foundation temperature breaks through the simplification limitations of traditional single variable models and captures the complex coupling relationship between environmental factors and gas demand. The results show that the maximum relative error of the model prediction was 8.2%, and the mean absolute percentage error (MAPE) was 2.68%, effectively depicting the load fluctuation characteristics driven by multiple factors.
(2)
Based on the MWP, the effects of cumulative temperature, solar radiation, wind power, and building foundation temperature on the daily gas load were considered, and the coefficients of cumulative temperature, solar radiation. and wind power were modified to change the STD value. This mechanism enhanced the model’s adaptability to temperature changes in different seasons and between day and night. In scenarios of extreme sudden drops in temperature, the maximum deviation between the predicted value and the actual value always remained at a relatively low level. It significantly improved the model’s response ability to sudden load changes.
(3)
Taking a city as the research object, the MWP-DLP model was established, and the genetic algorithm was used to predict and solve the daily gas load. The initial population size was 60, with 1100 iterations. GA optimization converged the model variance to 5379, and the prediction accuracy was significantly improved compared with traditional methods. Finally, the accuracy of the model was verified by the measured data.

1.4. Paper Organization

The structure of this paper is as follows. The second section analyzes the factors affecting the daily load of city gas. In Section 3, we set up a mathematical model. In Section 4, a case study is carried out to analyze the solution results of the model. Finally, in Section 5, we conclude.

2. Influencing Factors of City Gas Daily Load

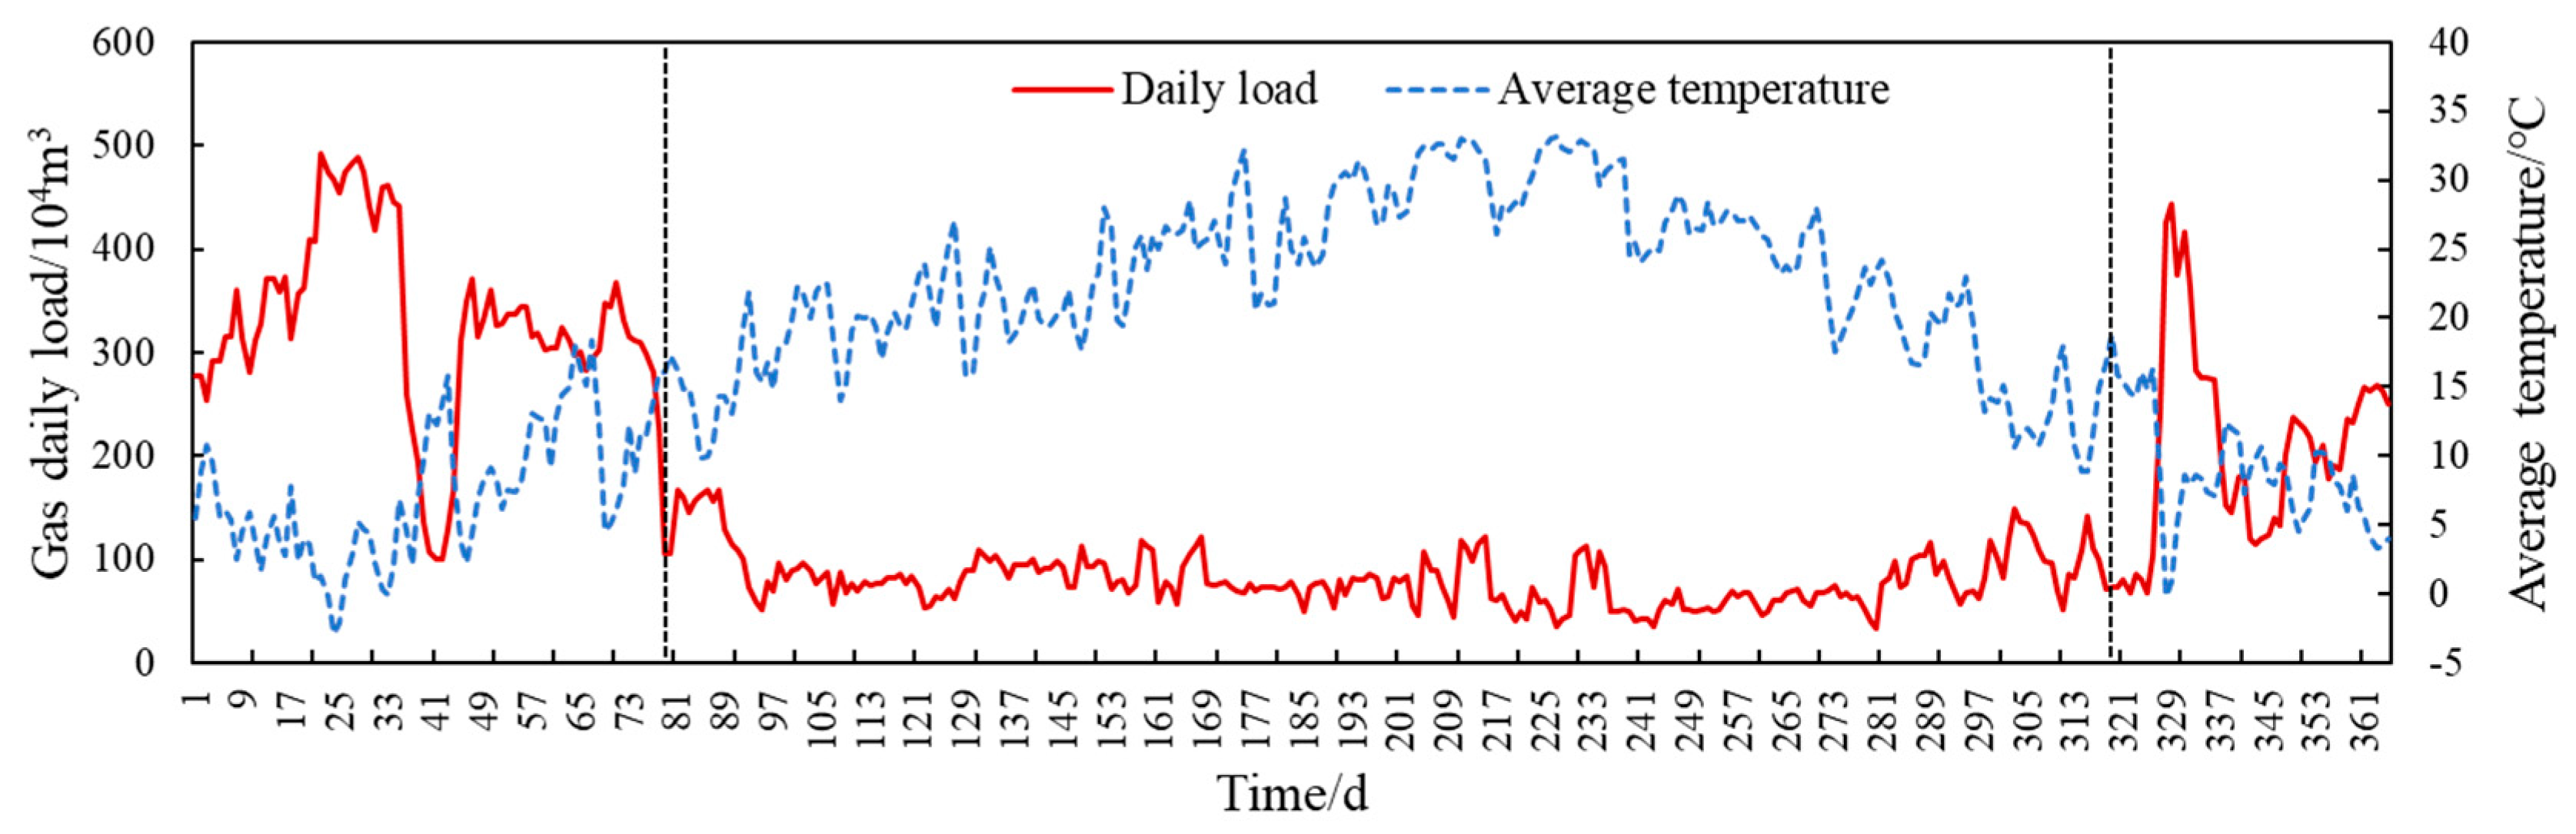
2.1. Air Temperature

Residents’ living habits will be directly affected by the change of temperature, thus affecting the actual gas load. A small change in temperature of 1 °C will lead to a 5–6% change in daily gas load [40]. After sorting out the annual air temperature data and gas data of a city, the yearly changes in daily gas load and average temperature of a city are shown in Figure 1. It can be seen that the daily gas load was negatively correlated with temperature, and the gas load decreased with the increase of temperature.

2.2. Solar Radiation
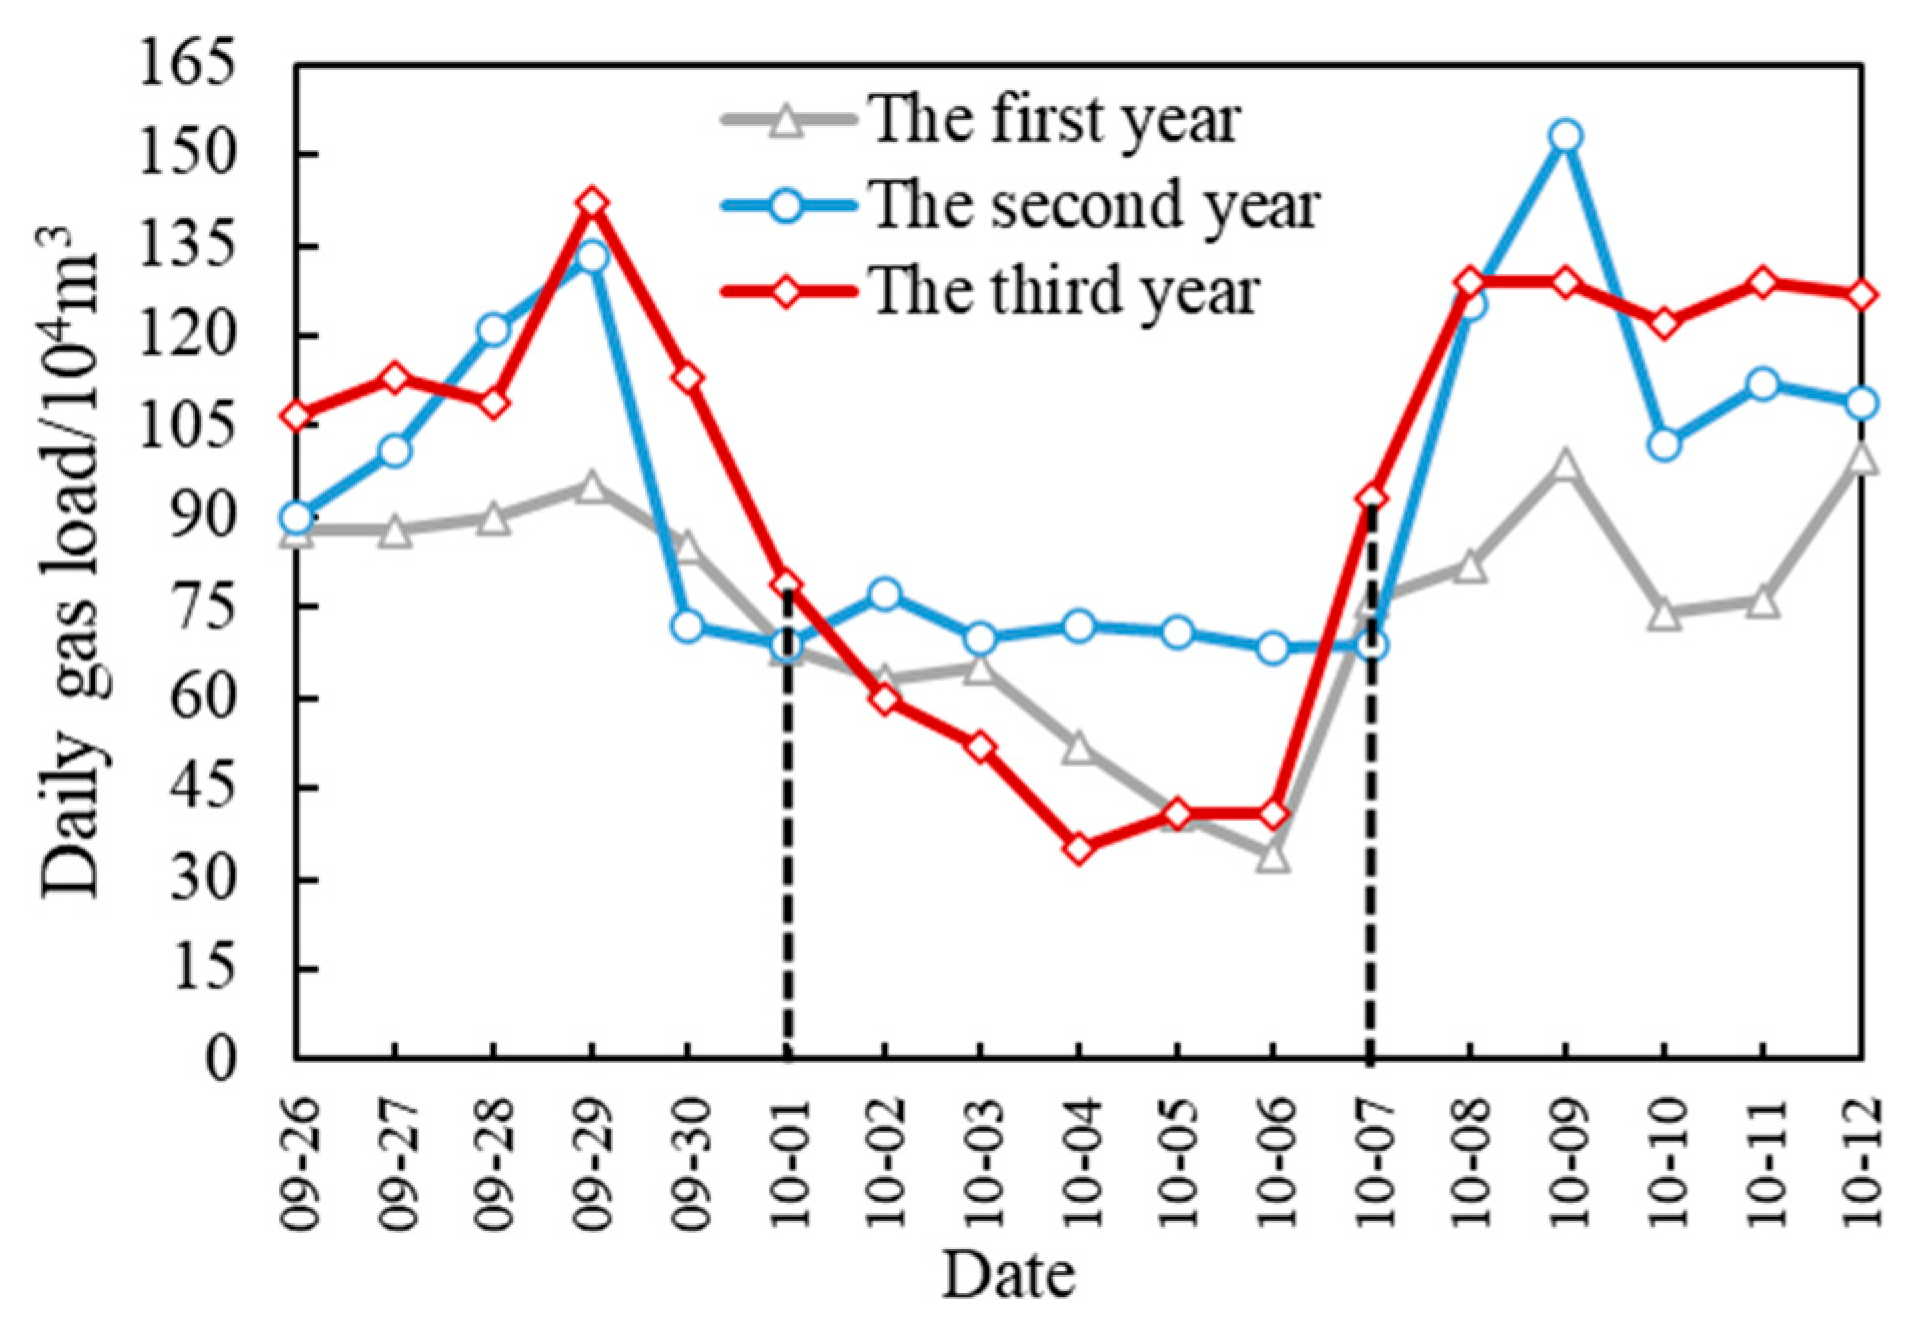
Solar radiation is another major cause of daily gas load variation. After sorting out the solar radiation data of a city for one consecutive year, the yearly change trend of daily gas load and solar radiation is shown in Figure 2. The analysis shows that when the solar radiation was high, the daily load of gas was small, and when the solar radiation was low, the daily load was at a high level. It shows that the variation of solar radiation will affect the fluctuation of daily gas load, so it is necessary to analyze the correlation between solar radiation and daily load.

2.3. Holidays

Holidays have a great impact on the daily gas load, and the daily gas load curve shows obvious differences from working days. By sorting out the daily gas load data of major holidays in a city for three consecutive years, it was found that the daily load changes during holidays tended to be consistent. The daily gas load curves during the National Day and 5 days before and after are shown in Figure 3, and the daily gas load curves during the Spring Festival and 5 days before and after are shown in Figure 4.
The analysis shows that the daily gas load during the National Day and Spring Festival was less than that on weekdays, and the daily gas load before and after the festival fluctuated obviously. Due to the obvious difference between the daily gas load on holidays and the daily gas load on working days, the daily gas load data on holidays should be processed separately when studying the daily gas load prediction.

3. Mathematic Model

3.1. Establishment of MWP-DLP Model

MWP is a combination variable of various weather factors. In the field of gas load, a series of factors such as temperature, solar radiation, wind speed, and the change of building base temperature were comprehensively considered to obtain the MWP index, so that the gas load and MWP index changed linearly, so as to predict the future gas load, which is widely used in local pipeline network specifications in European countries. STD is a commonly used indicator to describe the MWP at present [41,42,43,44,45]. This indicator is a measure used to quantify the energy demand required to heat a building, i.e., when the temperature is low, the user needs to heat it.
The MWP-DLP model is based on the temperature difference between the base temperature of the building and the ambient temperature to determine the energy demand. In the MWP-DLP model, the influences of cumulative temperature, solar radiation, wind, and building foundation temperature on the daily gas load are considered, and the coefficients of cumulative temperature, solar radiation and wind are modified to change the STD value. Thus, the daily gas load is predicted.
In the MWP-DLP model, the objective function is the daily gas load value, and the calculation formula is shown in Equation (1).
F 2 = a 0 + a 1 ( D i + β 1 W S i D i )
where F2 is the predicted value of gas daily load, 104 m3. WSi is the day wind value, knot. Di is the degree-day number of the gas network on the second day, °C. a 0 , a 1 , β 1 is a dimensionless coefficient.
Di was used to estimate the control gas consumption. Based on Di, the influence of variable building base temperature was considered using transformation function, and the influence coefficients of solar radiation and wind were improved. The calculation expression is shown in Equation (2).
D i = 0 T a , i > T b , l o w T a , i T b , u p 2 2 ( T b , u p T b , l o w ) T b , l o w < T a , i < ( T b , u p + T b , l o w ) / 2 T a , i T a , i < T b , l o w T b , u p
where Tb,low is the lower limit of building foundation temperature, °C. Tb,up is the lower limit of building base temperature, °C. Ta,i is the day i temperature based on the cumulative effect of solar radiation and temperature, °C.
Ta,i can be obtained by Equation (3).
T a , i = T s r , i + T e f f , i
where Tsr,i is the temperature of the isothermal effect of solar radiation on day i, °C. Teff,i is the temperature generated by the cumulative effect of temperature on day i, °C. Tsr,i and Teff, i are calculations such as Equations (4) and (5).
T s r , i = β 2 G R i
T e f f , i = ( 1 φ 1 ) T A V G , i + φ 1 T A V G , i 1     0 φ 1 1
To sum up, the daily gas load prediction model based on MWP-DLP was established by considering the change of building foundation temperature and modifying the cumulative temperature, solar radiation, and wind coefficient.

3.2. Solving of the MWP-DLP Model

3.2.1. Basic Data

In the MWP-DLP model, the known basic data include the actual daily gas load on day i  C i ; the average temperature on day i  T A V G ; the average temperature on day i − 1  T A V G , i 1 ; the wind speed on day i  W S i ; and the solar radiation value on day i  S R i .
Training samples were selected for 71 groups of daily gas loads (excluding weekends and holidays) from November 15 of the first year to March 15 of the second year in Wuhan City. Some basic data are shown in Table 1.

3.2.2. Solving Process

The genetic algorithm (GA) is an optimization search algorithm inspired by biological evolution, mimicking natural selection and genetic mechanisms to iteratively improve solutions. Its core steps are as follows:
(1)
Population Initialization: Randomly generate an initial set of solutions (individuals) within the problem’s solution space. Each individual is encoded (commonly using binary or real-number encoding), and the collection of all individuals forms the population.
(2)
Fitness Evaluation: Define a fitness function to measure the quality of each individual. A higher fitness value indicates a better solution tailored to the problem.
(3)
Selection Operation: Based on fitness values, select individuals from the current population as parents for the next generation. Common selection methods include roulette wheel selection and tournament selection, prioritizing individuals with higher fitness.
(4)
Crossover Operation: Combine the selected parent individuals to generate offspring. This mimics biological recombination by exchanging genetic segments (e.g., binary bits or real-number parameters) between parents, creating new trait combinations in offspring.
(5)
Mutation Operation: Introduce small random changes to offspring individuals to maintain population diversity. Mutation simulates genetic mutations, altering specific bits or parameters in the encoding to explore new solutions.
(6)
Replacement Operation: Replace part of the current population with newly generated offspring, forming a new population for the next iteration.
(7)
Termination Check: Determine if the termination condition is met (e.g., maximum iterations, converged fitness value). If satisfied, the algorithm ends and outputs the optimal solution; otherwise, return to Step 2 for further iteration.
The MWP-DLP model was solved by the genetic algorithm. We input MWP- DLP model parameters into MATLAB R2022b. The initial population size was set to 60, the binary coding length to 56, the crossover probability to 0.2, the mutation probability to 0.01, and the number of iterations to 1100. The model predicted value, variable coefficient, and variance sum of each 100 iterations were recorded, and the coefficient value that minimized the objective function was solved to obtain a modified model suitable for the city.

3.2.3. Solution Result

The variation of the variable coefficient of the solving model is shown in Table 2. The comparison between the predicted value and the actual value for 100, 500, 700, and 1000 iterations is shown in Figure 5, and the comparison between the predicted value and the actual value for 4 iterations is shown in Figure 5. As can be seen from Table 2, as the number of iterations increased, the variance sum gradually decreased, and the predicted value was closer and closer to the actual value. After 1000 iterations, the variance sum trended toward 5381, and the iteration converged. It can be seen from Figure 5 that as the number of iterations increased, the smaller the deviation degree between the predicted value and the actual value became; the predicted value curve obtained by iterating 1000 times was the closest to the actual value, indicating that the better predicted value could be obtained by solving the MWP-DLP model using genetic algorithm. At the same time, it shows that MWP-DLP model can better predict the daily gas load in the city.
The coefficient value of 1000 iterations in Table 2 was brought into Equation (6), and Equation (7), based on the daily gas load data of the city, was obtained.
F 2 = 79.6 + 20.6 × ( 1 + 0.021 × W S i ) D i D i = 0 0.021 × S R i + T e f f , i > 18.98 ( 0.021 × S R i + T e f f , i 18.98 ) 2 13.58 12.19 < 0.021 × S R i < 18.98 15.59 0.021 × S R i T e f f , i 0.021 × S R i 12.19
T e f f , i = 0.8672 × T A V G , i + 0.1328 T A V G , i 1

4. Case Analysis

4.1. Results Analysis

(1)
Comparative analysis of predicted value and actual value
Based on the qualitative comparison between the predicted value and the actual value in Figure 6, it can be seen that MWP-DLP model had a high forecasting accuracy. From the perspective of trend characteristics, the predicted curve of the model was remarkably consistent with the actual load curve, especially in the phase characteristics and fluctuation patterns of daily load changes, and accurate matching could be achieved. The empirical analysis shows that the model could significantly improve the characterization ability of the traditional model for multi-factor coupling by introducing variable building base temperature parameters and using coefficient correction method to quantify the nonlinear effects of meteorological variables such as the cumulative temperature, solar radiation, and wind power. This shows that the dynamic optimization mechanism of temperature sensitivity parameters can effectively improve the environmental adaptability of the prediction system. It is worth noting that the model can still accurately track the abrupt load characteristics under the condition of sharp fluctuations in the average temperature (such a as sudden rise during the day or a sudden fall at night), and the maximum deviation between the predicted value and the actual value was always maintained at a low level. This phenomenon verifies the robustness of the weather-load dynamic response mechanism constructed by the model under complex meteorological conditions and also reveals the key role of cooperative correction of building thermal inertia parameters and external environment variables in improving the accuracy of load prediction. The results provide a new technical path for gas load forecasting from the perspective of thermodynamic system modeling.
(2)
Change trend analysis
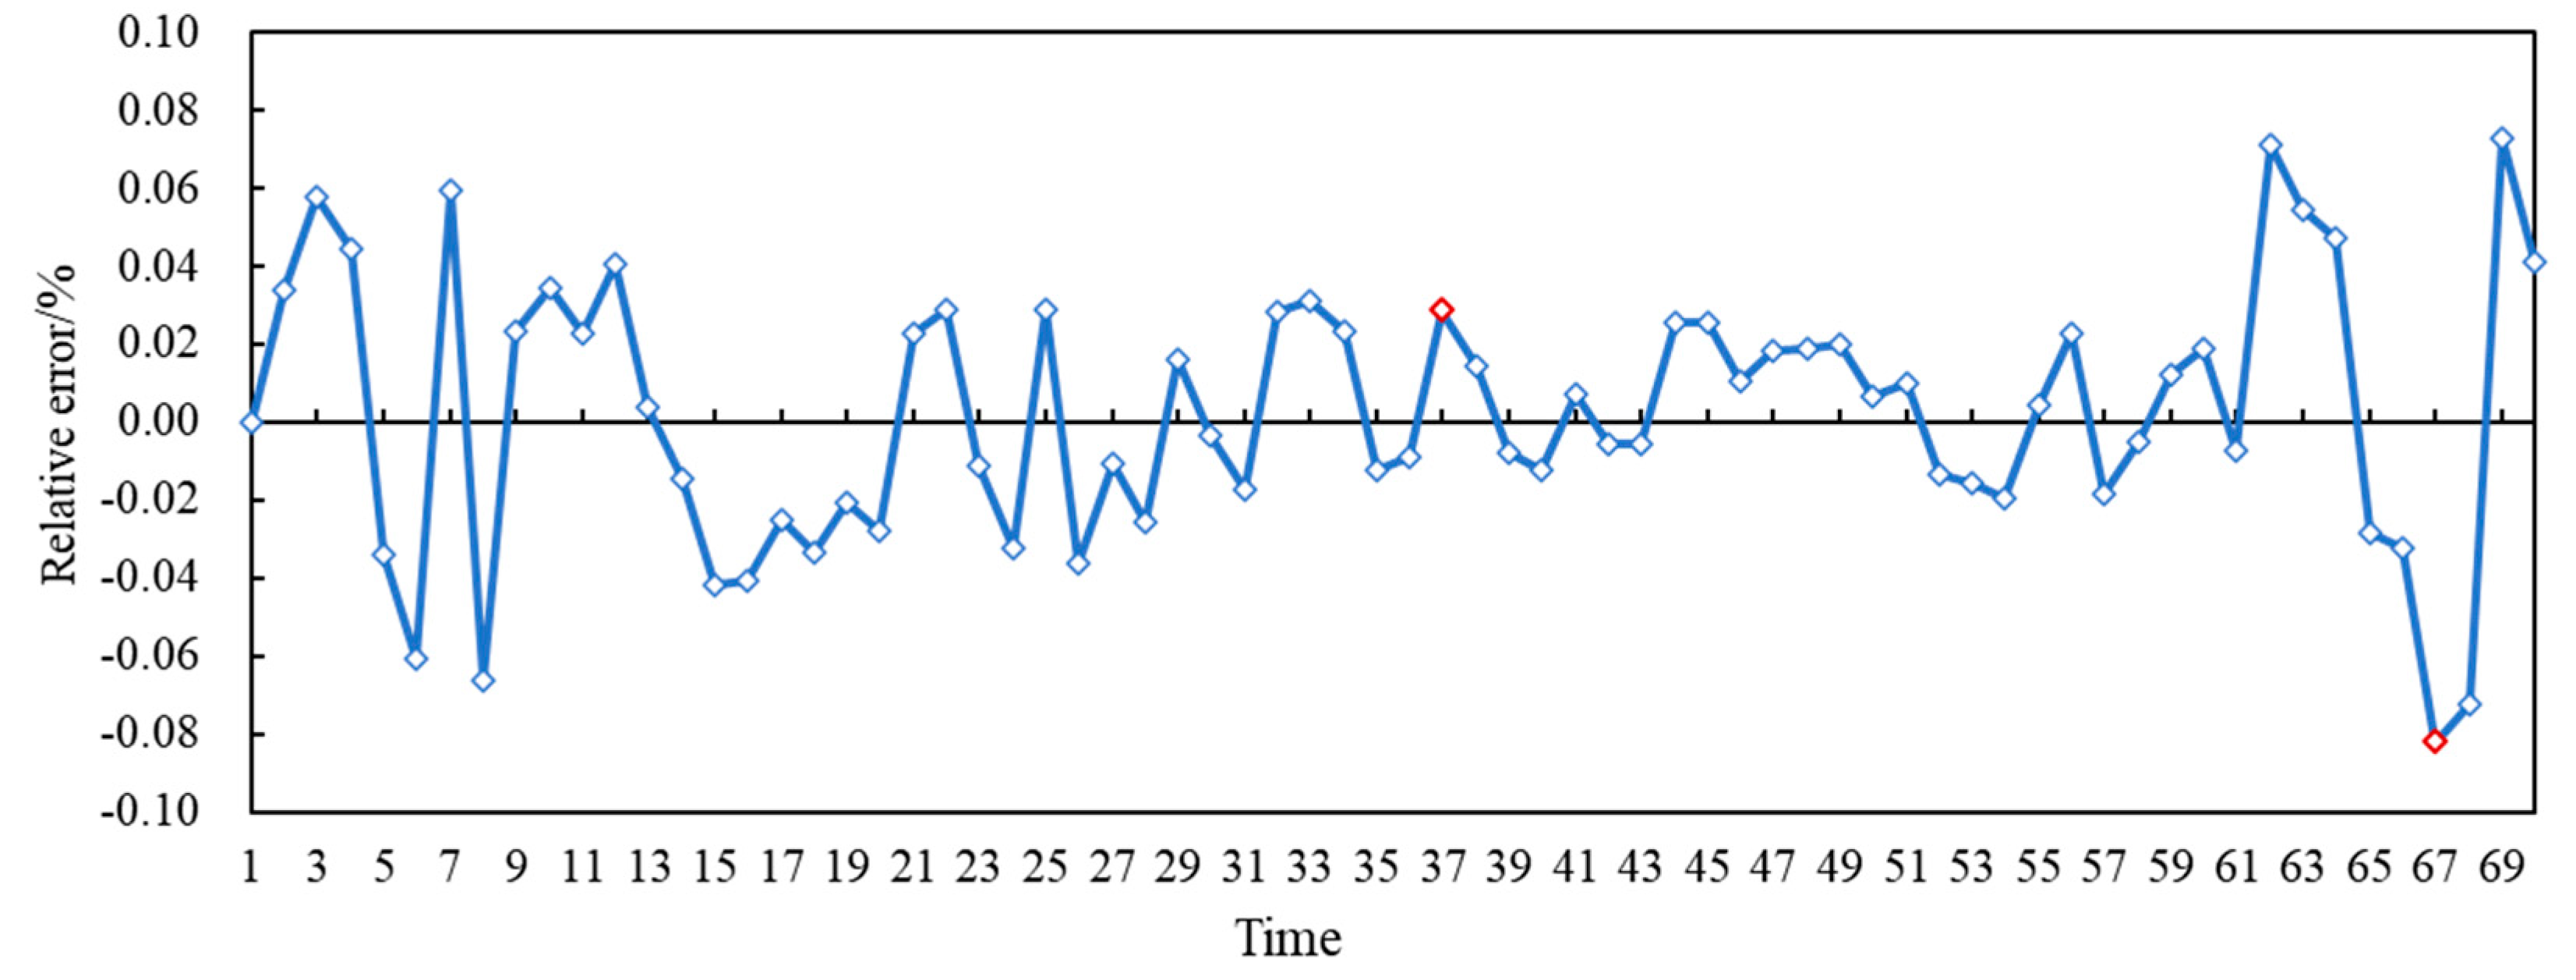
The analysis results of gas load correlation characteristics based on Di parameters are shown in Figure 7 and Figure 8. The biaxial time-series comparison in Figure 8 shows that the Di parameters had a significant positive correlation with the daily gas load, and its variation trend was highly synchronized. At the same time, there was a stable negative correlation between the Di parameters and the average temperature, and the Di values showed a systematic decrease when the temperature increased and a reverse change rule when the temperature decreased. Linear regression analysis in Figure 9 further verifies that there was a clear first-order linear relationship between the daily gas load and Di value, and the data points were regularly distributed along the fitting line, indicating that this parameter had reliable load characterization ability. This finding confirms from the level of thermodynamic driving mechanism that Di can be used as an effective quantitative index for the correlation analysis of building the thermal environment and gas demand.

4.2. Error Analysis

The relative error between the predicted value and the actual value obtained by the MWP-DLP model is shown in Figure 9, and the comparison between some predicted values and the actual value is shown in Table 3. The analysis shows that, as can be seen from Figure 9 and Table 3, the absolute value of the maximum error between the predicted value and the actual value was 12 × 104 m3, and the corresponding serial number was 7 (the first red dot in the figure), which appeared on 23 November of the first year. The reason may be that the temperature decreased on 23 November, the solar radiation value decreased, and the user felt cold and began to use gas heating, resulting in a sudden increase in the daily gas load. However, in the algorithm, the response to the sudden load change was slow, which resulted in a large difference between the model prediction and the actual value. The maximum relative error of the predicted result was −9%, corresponding to the serial number 59 (the second red dot in the figure), which appeared on 27 February of the following year. The reason may be that the temperature suddenly increased on 27 February, the solar radiation increased, the residents felt that the temperature was suitable, and the gas consumption was reduced, resulting in a rapid decline in the daily gas load. On 24th, the daily gas load decreased by 147 × 104 m3 compared with 27th, and the genetic algorithm could not quickly find the optimal solution when solving the model, resulting in increased error.

4.3. Case Verification

In order to verify the validity of the established MWP-DLP model, 70 groups of data from November 15 of the second year to March 15 of the third year (excluding weekends and holidays) were selected for verification, and the prediction results were analyzed. The known basic parameters included the average temperature for 70 days; wind value for 70 days; and 70 days of solar radiation.
Partial data of 70 days are shown in Table 4. The average temperature of 70 groups of data, the average temperature of the previous day, the solar radiation value, and the wind value were, respectively, brought into Equation (7), and the predicted value of the daily gas load of 70 groups could be obtained.
The comparison between the predicted value of daily gas load obtained by MWP-DLP model and the actual value is shown in Figure 10. The analysis shows that, as can be seen from Figure 10, the overall change trend between the predicted daily gas load value obtained by MWP-DLP model and the actual value was basically consistent, which was consistent with the actual value. When the temperature fluctuation was large, the difference between the predicted value and the actual value was not large, and the prediction effect of the model was good, indicating that the established MWP-DLP model is effective, feasible, and has certain practicality.

4.4. Comprehensive Evaluation of Prediction Performance

As can be seen from Figure 11 and Table 4, the maximum error between the predicted value and the actual value was 12 × 104 m3, and the corresponding serial number was 37 (the first red dot in the figure), which appeared on January 8 of the third year. The reason may be that the temperature decreased gradually in the previous days, and the user’s perceived comfort decreased due to the cumulative effect of temperature, leading to a sudden increase in the daily gas load on January 8. The MWP-DLP model was slow to predict the abrupt load point, which resulted in a large error between the predicted value and the actual value. The maximum relative error between the predicted result and the actual value was −8.2%, and the mean absolute percentage error (MAPE) was 2.68%. The corresponding serial number was 67 (the second red dot in the figure), which appeared on March 12 of the third year. The reason may be that the temperature on March 12 was 7.5 °C higher than that on March 9, and the solar radiation value was 443 J/cm2 higher, which led to the reduction of the daily gas load on March 12, and the model was slow to respond to the sudden change of data. As a result, the predicted results of the model differed greatly from the actual values.
In conclusion, the MWP-DLP model established in this section can predict the gas load in a certain time in the future, and the error was controlled below 9%, so the model has good feasibility and high effectiveness.

5. Conclusions

This paper describes the basic concept of MWP and analyzes the indicators of MWP. On this basis, a daily gas load prediction model based on MWP-DLP was established. The gas data of a city (daily gas load, average temperature, solar radiation value, wind value) were selected as the research object. The MWP-DLP model was solved, and the results and errors were analyzed to verify the accuracy of the model. Finally, the predictive performance of the model was analyzed. The main conclusions are as follows:
(1)
In the research of daily gas load prediction, the influence of the dynamic change of building foundation temperature on daily gas load should be fully considered, which becomes the key breakthrough point to improve the prediction accuracy. Through in-depth analysis of the internal relationship between temperature fluctuation and gas consumption, the coefficients of key environmental factors, such as cumulative temperature, solar radiation, and wind power, were carefully corrected, and the MWP-DLP model was successfully constructed.
(2)
In order to obtain the optimal solution of MWP-DLP model, the genetic algorithm was used for deep optimization. The genetic algorithm, with its powerful global search ability, is constantly iteratively optimized in complex solution space. The MWP-DLP model was successfully solved after 1100 carefully set iterations. In order to verify the reliability of the model, city data with typical climate characteristics and energy consumption patterns were selected as control samples. The city’s geographical environment, climatic conditions, and urban energy consumption characteristics made it an ideal case to test the performance of the model.
(3)
By analyzing the data of a city in detail, the daily gas load predicted by the MWP-DLP model was compared with the actual value. The results show that the variation trends of the two were basically consistent, which fully indicates that the strategy of considering variable building base temperature and modifying cumulative temperature, solar radiation, and wind coefficient can significantly improve the prediction accuracy of daily gas load. In the error analysis, the maximum error value of the model was 12 × 104 m3, the maximum relative error was −8.2%, and the mean absolute percentage error (MAPE) was 2.68%. Such a low error range strongly proves that the established MWP-DLP model not only has good feasibility and can run effectively in practical applications but also has high effectiveness and can provide a reliable decision-making basis for gas supply management.
(4)
The prediction model constructed in this study not only realizes the high-precision prediction of short-term gas load but also provides technical support for the adjustment of energy structure. The quantitative analysis of the dynamic relationship between meteorological factors and load can optimize the cooperative scheduling of natural gas and renewable energy and promote the cross-season storage and efficient utilization of intermittent energy, such as wind power and photovoltaic. In view of the increase in baseline load caused by urban population growth, the model can include slow-changing variables such as population and industry in the future to provide cross-time scale support for gas infrastructure planning and alleviate the contradiction between supply and demand of limited resources. In the long run, the model’s accurate capture of extreme weather load mutations also lays a foundation for the assessment of peak load balancing capacity of alternative energy sources, such as hydrogen energy, and promotes the transformation of the energy system to a diversified and sustainable one.
(5)
Although this study improves the prediction accuracy by combining weather variables and genetic algorithm, there are still limitations in the characterization of complex load models by linear models. In the future, nonlinear models such as gradient lift tree and long and short-term memory network can be explored to build a multi-modal fusion forecasting framework combining non-weather variables such as residents’ gas consumption habits, the industrial production index, and natural gas price fluctuations.
(6)
The current model is designed for single urban climate characteristics and building energy consumption characteristics, and its core parameters have strong regional dependence. Future studies can focus on the adaptability verification of cross-regional climate zones and combine the differences of building types and energy structures in different cities to build dynamic parameter calibration models based on spatial and temporal differentiation (Supplementary Materials).

Supplementary Materials

The following supporting information can be downloaded at: https://www.mdpi.com/article/10.3390/a18060347/s1, Table S1: 71 sets of basic data of Wuhan City; Table S2. 70 sets of basic data of Wuhan City; Table S3. Table of MWP-DLP model results of 71 groups of Training samples; Table S4. Table of solution results of MWP-DLP models for 70 groups of control.

Author Contributions

Methodology, F.W.; Validation, X.C.; Formal analysis, F.W. and T.X.; Investigation, F.W., L.X. and G.C.; Data curation, T.X.; Writing—original draft, X.C. and L.X.; Visualization, M.W.; Supervision, M.W., L.C. and J.Z.; Project administration, J.Z.; Funding acquisition, L.X. All authors have read and agreed to the published version of the manuscript.

Funding

This research was funded by the National Natural Science Foundation of China, grant number 51704253 and 52474084.

Data Availability Statement

All data, models, and code generated or used during the study appear in the submitted article.

Acknowledgments

The authors are grateful to all study participants.

Conflicts of Interest

Author Xi Chen, Feng Wang, Li Xu, Taiwu Xia, Minhao Wang, and Gangping Chen was employed by the company PetroChina Southwest Oil and Gas Field Company. The remaining authors declare that the research was conducted in the absence of any commercial or financial relationships that could be construed as a potential conflict of interest.

References

  1. Li, F.; Zheng, H.; Li, X.; Yang, F. Day-ahead city natural gas load forecasting based on decomposition-fusion technique and diversified ensemble learning model. Appl. Energy 2021, 303, 117623. [Google Scholar] [CrossRef]
  2. Peng, J.; Zhou, J.; Liang, G.; Li, C.; Qin, C. Multi-period integrated scheduling optimization of complex natural gas pipeline network system with underground gas storage to ensure economic and environmental benefits. Energy 2024, 302, 131837. [Google Scholar] [CrossRef]
  3. Wen, K.; Qiao, D.; Nie, C.; Lu, Y.; Wen, F.; Zhang, J.; Miao, Q.; Gong, J.; Li, C.; Hong, B. Multi-period supply and demand balance of large-scale and complex natural gas pipeline network: Economy and environment. Energy 2023, 264, 126104. [Google Scholar] [CrossRef]
  4. China Natural Gas Development Report; Petroleum Industry Press: Beijing, China, 2020.
  5. Distributed Energy Research Report; China Energy Network Research Center: Beijing, China, 2020.
  6. China Natural Gas Development Report; National Energy Administration: Beijing, China, 2024.
  7. China City Gas Development Report; National Energy Administration: Beijing, China, 2024.
  8. Peng, S.; Chen, R.; Yu, B.; Xiang, M.; Lin, X.; Liu, E. Daily natural gas load forecasting based on the combination of long short term memory, local mean decomposition, and wavelet threshold denoising algorithm. J. Nat. Gas Sci. Eng. 2021, 95, 104175. [Google Scholar] [CrossRef]
  9. Ma, D.; Wu, R.; Li, Z.; Cen, K.; Gao, J.; Zhang, Z. A new method to forecast multi-time scale load of natural gas based on augmentation data-machine learning model. Chin. J. Chem. Eng. 2022, 48, 166–175. [Google Scholar] [CrossRef]
  10. Zhou, C. The Voltage and Reactive Power Load Forecasting Control Based on Cluster Analysis and Fuzzy RBF Neural Network. Master’s Thesis, School of Electrical Engineering and Automation, Tianjin University, Tianjin, China, 2007. [Google Scholar]
  11. Wei, N.; Li, C.; Duan, J.; Liu, J.; Zeng, F. Daily natural gas load forecasting based on a hybrid deep learning model. Energies 2019, 12, 218. [Google Scholar] [CrossRef]
  12. Peng, J.; Bu, H.; Chen, H.; Lang, X.; Ma, J.; Zheng, F. National climate trend outlook from summer 2016 to spring 2017. Proc. Chin. Acad. Sci. 2016, 31, 830–834. [Google Scholar]
  13. Guo, L. Research and Development of LSTM Urban Gas Load Forecasting Technology. Master’s Thesis, Xi’an Shiyou University, Xi’an, China, 2020. [Google Scholar]
  14. Qian, H.; Yu, H.; Fan, G. A gas consumption prediction method based on incremental random forest regression algorithm. J. East China Univ. Sci. Technol. 2019, 45, 133–139. [Google Scholar]
  15. Zeng, B.; Meng, W.; Tong, M. A self-adaptive intelligence greypredictive model with alterable structure and its application. Eng. Appl. Artif. Intell. 2016, 50, 236–244. [Google Scholar] [CrossRef]
  16. Akkurt, M.; Demirel, O.F.; Zaim, S. Forecasting Turkey’s natural gas consumption by using time series methods. Eur. J. Econ. Political Stud. 2010, 3, 1–21. [Google Scholar]
  17. Akpinar, M.; Yumusak, N. Year ahead demand forecast of city natural gas using seasonal time series methods. Energies 2016, 9, 727. [Google Scholar] [CrossRef]
  18. Herbert, J.H.; Sitzer, S.; Eades-Pryor, Y. A statistical evaluation of aggregate monthly industrial demand for natural gas in the USA. Energy 1987, 12, 1233–1238. [Google Scholar] [CrossRef]
  19. Erdogdu, E. Natural gas demand in Turkey. Apply. Energy 2010, 87, 211–219. [Google Scholar]
  20. Melikoglu, M. Vision 2023: Forecasting Turkey’s natural gas demand between 2013 and 2030. Renew. Sustain. Energy Rev. 2013, 22, 393–400. [Google Scholar] [CrossRef]
  21. Zeng, B.; Li, C. Forecasting the natural gas demand in china using a self-adapting intelligent grey model. Energy 2016, 112, 810–825. [Google Scholar] [CrossRef]
  22. Ma, X.; Xie, M.; Wu, W.Q.; Zeng, B.; Wang, Y.; Wu, X.X. The novel fractional discrete multivariate grey system model and its applications. Appl. Math. Model. 2019, 70, 402–424. [Google Scholar] [CrossRef]
  23. Jiao, W.; Zhan, C.; Lian, L.; Yan, M. Research on short-term load forecasting of city gas. Gas Heat 2001, 6, 483–487. [Google Scholar]
  24. Jiao, W.; Lian, L.; Cui, J.; Yan, M. A time series model for short-term cycle load forecasting of city gas. Nat. Gas Ind. 2002, 1, 92–94. [Google Scholar]
  25. Jiao, W.; Zhao, L.; Qim, Y. Research on periodicity of hourly gas load for city gas. Gas Heat 2003, 9, 515–518. [Google Scholar]
  26. Hong, T.; Wang, P. Fuzzy interaction regression for short term load forecasting. Fuzzy Optim. Decis. Mak. 2014, 13, 91–103. [Google Scholar] [CrossRef]
  27. Hasan, H.C.; Mehmet, C. Short-term load forecasting using fuzzy logic and ANFIS. Neural Comput. Appl. 2015, 26, 1355–1367. [Google Scholar]
  28. Aly, H.H.H. A proposed intelligent short-term load forecasting hybrid models of ANN, WNN and KF based on clustering techniques for smart grid. Electr. Power Syst. Res. 2020, 182, 106191. [Google Scholar] [CrossRef]
  29. Kumar, U.; Jain, V.K. Time series models (Grey-Markov, Grey Model with rolling mechanism and singular spectrum analysis) to forecast energy consumption in India. Energy 2010, 35, 1709–1716. [Google Scholar] [CrossRef]
  30. Zhu, L.; Li, M.S.; Wu, Q.H.; Jiang, L. Short-term natural gas demand prediction based on support vector regression with false neighbours filtered. Energy 2015, 80, 428–436. [Google Scholar] [CrossRef]
  31. Khan, G.M.; Zafari, F. Dynamic feedback neuro-evolutionary networks for forecasting the highly fluctuating electrical loads. Genet. Program. Evolvable Mach. 2016, 17, 391–408. [Google Scholar] [CrossRef]
  32. Lu, H.F.; Azimi, M.; Iseley, T. Short-term load forecasting of urban gas using a hybrid model based on improved fruit fly optimization algorithm and support vector machine. Energy Rep. 2019, 11, 666–667. [Google Scholar] [CrossRef]
  33. Lin, B.Q.; Wang, T. Forecasting natural gas supply in China: Production peak and import trends. Energy Policy 2012, 49, 225–233. [Google Scholar] [CrossRef]
  34. Peng, S. Methods of city gas load forecasting and their analysis. J.-Chongqing Jian Zhu Univ. 2005, 27, 137. [Google Scholar]
  35. Xu, P.; Song, Y.; Du, J.; Zhang, F. Town gas daily load forecasting based on machine learning combinatorial algorithms: A case study in North China. Chin. J. Chem. Eng. 2024, 75, 239–252. [Google Scholar] [CrossRef]
  36. Ni, X.; Yang, D.; Qin, J.; Wang, X. A multivariate natural gas load forecasting method based on residual recurrent neural network. Electron. Lett. 2023, 59, e12927. [Google Scholar] [CrossRef]
  37. Gu, T.; Luo, Y.; Zhang, Q.; Zhu, Z. Research on gas load forecasting of Hangzhou based on meteorological factors. J. Meteorol. Environ. 2017, 33, 107–112. [Google Scholar]
  38. He, C.; Duan, Y.; Wu, Z.; Yang, G. A short-term forecasting model of city gas daily load based on air temperature. Nat. Gas Ind. 2013, 33, 131–134. [Google Scholar]
  39. Farfar, K.E.; Khadir, M.T. A two-stage short-term load forecasting approach using temperature daily profiles estimation. Neural Comput. Appl. 2019, 31, 3909–3919. [Google Scholar] [CrossRef]
  40. Li, Q.; Wu, Y. Forecast on daily gas load based on accumulative effect of temperature in winter: A case study of Xi’an. Oil Gas Storage Transp. 2016, 35, 1014–1017. [Google Scholar]
  41. Hu, X. Urban Gas Long-Term Load Forecasting Based on Competitiveness Evaluation. Master’s Thesis, Beijing University of Architecture, Beijing, China, 2018. [Google Scholar]
  42. Wang, G. Consumption law and load forecast of city natural gas. Gas Heat 2004, 24, 391–394. [Google Scholar]
  43. Ramon, D.; Allacker, K.; De Troyer, F.; Wouters, H.; Lipzig, N. Future heating and cooling degree days for Belgium under a high-end climate change scenario. Energy Build. 2020, 216, 109935. [Google Scholar] [CrossRef]
  44. Harvey, L.D.D. Using modified multiple heating-degree-day (HDD) and cooling-degree-day (CDD) indices to estimate building heating and cooling loads. Energy Build. 2020, 229, 110475. [Google Scholar] [CrossRef]
  45. National Grid. Gas Demand Forecasting Methodology. 2012. Available online: https://www.nationalgas.com/sites/default/files/documents/Gas%20Demand%20Forecasting%20Methodology%202020_v1.pdf (accessed on 30 May 2025).
Figure 1. Gas daily load and average temperature curve.
Algorithms 18 00347 g001
Figure 2. Gas daily load and solar radiation curve.
Algorithms 18 00347 g002
Figure 3. Comparison of daily gas load curves of the National Day and 5 days before and after three consecutive years.
Algorithms 18 00347 g003
Figure 4. Daily gas load curve of the spring festival and before and after 5 days.
Algorithms 18 00347 g004
Figure 5. Comparison of different iterative prediction values.
Algorithms 18 00347 g005
Figure 6. Curve of the predicted and actual values with the average temperature after 1000 iterations.
Algorithms 18 00347 g006
Figure 7. Predicted value and actual value change curve with Di.
Algorithms 18 00347 g007
Figure 8. Di–daily gas load linear relationship diagram.
Algorithms 18 00347 g008
Figure 9. STD–daily gas load linear relationship diagram.
Algorithms 18 00347 g009
Figure 10. Curves of the predicted and actual values versus the average temperature.
Algorithms 18 00347 g010
Figure 11. Relative error between the predicted and actual values.
Algorithms 18 00347 g011
Table 1. Basic data of Wuhan.
NumberDateDaily Load
(104 m3)
Average Temperature (°C)Average Temperature of the Previous Day
(°C)
Cumulative Temperature
(°C)
Wind
(Section)
Solar Radiation
(J/cm2)
1First year-11-2131011.99.510.70.21664
2First year-11-222453.815.89.813869
3First year-11-23425−0.63.81.613308
4First year-11-244431−0.60.24.9309
5First year-11-253745130.2581
6Second year-02-242127.26.36.750.2664
7Second year -02-276510.89.610.20.21356
8Second year-02-286411.110.8114.91414
9Second year-03-017412.211.111.718.31672
Table 2. Calculation results of decision variable coefficient of the STD model.
Coefficient a 0 a 1 β 1 β 2 φ 1 T B , l w r T B , u p r Variance Sum
10069.119.20.1000.0950.32009.4918.467167
50094.922.60.0100.0100.191412.6019.756168
70099.623.30.0410.0020.16414.9219.985632
100079.620.60.0320.0320.191412.8318.995381
110079.620.60.0320.0320.191412.8318.995381
Table 3. Error table of partial predicted and actual values.
NumberDateActual Value (104 m3)Predicted Value (104 m3)Average Temperature (°C)Solar Radiation
(J/cm2)
Difference Value (104 m3)Relative Error (%)
5First year-11-2131030011.91664100.03
6First year-11-222452353.8869100.04
7First year-11-23425437−0.630812−0.03
8First year-11-24443440130930.01
9First year-11-253743795581−5−0.01
58Second year-02-242122207.2664−8−0.04
59Second year -02-27657110.81356−6−0.09
60Second year -02-28646911.11414−5−0.08
61Second year -03-01747812.21672−4−0.05
Table 4. Basic data of a city.
NumberDateDaily Load
(104 m3)
Average Temperature
(°C)
Average Temperature of the Previous day
(°C)
Cumulative Temperature
(°C)
Wind (Section)Solar Radiation (J/cm2)
33Second year-12-292908.48.78.550.2680
34Third year-01-033013.37.25.2513592
35Third year-01-04321−0.13.31.60.2265
36Third year-01-05330−0.7−0.1−0.40.2274
37Third year-01-08421−0.4−0.70.213264
65Third year-03-082485.85.65.70.21299
66Third year-03-092486.75.86.254.91415
67Third year-03-1213414.213.8144.91858
Disclaimer/Publisher’s Note: The statements, opinions and data contained in all publications are solely those of the individual author(s) and contributor(s) and not of MDPI and/or the editor(s). MDPI and/or the editor(s) disclaim responsibility for any injury to people or property resulting from any ideas, methods, instructions or products referred to in the content.

