1. Introduction
Rapid developments in smart agriculture are redefining how modern farming addresses the challenges of resource optimization and sustainability [
1,
2]. With the growing global demand for food, precision agriculture has become visible as a key solution, leveraging advanced technologies to improve productivity and efficiency [
3,
4]. Imagery data analysis is essential in this domain, as it allows one to perform activities such as weed identification, disease detection, and fruit quality evaluation [
5,
6]. Imagery data are also used to address agricultural challenges of land use and land cover change [
7]. These analytical capabilities give farmers detailed information that helps them make informed decisions. This can help in improving crop yields and economic outcomes [
8].
Smart agriculture now relies heavily on machine learning (ML), which provides strong capabilities for the processing of vast amounts of complex agricultural data [
2]. Deep learning models have shown impressive effectiveness in processing visual data, identifying patterns, and producing classification results that are quite precise [
9]. These advances enable diverse applications, from pest and disease detection [
10] to resource management [
11]. Although ML models have great potential, their performance is highly dependent on the quality of input features, particularly when working with high-dimensional imagery datasets.
For machine learning implementations, feature selection is an essential step that provides the most relevant and important characteristics from data that can used for model training [
12]. It improves the robustness and efficiency of classification models by reducing the overfitting risk and decreasing computational complexity [
13]. Feature selection is essential for producing consistent and comprehensible findings in agricultural applications, as datasets frequently show diversity in class distributions and resolution.
By presenting a unique hybrid feature selection algorithm, the Hybrid Predator Algorithm for Classification (HPA-C), and a customized Convolutional Neural Network (CNN), this study addresses the issues of smart agricultural classification. HPA-C combines a basic framework with position update equations modeled after a variety of natural activities, including cooperative hunting, foraging, and echolocation, integrating different optimization strategies.This special hybridization allows for better feature selection by improving the algorithm’s exploration and exploitation capabilities. By applying these techniques to smart agricultural datasets (dataset details in
Section 3.1), the study demonstrates significant improvements in classification accuracy within the 98.6% to 99.8% range. The outcomes directly benefit farmers by providing actionable insights for sustainable and efficient farming practices.
The primary contributions of this work are described as follows:
A hybrid algorithm named HPA-C, combining GWO, ABC, and BAT, is presented to provide important features.
A custom CNN architecture is developed for classification tasks in agricultural imagery datasets.
The proposed methods are empirically validated and demonstrate superior performance compared to benchmark approaches.
The remainder of this paper is organized as follows: Background and related work are covered in
Section 2.
Section 3 details the datasets and algorithms used in this study. The proposed framework is described in
Section 4. Simulation results and statistical analyses are provided in
Section 5, and the paper concludes with insights and future directions in
Section 6.
2. Related Work
Smart agriculture has undergone some remarkable developments in recent years, driven by the integration of machine learning (ML) and deep learning (DL). A summary of some of the latest work is presented in
Table 1. These technologies are being used to address critical challenges such as disease detection, crop classification, and fruit recognition, with a strong emphasis on improving accuracy and operational efficiency. The authors of [
14] conducted a comparative study of seven ML techniques. The main objective was to detect diseases in economically important crops such as apples, grapes, maize, bell peppers, and tomatoes. Their work showed the superiority of Random Forest (RF), with an accuracy of 91.80%. A similar type of the work was carried out in [
15] but with soybean. The authors performed soybean leaf disease classification with a combination of SWIN transformers and CNNs, achieving impressive accuracies ranging from 76% to 98% in multiple datasets, including PlantVillage and Embrapa. These studies demonstrate how well transformer-based models and ensemble approaches handle the complexities of agricultural data.
In smart agriculture, fruit and crop classification has also gained the attention of researchers and farmers. The authors of [
16] investigated the impact of transfer learning on fruit detection. They used the Fruits-360 dataset and achieved accuracies ranging from 65% to 99%. The ML models used in their research work were VGG16, ResNet50, and EfficientNet-B0. The authors of [
17,
18] used CNNs to classify fruit images. Their classification accuracies were 98.17% and 97.15%, respectively. Their research work shows the significance of machine learning methods for fruit classification. The detection of crop leaf disease has also received significant attention, with studies such as [
19,
20] suggesting the use a hybrid formed by merging Artificial Bee Colony (ABC) and Gray Wolf Optimization (GWO). The authors enhanced the feature selection process and improved classification accuracies. Their implementations achieved the classification accuracies of 98.53% and 95.69%, respectively. Their works highlight the potential of these hybrid algorithms in improving agricultural disease detection. Similarly, the research work carried out by Ravichandran et al. [
21], merged Random Forest Optimization (RFO) with SVM and achieved an accuracy of 97.70% for leaf disease classification. Weed classification was performed by Ajayi and Ashi [
22] using a Region-Based CNN (RCNN), achieving a classification accuracy of 99.40%. This study emphasizes the importance of object detection methods in precision agriculture, especially when it comes to differentiating weeds from crops.
Feature selection methods have become a key part of improving the performance of ML models. These methods help to increase model performance by reducing data dimensionality and removing unnecessary features. The research work carried out by the authors of [
23] introduced a hybrid approach to intrusion detection by merging the Crow Search Algorithm and the Flower Pollination Algorithm. Their work resulted in the achievement of accuracies of 99.14% and 97.98% with AdaBoost. Another work carried out in [
24] developed a hybrid of the Grasshopper Optimization Algorithm (GOA) and the Genetic Algorithm (GA) for the detection of cloud intrusion. The authors achieved classification accuracies of 98%, 99%, and 92% using different datasets. These studies show the role of hybrid optimization methods in the selection of features for security applications. At the same time, nature-inspired feature selection algorithms have gained popularity in diverse fields. An interesting work presented in [
25] classified emotions. The authors utilized Gray Wolf Optimization (GWO) for EEG signal-based emotion classification and achieved accuracies of 89.63% and 84.54% with XGBoost. Leukemia classification was carried out in [
26]. The authors employed entropy-controlled firefly feature selection and achieved classification accuracy above 96% with a multi-class SVM. These diverse cases highlight the adaptability of nature-inspired algorithms, expanding their use beyond agriculture to include healthcare and other domains.
Hybrid optimization techniques are increasingly being adopted to improve accuracy for classification and disease detection.The authors of [
20,
27] used hybrid optimization methods such as Coyote–Gray Wolf optimization and GWO for the detection of mango and grape leaf disease. They achieved accuracies of 96.71% and 95.69%, respectively. The integration of feature selection techniques with advanced ML models has proven instrumental in achieving high accuracy across various tasks, from disease detection to fruit classification.
In summary, the literature highlights notable advancements in feature selection algorithms and smart agriculture, which are powered by the application of state-of-the-art ML and DL methods. Researchers are increasingly using hybrid optimization strategies to solve challenging issues with remarkable accuracy and effectiveness. To improve these models’ interpretability and ease their application in actual agricultural systems, future research could investigate the use of explainable AI (XAI) methodologies. As the sector develops further, these developments have the potential to completely transform agriculture and associated fields, opening the door to more intelligent and sustainable solutions.
Table 1.
Summary of research on classification and detection techniques.
Table 1.
Summary of research on classification and detection techniques.
| Reference | Year | Research Idea | Datasets | Feature Selection | Implementation | Accuracy |
|---|
| [14] | 2025 | Disease detection in economically important Crops | PlantVillage (maize, apple, grapes, tomato, and bell pepper) | NA | 7 ML techniques (best results with RF) | 91.80% |
| [15] | 2025 | Classification of soybean leaf disease diagnosis | PlantVillage, AI2018, PlantDoc, and Embrapa | NA | SWIN transformer + CNN | 98.00%, 97.00%, 76.00%, and 92.00% |
| [16] | 2025 | Impact of transfer learning on fruit detection | Fruits-360 | NA | CNN with VGG16, ResNet50, MobileNet-V2, and EfficientNet-B0 | 65% to 99% |
| [23] | 2025 | Intrusion detection | UNSW-NB15 and CIC-IDS2017 datasets | Hybrid of crow search algorithm and flower pollination algorithm | AdaBoost | 99.14% and 97.98% |
| [25] | 2025 | EEG signal-based emotion classification | DEAP and MAHNOB-HCI | Gray Wolf Optimization | XGBoost | 89.63% and 84.54% |
| [26] | 2025 | Leukemia classification | ALLID_B1, ALLID_B2, C_NMC 2019, and ASH | Entropy-controlled firefly feature selection | Multi-class SVM | 99.64%, 98.96%, 96.67%, and 98.89% |
| [18] | 2024 | Fruit image classification | Fruits-360 | NA | CNN with EfficientNet-B0, MobileNetV2, and ResNet50V2 | 97.15% |
| [17] | 2024 | A CNN-based implementation of fruit recognition | Fruits-360 | NA | CNN | 98.17% |
| [28] | 2024 | UC MERCED land use dataset classification | UC MERCED LandUse | NA | VGG19, VGG16 | 95.07% and 91% |
| [27] | 2024 | Mango leaf disease classification using a hybrid-tuned neural network model | PlantVillage | Hybrid Coyote–Gray Wolf Optimization | NN model | 96.71% |
| [20] | 2024 | Grape leaf disease detection | PlantVillage (Leaf Blight, Black measles, Black rot, and healthy) | Gray Wolf Optimization | Ensemble classifier | 95.69% |
| [19] | 2024 | Plant leaf disease detection | PlantVillage | Hybrid ABC | HYgmABC | 98.53% |
| [21] | 2024 | Plant leaf detection framework | Plant leaf diseases (apple scab, apple black rot, apple cedar rust, and healthy apple) | RFO | SVM | 97.70% |
| [24] | 2024 | Cloud-IDS by NI-FS techniques | UNSW-NB15, CIC-DDoS2019, and CIC Bell DNS EXF 2021 | Hybrid of Grasshopper Optimization Algorithm (GOA) and Genetic Algorithm (GA) | Random Forest | 98%, 99%, and 92% |
| [29] | 2024 | COVID-19 detection using medical images | Custom dataset | Hybrid of cuckoo search optimization and learning-based optimization | XGBoost | 95.99% |
| [22] | 2023 | Weed classification | Weed Detection | NA | RCNN | 99.40% |
| [30] | 2022 | Plant leaf disease detection through CNN | Plant leaf diseases | NA | CNN | 98.41% |
3. Methods
3.1. Dataset Description
With a particular focus on smart agriculture, this study integrates nine different RGB image datasets from various fields. These datasets address a range of classification difficulties with differences in class count, image distribution, resolution, and scope. Class annotations are applied to all datasets, and the effects of class balance are not taken into consideration for the current study. The datasets are summarized in
Table 2.
The datasets illustrate the development of image categorization research from 2010 to 2024. The purpose of this work is to gain insights into smart agricultural issues by utilizing various labeled datasets, although some datasets are naturally balanced and others are imbalanced. Incorporating additional resources for broader insight while concentrating on datasets directly related to agriculture, this study highlights the potential of data-driven solutions to improve agricultural production and decision making.
Dataset Diversity and Generalization
The datasets utilized in this study were carefully selected to cover a broad spectrum of challenges in smart agriculture. This selection ensures a diverse and representative evaluation of the proposed HPA-C method.
In terms of dataset characteristics, our selection includes variations in resolution, image quality, class distributions, and environmental conditions. These make the evaluation more robust. The plant disease and weed detection datasets use field conditions with real-world variations in lighting, background, and plant health status. The fruit classification datasets further introduce controlled yet challenging classification tasks due to similarities between different fruit categories. The remote sensing datasets contribute large-scale imagery variations, demonstrating the applicability of the method beyond agricultural tasks.
The results indicate strong generalization across these diverse datasets, but we also acknowledge that additional validation on other agricultural datasets, such as multi-season imagery, hyperspectral data, or multi-modal datasets, could further strengthen the conclusions.
3.2. Hybrid Feature Selection
Feature selection is a process of identifying and preserving the important features from a dataset. It helps in enhancing model efficiency and predictive accuracy [
40]. This procedure enhances interpretability, lessens computational complexity, and mitigates overfitting. Models can more successfully generalize to new data by concentrating on important features and removing redundancy, which results in more reliable decision making [
41].
Nature-inspired optimization algorithms may traverse large search spaces while striking a balance between local exploitation and global exploration. They have shown considerable efficacy in solving feature selection problems. To find the best feature subsets, these algorithms use heuristic-based search methods that draw inspiration from biological, physical, or social events. Consider Genetic Algorithms (GAs) [
42], which simulate evolutionary selection. Particle Swarm Optimization (PSO) [
43] is focused on swarm intelligence and has been widely adopted for feature selection tasks. Gray Wolf Optimization (GWO) [
44] replicates the cooperative hunting strategy of wolves and has demonstrated strong performance in refining search efficiency. Artificial Bee Colony (ABC) [
45] focuses on the forging patterns of honeybees. The Bat Algorithm (BA) [
46] uses the echolocation behavior of bats for adaptive search. These methods are very beneficial for feature selection in cases where data have high dimensionality.
To improve search effectiveness, we can combine different nature-inspired algorithms to create a hybrid model. These hybrid approaches improve search effectiveness, solution quality, and convergence speed by utilizing the merits of the algorithms used for hybridization [
29]. Premature convergence can be avoided and classification performance can be improved by balancing diversification and intensification of the used approaches. The benefits of hybridization have been highlighted in some recent studies conducted in diverse application domains. Consider the example of spam classification. A hybrid bat algorithm with momentum acceleration and Gray Wolf Optimization (GWO) was used to improve spam classification performance [
47]. Similarly, a modified bat algorithm was designed to address real-world optimization issues, leading to improved robustness [
48]. Another hybrid framework was introduced for telecommunication applications. It introduces the merger of Ant Colony Optimization (ACO) and Artificial Bee Colony (ABC) for optimization of resource allocation in cognitive radio networks. The setup ensured superior management of communication resources [
49].
The impact of the hybrids can be observed in other diverse domains like navigation, improving energy efficiency and increasing productivity. The RFO-GWO hybrid was used for path planning in autonomous robots. The sole purpose was to improve navigation efficiency [
50]. For high energy efficiency, a GWO-enhanced PSO hybrid was implemented for photovoltaic system optimization [
51]. Another GA-GWO hybrid was designed to optimize scheduling in coal mines. The purpose was to increase the operational productivity of coal mines [
52]. These accomplishments highlight the use of hybrid approaches in feature selection in cases where dealing with high-dimensional datasets might be difficult.
These developments motivated us to present a new hybrid approach that combines the Bat Algorithm (BA), Artificial Bee Colony (ABC), and Gray Wolf Optimization (GWO) for feature selection in the smart agricultural application domain. The approach suggested in this work combines the ABC’s adaptive foraging mechanism, the BA’s dynamic search capability, and the leadership-based exploration and exploitation capabilities of GWO.
3.3. Benchmark Feature Selection Techniques
In order to assess the proposed method’s efficacy, the performance of the suggested HPA-C algorithm is compared with some prominent established optimization frameworks. We used RelieFF [
53], Particle Swarm Optimization (PSO), the Genetic Algorithm (GA), and Gray Wolf Optimization (GWO) for this study because to their efficacy in feature selection and optimization.
These benchmark approaches were chosen because of their complimentary feature selection strengths. PSO and GWO maintain a balance between local and global search, whereas RelieFF provides a quick baseline for assessing feature relevance. GA introduces adaptive evolutionary mechanisms that enhance search efficiency in complex optimization tasks. By comparing HPA-C against these techniques, its advantages can be effectively demonstrated.
While a formal ablation study is not included, we acknowledge the potential ambiguity in isolating the exact contribution of each component within HPA-C. However, as discussed in this section, the hybridization of GWO, ABC, and BAT is carefully designed to enhance the balance between exploration and exploitation. The prime reason for doing this is to prevent premature convergence. The statistical analysis across multiple datasets also demonstrates the overall effectiveness of HPA-C. The analysis indirectly validates the impact of each component. This logic underpins our design choice and supports the robustness of the proposed approach.
3.4. Working with CNNs
CNNs are good at extracting hierarchical features, representing a class of deep learning models that are widely utilized for image and video analysis and classification. They enable automated feature learning through back propagation. They can process temporal and spatial relationships using learnable filters. A typical CNN is a deep neural network with several layers, each of which has a specific purpose.
Convolutional Layers: These layers use convolution operations with trainable filters to extract spatial characteristics. As they pass over the input, the filters pick up patterns like edges and textures. The convolution operation is mathematically expressed as follows:
where
: input feature map
: output feature map
: convolutional filter
: bias term
: spatial indices
: index of input channel
: index of output channel
: filter dimensions
Normalization and Activation Layers: After convolution, batch normalization is applied to stabilize training and accelerate convergence. The transformation is defined as follows:
where
, : batch mean and variance, respectively
, : trainable scale and shift parameters
: small constant for numerical stability
, : input and output activations
To enhance learning capacities, the Rectified Linear Unit (ReLU) activation function adds non-linearity:
where
Pooling layers and Dropout Layers: In order to minimize computational complexity while maintaining essential properties, pooling layers carry out spatial downsampling. This is how the max-pooling operation is defined:
where
Dropout is used to reduce overfitting and improve model generalization by randomly deactivating neurons. The dropout operation is expressed as follows:
where:
Fully Connected and Output Layers: Decision-making methods incorporate high-level feature representations through the fully connected layers. These layers produce classification outputs by transforming the retrieved feature maps using weighted transformations. Regression tasks mostly use a linear function in the final output layer, while multi-class classification mostly uses a softmax activation function.
3.5. Performance Evaluation
In multi-class classification, accuracy, macro precision, macro recall, and the macro F1 score are key evaluation metrics.
The
accuracy of the model is computed as the ratio of correctly predicted instances to the total number of instances:
where
: true label for the i-th instance
: predicted label for the i-th instance
: cardinality (number of elements in the set).
Macro precision () is the average of class-wise precision values.
The macro precision (
) is computed as the arithmetic mean of precision values for all classes:
where
: true label for the j-th instance
: predicted label for the j-th instance
N: total number of classes
: cardinality (number of elements in the set).
Macro recall () is computed similarly.
The macro recall (
) is computed as the arithmetic mean of recall values for all classes:
where
: true label for the j-th instance
: predicted label for the j-th instance
N: total number of classes
: Cardinality (number of elements in the set).
The
macro F1 score is then calculated as the harmonic mean of macro precision and macro recall:
Since this research focuses on diverse multi-class datasets, the macro precision, recall, and F1 score provide a more balanced evaluation than accuracy or micro metrics.
By using macro metrics, a fair comparison across all classes is ensured, making the hybrid feature selection method (HPA-C) more interpretable and applicable to smart agriculture applications, where minority-class performance is crucial for reliable decision making.
4. Framework
4.1. HPA-C Framework
The process begins by initializing a random population of wolves according to Equation (
10):
The initial population goes through a fitness evaluation test. Equation (
11) presents the fitness test in terms of classification accuracy:
Following the fitness evaluation, the solutions are sorted based on
in descending order, where
is termed the best,
the second most appropriate, and
is the least appropriate. They are then subjected to an iterative position update and fitness evaluation process. The technique uses the main optimization loop and computes three new position variables:
and
.
uses the main GWO position calculation mechanism,
uses the ABC mechanism, and
follows the BAT procedure, as expressed by Equation (
12).
where
: variable updated using the Gray Wolf Optimization (GWO) update equation
: variable updated using the Artificial Bee Colony (ABC) update equation
: variable updated using the bat update equation (BAT)
: position of the alpha wolf in dimension j
: position of the beta wolf in dimension j
: position of the delta wolf in dimension j
, : random coefficients for GWO
: Random coefficient specific to ABC
: Random coefficient specific to BAT.
For exploitation, a single position variable (
P) is computed by taking the maximum of the three update mechanisms:
The motivation behind choosing the maximum function is that it retains the most significant feature importance score among three incorporated mechanisms in HPA-C (Algorithms 1–3). This ensures that highly discriminative features emphasized by at least one technique are not suppressed. Unlike averaging, which can dilute strong feature contributions, taking the minimum may underestimate feature significance. The maximum function ensures that the best-ranked features from any algorithm are preserved. This enhances the robustness of the selected feature subset and improves classification accuracy.
The wolves’ positions are bounded using Equation (
14), and binary quantization (thresholding at 0.5) is applied as expressed by Equation (
15):
The choice of 0.5 as a threshold ensures a balanced decision boundary. The feature selection scores are normalized between 0 and 1. Our choice makes retention and discarding equally probable. This approach aligns with widely adopted binary discretization techniques in metaheuristic-based feature selection to ensure methodological consistency. Other threshold choices (0.4 and 0.6) showed no significant performance gains, with 0.5 providing stable results across datasets.
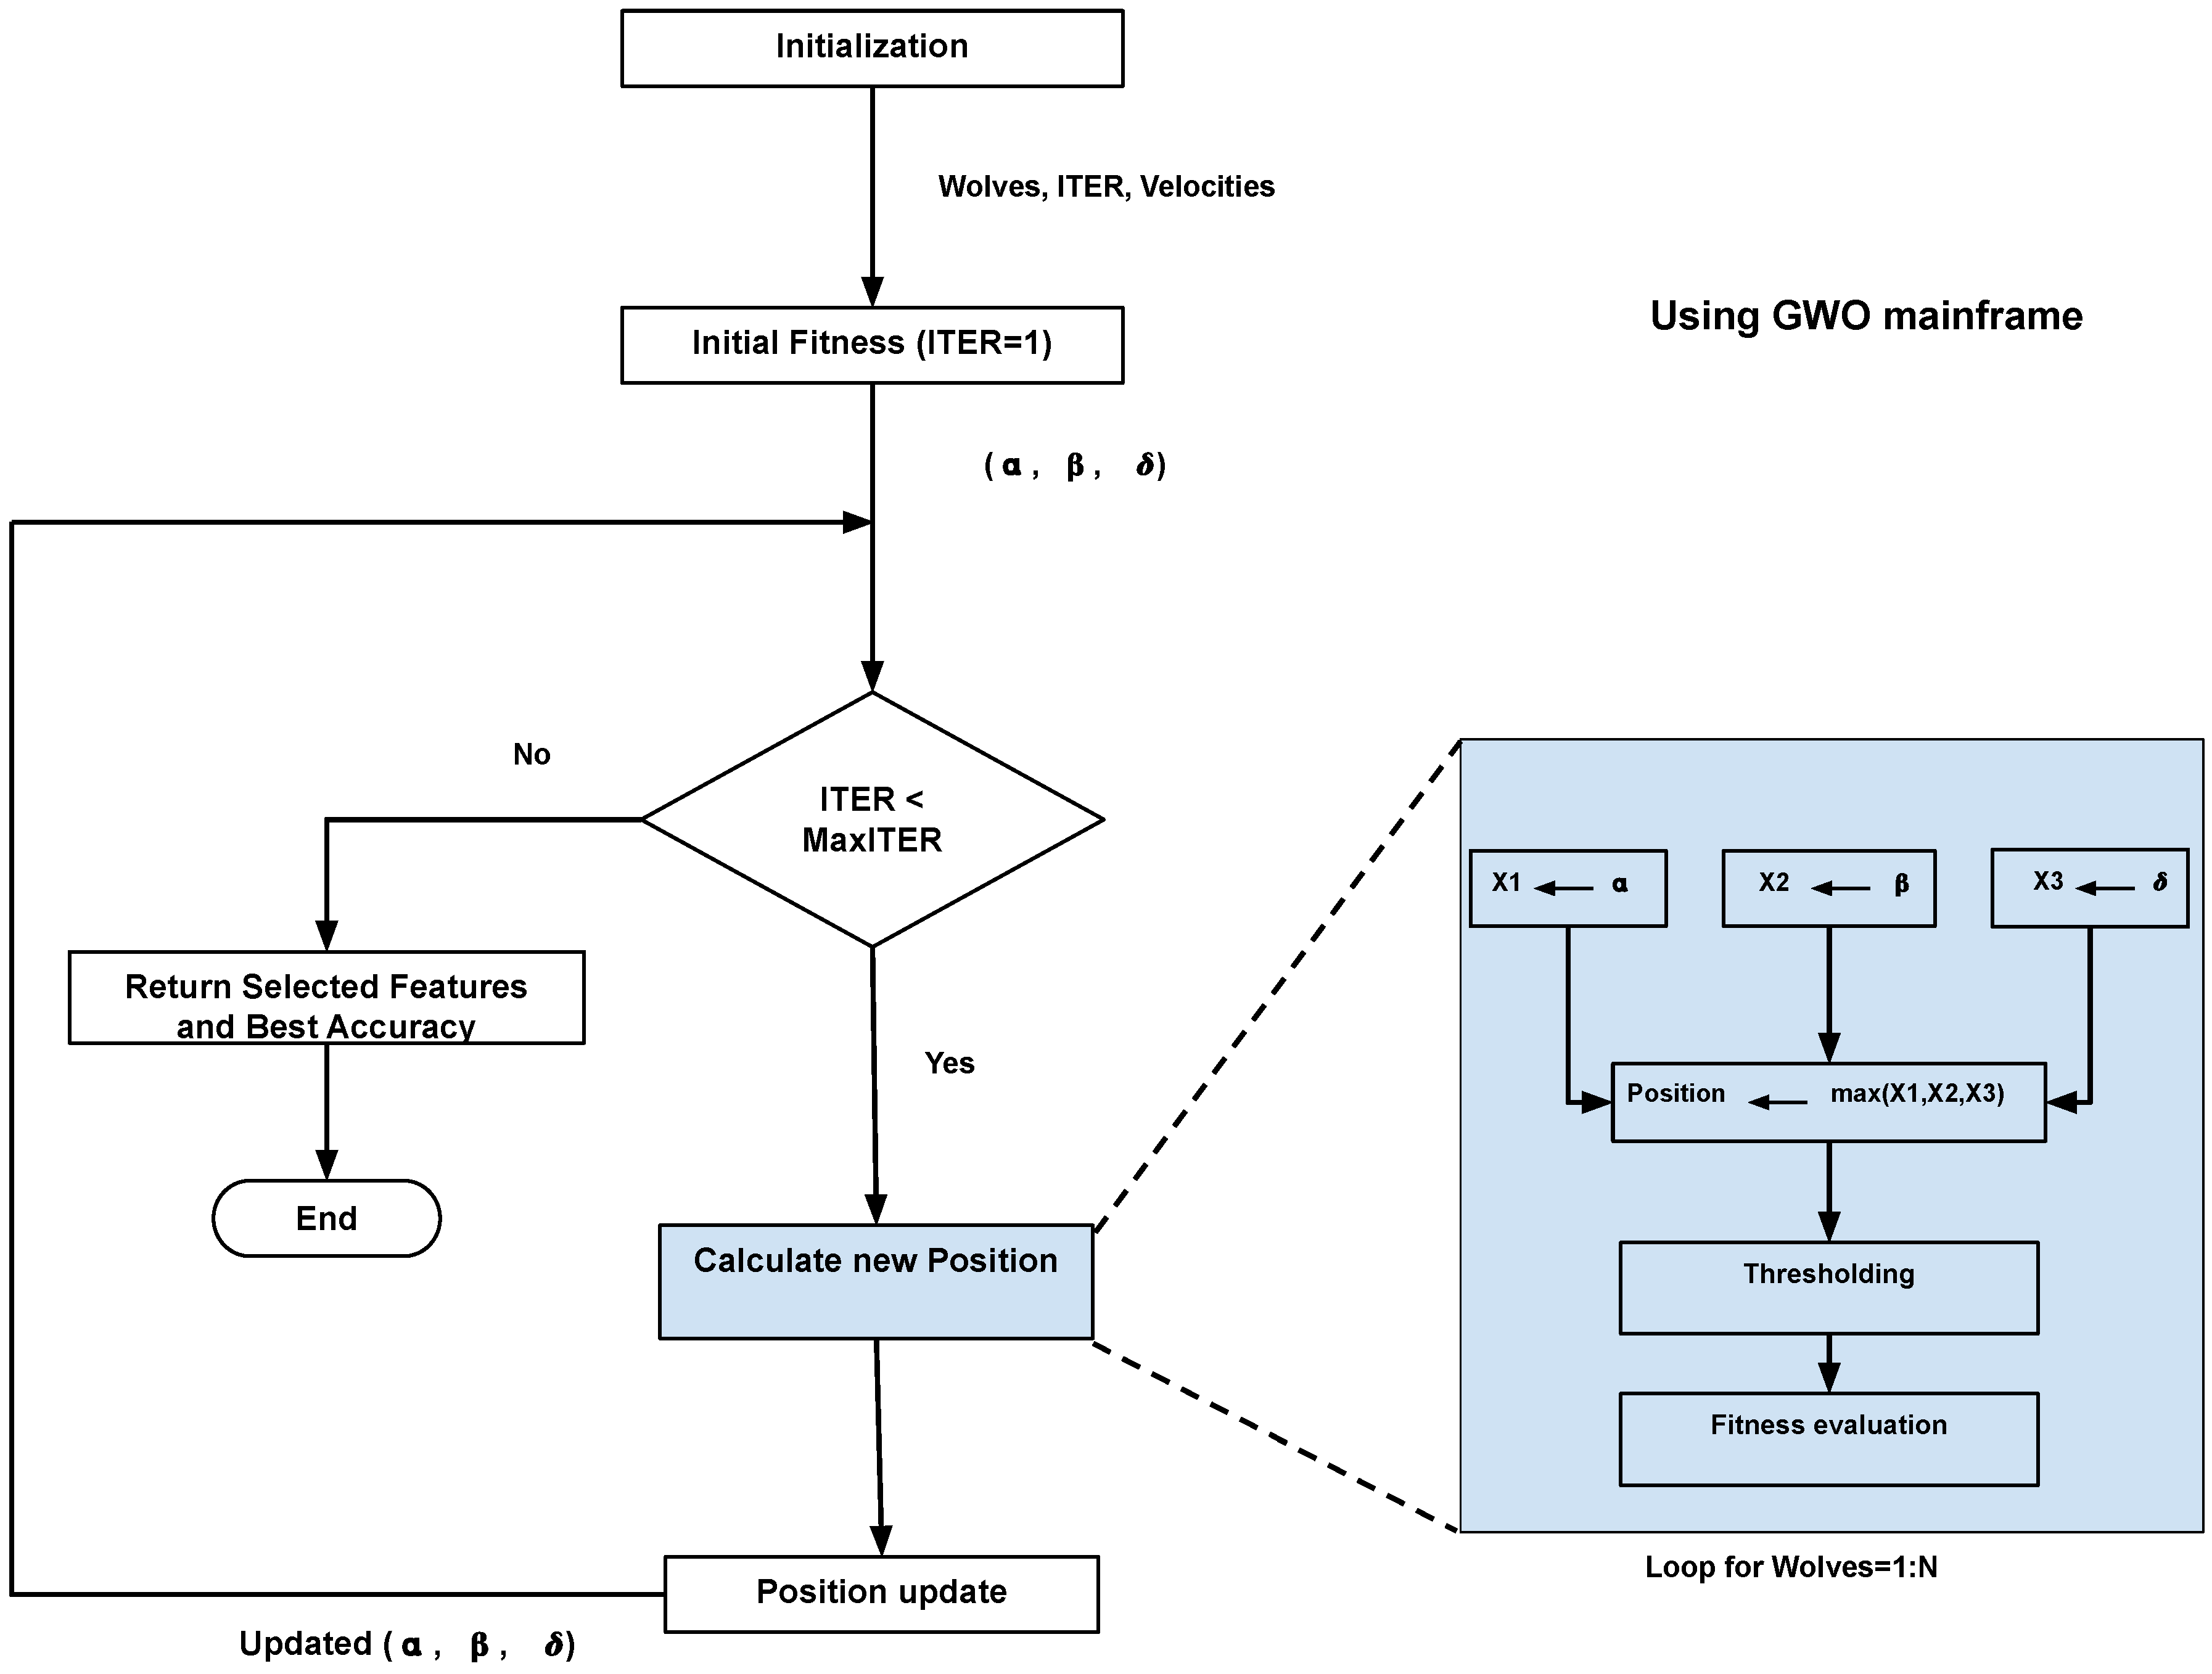
A flow chart of the proposed HPA-C is shown in
Figure 1.
| Algorithm 1 The Proposed NI Optimization Algorithm (HPA-C) |
Require: objective_function: Function to be maximized
- 1:
num_samples: Number of features - 2:
lb: Search space lower bounds - 3:
ub: search space upper bounds - 4:
num_wolves: Number of wolves - 5:
max_iterations: Maximum number of iterations
Ensure: selected_samples: Best solution found- 6:
accuracy: Fitness value of the best solution - 7:
InitializeWolves(, ) - 8:
UpdateWolves(, , , ) ▹ Initial evaluation - 9:
SortWolves(, ) - 10:
for to do - 11:
- 12:
for to do - 13:
UpdatePosition(, , , , a, , ) - 14:
end for - 15:
UpdateWolves(, , , ) - 16:
SortWolves(, ) - 17:
end for - 18:
Return as selected_samples and its fitness as
|
| Algorithm 2 UpdatePosition (Using X1, X2, X3 and Max Selection) |
- 1:
procedure UpdatePosition(, , , , a, , ) - 2:
for to do - 3:
% GWO Component - 4:
- 5:
% ABC Component - 6:
- 7:
% BAT Component - 8:
- 9:
- 10:
% Compute the final position using maximum selection - 11:
- 12:
% Apply boundary constraints - 13:
- 14:
% Binary discretization (Thresholding at 0.5) - 15:
1 if , 0 otherwise - 16:
end for - 17:
% Evaluate fitness of the updated wolf - 18:
- 19:
return - 20:
end procedure
|
| Algorithm 3 UpdateWolves |
- 1:
procedure UpdateWolves(, , , ) - 2:
for to do - 3:
% Update position of each wolf - 4:
UpdatePosition(, , , , a, , ) - 5:
end for - 6:
end procedure
|
4.2. Convergence Analysis of HPA-C
It is generally accepted that performing convergence analysis of an NI process is arduous and often needless. There may be multiple reasons behind this conjecture: (1) NI processesare often stochastic in nature, making their behavior impossible to predict, even under identical initial conditions [
54]. (2) They usually involve complex interactions among multiple components, thereby creating nonlinear and unpredictable dynamics [
55].
However, the convergence criteria can be defined—in this case, based on the following conditions:
4.3. Complexity Analysis of HPA-C
The time complexity analysis of HPA-C is discussed in this section. It provides a detailed analysis of the time complexity of the proposed HPA-C and a comparison with baseline algorithms, including GWO, PSO, GA, and ReliefF.
HPA-C is primarily based on GWO while incorporating enhancements inspired by the ABC and BA. These modifications improve the exploration and exploitation phases but do not introduce additional iterations, keeping the overall complexity comparable to that of GWO.
Initialization Phase:
where
P is the population size,
D is the feature number, and
represents complexity of the fitness evaluation.
Iterative Optimization Phase: The computational steps per iteration are outlined as follows:
Position updates (based on GWO structure with ABC and BAT modifications):
Binary discretization (constant-time adjustments):
Fitness evaluation and sorting: .
The total complexity per iteration remains as follows:
Since the core framework is GWO, the additional computations from ABC and BAT do not introduce new loops or higher-order terms, preserving the asymptotic complexity. Thus, in theoretical terms, the complexity of HPA-C remains identical to that of GWO.
For
max_iterations iterations, the overall complexity is expressed as follows:
Table 3 showcases a comparative analysis of the time complexities of HPA-C and the baseline algorithms.
The computational complexity of HPA-C remains comparable to that of GWO. The additional computational overhead from ABC and BAT is minimal, since no extra loops or high-order dependencies are introduced, ensuring computational efficiency.
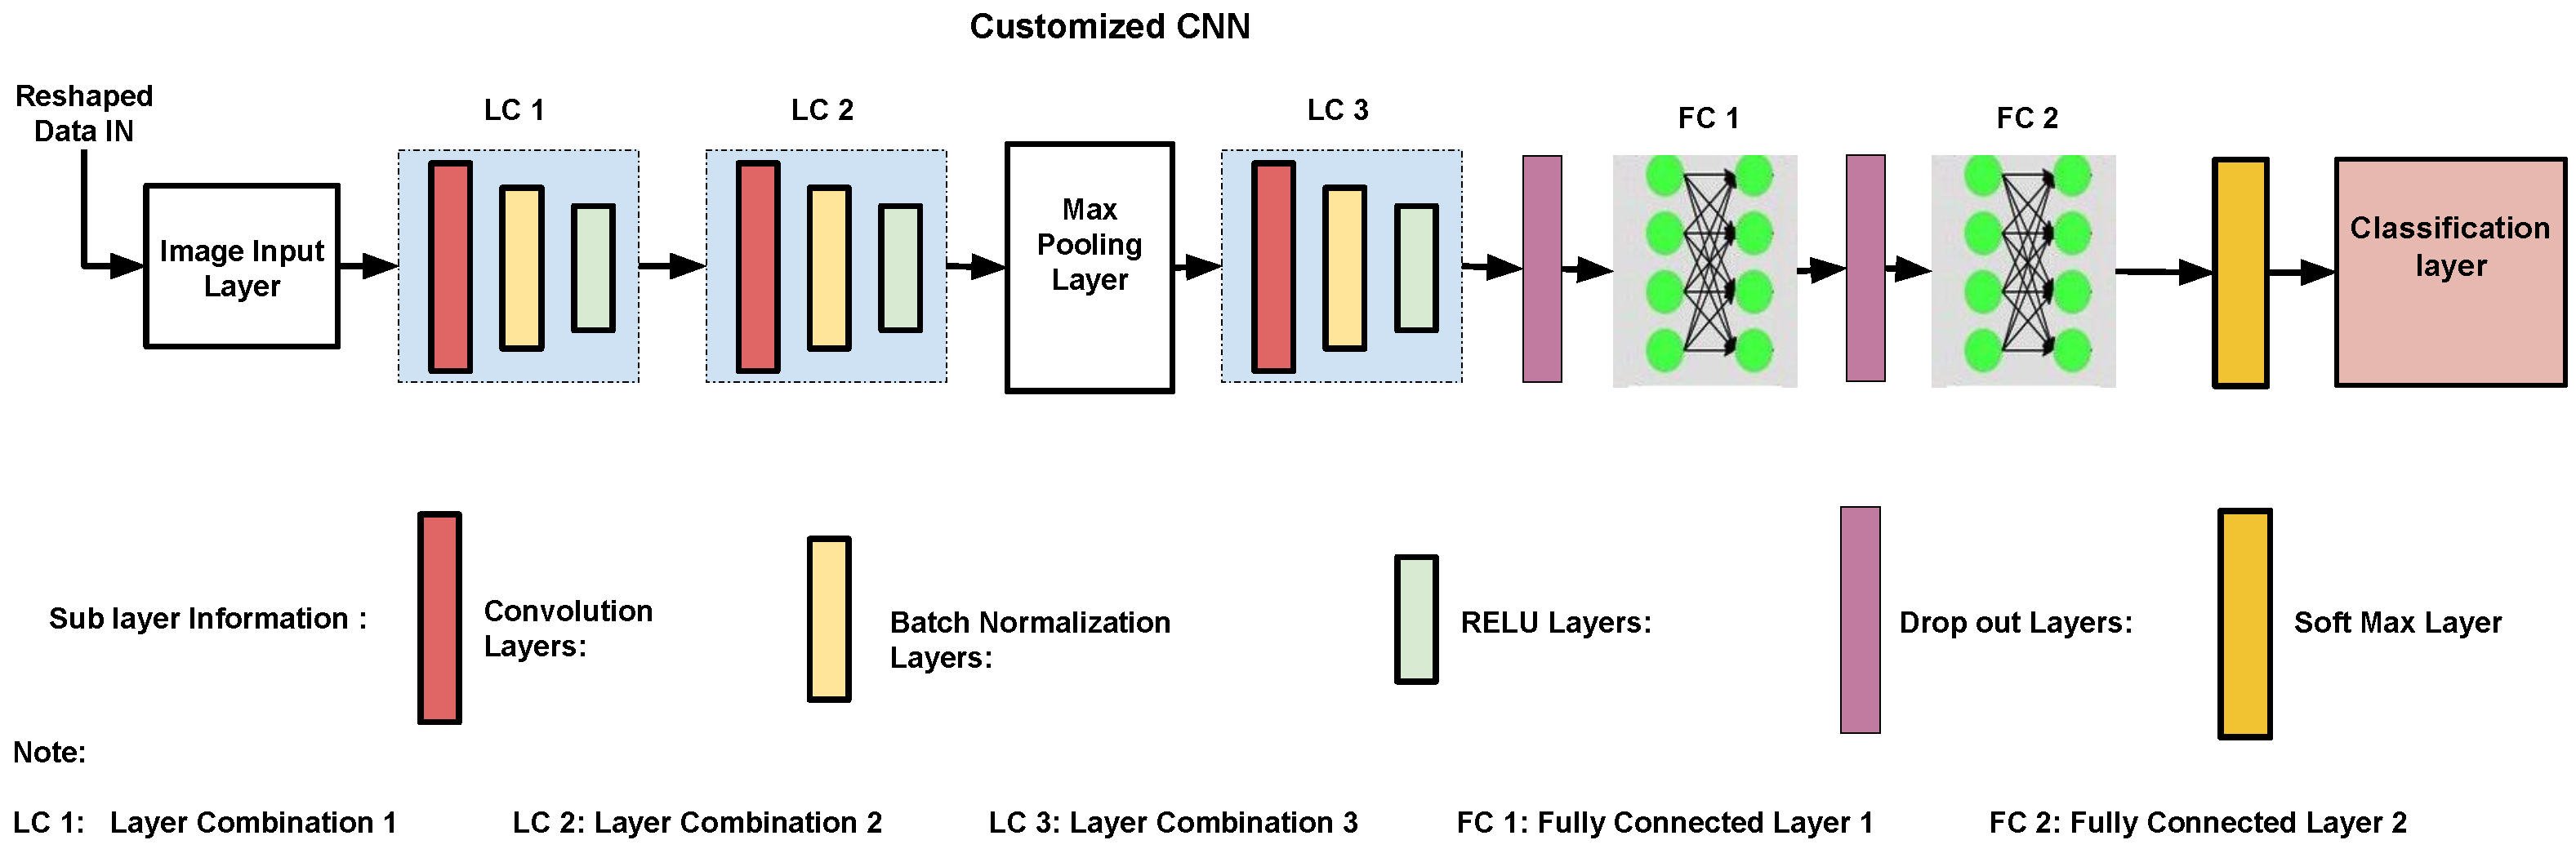
4.4. Proposed CNN Framework
The proposed 17-layer CNN is specifically designed for feature-based classification. It strikes a balance between efficiency and accuracy; the architecture is shown in
Figure 2. Compared with traditional CNNs that process raw images, our model has structured feature representations (
) as input, reducing computational overhead. The architecture primarily has three convolutional layers, each followed by batch normalization and ReLU activation. Their combinations are represented as LC1, LC2, and LC3. The first and third convolution layers use
kernels to capture local feature patterns, while the middle
convolution layer in LC2 acts as a bottleneck to reduce dimensionality and improve computational efficiency. A max-pooling layer (stride = 2) is used to refine feature representations. It is followed by a dropout layer (50%) to enhance generalization. The model transitions into a 128-neuron dense layer with ReLU activation before reaching the final softmax and classification layer.
Different alternative architectures and activation functions were considered during the design phase. Deeper networks with additional convolutional layers or larger dense layers (e.g., 256 or 512 neurons) were tested but did not provide significant performance improvements while increasing design complexity. Conventional CNNs designed for raw image processing were unsuitable due to redundant feature learning. Activation functions such as sigmoid and tanh were explored but led to vanishing gradient issues. This slowed down convergence. Leaky ReLU was also tested but did not offer any advantage in classification accuracy.
The combination of and convolutions enhances feature extraction while keeping the parameter count low. Batch normalization stabilized training, and dropout prevented overfitting. The Adam optimizer with a learning rate of 0.001 was selected for fast convergence. Softmax activation in the final layer enables probabilistic multi-class classification. This design ensures that the custom CNN effectively complements HPA-C by focusing on the most relevant features without excessive computational cost.
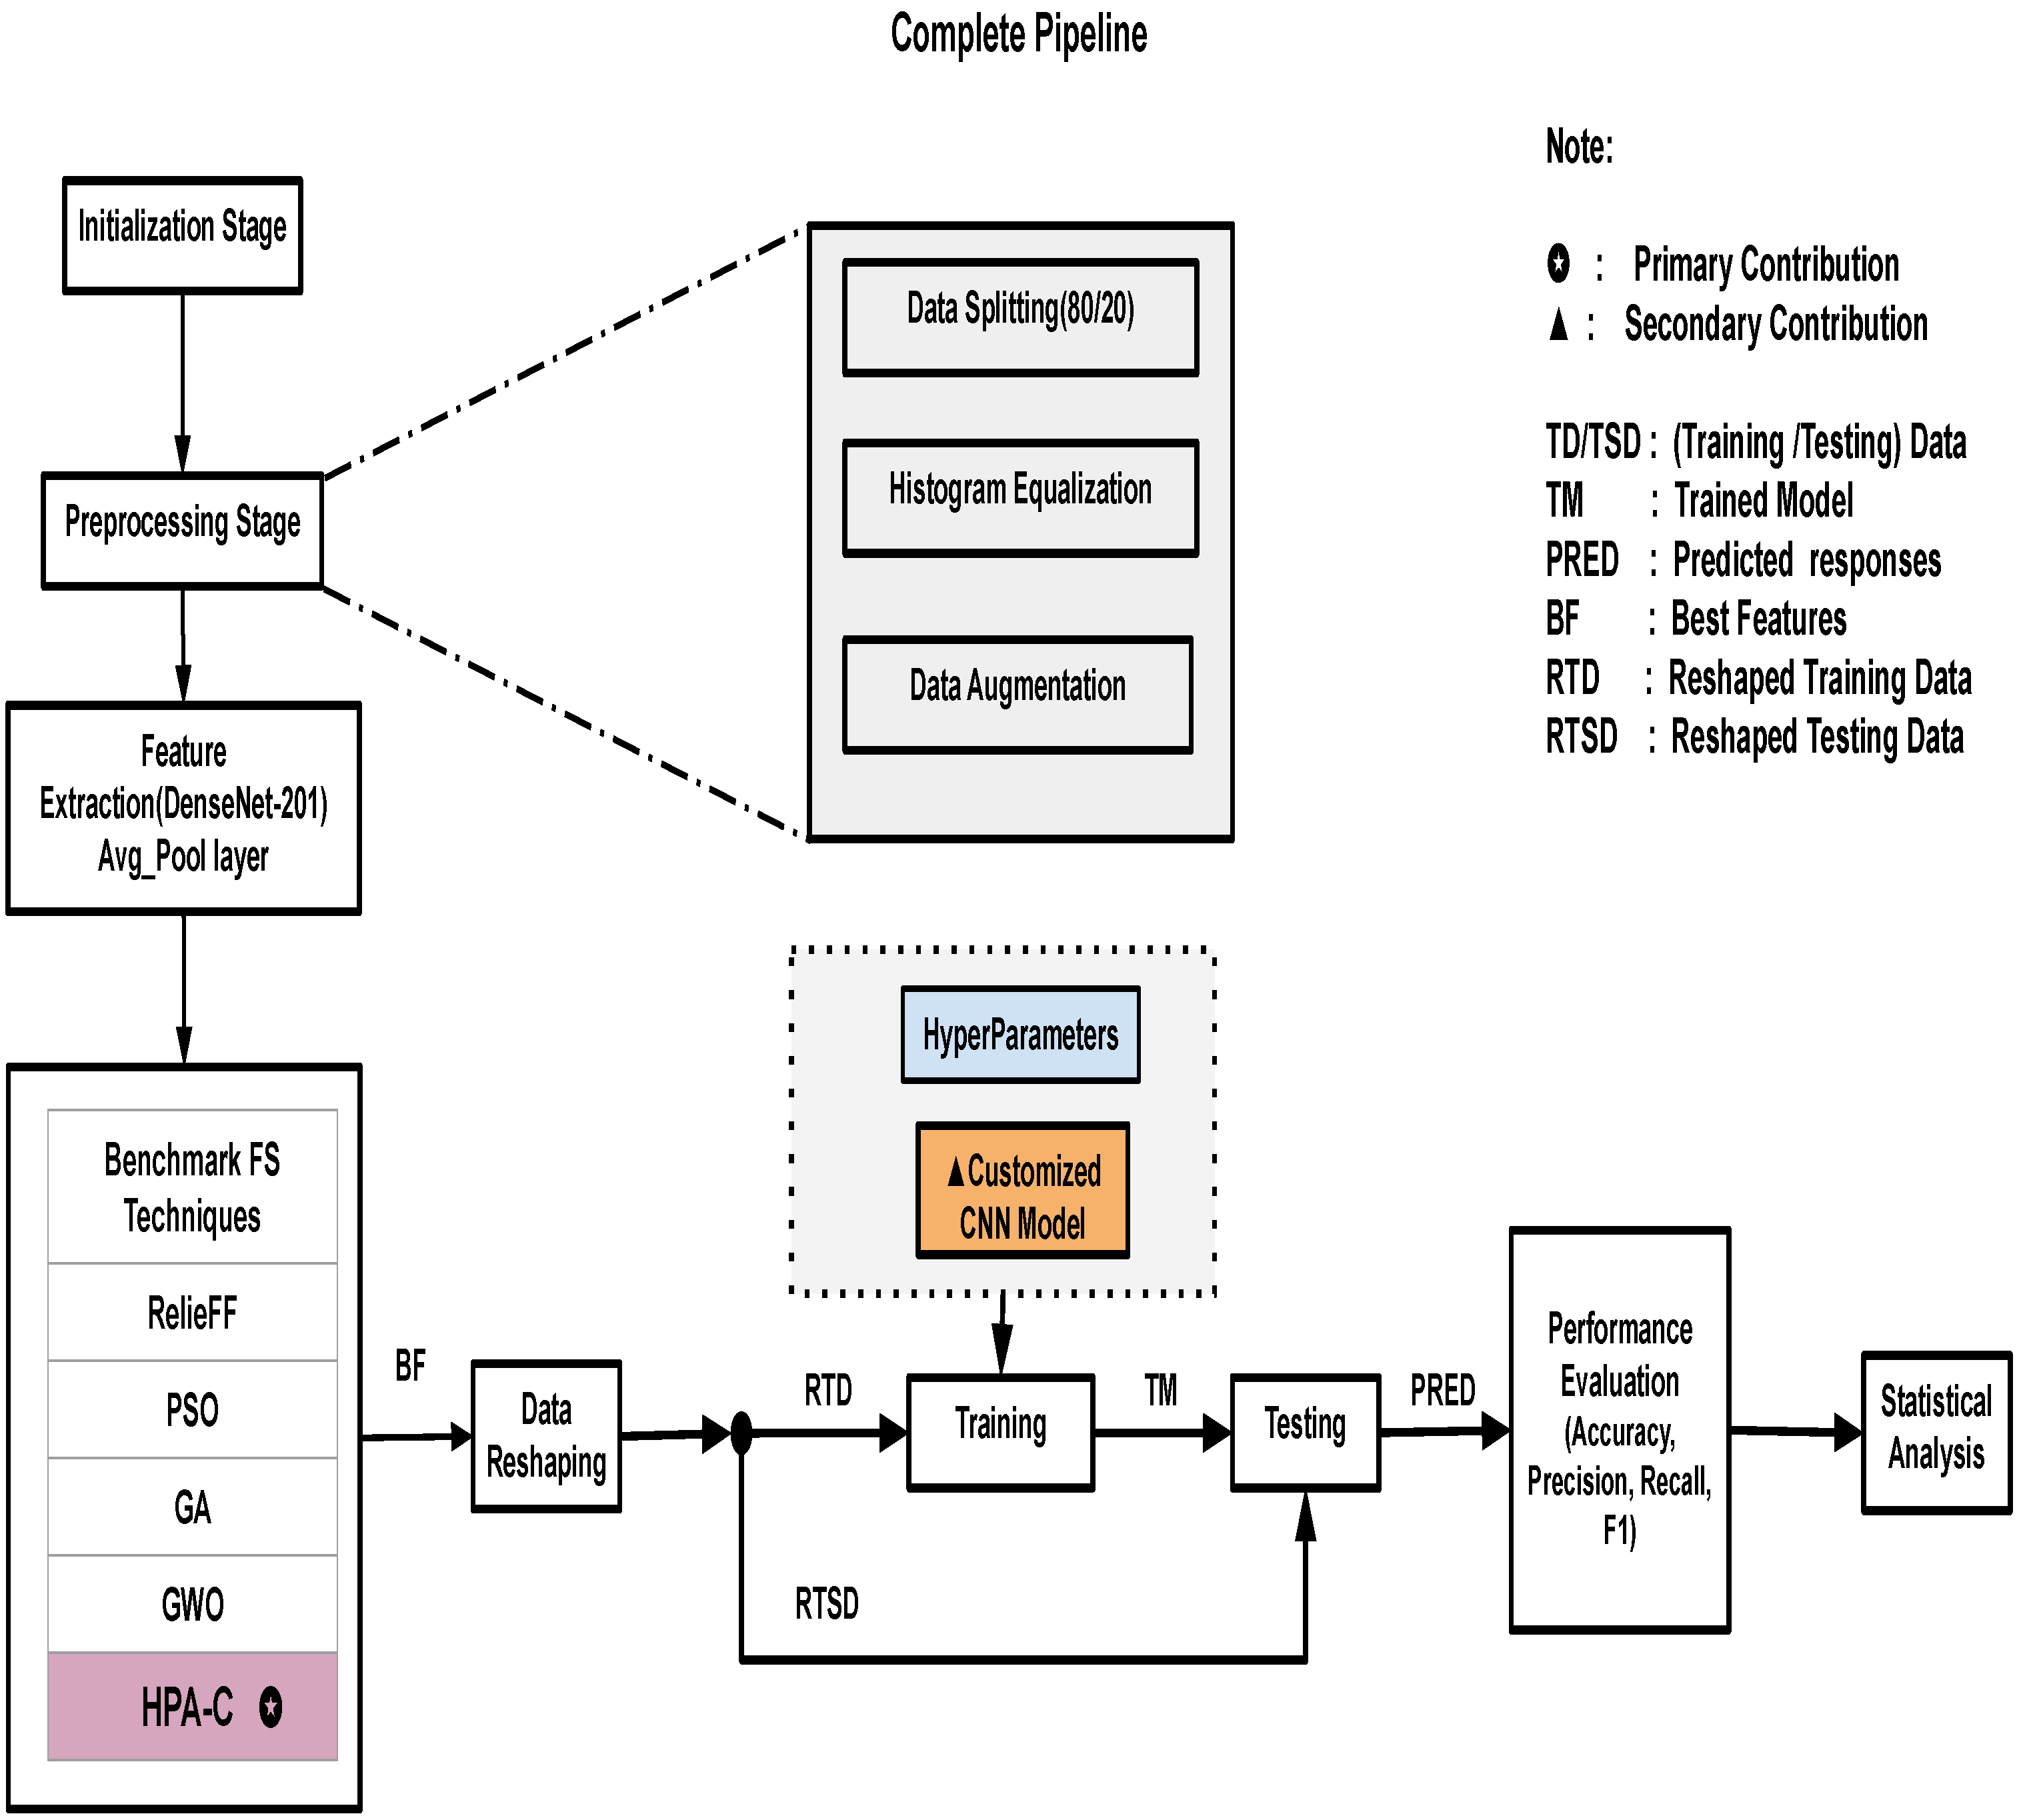
4.5. Complete Pipeline
The complete pipeline is shown in
Figure 3. The performance of HPA-C depends on key hyperparameters. These are the number of wolves (
N), the maximum number of iterations (
T), step size (
a), and learning rate (
). To ensure optimal performance, we tried different ranges of hyperparameters and conducted sensitivity analysis.
Table 4 shows the tested ranges for the used hyperparameters. The step-size parameter (
a) is particularly important because it is linearly decreased from an initial value of 2 to 0 over the iterations. This helps in controlling the exploration–exploitation trade-off. The selected hyperparameters are presented in
Table 5.
Based on sensitivity analysis, we selected hyperparameters that balanced accuracy and computational efficiency. The chosen values are summarized in
Table 5.
Hyperparameter selection was based on empirical results. Sensitivity analysis showed that increasing N beyond 20 or T beyond 100 resulted in negligible accuracy gains but significantly increased computational cost. The step size (a) follows a decreasing pattern from 2 to 0, ensuring a smooth transition from exploration to exploitation. The Adam optimizer demonstrated superior convergence properties and improved accuracy. The GPU-based implementation provided faster execution compared to the CPU.
MATLAB was used to access and preprocess the datasets utilized in this study in order to guarantee the best possible performance on classification tasks. Histogram equalization, data augmentation, and data separation are the three main processes in the preprocessing pipeline. The datasets used in this work were divided into training (80%) and testing (20%) subsets, a widely adopted practice to maintain a balance between training robustness and unbiased model evaluation. Histogram equalization was used to improve image contrast, making it easier to identify feature-rich areas. This is especially useful in agricultural datasets, where lighting conditions often vary. To further enhance dataset diversity, reduce the chance of overfitting, and improve the model’s generalization capacity, data augmentation techniques including rotation, flipping, and scaling were used. In our proposed pipeline, data augmentation was applied consistently across all datasets, regardless of their class distribution. The used augmentation techniques, such as rotation, flipping, and scaling, were selected to enhance model generalization and robustness rather than to address class imbalance.
While certain datasets may have different properties, our strategy was designed to maintain a uniform approach that preserves the quality of images while introducing variations that are beneficial for training. We ensured that augmentation operations were applied in a controlled manner, preventing excessive transformations that could distort critical features.
An essential first step in utilizing pre-trained architectures based on deep learning for effective representation learning is feature extraction. DenseNet-201 was used in this investigation, with its average pooling layer used to extract features. The densely connected design of DenseNet-201, which encourages feature reuse and addresses the vanishing gradient issue, justifies its adoption as a very effective method for image classification problems. As high-level representations of the input images, the recovered feature vectors capture complex texture-related and spatial properties that help with precise categorization.
Following feature extraction, five feature selection algorithms (RelieFF, PSO, GA, GWO, and the suggested HPA-C) are applied to the extracted features. The most pertinent features that have a major impact on classification performance are chosen by each algorithm. The purpose of HPA-C is to increase selection efficiency by utilizing the advantages of ABC, GWO, and BA. The classification model then receives the selected best features (BFs).
We performed feature selection analysis across agricultural datasets and found three dominant categories: texture features, color-based features, and shape-based features. Texture features like GLCM contrast and entropy capture surface irregularities. These are crucial for plant disease and soil condition assessment. Color features like mean RGB and HSV histograms helpe evaluate fruit ripeness and plant health by detecting pigmentation changes. Shape features like aspect ratio and compactness are necessary for distinguishing weeds from crops and classifying plant species. The selected features align with key agricultural indicators, emphasizing their biological relevance and consistency across datasets.
To validate feature importance, we analyzed selection frequency across datasets.
Table 6 summarizes the most frequently chosen features.
These results confirm that HPA-C consistently selects biologically meaningful features.
After feature selection, a customized convolutional neural network is designed and uses pre-selected high-dimensional features instead of raw images. This reduces computational complexity without sacrificing classification effectiveness. With different convolutional layers, batch normalization, activation functions, and fully connected layers, the CNN architecture is designed to maximize learning and classification accuracy. The efficiency of the model is increased overall because the integration of the chosen features guarantees that only the most discriminative data are used in the classification process.
Several performance indicators, like accuracy, macro precision, macro recall, and macro F1 score, are calculated to assess the model’s efficacy.
Additionally, accuracy is used as a critical criterion in statistical analysis to confirm the superiority of the suggested HPA-C feature selection method. The resilience of HPA-C in maximizing classification performance is confirmed by comparative analysis against alternative feature selection strategies, reaffirming its appropriateness for intelligent agricultural applications.
5. Results
The research work was carried out on a PC with an Intel Core i7 processor, 32 GB RAM, and NVIDIA Tesla K40 GPU, and Microsoft Windows 10 Operating System. The framework was implemented using MATLAB 2022A. We calculated performance metrics, specifically accuracy, macro precision, macro recall, and macro F1 score, in order to assess the framework.
The results are presented in
Table 7.
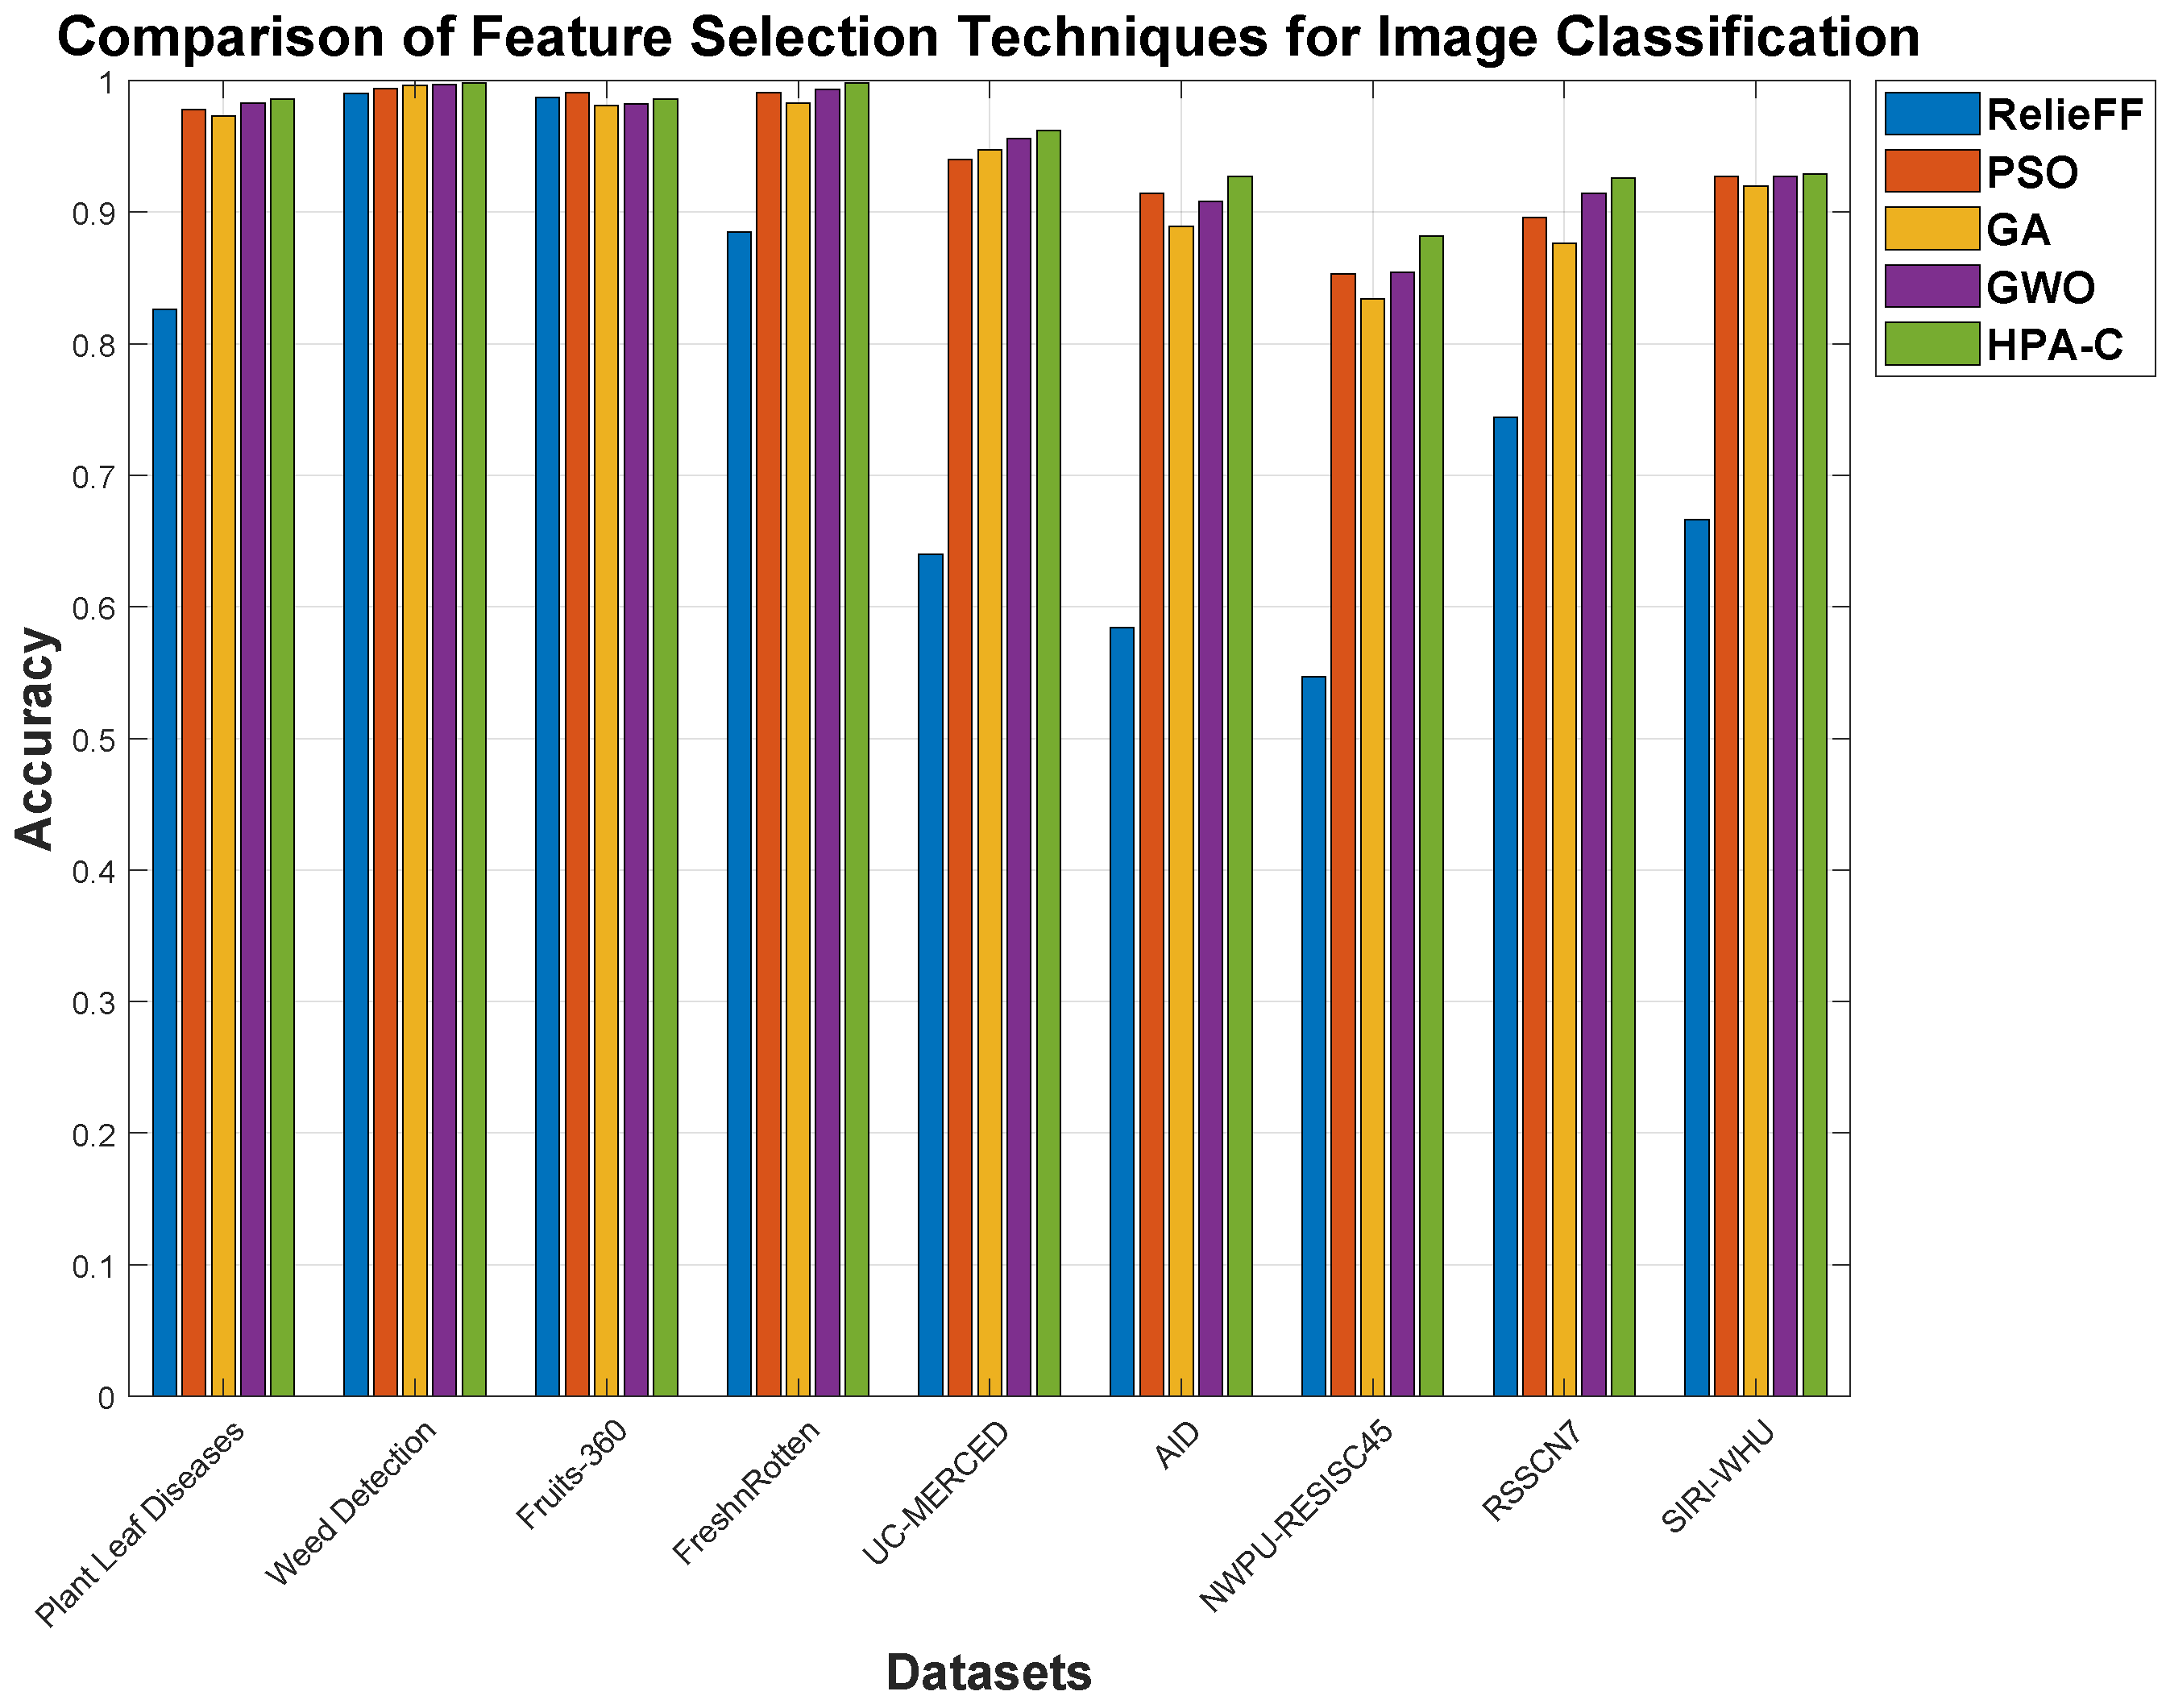
These findings demonstrate that HPA-C, combined with the custom CNN, achieves remarkable improvements in feature selection, even in scenarios where existing techniques have already reached extremely high performance levels (beyond 99% accuracy). In smart agricultural datasets such as Plant Leaf Diseases, Weed Detection, Fruits-360, and Fresh n Rotten, methods like GWO and GA already perform at near-optimal levels, yet HPA-C still manages to push the boundaries further, achieving up to a 0.5% to 1.5% increase in accuracy and a 1% to 3% boost in macro F1 score. While these numerical gains may seem small, at such high-performance levels, even a fraction of a percent can represent a significant improvement in real-world applications, where misclassification can lead to costly agricultural losses.
The Fresh n Rotten dataset stands out, where HPA-C reaches 99.8% accuracy, surpassing GWO by 0.5% and significantly outperforming RelieFF by 12.8%, demonstrating its superior feature selection capability. Similarly, in the Plant Leaf Diseases dataset, while GWO achieves 98.3% accuracy, HPA-C improves it to 98.6%, further enhancing class-wise performance as evidenced by a 1.5% boost in macro F1 score. These refinements highlight the ability of HPA-C to extract highly discriminative features, even when existing techniques seem to have saturated performance levels. The accuracy plot for the different datasets and feature selection techniques is also shown in
Figure 4.
Beyond smart agriculture, HPA-C proves its adaptability to remote sensing datasets, where class diversity and imbalance present additional challenges. Although benchmark techniques like GWO perform well, HPA-C consistently delivers improvements of up to 6.5% in macro F1 score and 5% in accuracy in complex datasets such as NWPU-RESISC45 and AID. Even in scenarios where GA and PSO struggle with minority-class recognition, HPA-C ensures a 30% to 35% improvement in macro recall, making it more robust for diverse class distributions.
The key takeaway is that, while traditional feature selection techniques appear to have reached their peak, HPA-C successfully extracts more meaningful feature subsets, leading to noticeable refinements, even at the highest performance levels. This reinforces its reliability for real-world agricultural and remote sensing applications, where even the smallest increase in classification accuracy can have substantial economic and operational benefits.
5.1. Statistical Analysis
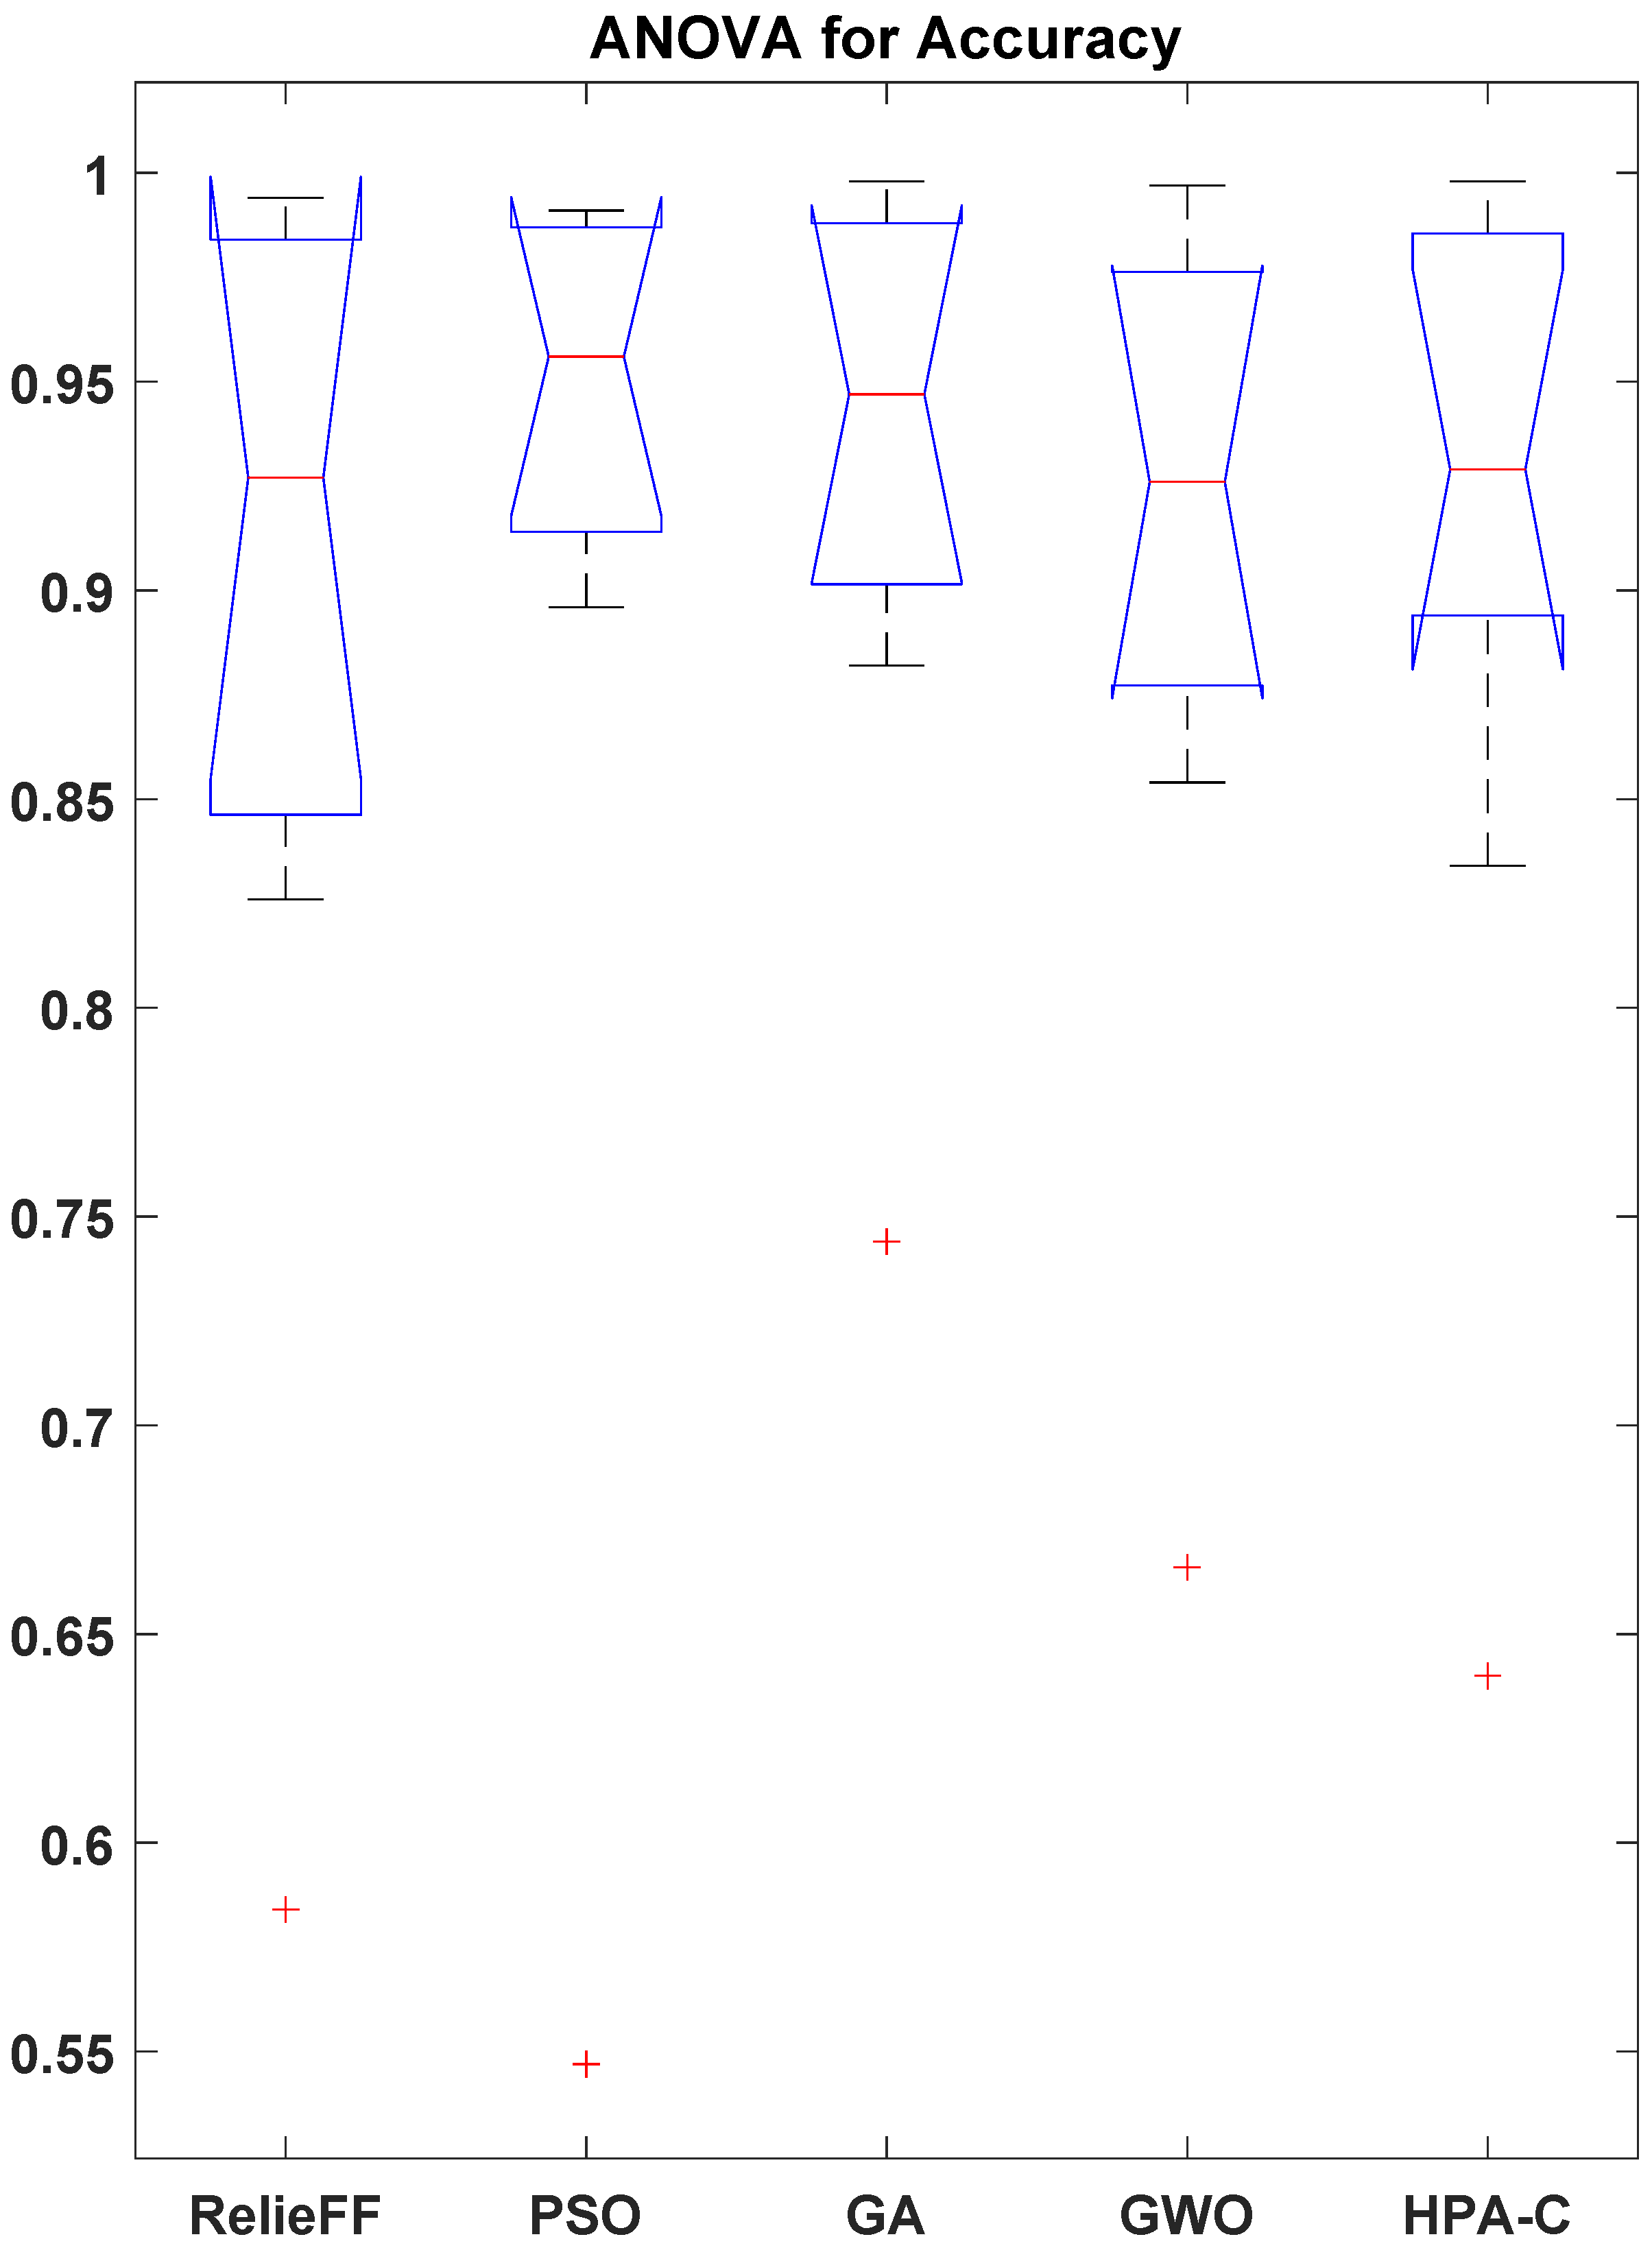
The effectiveness of the proposed HPA-C feature selection technique was evaluated by conducting a comparative analysis against four benchmark methods: RelieFF, PSO, GA, and GWO. The classification accuracy was measured across nine diverse datasets related to smart agriculture and remote sensing. To ensure a statistically rigorous comparison, we performed a one-way ANOVA, followed by Tukey’s HSD post hoc test and the Wilcoxon signed-rank test.
The box plot obtained from the ANOVA is presented in
Figure 5. The results of the one-way ANOVA presented in
Table 8 indicate a statistically significant difference among the feature selection techniques (
,
). This suggests that at least one of the methods performs significantly better than the others.
The statistical analysis revealed that PSO, GA, and GWO do not exhibit significant differences in performance. This observation suggests the convergence to similar optima in the given datasets. However, their inclusion is still meaningful because it demonstrates that HPA-C outperforms not just one but multiple representative optimization-based approaches. The lack of significant differences among PSO, GA, and GWO highlights that conventional population-based methods may not always offer substantial distinctions in feature selection performance, emphasizing the need for more advanced hybrid approaches like HPA-C.
To provide a comprehensive evaluation, we retained all three in the comparative analysis. The analysis showed that HPA-C is not only superior to a statistical method (RelieFF) but also to three widely used metaheuristic techniques. While redundancy in performance exists, excluding any of these methods would weaken the generalizability of the findings.
In addition to the ANOVA, a Wilcoxon signed-rank test was also performed to validate the superiority of HPA-C. The test results, summarized in
Table 9, prove that HPA-C outperforms all other used benchmark feature selection techniques, with
in all cases. This value provides strong statistical evidence for the robustness of HPA-C across diverse datasets.
The results clearly prove that HPA-C significantly improves classification accuracy when compared to RelieFF, PSO, GA, and GWO. HPA-C consistently performs better than the benchmark approaches.
Statistical analysis indicates that HPA-C is a robust and effective feature selection technique for smart agricultural applications and beyond. It demonstrated strong generalization across diverse datasets.
5.2. Feature Selection Consistency Across Datasets
An analysis of feature selection patterns across datasets revealed that while selected features varied based on dataset characteristics, certain features were consistently prioritized, indicating that HPA-C effectively identifies highly discriminative features that enhance classification performance. The texture-based and color histogram features were frequently selected in plant disease and fruit classification tasks, while spectral and shape-based features were dominant in weed detection and remote sensing datasets. This consistency suggests that HPA-C captures domain-relevant attributes rather than selecting features arbitrarily.
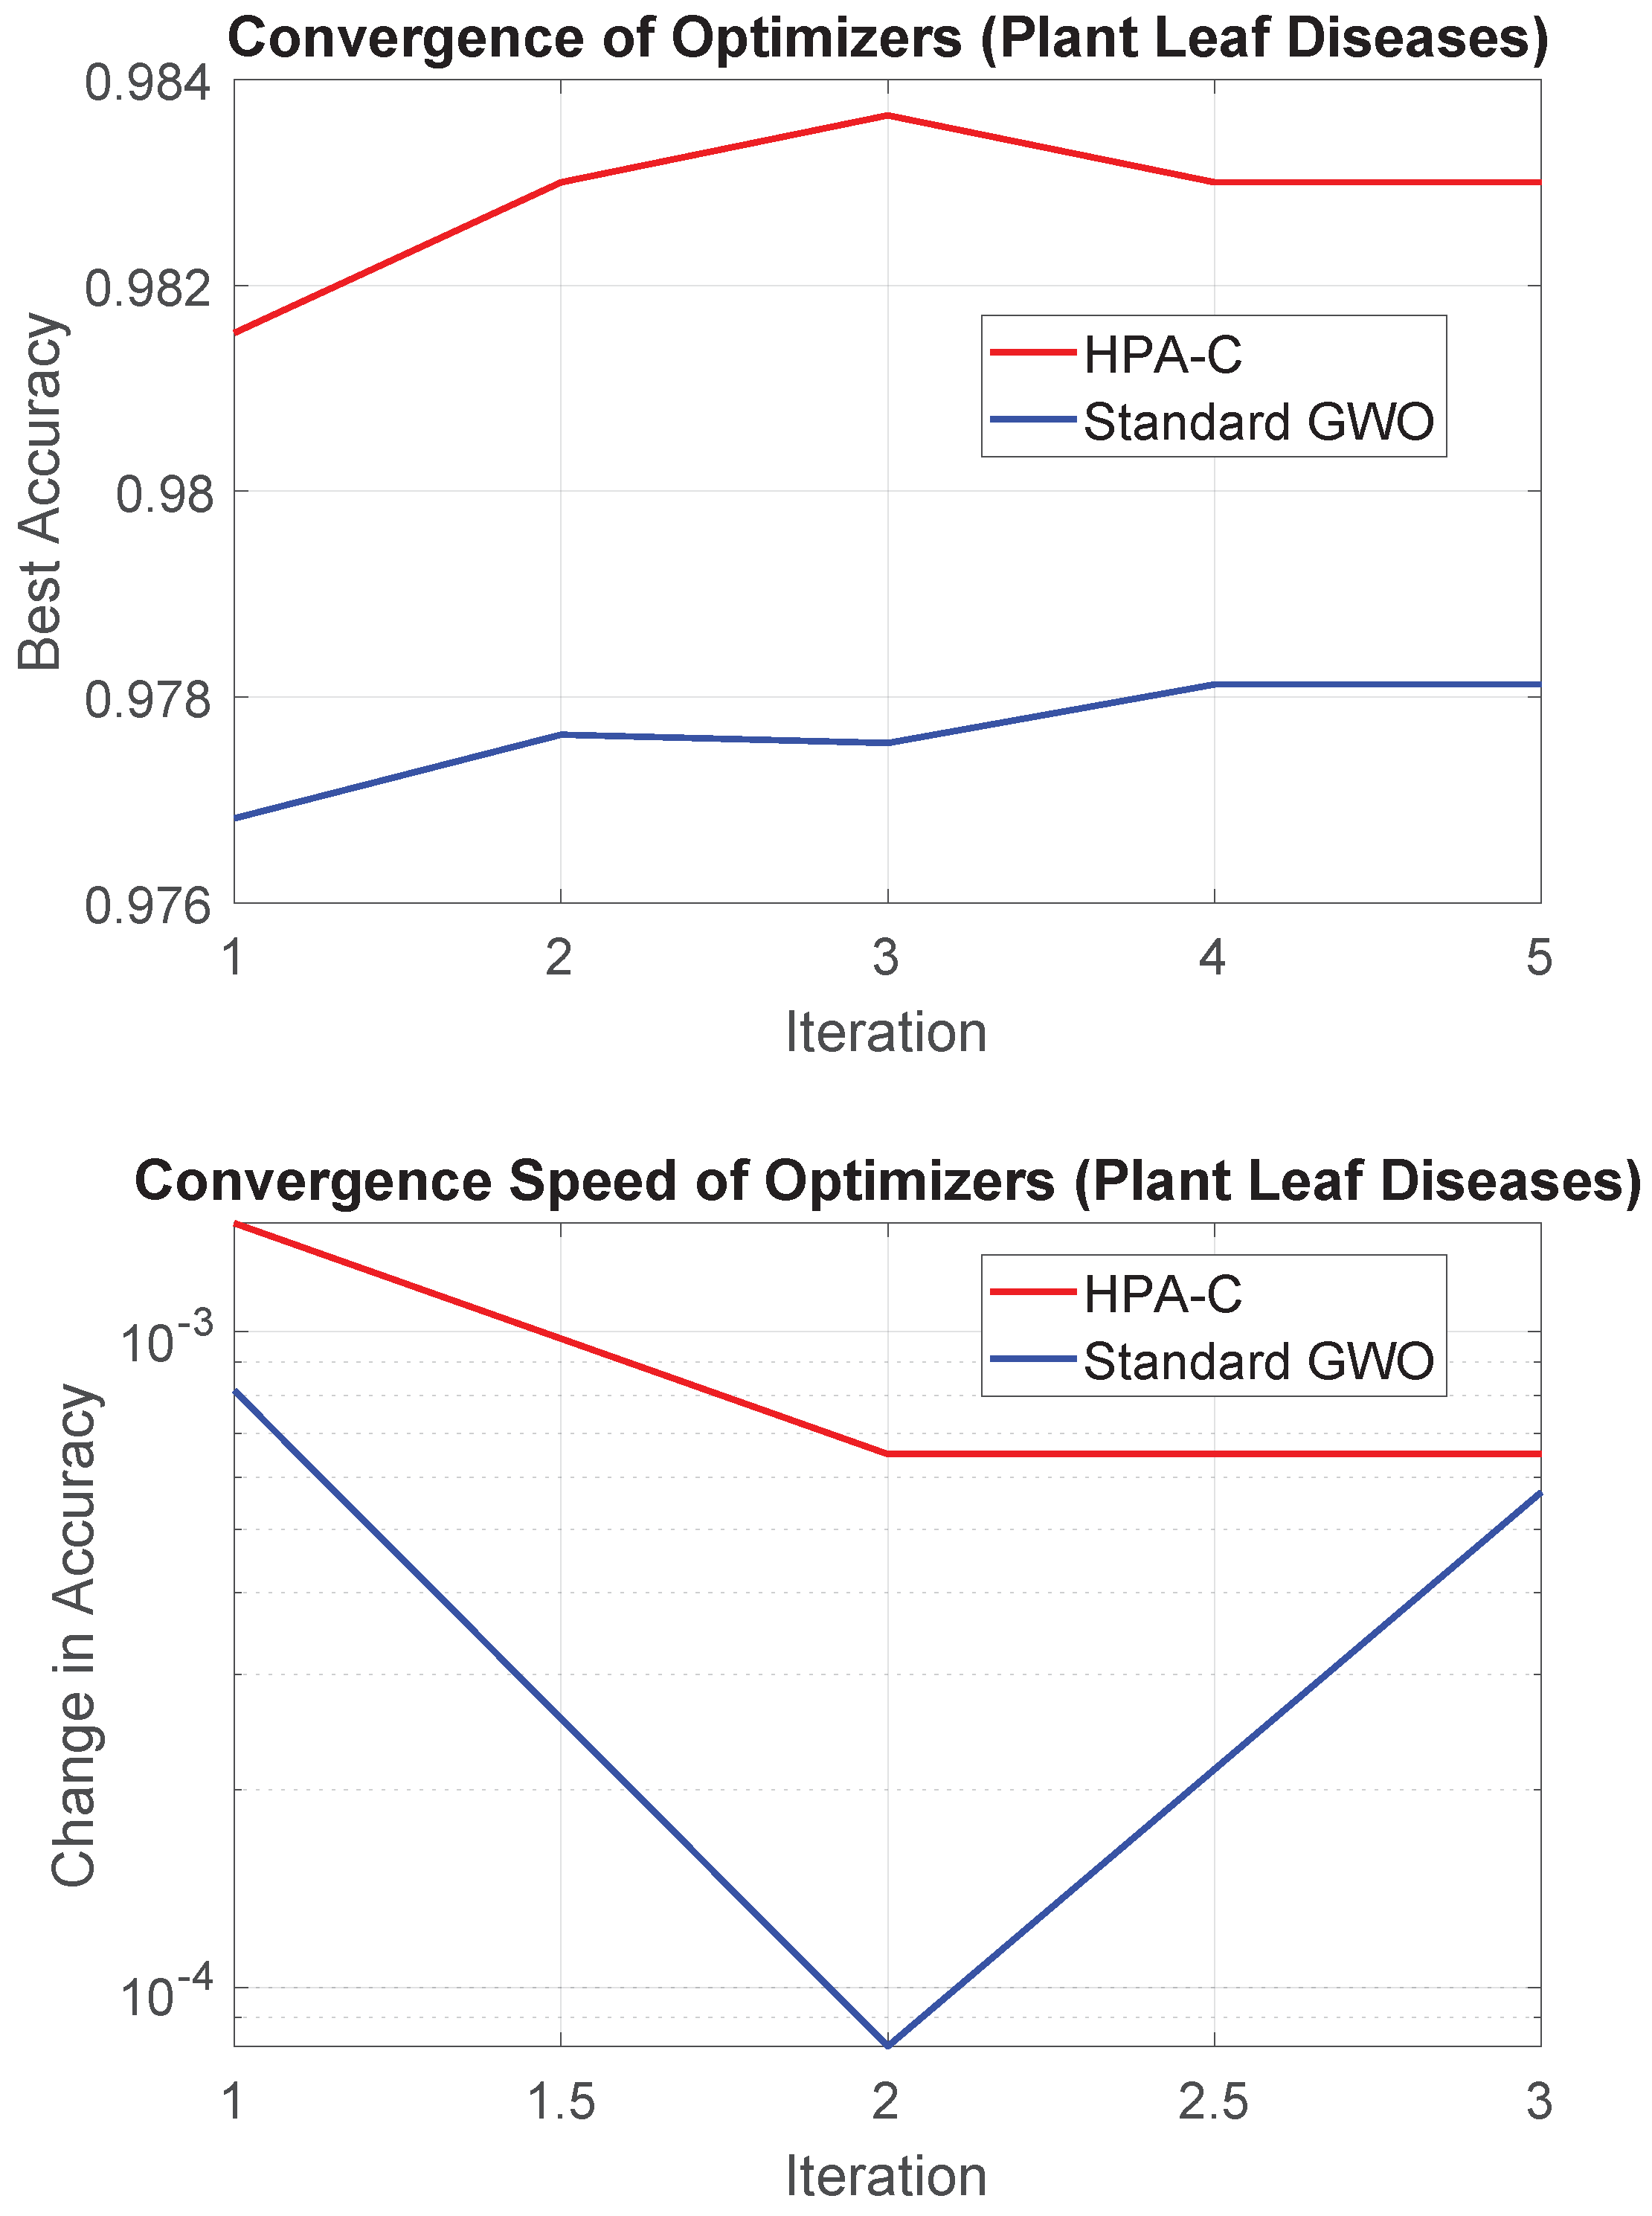
5.3. Convergence and Wall-Clock (Elapsed) Time
The convergence plot for HPA-C and GWO using the Plant Leaf Diseases dataset is shown in
Figure 6.
In terms of computational time, HPA-C required 5631.75 s, while GWO completed the feature selection process in 5224.16 s. This marginal increase of approximately 10% in elapsed time for HPA-C is justified by its enhanced search capabilities and improved feature selection. Moreover, the theoretical complexity of the two algorithms remains similar, as discussed in
Section 4.3, ensuring that hybridization does not impose significant computational overhead.
5.4. Challenges and Future Work
While this research demonstrates the effectiveness of the proposed hybrid feature selection technique and custom CNN for smart agricultural datasets, several challenges highlight areas for further exploration and improvement.
One of the key challenges encountered during implementation was the limitation of computational resources, particularly GPU memory. State-of-the-art architectures, such as Vision Transformers (ViTs) and large-scale convolutional networks, require substantial memory and processing power, making their deployment infeasible on constrained hardware. This limitation restricted the scope of model exploration and prevented the utilization of potentially more powerful architectures. Future work can address this challenge by leveraging model compression techniques such as quantization, pruning, and knowledge distillation to optimize memory efficiency. Additionally, distributed training using frameworks like TensorFlow and PyTorch 2.0 across multiple GPUs or cloud-based solutions, such as Google Colab, AWS, or TPUs, could enable the training of high-capacity models without hardware bottlenecks.
The datasets used in this study vary in terms of image quality, resolution, and class distribution, reflecting real-world challenges in smart agricultural applications. All datasets contain RGB images, but their resolutions differ. This difference could potentially introduce inconsistencies in feature representation. The preprocessing pipeline, including image resizing and normalization, was designed to mitigate such variations and ensure a consistent input format for the CNN. Our study does not explicitly focus on image quality variations such as noise, blur, or lighting conditions, which could influence model performance. Future work could explore image enhancement techniques to improve robustness against such factors.
Class imbalance is a problem in datasets where certain diseases or conditions are under-represented and could impact classification performance. This issue is especially concerning in minority classes. Although the proposed model demonstrated strong performance across diverse datasets, class-balancing techniques such as oversampling (e.g., SMOTE and ADASYN) or cost-sensitive learning could further enhance generalization. We could use use advanced synthetic data generation approaches, including Generative Adversarial Networks (GANs) and diffusion models. These could also help address imbalance-related challenges by generating realistic samples for under-represented categories.
Despite these dataset limitations, the model consistently outperformed benchmark methods. This demonstrates its robustness in handling diverse agricultural imagery. Future research should systematically analyze the impact of resolution variations, noise levels, and class distribution on classification accuracy to provide deeper insights into how dataset quality affects feature selection and CNN performance.
The prospects of using Python-based tools (v3.13.2) can also be explored. Tools like PyTorch’s weighted loss functions for cost-sensitive learning and imbalanced learning for oversampling can be explored. To ensure that these balancing procedures are effective in a variety of settings, future research should assess how they affect classification performance.
The primary focus of this research was tilted towards smart agricultural datasets. There is still room to expand the concept to other fields, such as medical imaging. However, direct application of medical imaging datasets is difficult because there is extreme class imbalance. These datasets also require specialized preprocessing. Future studies could investigate the creation of sophisticated preprocessing pipelines that fulfill image processing needs by utilizing Python libraries like OpenCV and MONAI.
This study compares HPA-C with well-known optimization-based approaches in order to assess its efficacy as a feature selection strategy. The chosen benchmarks guarantee an equitable evaluation of HPA-C’s contributions. We illustrate that the observed advantages are due to our hybrid strategy and not due to incidental factors in comparison with separate heuristic techniques.
We see the potential for more insights from comparisons with end-to-end deep learning models and hybrid metaheuristic techniques. The primary driving force behind our effort is to improve feature selection for applications where computing efficiency and interpretability are crucial. Direct comparisons with deep learning models that do not use feature selection are not straightforward because they are based on a different paradigm. Specifically in medical or specialized domains, combining transfer learning with pre-trained models like SWIN transformers may be a promising path toward further improvement.
This work can be expanded in the future by comparing HPA-C against cutting-edge deep learning models and hybrid metaheuristic-based feature selection methods. Transparency is crucial in applications like medical diagnosis, where using visualization techniques like Grad-CAM could offer deeper insights into model decision making. In addition to meeting the changing requirements of intelligent classification systems, these directions would improve HPA-C’s wider application.
For future work, we can use model parallelism and distributed training with frameworks like DeepSpeed or PyTorch Distributed to scale training across numerous nodes. We can maximize computational efficiency by using NVIDIA’s Apex for low-precision training, such as mixed precision (FP16). This might greatly speed up calculations without sacrificing accuracy. We can Use Numba and CuPy to implement GPU-accelerated computations for feature selection and preprocessing. This can result in improved execution speed and make handling large datasets easier.
6. Conclusions
HPA-C is a novel feature selection algorithm for classification using agricultural datasets. It leverages a variety of biological activities, including cooperative hunting, foraging, and echolocation, to accomplish superior exploration and exploitation capabilities.
When used along with a custom convolutional neural network (CNN), HPA-C delivered exceptional classification performance by achieving accuracy levels of up to 99.8% on key agricultural datasets, including Plant Leaf Diseases, Weed Detection, Fruits-360, and Fresh n Rotten. These results not only surpass those of methods like GWO and GA but also demonstrate the algorithm’s ability to extract highly discriminative features, even in scenarios where performance gains are thought to be saturated. These improvements, though seemingly incremental, are transformative in agricultural applications where even fractional gains in accuracy can reduce misclassifications and enhance decision making.
HPA-C outperformed benchmark techniques in both accuracy and macro F1 score, particularly in challenging datasets like Fresh n Rotten, where it achieved a 12.8% improvement over traditional methods like RelieFF. Beyond agriculture, the competitive performance of HPA-C on supplementary datasets shows its potential for broader applicability, including in domains like medical imaging and environmental monitoring.
This study also focused attention on critical challenges to pave the way for future innovation. Computational resource limitations, particularly GPU memory constraints, restricted the exploration of more advanced architectures like Vision Transformers (ViTs). Addressing these challenges through model compression, distributed training, and low-precision computing could unlock even greater performance gains. Additionally, the lack of explicit handling of dataset imbalance presents an opportunity to integrate advanced balancing techniques, such as SMOTE, ADASYN, or generative approaches like GANs, to further enhance generalization. Extending the framework to high-stakes domains like medical imaging, where explainability and domain adaptation are paramount, represents another exciting avenue for future research.
In conclusion, this work not only establishes HPA-C as a state-of-the-art feature selection algorithm but also sets a new benchmark for hybrid optimization techniques in machine learning. By addressing the identified challenges and exploring the proposed future directions, this framework has the potential to revolutionize classification tasks across a wide range of applications. Its impact extends beyond smart agriculture, offering a scalable, efficient, and highly accurate solution for real-world problems. We believe this research opens the door to a new era of hybrid optimization-driven machine learning, with far-reaching implications for both academia and industry. The findings presented here are a testament to the transformative power of interdisciplinary innovation, and we are confident that this work will inspire further advancements in the field.


 ,
, 