Abstract
This paper proposes a novel hybrid approach that combines unsupervised feature extraction through clustering and unsupervised feature selection for data reduction, specifically targeting high-dimensional data. The proposed method employs K-means clustering for feature extraction, where cluster membership serves as a new feature representation, capturing the inherent data characteristics. Subsequently, the K-Nearest Neighbors (KNN) and Random Forest algorithms are utilized for supervised feature selection, identifying the most relevant feature to enhance model performance. This hybrid approach leverages the strengths of both unsupervised and supervised learning techniques. The new algorithm was applied to 13 different tabular datasets, with 9 datasets showing significant improvements across various performance metrics (accuracy, precision, recall, and F1-score) in both KNN and Random Forest models, despite substantial feature reduction. In the remaining four datasets, we achieved substantial dimensionality reduction with only negligible performance decreases. This improvement in performance while reducing dimensionality highlights the potential of the proposed method within the procedure, where datasets are treated without prior knowledge or assumptions. The proposed method offers a promising solution for handling high-dimensional data, enhancing model performance while maintaining interpretability and ease of integration within the proposed frameworks, with the ability to be irrespective of supervised or unsupervised designation datasets while reducing the dependency on a target or label features.
1. Introduction
Data dimensionality has emerged as a critical challenge in modern machine learning and data analytics, particularly as organizations collect increasingly complex, high-dimensional datasets across various domains. The exponential growth in data volume and feature count often leads to computational inefficiency, overfitting, and diminished model performance—a phenomenon commonly referred to as the “curse of dimensionality”. Effective dimensionality reduction techniques have therefore become essential components in data preprocessing pipelines, enabling analysts to identify relevant patterns while eliminating redundant or noisy information. This paper introduces a novel hybrid approach that addresses these challenges by seamlessly integrating unsupervised clustering-based feature extraction with supervised feature selection methods, offering a framework for handling high-dimensional data without compromising analytical accuracy or interpretability. Data reduction techniques are often utilized in data analysis to improve computational efficiency and mitigate the “curse of dimensionality”, which occurs when the number of features becomes excessively large [1,2]. Two primary approaches for data reduction are feature selection and feature extraction. Feature selection identifies a subset of the most relevant features, while feature extraction creates a new set of features by transforming the existing ones [3].
This work proposes a novel approach that combines feature extraction through clustering and feature selection for data reduction in unsupervised datasets for high-dimensional data. Feature extraction is achieved through K-means clustering, where cluster membership serves as a new feature [1,4,5,6,7,8]. Subsequently, the K-Nearest Neighbors (KNN) and Random Forest (RF), a supervised learning technique, were employed for feature selection. This hybrid approach leverages the strengths of unsupervised learning (clustering) to capture inherent data structure and the strength of supervised learning (KNN and RF) to identify the most relevant features, ultimately enhancing model performance.
Clustering is an unsupervised machine-learning technique that groups data points into clusters based on similarity. Common clustering algorithms include centroid-based (e.g., K-means), density-based (e.g., DBSCAN), and hierarchical clustering approaches [9,10,11,12]. The K-means algorithm is popular due to its simplicity and efficiency. There are several variations of K-means [13], which primarily differ in how they initialize or update the centroids (cluster centers). This work focuses on the standard K-means approach, where the K centroids are randomly selected from the N data points in the dataset.
The K-means algorithm iteratively assigns data points to K pre-defined clusters based on their proximity to the cluster centroids (mean of the points within the cluster). The process involves initialization (randomly placing K centroids), data point assignment (assigning each data point to the closest centroid), centroid update (recalculating the centroid based on the assigned points), and convergence criteria (stopping when centroids no longer significantly change) [14,15,16,17,18,19].
Recent research explores the potential of K-means clustering for data reduction by leveraging cluster membership as a new feature [20,21]. This approach captures the inherent structure of the data within the cluster membership, potentially leading to improved model performance. However, interpretability limitations exist, as cluster labels might not directly correspond to the underlying data characteristics [22,23].
Feature selection aims to identify a subset of the most relevant features from the original data. This improves model performance by reducing overfitting, enhancing interpretability, and reducing computational complexity [3]. Feature selection methods can be categorized into filter methods (e.g., Chi-square test, Information Gain), wrapper methods (e.g., Recursive Feature Elimination), and embedded methods (e.g., LASSO regression) [6,24,25,26,27].
KNN is a supervised non-parametric instance-based learning algorithm commonly used for classification tasks. It assigns a class label to a new data point based on the majority vote of its K-Nearest Neighbors in the training data. The choice of K value and distance metric significantly impacts KNN performance [28].
Common KNN performance evaluation metrics include accuracy, precision, recall, F1-score, and AUC-ROC curves. Accuracy measures the proportion of correctly classified instances. Precision reflects the ratio of true positives among predicted positives, while recall indicates the proportion of true positives identified. F1-score is a harmonic mean of precision and recall, providing a balanced view of model performance. The AUC-ROC curve depicts the relationship between true positive rate and false positive rate, offering a comprehensive evaluation of the model’s ability to discriminate between classes [29,30,31]. Furthermore, Random Forest is a common model that is used for feature reduction in supervised learning techniques, see, e.g., [32,33].
Existing research demonstrates the effectiveness of combining unsupervised and supervised methods for data reduction, particularly in the context of high-dimensional data. Several studies utilize clustering for feature selection [22,23]. These approaches often group features based on similarity and select representative features from each cluster. Additionally, clustering is employed before classification tasks [28,34,35]. For instance, K-means clustering can be used to label data for anomaly detection or network intrusion detection [36].
Beyond traditional dimensionality reduction techniques, recent advancements in deep learning have introduced powerful new approaches for handling high-dimensional data. Deep generative models, in particular, have shown remarkable capabilities in both feature extraction and dimensionality reduction while preserving essential data characteristics. Generative Adversarial Networks (GANs) represent one such innovation, where the interplay between generator and discriminator networks enables the learning of complex data distributions in lower-dimensional latent spaces. Research on LD-GAN [37] proposed a low-dimensional GAN specifically designed for spectral image generation that effectively reduces dimensionality while maintaining spectral fidelity. Variational Autoencoders (VAEs) offer another compelling approach, as they learn a probabilistic mapping between the original data space and a lower-dimensional latent representation. Studies on VAE applications in game design [38] have demonstrated their effectiveness in processing and transforming image data, where high-dimensional visual information is efficiently compressed while preserving key features necessary for interactive applications. The work on Deep Convolutional K-Means Clustering [39] presents a framework that integrates convolutional neural network (CNN) architectures with K-means clustering to achieve superior performance in feature extraction while significantly reducing dimensions. This approach is particularly relevant to our research as it similarly bridges supervised and unsupervised learning paradigms. Similarly, other hybrid CNN-K-means approaches [40] showcase how these combined methods can extract optimized features from high-dimensional data while improving energy efficiency in resource-constrained environments.
Transformative innovations have also emerged through various approaches that combine deep learning with traditional dimensionality reduction techniques. Research on ClusterGAN [41] demonstrates how Generative Adversarial Networks can be enhanced with clustering capabilities in the latent space, enabling simultaneous generation and clustering of data in a lower-dimensional manifold. While these deep learning approaches offer impressive capabilities, they typically require substantial computational resources and large amounts of training data to achieve optimal performance. Additionally, the interpretability of the resulting low-dimensional representations often presents challenges compared to more traditional methods. Our proposed hybrid approach, focusing on clustering-based feature extraction combined with KNN-based feature selection, offers a more computationally accessible alternative while maintaining interpretability, making it particularly suitable for analytical contexts where explainability is paramount alongside dimensionality reduction.
There is a lack of research on the scope of combining feature reduction techniques in unsupervised learning problems. In unsupervised learning, where target features are absent, evaluating prediction performance and assessing its efficacy using metrics like accuracy, precision, recall, and F1-score becomes more intricate compared to supervised learning scenarios. Therefore, our innovative approach aims to incorporate supervised learning capabilities into unsupervised datasets. The novel method encompasses a key concept, which is the conversion of the unsupervised dataset into a supervised one through the following steps:
- Performing the K-means algorithm by using the optimal number of clusters K based on the elbow method or any other method; see, e.g., [42,43].
- Introduction of a new feature and assignment of the cluster label (k) to each observation. This assignment effectively transforms the dataset into a supervised one with a designated target, facilitating the computation of performance metrics such as accuracy, precision, recall, and F1-score.
- Evaluate each feature impact/contribution on the overall cost measurement, calculated as the sum of squared errors to the data centroid (i.e., the feature vector when k = 1).
The combination of the order list of impact/ratio features (see item 3 above) with the ability to measure the impact of reducing a candidate feature on user requirements, such as the impact on accuracy (see 2 above) and the impact of the clusters’ distribution (see 1 above), allows for the control and management of feature reduction based on user needs and to support many use cases and datasets.
2. Method
A novel methodology was designed, developed, and executed to investigate and validate the innovative approach outlined in the previous section. The accompanying pseudocode delineates the method’s procedural implementation.
The list below provides some definitions and notations.
- Dataset D contains n observations, , and d features, i.e., .
- For each feature , denote its mean by , , and let . Define , where is the value of feature j in observation i, and , . Note that E is the sum of squared distances from the mean values of the features.
- In the context of the K-means algorithm, we denote cluster k by and its centroid by , for . The total K-means cost is given by .
- Examples of the stopping conditions set by the user are the following:
- d*—maximum number of features that can be reduced from D.
- A*—maximum percentage of accuracy reduction relative to the accuracy achieved when utilizing all features. Accuracy can be assessed through various components derived from a confusion matrix, such as precision, recall, or F1 score.
- Users have the flexibility to incorporate and define additional stopping conditions
The algorithm includes the following steps:
- Load dataset D (an unsupervised dataset, i.e., no target variable)
- Normalize dataset D (via MinMaxScaler using Sklearn)
- Calculate E.
- Determine the optimal number of clusters (K) for dataset D utilizing the Elbow and Silhouette methods
- Calculate K-means performance measures, such as the total cost SSE, silhouette, centroid vectors, cluster members, etc.
- Based on the outcomes yielded by the K-means algorithm, create a new feature within dataset D to signify clusters, and allocate to each observation its respective cluster value [44]. This action shifts the problem from the domain of unsupervised learning to that of supervised learning.
- Split the dataset D into a training set and a test set and perform the KNN algorithm with k = 5 (note: future research can use, examine, modify, and adjust different values of k). That is, assign each observation in the test set to a class according to the class of its 5 nearest observations from the training set. Also, perform RF (Random Forest) with n_estimators = 25. Note that the test and train sets are split up the same way, with the same random seed the entire process.
- Compute the corresponding confusion matrix measures (accuracy, precision, recall, and F1) derived from the KNN and Random Forest.
- For each feature j, compute its importance level, defined by , and order all importance levels from low to high.
- While the stopping criteria = FALSE, do:
- Remove feature m from D if , that is, remove the feature with the lowest importance level.
- Perform the K-means algorithm on the new dataset (with one less feature) with the same K derived from the Elbow and Silhouette methods (step 5) and calculate the relevant performance measures mentioned in step 5.
- Run steps 6, 7, 8, and 9.
Calculate the percentage reduction in accuracy relative to the accuracy achieved when utilizing all features’ new accuracy.
- 11.
- Return the following outputs: the total cost SSE of the K-means algorithm, the number of members in each cluster, confusion matrix measures of the KNN and RF methods, and the number of features remaining in the dataset D.
The implantation of the above method was conducted via Python 3.12.7 code with the following libraries:
- Pandas 2.2.2 [44,45]
- NumPy 1.26.4 [46]
- Sklearn 1.5.1 (few functions) [47]
- Matplotlib 3.9.2 [48]
Note that the method can be implemented using different code languages. Furthermore, we wish to emphasize that the suggested method specifically addresses dimensionality reduction in unsupervised contexts, regardless of whether the original datasets contained target variables. In our experimental design, we intentionally treated all datasets as unsupervised by omitting any existing class variables. This approach allowed us to evaluate our method’s effectiveness in scenarios where no predefined labels exist. Even for datasets that originally contained target variables, we deliberately excluded these labels and generated new cluster-based class assignments through K-means clustering.
This design choice aligns with our focus on developing a method that can work effectively without relying on predefined labels, which is particularly valuable in real-world scenarios where labeled data may be unavailable. The key innovation of our approach is precisely this ability to transform an unsupervised problem into a supervised one through clustering, thereby enabling more effective feature selection.
In addition, note that the suggested method differs fundamentally from conventional dimensionality reduction techniques in both methodology and objective. Traditional methods like PCA, t-SNE, or UMAP typically transform the feature space while preserving certain data properties (variance, local structure, etc.). In contrast, our method creates a novel unsupervised learning framework through clustering and then performs feature selection within this framework.
The key distinction is that our approach generates labels through K-means clustering and validates them using KNN classification—essentially creating a new supervised task that does not exist in the original (unsupervised) data. This makes direct performance comparisons with traditional dimensionality reduction techniques potentially misleading, as these methods:
- Do not generate class labels as part of their process
- Are not designed to optimize for the cluster-based classification task we have constructed.
- Often transform features rather than select them, which impacts interpretability differently
Our contribution lies in this novel hybrid approach that bridges unsupervised and supervised learning paradigms for feature selection. The evaluation metric (KNN performance on cluster labels) is intrinsically tied to our methodology rather than being a universal benchmark applicable across all dimensionality reduction techniques.
Additionally, we have included Random Forest as another classification method to validate the influence on accuracy and other performance measures after feature removal, not solely relying on KNN. This additional evaluation strengthens our findings regarding the effectiveness of our feature selection approach across different classification paradigms. We also note that the removal of non-numeric features was a methodological choice made to maintain focus on the core contribution of our paper: the hybrid feature selection approach combining unsupervised clustering with supervised learning. The handling of categorical and textual data through various encoding methods, while important, falls outside the scope of our current research objectives.
As for the complexity of this method, note that the complexity of K-means is O(t·K·n·d), where
- t = number of iterations until convergence
- K = number of clusters
- n = number of data points
- d = number of features
The Elbow Method for Optimal K requires running K-means multiple times with different K values, resulting in O(K_max2·t_avg·n·d), where K_max is the maximum number of clusters tested, and t_avg is the average number of iterations across all K values. As for the Feature Importance Calculation, computing the importance metric (ratio of feature distance to total distance) for each feature is O(n·d). Furthermore, KNN has a prediction complexity of O(n·d) per test point, while Random Forest has a training complexity of approximately O(m·n·log(n)·√d), where m is the number of trees (25 in this paper). The iterative feature removal process repeats these steps up to d times (once per feature). In the worst case, this process removes one feature at a time, requiring O(d) iterations of the above steps. Therefore, the overall time complexity is dominated by the repetitive application of K-means and the classifiers in the iterative feature removal process, resulting in approximately O(d3·t·K·n) in the worst case. While the worst-case complexity is O(d3·t·K·n), the average case is closer to O(d2·t·K·n), since most real-world datasets do not require removing features one by one until they reach the minimum. The early stopping criteria typically halt the process after removing a fraction of features.
3. Datasets
The implementation of our hybrid dimensionality reduction procedure was tested on 13 diverse datasets from the UCI Machine Learning Repository. Table 1 presents the key characteristics of these datasets.

Table 1.
Summary of datasets.
All datasets were downloaded from the UCI Machine Learning Repository (https://archive.ics.uci.edu/), accessed on 10 March 2024. Preprocessing steps included the removal of non-numerical features, identifier columns (e.g., “caseid” from US Census Data), and existing target variables to ensure consistent treatment as unsupervised datasets in our experimental framework.
4. Results
4.1. Use Case 1—Results
We start the analysis with the dataset “Taiwanese Bankruptcy”. This dataset includes 6819 rows (observations) and 96 features. We remove the “Bankrupt?” feature and remain with 95 numerical features. We perform the elbow method; its results are presented in Figure 1.
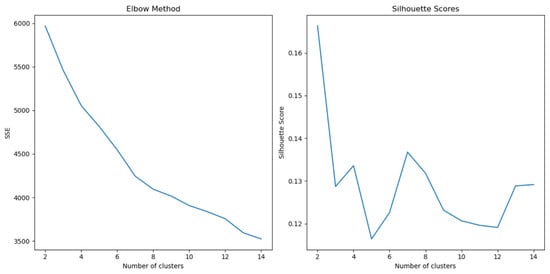
Figure 1.
Elbow and Silhouette plots for the “Taiwanese Bankruptcy” dataset.
Based on the Elbow and Silhouette plots analysis, K = 7 is selected for the K-means clustering procedure. Note that there are a few methods that examine the efficient clustering methods, number of clusters (in K-means), and analysis of the optimum K values in KNN, such as, [2,42,43]. These aspects are beyond the scope of this research.
Subsequently, a new feature is incorporated into the dataset, assigning each observation its respective cluster value. Following this, according to step 10 of the algorithm, a feature is systematically removed from the dataset, followed by iterative cycles of K-means clustering, dataset update, and KNN and RF classification, as outlined in the preceding section. The results are summarized in Table 2. It is observed that through this iterative process, the dataset is eventually reduced to 10 features from the original 95, while the performance (for all measurements such as accuracy recall, F1, etc.) of both models (KNN and RF) increases.
Table 2.
Algorithm results for “Taiwanese Bankruptcy”.
As presented in Table 2, all examined measurements improved; for example, KNN accuracy enhanced by more than 2.7%, from 0.925513 on the “original” 95 features to 0.953079 with 7 features.
4.2. Use Case 2—Results
The next dataset to be analyzed is called “gas turbine co and nox emission”. After removing non-numerical features, it contains 36,733 observations and 11 features. Again, using the elbow method (see Figure 2), we perform K-means, this time with K = 5.
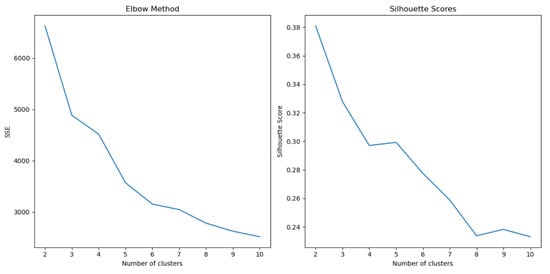
Figure 2.
Elbow and Silhouette plots for the “gas turbine co and nox emission” dataset.
Table 3 presents the measurements of both KNN and RF models. Once again, the performance was improved in all tests; for example, the KNN precision improved from 0.972116 with 11 features to 0.989788 with 5 features.
Table 3.
Algorithm results for “gas turbine co and nox emission” dataset.
4.3. Result Summary
Table 4 presents a summary of 13 dataset results. Each experiment contains two model analyses (KNN and RF) on a variety of measures (recall, F1, etc.).
Table 4.
Summary table.
Each dataset in Table 4 contains two rows per dataset: the first row presents the analysis of the “original” full dataset (with all the Features after preprocessing); for example, in the case of the WineQualitywhite dataset, the full analysis was performed on 11 features after preprocessing. The second row presents the “reduced” dataset results after the method analysis; for example, in the WineQualitywhite use case, the second row describes the results on three features.
Analysis of Table 5 reveals compelling results across our dataset experiments. In nine datasets (the first nine rows), we observed performance improvements despite using fewer features. For the remaining four datasets (the last four rows), we achieved substantial feature reduction with only negligible performance decreases. For instance, in the ‘Anuran Calls’ dataset, we reduced the feature count by nearly 60% (from 22 to 9 features) while sacrificing only 0.33% in KNN accuracy.
Table 5.
Results analysis.
In our computational performance analysis, the US Census dataset (comprising 2.5 million records with 69 features) presented substantial computational challenges. Processing a representative sample of 100,000 records (4% of the total dataset) required approximately one hour of computation time on a MacBook M3Pro with 11 cores and 18 GB RAM. Extrapolation suggests that processing the complete dataset would require substantial computational resources exceeding typical workstation capabilities, particularly regarding memory constraints. For practical implementations with datasets of this magnitude, we recommend employing: (1) stratified sampling techniques to identify discriminative features before full-scale application, (2) distributed computing frameworks to parallelize computational tasks, or (3) high-performance cloud computing environments with sufficient memory allocation. These approaches would enable practitioners to leverage the analytical advantages of our method while mitigating the inherent computational complexity when scaling to datasets containing millions of records.
It is worth emphasizing that in many real-world scenarios, depending on specific business requirements, data quality considerations, organizational goals, and computational constraints, a slight trade-off may be entirely acceptable when accompanied by significant feature reduction. Such dimensional efficiency can substantially reduce model complexity, improve interpretability, decrease computational overhead, and potentially enable enhanced service offerings through the freed computational resources.
5. Conclusions and Discussion
In an era of emerging AI, where data analysis is pivotal, the ability to select relevant features for specific use cases within a company or organization can significantly impact the outcomes of AI processes.
Specifically, as presented in the paper, constructing a measurement matrix for an unsupervised learning dataset enables us to assess the effects of feature reduction on the dataset.
The novel methods outlined in this paper, designed, executed, and tested across 13 distinct datasets, showcase the following advantages:
- Enable the “transfer” of an unsupervised dataset/use-case to a supervised dataset with a target feature, while still retaining relevance to unsupervised functionalities, such as clustering methods.
- Enable users to define stopping conditions based on the specific requirements and needs of their company or organization. The objective is for users to determine the appropriate termination point for the method to ensure it meets their criteria effectively.
- Demonstrate the capability to analyze the impact of each feature by considering the ratio of its distance measure and the total dataset distance measure through unsupervised clustering (that is, using the ratio of the feature “cost” with the total cost.).
- A significant advantage of the proposed method is its agnosticism, making it effectively applicable to both supervised and unsupervised use cases. This agnostic nature is demonstrated through the research analysis conducted on distinct unsupervised datasets, such as the US Census Data (1990) and the Gas Turbine CO and NOx Emission [55], which are clustering-oriented and lack classification or target features. Furthermore, the method’s efficacy is also exhibited, analyzed, and examined on various supervised datasets, including the Taiwanese Bankruptcy Prediction [52] and the red and white wine quality datasets [54]. This ability to support analysis across diverse dataset types, irrespective of their designation as supervised or unsupervised, and without reliance on the presence of a target or label column, presents users with expanded opportunities to explore and evaluate the method’s applicability in various scenarios tailored to specific business and organizational requirements.
This research marks the initial phase of further experiments, which should encompass additional use cases and datasets. Future analyses should explore new conditions and combinations thereof, all while addressing user requirements.
Author Contributions
Conceptualization, D.G. and O.K.; methodology, N.P. and O.K.; software, D.G.; validation, D.G.; formal analysis, N.P. and O.K.; investigation, N.P. and O.K.; resources, O.K.; data curation, D.G.; writing—original draft preparation, N.P. and O.K.; writing—review and editing, D.G., N.P. and O.B.; visualization, D.G.; supervision, N.P.; project administration, N.P. All authors have read and agreed to the published version of the manuscript.
Funding
This research received no external funding.
Data Availability Statement
The data presented in this study are available in the UCI Machine Learning Repository at https://archive.ics.uci.edu, accessed on 10 March 2024, as appearing in the reference list.
Conflicts of Interest
The authors declare no conflicts of interest.
Abbreviations
The following abbreviations are used in this manuscript:
| KNN | K-Nearest Neighbors |
| RF | Random Forest |
| GAN | Generative Adversarial Networks |
| VAE | Variational Autoencoders |
| CNN | convolutional neural network |
References
- James, G.; Witten, D.; Hastie, T.; Tibshirani, R. An Introduction to Statistical Learning; Springer: Berlin/Heidelberg, Germany, 2013; Volume 112. [Google Scholar]
- Gnana, D.A.A.; Balamurugan, S.A.A.; Leavline, E.J. Literature review on feature selection methods for high-dimensional data. Int. J. Comput. Appl. 2016, 136, 9–17. [Google Scholar]
- Guyon, I.; Elisseeff, A. An introduction to variable and feature selection. J. Mach. Learn. Res. 2003, 3, 1157–1182. [Google Scholar]
- Zeng, H.; Cheung, Y.M. Feature selection for clustering on high dimensional data. In Pacific Rim International Conference on Artificial Intelligence; Springer: Berlin/Heidelberg, Germany, 2008; pp. 913–922. [Google Scholar]
- Liu, T.; Lu, Y.; Zhu, B.; Zhao, H. Clustering high-dimensional data via feature selection. Biometrics 2023, 79, 940–950. [Google Scholar] [CrossRef]
- Alimoussa, M.; Porebski, A.; Vandenbroucke, N.; Thami, R.O.H.; El Fkihi, S. Clustering-based sequential feature selection approach for high dimensional data classification. In VISIGRAPP (4: VISAPP); Scitepress: Setúbal, Portugal, 2021; pp. 122–132. [Google Scholar]
- Chormunge, S.; Jena, S. Correlation based feature selection with clustering for high dimensional data. J. Electr. Syst. Inf. Technol. 2018, 5, 542–549. [Google Scholar] [CrossRef]
- Song, Q.; Ni, J.; Wang, G. A fast clustering-based feature subset selection algorithm for high-dimensional data. IEEE Trans. Knowl. Data Eng. 2011, 25, 1–14. [Google Scholar]
- Sinaga, K.P.; Yang, M.S. Unsupervised K-means clustering algorithm. IEEE Access 2020, 8, 80716–80727. [Google Scholar]
- Xu, R.; Wunsch, D. Survey of clustering algorithms. IEEE Trans. Neural Netw. 2005, 16, 645–678. [Google Scholar]
- Saxena, A.; Prasad, M.; Gupta, A.; Bharill, N.; Patel, O.P.; Tiwari, A.; Er, M.J.; Ding, W.; Lin, C.T. A review of clustering techniques and developments. Neurocomputing 2017, 267, 664–681. [Google Scholar]
- Bock, H.H. Clustering methods: A history of k-means algorithms. In Selected Contributions in Data Analysis and Classification; Springer: Berlin/Heidelberg, Germany, 2007; pp. 161–172. [Google Scholar]
- Yu, S.S.; Chu, S.W.; Wang, C.M.; Chan, Y.K.; Chang, T.C. Two improved k-means algorithms. Appl. Soft Comput. 2018, 68, 747–755. [Google Scholar] [CrossRef]
- Shi, C.; Wei, B.; Wei, S.; Wang, W.; Liu, H.; Liu, J. A quantitative discriminant method of elbow point for the optimal number of clusters in clustering algorithm. EURASIP J. Wirel. Commun. Netw. 2021, 2021, 31. [Google Scholar] [CrossRef]
- Dinh, D.T.; Fujinami, T.; Huynh, V.N. Estimating the optimal number of clusters in categorical data clustering by silhouette coefficient. In Knowledge and Systems Sciences: 20th International Symposium, KSS 2019; Springer: Singapore, 2019; pp. 1–17. [Google Scholar]
- Kingrani, S.K.; Levene, M.; Zhang, D. Estimating the number of clusters using diversity. Artif. Intell. Res. 2018, 7, 15–22. [Google Scholar]
- Ünlü, R.; Xanthopoulos, P. Estimating the number of clusters in a dataset via consensus clustering. Expert Syst. Appl. 2019, 125, 33–39. [Google Scholar] [CrossRef]
- Mamat, A.R.; Mohamed, F.S.; Mohamed, M.A.; Rawi, N.M.; Awang, M.I. Silhouette index for determining optimal k-means clustering on images in different color models. Int. J. Eng. Technol. 2018, 7, 105–109. [Google Scholar] [CrossRef]
- Wang, X.; Xu, Y. An improved index for clustering validation based on Silhouette index and Calinski-Harabasz index. In IOP Conference Series: Materials Science and Engineering; IOP Publishing: Bristol, UK, 2019; Volume 569, p. 052024. [Google Scholar] [CrossRef]
- Behura, A. The cluster analysis and feature selection: Perspective of machine learning and image processing. In Data Analytics in Bioinformatics: A Machine Learning Perspective; WILEY: Hoboken, NJ, USA, 2021; pp. 249–280. [Google Scholar]
- Li, S.; Zhu, J.; Feng, J.; Wan, D. Clustering-based feature selection for content based remote sensing image retrieval. In Image Analysis and Recognition: 9th International Conference, ICIAR 2012; Springer: Berlin/Heidelberg, Germany, 2012; pp. 427–435. [Google Scholar]
- Czarnowski, I. Cluster-based instance selection for machine classification. Knowl. Inf. Syst. 2012, 30, 113–133. [Google Scholar] [CrossRef]
- Gallego, A.J.; Calvo-Zaragoza, J.; Valero-Mas, J.J.; Rico-Juan, J.R. Clustering-based k-nearest neighbor classification for large-scale data with neural codes representation. Pattern Recognit. 2018, 74, 531–543. [Google Scholar]
- Rezaei, M.; Cribben, I.; Samorani, M. A clustering-based feature selection method for automatically generated relational attributes. Ann. Oper. Res. 2020, 286, 1–37. [Google Scholar] [CrossRef]
- Xu, D.; Zhang, J.; Xu, H.; Zhang, Y.; Chen, W.; Gao, R.; Dehmer, M. Multi-scale supervised clustering-based feature selection for tumor classification and identification of biomarkers and targets on genomic data. BMC Genom. 2020, 21, 1–17. [Google Scholar] [CrossRef]
- Moslehi, F.; Haeri, A. A novel feature selection approach based on clustering algorithm. J. Stat. Comput. Simul. 2021, 91, 581–604. [Google Scholar] [CrossRef]
- Solorio-Fernández, S.; Carrasco-Ochoa, J.A.; Martínez-Trinidad, J.F. A new hybrid filter-wrapper feature selection method for clustering based on ranking. Neurocomputing 2016, 214, 866–880. [Google Scholar] [CrossRef]
- Tan, P.-N.; Steinbach, M.; Kumar, V. Introduction to Data Mining; Addison-Wesley: Boston, MA, USA, 2005. [Google Scholar]
- Ding, C.; Li, T. Adaptive dimension reduction using discriminant analysis and K-means clustering. In ACM International Conference Proceeding Series; ACM: New York, NY, USA, 2007; Volume 227, pp. 521–528. [Google Scholar] [CrossRef]
- Chao, G.; Luo, Y.; Ding, W. Recent advances in supervised dimension reduction: A survey. Mach. Learn. Knowl. Extr. 2019, 1, 341–358. [Google Scholar] [CrossRef]
- Nanga, S.; Bawah, A.T.; Acquaye, B.A.; Billa, M.-I.; Baeta, F.D.; Odai, N.A.; Obeng, S.K.; Nsiah, A.D. Review of dimension reduction methods. J. Data Anal. Inf. Process. 2021, 9, 189–231. [Google Scholar] [CrossRef]
- Chen, R.C.; Dewi, C.; Huang, S.W.; Caraka, R.E. Selecting critical features for data classification based on machine learning methods. J. Big Data 2020, 7, 52. [Google Scholar] [CrossRef]
- Iranzad, R.; Liu, X. A review of random forest-based feature selection methods for data science education and applications. Int. J. Data Sci. Anal. 2024, 1–15. [Google Scholar] [CrossRef]
- Leng, M.; Li, L.; Chen, X. K-means clustering algorithm based on semi-supervised learning. In Proceedings of the 2008 International Conference on Computer Science and Software Engineering, Wuhan, China, 12–14 December 2008; Volume 1, pp. 1112–1115. [Google Scholar]
- Shukla, A.; Singh, G.; Anand, C.S. Semi-supervised clustering with neural networks. Neural Comput. Appl. 2020, 33, 4513–4530. [Google Scholar]
- Oyewole, G.J.; Thopil, G.A. Data clustering: Application and trends. Artif. Intell. Rev. 2023, 56, 6439–6475. [Google Scholar] [CrossRef] [PubMed]
- Martinez, E.; Jacome, R.; Hernandez-Rojas, A.; Arguello, H. Ld-gan: Low-dimensional generative adversarial network for spectral image generation with variance regularization. In Proceedings of the IEEE/CVF Conference on Computer Vision and Pattern Recognition, Vancouver, BC, Canada, 18–22 June 2023; pp. 265–275. [Google Scholar]
- Mak, H.W.L.; Han, R.; Yin, H.H. Application of variational autoEncoder (VAE) model and image processing approaches in game design. Sensors 2023, 23, 3457. [Google Scholar] [CrossRef]
- Goel, A.; Majumdar, A.; Chouzenoux, E.; Chierchia, G. Deep convolutional k-means clustering. In Proceedings of the 2022 IEEE International Conference on Image Processing (ICIP), Bordeaux, France, 16–19 October 2022; pp. 211–215. [Google Scholar]
- Bisen, D.; Lilhore, U.K.; Manoharan, P.; Dahan, F.; Mzoughi, O.; Hajjej, F.; Saurabh, P.; Raahemifar, K. A hybrid deep learning model using CNN and K-Mean clustering for energy efficient modelling in mobile EdgeIoT. Electronics 2023, 12, 1384. [Google Scholar] [CrossRef]
- Feigin, Y.; Spitzer, H.; Giryes, R. Cluster with gans. Comput. Vis. Image Underst. 2022, 225, 103571. [Google Scholar]
- Koren, O.; Hallin, C.A.; Koren, M.; Issa, A.A. AutoML classifier clustering procedure. Int. J. Intell. Syst. 2022, 37, 4214–4232. [Google Scholar] [CrossRef]
- Koren, O.; Koren, M.; Sabban, A. AutoML-Optimal K procedure. In Proceedings of the 2nd International Conference on Advanced Enterprise Information Systems (AEIS 2022), London, UK, 2–4 December 2022; pp. 110–119. [Google Scholar] [CrossRef]
- Reback, J.; McKinney, W.; Jbrockmendel; Den Bossche, J.V.; Augspurger, T.; Cloud, P.; Hawkins, S.; Gfyoung; Sinhrks; Roeschke, M.; et al. Pandas-Dev/Pandas: Pandas 1.0.5; Zenodo: Genève, Switzerland, 2020. [Google Scholar] [CrossRef]
- McKinney, W. Data structures for statistical computing in Python. In Proceedings of the 9th Python in Science Conference, Austin, TX, USA, 28 June–3 July 2010; pp. 56–61. [Google Scholar] [CrossRef]
- Harris, C.R.; Millman, K.J.; van der Walt, S.J.; Gommers, R.; Virtanen, P.; Cournapeau, D.; Wieser, E.; Taylor, J.; Berg, S.; Smith, N.J.; et al. Array programming with NumPy. Nature 2020, 585, 357–362. [Google Scholar] [CrossRef]
- Pedregosa, F.; Varoquaux, G.; Gramfort, A.; Michel, V.; Thirion, B.; Grisel, O.; Blondel, M.; Prettenhofer, P.; Weiss, R.; Dubourg, V.; et al. Scikit-learn: Machine learning in Python. J. Mach. Learn. Res. 2011, 12, 2825–2830. [Google Scholar]
- Hunter, J.D. Matplotlib: A 2D graphics environment. Comput. Sci. Eng. 2007, 9, 90–95. [Google Scholar] [CrossRef]
- Meek, C.; Thiesson, B.; Heckerman, D. US Census Data (1990) [Dataset]. UCI Machine Learning Repository. Available online: https://archive.ics.uci.edu/dataset/116/us+census+data+1990 (accessed on 10 March 2024).
- Taiwanese Bankruptcy Prediction [Dataset]; UCI Machine Learning Repository: Irvine, CA, USA, 2020. [CrossRef]
- Colonna, J.; Nakamura, E.; Cristo, M.; Gordo, M. Anuran Calls (MFCCs) [Dataset]; UCI Machine Learning Repository: Irvine, CA, USA, 2015. [Google Scholar] [CrossRef]
- Cortez, P.; Cerdeira, A.; Almeida, F.; Matos, T.; Reis, J. Wine quality [Dataset]; UCI Machine Learning Repository: Irvine, CA, USA, 2009. [Google Scholar] [CrossRef]
- Kaya, H.; Tüfekci, P. Gas Turbine CO and NOx Emission Data Set [Dataset]; UCI Machine Learning Repository: Irvine, CA, USA, 2019. [Google Scholar] [CrossRef]
- Lyon, R. HTRU2 [Dataset]; UCI Machine Learning Repository: Irvine, CA, USA, 2015. [Google Scholar] [CrossRef]
- Image Segmentation [Dataset]; UCI Machine Learning Repository: Irvine, CA, USA, 1990. [CrossRef]
- Slate, D. Letter Recognition [Dataset]; UCI Machine Learning Repository: Irvine, CA, USA, 1991. [Google Scholar] [CrossRef]
- Estimation of Obesity Levels Based on Eating Habits and Physical Condition [Dataset]; UCI Machine Learning Repository: Irvine, CA, USA, 2019. [CrossRef]
- Sakar, C.; Kastro, Y. Online Shoppers Purchasing Intention Dataset [Dataset]; UCI Machine Learning Repository: Irvine, CA, USA, 2018. [Google Scholar] [CrossRef]
- Renjith, S. Travel Reviews [Dataset]; UCI Machine Learning Repository: Irvine, CA, USA, 2018. [Google Scholar] [CrossRef]
- Breiman, L.; Stone, C. Waveform Database Generator (Version 1) [Dataset]; UCI Machine Learning Repository: Irvine, CA, USA, 1984. [Google Scholar] [CrossRef]
Disclaimer/Publisher’s Note: The statements, opinions and data contained in all publications are solely those of the individual author(s) and contributor(s) and not of MDPI and/or the editor(s). MDPI and/or the editor(s) disclaim responsibility for any injury to people or property resulting from any ideas, methods, instructions or products referred to in the content. |
© 2025 by the authors. Licensee MDPI, Basel, Switzerland. This article is an open access article distributed under the terms and conditions of the Creative Commons Attribution (CC BY) license (https://creativecommons.org/licenses/by/4.0/).