Abstract
Nowadays, Artificial Intelligence (AI) has revolutionized many fields and the medical field is no exception. Thanks to technological advancements and the emergence of Deep Learning (DL) techniques AI has brought new possibilities and significant improvements to medical practice. Despite the excellent results of DL models in terms of accuracy and performance, they remain black boxes as they do not provide meaningful insights into their internal functioning. This is where the field of Explainable AI (XAI) comes in, aiming to provide insights into the underlying workings of these black box models. In this present paper the visual explainability of deep models on chest radiography images are addressed. This research uses two datasets, the first on COVID-19, viral pneumonia, normality (healthy patients) and the second on pulmonary opacities. Initially the pretrained CNN models (VGG16, VGG19, ResNet50, MobileNetV2, Mixnet and EfficientNetB7) are used to classify chest radiography images. Then, the visual explainability methods (GradCAM, LIME, Vanilla Gradient, Gradient Integrated Gradient and SmoothGrad) are performed to understand and explain the decisions made by these models. The obtained results show that MobileNetV2 and VGG16 are the best models for the first and second datasets, respectively. As for the explainability methods, the results were subjected to doctors and were validated by calculating the mean opinion score. The doctors deemed GradCAM, LIME and Vanilla Gradient as the most effective methods, providing understandable and accurate explanations.
1. Introduction
Recently the emergence of artificial intelligence and the advances of the digital revolution have considerably transformed various sectors, including healthcare. In the medical field, the use of deep learning, in particular convolutional neural networks (CNNs), has opened up new perspectives in the classification of medical images, such as chest X-rays. These technological advances have resulted in impressive classification performances, rivaling even those of human experts. However, one of the major challenges associated with the use of these deep learning models is their opacity and lack of explainability. The decisions made by these models often remain difficult to understand, which limits their adoption in critical fields such as medicine.
The need to understand and explain the decisions made by deep learning models in the medical field has given rise to a new field of research called “Explainability of Artificial Intelligence” (XAI). The main aim of XAI is to provide understandable and interpretable explanations of the results obtained by deep learning models, enabling doctors and healthcare professionals to understand the reasons behind these decisions. The central problem of this research is therefore: How can the results obtained by deep learning models applied to the classification of chest X-rays be explained in a clear and comprehensible way? How can the decisions made by these models be made transparent and justifiable to physicians? To address this issue, particular attention is paid to visual explainability methods. These methods aim to identify and highlight regions of interest in an image that have been decisive for the classification performed by deep learning models. By providing a clear visualization of the influential areas, these methods enable physicians to understand the underlying reasons for the model’s decision and verify its validity.
The main objective of this research is to explore visual explainability methods in the context of chest X-ray classification using deep learning models. Other sub-objectives include the following:
- Classify chest X-ray images using deep learning models, specifically convolutional neural networks (CNNs).
- Apply deep learning methods to two different datasets and analyze the results obtained.
- Compare the performance of the different explainability methods used.
- Highlight the importance of explainability in the medical field.
2. Related Work
This section describes recent works on XAI. Authors [1] discuss the need to develop automatic COVID-19 detection systems to ease the workload of healthcare professionals in hospitals. COVID-19 is an epidemic that has affected almost every country in the world, causing enormous health, financial and emotional devastation, as well as the collapse of healthcare systems in some countries. Diagnosis of COVID-19, non-COVID-19 viral pneumonia and other lung opacities can be difficult on radiological images. The authors therefore use artificial intelligence to develop an automated detection system for COVID-19 from normal chest X-ray images. Using transfer learning, the authors ran three pre-trained models (Xception, VGG19 and ResNet50) on a reference dataset of 21,165 images. They first formulated the COVID-19 detection problem as a binary classification problem to classify COVID-19 against normal radiographic images. The results showed an accuracy of 97.5%, 97.5% and 93.3% for Xception, VGG19 and ResNet50, respectively. Next, they developed a multiclass classification model to differentiate COVID-19 from normal radiographic images, lung opacities and non-COVID-19 viral pneumonia. Results showed an accuracy of 75% for ResNet50, 92% for VGG19 and 93% for Xception. Although the performance of Xception and VGG19 were identical, Xception proved more effective with its higher precision, recall and F-1 scores. In addition, the authors employed GradCAM as an explainable AI on each model used, adding interpretability to the study. The results showed that Xception is more accurate at indicating the actual features that are responsible for a model’s predictions. This addition of explainable AI can greatly help healthcare professionals by enabling them to visualize how a model makes its decision and not have to blindly trust the machine learning models developed.
Paper [2] describes the use of machine learning for the detection of COVID-19 patients from CT scans and chest X-ray images. Authors used several pre-trained models to achieve this goal, including MobileNetV2, VGG16, InceptionV3, InceptionResNetV2, ResNet50, Xception, EfficientNetB0, EfficientNetB2 and EfficientNetB4. They created a dataset of 2753 CT scan and chest X-ray images from COVID-19 and healthy patients. They used the data augmentation technique to increase the size of the dataset and improve model performance. The results showed that the MobileNetV2-based model performed best in terms of precision (97.69%), recall (98.97%), F1 score (97.06%) and ROC curve (0.9926). The VGG16-based model also performed well, with precision of 96.61%, recall of 97.67%, F1 score of 96.1% and ROC curve of 0.9874. Models based on InceptionV3, InceptionResNetV2, ResNet50, Xception, EfficientNetB0, EfficientNetB2 and EfficientNetB4 also showed reasonable performance, with precision, recall and F1 scores above 90%. In addition, the authors used the LIME interpretability method to understand the most important features in the models’ detection of COVID-19. The results showed that the areas important for COVID-19 detection were mainly the upper and lower zones of the lungs.
This paper [3] presents a deep learning (DL)-based approach for the prediction and classification of chest X-ray images in different categories, including COVID-19, Pneumonia and Tuberculosis. The proposed DL model uses public chest X-ray data comprising 7132 images. To improve understanding and interpretation of the model results, the authors use explanatory AI techniques such as Gradient-weighted Class Activation Mapping (Grad-CAM), Local Interpretable Model-agnostic Explanation (LIME) and SHapley Additive exPlanation (SHAP). These techniques visualize salient features and generate explanations for the decisions made by the DL model. The results obtained show an average accuracy of 94.31 ± 1.01% for testing and 94.54 ± 1.33% for validation, thanks to the use of the 10-fold cross-validation method. In addition, the explanations generated by the explainable AI techniques have been validated by medical experts. The paper’s conclusions highlight that the combination of explainable AI and DL models can deliver convincing and consistent results for the detection and classification of lung diseases. The proposed model features a lightweight architecture and superior performance compared with existing methods. However, the article also highlights some limitations of the study, including the fact that the model was trained on a small number of datasets and its performance on larger datasets was not tested. More sophisticated data augmentation approaches could be explored to improve the model’s performance. In addition, the inclusion of patients’ medical histories and other bodily symptoms in the data could contribute to better interpretation.
In this recent paper [4], authors present an explainable artificial intelligence (AI) framework for interpreting lung diseases from chest X-rays. The main objective is to explain the classification results obtained for different lung diseases in order to help doctors understand the reasons that cause these diseases. The research used chest X-rays to classify different lung diseases such as edema, tuberculosis, nodules and pneumonia, including pneumonia caused by COVID-19. The proposed model is based on a transfer learning approach using the ResNet50 neural network, trained on COVID-CT and COVIDNet datasets of 800 images with two classes and 19,000 images with three classes, respectively. The model was fine-tuned and achieved improved classification results with an accuracy of 93% and 97%, respectively. To explain the classification results, the model uses LIME (Local Interpretable Model-agnostic Explanations) interpretability, which highlights the important features of the radiographic image that contributed to the classification of lung disease. Explanation results were evaluated by comparing the regions highlighted by the model with those identified by expert radiologists. The authors found that the model highlighted the same regions of ground-glass opacities as those identified by radiologists.
The authors of this paper [5] focused on the detection of COVID-19, pneumonia and normal cases from chest X-ray images. They developed a deep learning algorithm based on a convolutional neural network (CNN) called DeepCCXR, which is an architecture based on EfficientNET-B5. The study used nine different datasets, comprising more than 3200 chest X-ray images of patients with COVID-19. The datasets used include images from the National Institute of Health (NIH) as well as other sources. The results obtained showed that the DeepCCXR model outperformed recent deep learning approaches for the detection of COVID-19 on chest X-ray images. The model achieved high Area Under Curve (AUC) scores with 0.973 for multiclass classification (COVID-19 vs. pneumonia vs. normal) and 0.986 for the binary model (COVID-19 vs. normal). Mean sensitivity and specificity were 0.97 and 0.98, respectively. For the COVID-19 class, sensitivity reached 0.99. The authors also developed an explainability algorithm that uses the Gradient-weighted Class Activation Mapping (Grad-CAM) technique to visualize the most important regions detected by the model. This enables infected areas in the lungs to be localized on chest X-ray images. Regions of dense, homogeneous opacity were identified as the most significant signs of COVID-19.
These papers summarized above have discussed methods for detecting and classifying diseases from medical images using deep learning models. Although these works have achieved promising performances, it is important to discuss the limitations and shortcomings related to the explainability of the deep models used. In this section, we will examine some of these limitations and discuss the points to which the papers have not paid sufficient attention.
Lack of choice of AI explainability methods (XAI): A common limitation observed in the abstracted articles is the lack of in-depth discussion of the various AI explainability methods (XAI) available and their appropriate choice. Although the models have been successfully trained and evaluated, it is not made clear how the XAI method used to explain the classification results was chosen.
Limited emphasis on comparison of XAI methods: Another notable limitation is the lack of comparison between different XAI methods to assess their effectiveness in explaining classification results. It is essential to understand which XAI method provides the most accurate and meaningful explanations for model results. A comparative evaluation of XAI methods could have provided additional information on the relevance and quality of the explanations provided by each method.
The complexity of deep model explainability: The summarized articles do not explicitly mention the challenges and limitations inherent in the explainability of deep learning models. Deep models are often regarded as black boxes, making it difficult to explain the decisions made by these models. It is important to recognize that, despite efforts to make models more explicable, there are still challenges to overcome when it comes to interpreting results.
Lack of error and bias analysis: Another important limitation is the lack of in-depth analysis of classification errors and potential biases in the results obtained. It is crucial to understand the situations in which models may fail or give erroneous results, as well as the possible biases introduced by the datasets or learning methods used. A thorough analysis of errors and biases would help to improve the confidence and reliability of models.
Overall, although the articles summarized have enabled significant advances in the detection and classification of disease from medical images, there are limitations and gaps in the explainability of the deep models used. Addressing these limitations is crucial to improving the transparency, confidence and interpretability of deep learning models in the medical field.
3. Materials and Methods
This section presents the various steps in the proposed model for explaining and classifying chest X-rays. It describes the proposed architecture based on two databases of chest X-rays, as well as the various data pre-processing steps applied. In addition, the use of transfer learning using pre-trained models such as VGG16 and ResNet50 is performed to improve the performance of the proposed model. The use of visual explainability methods in post-processing (Post-hoc) is then described.
3.1. Software Architecture
Figure 1 shows the proposed model based on two chest X-ray datasets, on which a set of data pre-processing steps is applied. These steps include normalization, data augmentation and image resizing to ensure optimal consistency and quality. Next, models pre-trained using the transfer learning technique are performed. These pre-trained models, such as VGG16, VGG19 and ResNet50, are tailored to the classification of chest X-ray images. The model is trained using these pre-trained models in order to exploit the features learned on massive datasets. Transfer learning enables us to benefit from this prior knowledge and improve model performance.
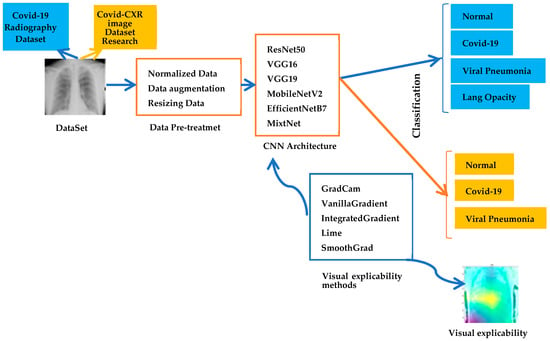
Figure 1.
Proposed architecture.
The objective of this research is to explain the classification of chest X-rays into four categories: COVID-19, Normal and Viral Pneumonia and lung opacity for the first database and the second database into three categories: COVID-19, Normal and Viral Pneumonia. To better understand and explain the results of the proposed model, the post-processing explainability methods, such as Grad-CAM, Vanilla Gradient, LIME and others are performed.
3.2. Dataset
In this project, two datasets (COVID-19 Radiography, COVID CXR Image Dataset Research) available on Kaggle [6] were used for the analysis of chest X-ray images related to COVID-19. Kaggle is a popular online platform for scientists and researchers. It offers a wide range of resources, including datasets, machine learning competitions, tutorials and collaborative notebooks. It is a virtual meeting place where professionals in the field can share, explore and collaborate on data-driven projects.
3.2.1. COVID-19 Radiography Dataset
It was developed by a team of researchers from Qatar University, Doha, Qatar and Dhaka University, Bangladesh, in collaboration with physicians. It includes chest X-ray images of patients with COVID-19, as well as normal images, viral pneumonia images and lung opacity images. The database includes a total of 3616 positive cases of COVID-19, 10,192 normal images, 6012 cases of pulmonary opacity and 1345 cases of viral pneumonia (show Figure 2).
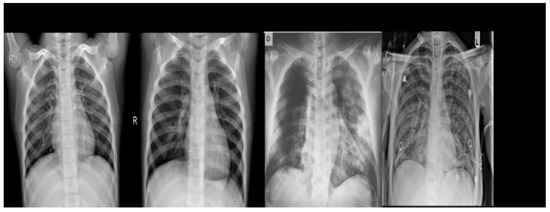
Figure 2.
Example of chest X-ray images from the COVID-19 Radiography Dataset.
3.2.2. COVID CXR Image Dataset Research
It has been created to support the research and development of artificial intelligence solutions for the automated diagnosis of COVID-19. This database contains a set of 1823 chest X-ray images, comprising 668 images of normal patients, 619 images of viral pneumonia cases and 536 images of patients with COVID-19 (show Figure 3).
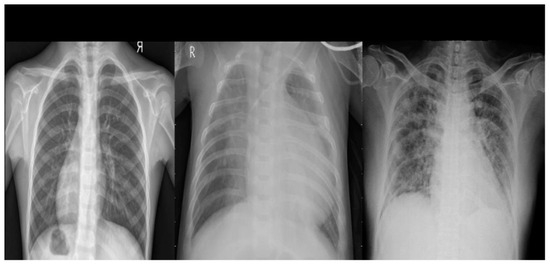
Figure 3.
Example of chest X-ray images from COVID CXR Image Dataset Research.
3.3. Data Pre-Processing
Data preprocessing is an essential step in the development of deep learning models, as it aims to prepare the input data in order to optimize model performance. In this section, we focus on three aspects of data preprocessing: normalization, data augmentation and resizing.
3.3.1. Normalization
Data normalization is a technique commonly used to put image pixel values on a common scale. This reduces discrepancies between different pixel values and facilitates model learning. In this approach, the normalized of the pixel values is performed by dividing each value by 255, bringing the values into the range [0, 1].
3.3.2. Data Augmentation
Data augmentation is a technique that aims to increase the size of the training dataset by applying random transformations to existing images. This technique enriches the dataset by generating variants of the original images, which can improve the model’s ability to generalize and recognize new data. In this approach, the following augmentation techniques: shear, zoom, rotate, shift and flip are performed in order to increase the diversity of the data.
Figure 4 shows the different methods of data augmentation.
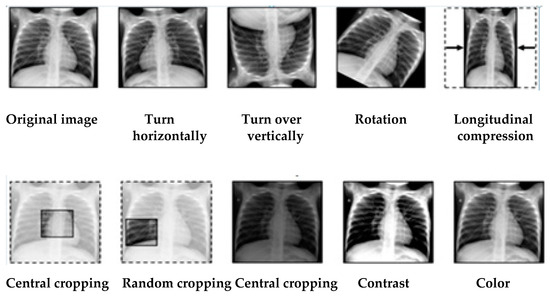
Figure 4.
Different methods of data augmentation.
3.3.3. Resizing
Image resizing is an important step in ensuring that all images are the same size. This is often necessary as most machine learning models require all input data to have the same size. In this approach, all images are resized to a specific size of [224, 224] pixels. This resizing harmonizes the dimensions of all the images, which facilitates processing by the model.
These pre-processing techniques help to improve model performance and promote better generalization.
3.4. CNN Models Used
In this essential step of the proposed approach, as illustrated in Figure 5, the pre-trained CNN models for input image classification are performed which are VGG16, VGG19, Resnet50, EfficientNetB7, MobileNetV2 and Mixnet. This step requires a great deal of time and expertise to manually extract the relevant features from the images. However, with the development of CNN models, this step has become automated and more efficient.
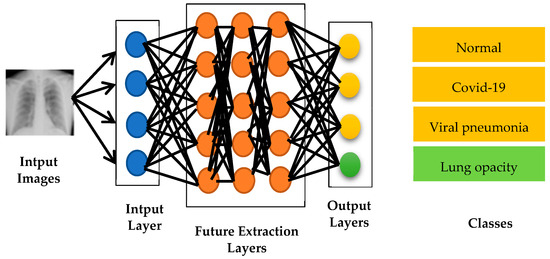
Figure 5.
Architecture based on pre-trained CNN models.
The input layer plays a crucial role in preparing the image for the classification process. It processes the raw image, applying normalization, resizing and other transformations to ensure a consistent representation for the proposed models. Next, the feature extraction layer is performed which is responsible for extracting significant information and features from the image. It can be composed of one or more convolution, pooling and activation layers. Convolution layers filter the input image to extract visual features such as contours, textures and patterns. Pooling layers reduce the spatial dimension of the extracted features, thereby reducing the number of parameters and making the model more robust to variations in the position of objects in the image. Activation functions introduce non-linearity into the model, enabling it to capture complex relationships between features. Finally the output layer performs the final classification of the image. This layer assigns probabilities to each possible class, indicating the likelihood of the image belonging to each of these classes. It is usually composed of softmax neurons that normalize the output scores into probabilities.
It is important to note that this architecture and the way the layers work can vary from one CNN model to another. Each model has its own set of layers and specific operations, which influence its ability to extract features and perform classification.
3.5. Visual Explainability
In order to achieve the main objective, which is the explainability of the results, the best model for each dataset is selected, as illustrated in Figure 6. Then the advanced explanability methods “Grad-CAM, Vanilla Gradient, LIME, SmoothGrad and integrated gradient” are performed to the results of these selected models. This approach enables to obtain precise and intuitive explanations of the decisions made by the proposed models.
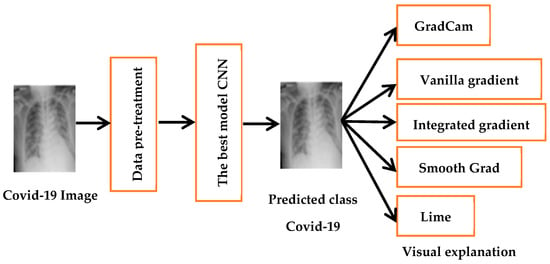
Figure 6.
Contribution of visual explainability.
The need to explain deep learning-based methods is increasing as the number of such approaches grows, especially in the high-stakes decision-making field of medical image analysis [7]. The findings of the DL system are explained and interpreted for easy comprehension by medical professionals, which can help them to diagnose COVID-19, tuberculosis and pneumopathy quickly and accurately [8]. For this reason, the XAI algorithms currently in widespread use: Vanilla Gradient, Integrated Gradient, LIME and GradCAM are used in this work.
The basic principle of GradCAM is to calculate the gradient of a given output of interest from the neural network (usually the class whose classification we want to explain) and to calculate the gradient of this specific output neuron down to the last convolution layer, as this is considered to be the layer that contains the most detailed abstraction of the patterns that form the image and would therefore have the greatest potential to generate the most explanatory visualization [9]. Thus, for a given class c, we have in Equation (1):
where represents the specific output of a class c of the network, k represents an attribute map of the last convolution layer of the CNN, Z is the total number of pixels of this attribute map and the sum is defined on the dimensions of this map. On the other hand, is a number that represents the influence or weight of one of the attribute maps k on the output neuron c. The sum of all the pixels in the attribute map divided by the total number of pixels is also known as the global average. According to Selvaraju et al. [10], the choice of global averaging over other forms of averaging or data grouping was made empirically to produce the best results. The heatmap is then given by the linear combination of attribute maps, whose weights are the αk values calculated in Equation (2).
where LIME [11], also known as Local Interpretable Model-agnostic Explanations, is based on a surrogate model. The surrogate model is usually a linear model built from different samples of the main model. To do this, LIME samples points around an example and evaluates the models at these points. LIME generally calculates the allocation on a sample basis. It takes a sample, perturbs it several times according to random binary vectors and calculates the output scores in the original model. It then uses the binary features (binary vectors) to train an interpretable surrogate model to produce the same outputs. Each of the coefficients in the trained linear substitution model serves as an allocation of the input characteristic in the input sample [12].
Let be a mapping function between “interpretable inputs” and “original inputs” Furthermore, let , M be the number of simplified features, and ϕi ∈ R. The local interpretable explanation model is defined as follows in Equation (3):
The explanation model g can be obtained by solving the following optimization problem in Equation (4):
where and are constrained to be equal. In other words, ) determines how unfaithful g is when it approximates f in the area defined by the similarity kernel . Ω penalizes the complexity of g and Equation (4) can be solved using penalized linear regression [12].
4. Results
This section shows the experiments and results obtained from the proposed model. It begins with a presentation of the tools and the development environment. It then describes the various validation measures used to evaluate the model’s performance. This is followed by a presentation of the results obtained from the experiments on the two datasets. This section also details the application of visual explainability methods in the model and discusses the results obtained. Finally, an evaluation of the results obtained by healthcare professionals is carried out.
4.1. Development Environment
4.1.1. Software Environment
Table 1 exposes the software environment used such as Python [13], TensorFlow [14] and Keras [15] and Tf_explain [16]….

Table 1.
Development Tools.
4.1.2. Validation Measurements
Validation metrics are used to assess the performance of a machine learning model and measure its ability to make accurate predictions. Commonly used measures include: Accuracy, Precision, Recall, f1-score and Loss.
Accuracy (or overall precision): is a measure that evaluates the overall performance of a classification model by giving the fraction of the total number of samples that have been correctly classified by the classifier. It is calculated by dividing the sum of true positives (TP) and true negatives (TN) by the sum of true positives, true negatives, false positives (FP) and false negatives (FN).
Precision: measures the model’s ability to correctly identify positive examples among all examples classified as positive. It is defined as the number of true positives (Tp) over the number of true positives plus the number of false positives (Fp).
Recall: measures the model’s ability to correctly identify positive examples among all truly positive examples. It is defined as the number of true positives (Tp) over the number of true positives plus the number of false negatives (Fn).
F1_score: can be interpreted as a weighted average of precision and recall, where an F1 score reaches its best value at 1 and its worst score at 0. The relative contribution of precision and recall to the F1_score is equal. The formula for the F1_score is as follows:
Loss: also known as error, measures the amount of error between model predictions and actual values. It is often used as a measure of model performance during training. The aim is to minimize the loss, which means that the model makes more accurate predictions.
Mean Opinion Score (MOS): is a measure widely used in communication and information processing systems to evaluate the subjective quality perceived by users. It is a rating scale ranging from 1 (very poor quality) to 5 (exceptional quality), where users are asked to rate a specific experience. The SMO is calculated by taking the average of all the scores awarded, providing a valuable indication of the overall perceived quality of a system or service.
4.2. Experiments and Results
As mentioned in Section 3 two datasets are used for these experiments. These datasets were carefully divided into a training dataset and a test dataset, with a proportion of 80% for training and 20% for testing. The data were rigorously pre-processed. This crucial step enabled to ensure the consistency and quality of the data before using them to train our models. The proposed CNN models were trained over 50 epochs using transfer learning an example of the implementation of this process with the VGG16 model.
As far as optimization is concerned, the Adam optimizer is used for each of our models. Adam is widely recognized for its performance in terms of fast convergence and efficiency. The loss function used is “categorical_crossentropy”. Indeed it is particularly well suited to multiclass classification problems. In short the results of the experiments were obtained following a rigorous process of data preparation, model training using transfer learning techniques and optimization using Adam. The results demonstrate the effectiveness of the proposed methodological and technical choices.
4.2.1. Experimentation on the First Dataset
Table 2 and Figure 7 and Figure 8 illustrate the results of the experiments on this dataset, which comprised four classes: normal, COVID, viral pneumonia and lung opacity. Table 2 details the accuracy and loss results for the test data, while Figure 7 graphically represents the accuracy and loss for the training and test data.

Table 2.
Loss and Accuracy results for the first dataset.
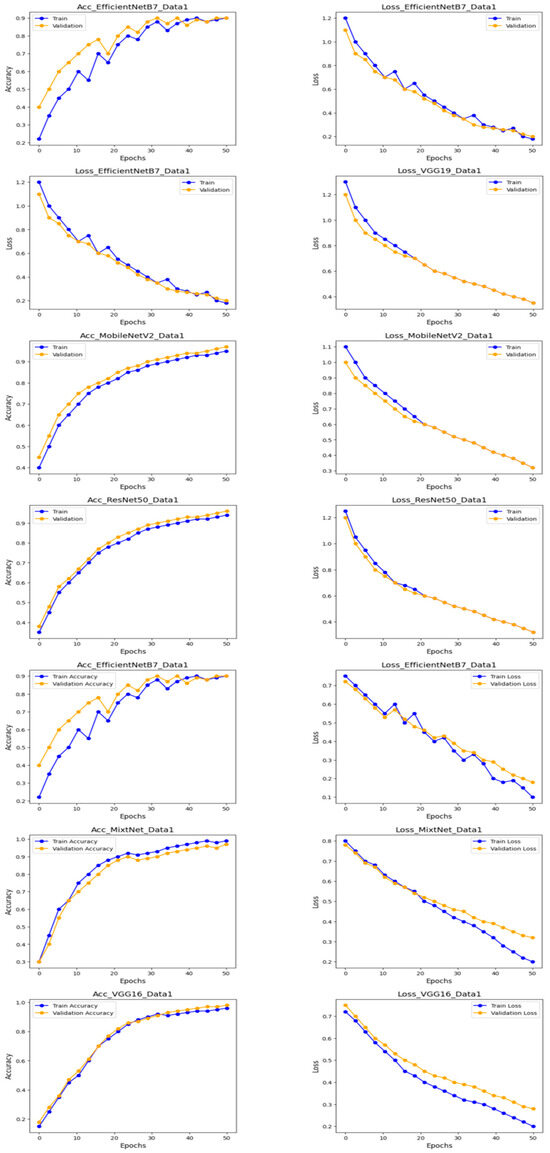
Figure 7.
Loss and Accuracy results for the first dataset.
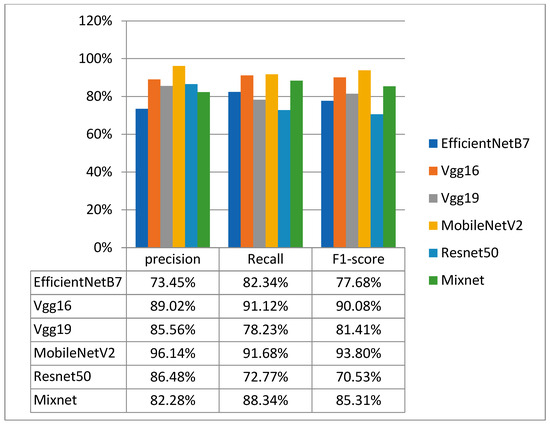
Figure 8.
Precision, recall and F1_score results for the first dataset.
Figure 8 shows precision, recall and F1_score results for all models. The MobileNetV2 model performed best of all the pre-trained models tested. It achieved an accuracy of 93.08%, a loss of 21.31%, a precision of 96.14%, a recall of 91.68% and an F1_score of 93.80%. The effectiveness of the MobileNetV2 model, in particular, suggests its ability to extract relevant features from these complex medical images, enabling accurate classification.
4.2.2. Experimentation on the Second Dataset
Table 3 and Figure 9 and Figure 10 show the second experiments performed on the second dataset. This dataset consisted of three classes: Normal, COVID and Viral Pneumonia. After applying various models to this dataset, it became clear that the VGG16 model was the best performer. According to the results, VGG16 achieved an accuracy of 94.87%, a loss of 17.35%, a precision of 95.12%, a recall of 92.43% and an F1_score of 93.29%. This high level of performance confirms the effectiveness of VGG16.

Table 3.
Accuracy and loss of each model on the second dataset.
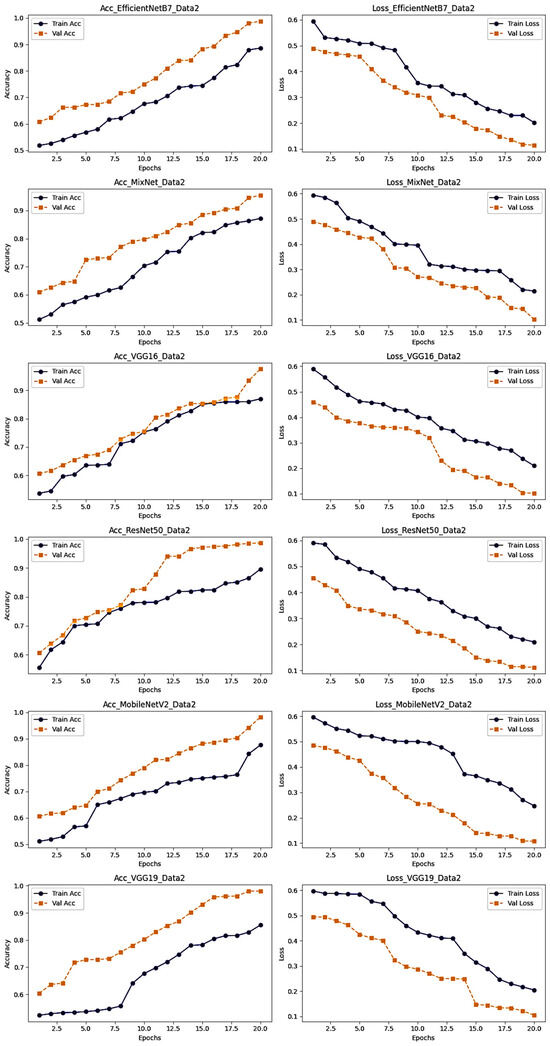
Figure 9.
Accuracy and Loss results for the second dataset.
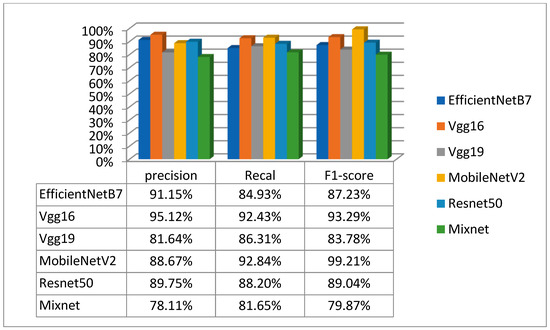
Figure 10.
Precision, recall and F1_score results for the second dataset.
Figure 9 provides a graphical representation of the evolution of accuracy and loss for training and test data, while Table 4 gives a detailed overview of these evaluation measures on the first dataset. In addition, Figure 10 presents a summary of precision, recall and F1_score results for all models tested on this second dataset.
4.3. Application of Visual Explainability Methods and Results
In this section visual explainability methods are applied to the best models, namely MobileNetV2 and Vgg16. These methods, shown in Figure 6, have been applied to each class in both datasets. The aim of this step was to generate visualizations to explain how the proposed models make their predictions. These visualizations, produced for each class, give us a better understanding of which aspects or regions of the images contributed most to our model decisions. The implementation of these explainability methods required the installation of certain libraries, including Lime.
Figure 11, Figure 12, Figure 13 and Figure 14 illustrate the images generated by the different explainability methods for two examples of each class in each dataset. For each example, the original image is accompanied by images generated by GradCAM, Vanilla Gradient, Integrated Gradient, SmoothGrad and LIME. Each method aims to identify and highlight the regions that were decisive for classification by our models.

Figure 11.
Results COVID-19 explainability of the two datasets.

Figure 12.
Explainable results for the Normal class of the two datasets.

Figure 13.
Explainable results for the Viral Pneumonia class in both datasets.
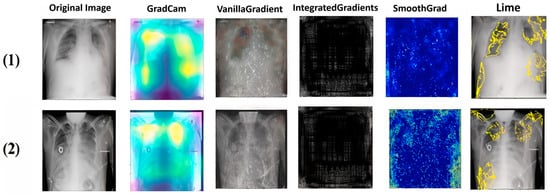
Figure 14.
Explainability results for the Lung Opacity class in the first dataset.
As we can see from the images, each method has its own way of explaining and localizing the target regions. GradCAM uses a heatmap-like representation to highlight regions of interest, creating an easily interpretable visualization of the area on which the model focuses. On the other hand, Vanilla Gradient highlights the gradients of input versus output, indicating the pixels most influential in the model’s decision. Integrated Gradient takes a similar approach, but calculates the full gradient path from input to output, accounting for accumulated changes in pixels. SmoothGrad introduces noise into the input and averages gradients over several noisy instances to attenuate the variability of input gradients. Finally, LIME creates a simplified version of the original image, retaining the key features that influenced the model’s decision. It is particularly noteworthy that GradCAM and LIME seem to offer the clearest and most useful representations of the regions important for classification. This observation will be confirmed and extended by the doctors in the next section.
4.4. Medical Opinion
In order to validate the results, it was crucial to obtain feedback from healthcare professionals, in this case three doctors, who are directly involved in the interpretation of these medical images on a daily basis. To structure this evaluation, we opted for the 5-points Likert explanation satisfaction scale developed by Hoffman [17]. This evaluation framework is based on five essential criteria for the explainability of AI models: comprehension, satisfaction, sufficiency of detail, completeness and accuracy. Each criterion is rated on a scale of 1 to 5, where 1 indicates low satisfaction and 5 indicates maximum satisfaction.
Each doctor independently assessed the results on the basis of these criteria, enabling us to gather their qualified opinions. The scores awarded by each doctor for each criterion were then used to calculate the “Average Opinion Score”, which represents the doctors’ average satisfaction with our results.
Table 4 shows the mean Opinion Score results for the 5 different methods. Details of these evaluations, including individual scores for each criterion and each doctor, are available in the appendix to this brief.

Table 4.
SMO of different explainability methods.
Table 4.
SMO of different explainability methods.
| Method Metric | GradCAM (1–5) | Vanilla Gradient (1–5) | Integrated Gradient (1–5) | Smooth Grad (1–5) | Lime (1–5) |
|---|---|---|---|---|---|
| Understanding | 3.83 | 2.83 | 1.33 | 1.83 | 4 |
| Satisfaction | 4 | 3.33 | 1 | 1.5 | 3.67 |
| Sufficient details | 4.17 | 3.17 | 1.17 | 1.67 | 3.5 |
| Exhaustiveness | 4.17 | 2.83 | 1.67 | 2 | 3.67 |
| Accuracy | 4 | 3.17 | 1 | 1.67 | 3.33 |
From the mean Opinion Score presented in the Table 4, it is clear that the GradCAM, LIME and, to some extent, Vanilla Gradient explainability methods were preferred by doctors, as evidenced by the higher scores they received. Specifically, for comprehension, LIME scored 4, GradCAM 3.83 and Vanilla Gradient 2.83. For satisfaction, GradCAM scored 4, LIME 3.67 and Vanilla Gradient 3.33. For sufficient detail and completeness (Exhaustiveness), GradCAM scored the highest with 4.17, Vanilla Gradient 3.17 and 2.83, respectively, while LIME 3.5 and 3.67, respectively. Finally, for accuracy, GradCAM also scored highest with 4, Vanilla Gradient 3.17 and LIME 3.33. In contrast, the SmoothGrad and Integrated Gradient methods received generally lower scores on all evaluation measures. This indicates that these methods may be perceived as less intuitive or useful to physicians.
5. Discussion
These results highlight that, in the present study, GradCAM stands out as the most effective visual explanation method, closely followed by LIME, while Vanilla Gradient also demonstrated some usefulness. The satisfactory results expressed by the GradCam method are undoubtedly the fruit of its internal principle where it uses a heatmap-like representation to highlight regions of interest, thus creating an easily interpretable visualization of the area on which the model focuses. Doctors rated these methods as more understandable, satisfying, detailed, complete and accurate, underlining their relevance and potential usefulness in medical practice. These methods offer an in-depth understanding of the decisions made by deep learning models, which can boost doctors’ confidence and facilitate the adoption of these technologies in critical medical applications.
6. Conclusions
This research work is part of the explainability of deep learning results on chest X-ray images. In this context, we used pre-trained deep learning models such as MobileNetV2, VGG16 and others, as well as two separate datasets, to evaluate the performance of these models. The results revealed that MobileNetV2 was the best model for the first dataset, while VGG16 was the best for the second dataset. These models demonstrated significant classification performance, highlighting the effectiveness of convolutional neural networks (CNNs) in classifying chest X-ray images.
Then the visual explainability methods are applied such as GradCAM and LIME to better understand the decisions made by these models. The results showed that GradCAM was the most effective visual explainability method, closely followed by LIME, while Vanilla Gradient also demonstrated some usefulness. Doctors rated these methods as more understandable, satisfying, detailed, Exhaustiveness and accurate. These findings are of great importance in the healthcare field, as they provide clear, interpretable explanations of the results obtained by deep learning models. Explainability boosts doctors’ confidence in the use of these models and facilitates their adoption in critical medical applications.
This study opens up vast scientific prospects in the short and long term. Below are the main perspectives that deserve to be explored as a result of this study:
Identifying and correcting biases in deep learning models to ensure more accurate and fair results.
Exploring alternative methods of explainability such as text-based explanation through examples and others. Investigation of these alternative methods can provide additional information on the decisions made by deep learning models, offering an even more complete and interpretable picture.
Using larger datasets enables the performance of deep learning models and explainability methods to be evaluated on a larger scale, offering more robust validation of the results obtained.
Author Contributions
Conceptualization, methodology, S.K., S.A.M., S.S., L.B. and B.S.; software, validation, formal analysis, investigation, resources, data curation, S.K., S.A.M. and L.B.; writing—original draft preparation, writing—review and editing, visualization, S.K., S.A.M. and S.M. All authors have read and agreed to the published version of the manuscript.
Funding
This research received no external funding.
Data Availability Statement
This study uses the following openly available datasets: COVID-19 Radiography and COVID CXR Image Dataset Research available on Kaggle Dataset [6].
Conflicts of Interest
The authors declare no conflicts of interest.
References
- Islam, N.; Alam, G.R.; Apon, T.S.; Uddin, Z.; Allheeib, N.; Menshawi, A.; Hassan, M.M. Interpretable Differential Diagnosis of Non-COVID Viral Pneumonia, Lung Opacity and COVID-19 Using Tuned Transfer Learning and Explainable AI. Healthcare 2023, 11, 410. [Google Scholar] [CrossRef] [PubMed]
- Ahsan, M.; Nazim, R.; Siddique, Z.; Huebner, P. Detection of COVID-19 Patients from CT Scan and Chest X-ray Data Using Modified MobileNetV2 and LIME. Healthcare 2021, 9, 1099. [Google Scholar] [CrossRef] [PubMed]
- Bhandari, M.; Shahi, T.B.; Siku, B.; Neupane, A. Explanatory classification of CXR images into COVID-19, Pneumonia and Tuberculosis using deep learning and XAI. In Computers in Biology and Medicine; ScienceDirect; Elsevier: Amsterdam, The Netherlands, 2022; Volume 150, p. 106156. [Google Scholar]
- Mahamud, E.; Fahad, N.; Assaduzzaman, M.; Zain, S.M.; Goh, K.O.M.; Morol, K. An explainable artificial intelligence model for multiple lung diseases classification from chest X-ray images using fine-tuned transfer learning. Decis. Anal. J. 2024, 12, 100499. [Google Scholar]
- Chetoui, M.; Akhloufi, M.A.; Yousefi, B.; Bouattane, E.M. Explainable COVID-19 Detection on Chest X-rays Using an End-to-End Deep Convolutional Neural Network Architecture. Big Data Cogn. Comput. 2021, 5, 73. [Google Scholar] [CrossRef]
- Tsang, S.-H. Review: MobileNetV2—Light Weight Model (Image Classification) Outperforms MobileNetV1, NASNet, and ShuffleNet V1. Towards Data Science. Kaggle. 2019. Available online: https://www.kaggle.com/ (accessed on 1 July 2024).
- Velden, B.H.V.; Kuijf, H.J.; Gilhuijs, K.G.; Viergever, M.A. Explainable artificial intelligence(XAI) in deep learning-based medical image analysis. Med. Image Anal. 2022, 79, 102470. [Google Scholar] [CrossRef] [PubMed]
- Antoniadi, A.M.; Du, Y.; Guendouz, Y.; Wei, L.; Mazo, C.; Becker, B.A.; Mooney, C. Current Challenges Andfuture Opportunities for XAI in Machine Learning-Based Clinical Decision Support Systems: A Systematic Review. Appl. Sci. 2021, 11, 5088. Available online: https://www.mdpi.com/2076-3417/11/11/5088 (accessed on 2 September 2024). [CrossRef]
- Sousa, I.P. Inteligência Artificial Explicável para Classificadores de Imagens Médicas. Ph.D. Thesis, PUC-Rio, Rio de Janeiro, Brazil, 2021. [Google Scholar]
- Selvaraju, R.R.; Cogswell, M.; Das, A.; Vedantam, R.; Parikh, D.; Batra, D. Grad-cam: Visual explanations from deep networks via gradient-based localization. In Proceedings of the IEEE International Conference On Computer Vision, Venice, Italy, 22–29 October 2017; pp. 618–626. [Google Scholar]
- Ribeiro, M.T.; Singh, S.; Guestrin, C. “Why should i trust you?” explaining the predictions of any classifier. In Proceedings of the 22nd ACM SIGKDD international CONFERENCE on knowledge DISCOVERY and Data Mining, San Francisco, CA, USA, 13–17 August 2016; pp. 1135–1144. [Google Scholar]
- Rahman, M.M. Deep Interpretability Methods for Neuroimaging. Doctoral Dissertation, College of Arts and Sciences, Georgia State University, Atlanta, Georgia, 2022. [Google Scholar]
- Python. Available online: https://www.python.org/ (accessed on 1 July 2024).
- TensorFlow. Available online: https://www.tensorflow.org/ (accessed on 1 July 2024).
- Keras. Available online: https://keras.io/ (accessed on 1 July 2024).
- tf-Explain. Available online: https://tf-explain.readthedocs.io/ (accessed on 1 July 2024).
- Hofman, R.R.; Mueller, S.T.; Klein, G.; Litman, J. Metrics for explainable AI: Challenges and prospects. arXiv 2018, arXiv:1812.04608. [Google Scholar]
Disclaimer/Publisher’s Note: The statements, opinions and data contained in all publications are solely those of the individual author(s) and contributor(s) and not of MDPI and/or the editor(s). MDPI and/or the editor(s) disclaim responsibility for any injury to people or property resulting from any ideas, methods, instructions or products referred to in the content. |
© 2025 by the authors. Licensee MDPI, Basel, Switzerland. This article is an open access article distributed under the terms and conditions of the Creative Commons Attribution (CC BY) license (https://creativecommons.org/licenses/by/4.0/).