1. Introduction
The early prediction of student success and academic risk has become a central focus in educational data mining (EDM) and learning analytics (LA), two rapidly evolving fields that leverage data-driven methodologies to enhance learning outcomes [
1]. It can be said that EDM focuses more on techniques and methods, while LA is more about application. However, these differences are less noticeable as both fields evolve over time [
2]. Predictive modeling has been widely applied in education, relying on academic performance indicators to evaluate the probability of success or failure of students [
3].
Nabil et al. [
4] performed a literature review on the prediction of student academic performance using different machine learning techniques and found that the grade point average (GPA) of students and the cumulative grade point average (CGPA) are the most common indicators used as predictive values to assess and predict student academic performance at the university level. Some studies emphasize the importance of including academic and non-academic factors such as motivational and self-regulation variables to improve the predictive power of the models [
5,
6].
In science, technology, engineering, and mathematics (STEM) education, research has shown that student interaction with the learning management system (LMS) provides valuable predictive insights. For example, Kittur et al. [
7] emphasized that the amount of time students spend on various course components, such as tests and assignments, can be an indicator of the likelihood that they will successfully complete the course. Similarly, research by Cui et al. [
8] showed that quiz and assignment scores, along with engagement metrics such as the frequency of LMS logins, are critical predictors of overall course performance. These findings suggest that early assessments and continuous monitoring of student engagement are critical for accurately identifying students who may struggle later in the semester.
Several studies have focused on developing their own prediction models tailored to specific educational contexts. One study by Caicedo-Castro presented “Course Prophet”, a machine learning-based system to predict student failure in a course in numerical methods [
9]. This model used students’ grades in prerequisite courses and admission test scores as predictor variables, demonstrating the effectiveness of early intervention strategies based on predictive analytics. The study highlights the importance of using historical academic performance data to predict future outcomes, which is consistent with general trends in educational data mining. Similarly, Fahd and Miah [
10] designed a Big Data Analytics System that utilizes LMS interaction data to identify at-risk students, highlighting the role of artificial intelligence (AI) driven engagement analysis in predicting student success. However, despite their high predictive accuracy, AI-based black-box models lack transparency, which remains a major barrier to their adoption in education [
11,
12]. Researchers argue for the need for interpretable models that not only perform well but also provide insight into their predictions, as this is crucial for promoting trust in sensitive areas such as education. Therefore, moving from black-box to more transparent models is essential in detecting at-risk students [
13,
14,
15].
The timing of predicting student success is a critical aspect of educational intervention strategies. Theobald et al. [
16] indicated that active learning strategies employed early in the course can help close achievement gaps, supporting the notion that early prediction is critical to student success. Furthermore, Refs. [
17,
18,
19] indicated that early predictions can significantly impact student outcomes by allowing timely intervention. These findings underscore the critical role of early detection in supporting student success and the need for institutions to take proactive measures based on predictive analytics.
This study aims to develop a transparent scoring algorithm for early academic risk prediction, offering a balance between interpretability, predictive accuracy, and ease of implementation. This scoring system will be grounded in transparent and classical statistical methods—widely trusted by both researchers and educators—rather than relying on “black-box” approaches. The objective is to achieve a predictive accuracy comparable to that of advanced AI models while ensuring the interpretability and reliability of the underlying methodologies.
The proposed algorithm for early detection of student failure (as discussed in
Section 5) is characterized by its simplicity, ease of understanding, and practical applicability, making it particularly suitable for educational institutions with limited resources. In contrast to complex machine learning models, the algorithm uses dichotomization of predictors to simplify data processing, while Cramér’s V-measure ensures reliable selection of the most important predictors. Using the Youden index to determine risk thresholds, the algorithm enables an objective and transparent classification of students. By applying simple yet robust statistical techniques, the algorithm provides a dynamic, intuitive, and resource-efficient framework for proactive student support. The algorithm combines simple statistical methods into a dynamic system that is intuitive to use, robust in execution, and exceptionally practical to implement.
The remainder of this paper is structured as follows. First,
Section 2 provides a brief overview of the state of the field.
Section 3 details the materials and methods, while
Section 4 introduces the predictor variables.
Section 5 presents the results, focusing on the development of a scoring system and a corresponding algorithm designed as a predictive classification model to assess students’ success or failure during each of the 15 weeks of classes.
Section 6 discusses these findings, and
Section 7 concludes the paper with recommendations for future research.
2. State of the Field
Recent research highlights the significant influence of learning motivation as a key predictor of academic success, while advances in LMS data analytics have created new opportunities for real-time performance monitoring. Leveraging insights about student motivational factors and interactions within LMS enables educators to take proactive measures and implement early intervention strategies. As academic institutions increasingly focus on improving retention rates and overall student success, early prediction models are emerging as important tools to identify at-risk students and develop targeted support mechanisms. While traditional prediction approaches have relied predominantly on statistical analysis, recent developments in machine learning (ML) have improved both the accuracy and adaptability of these models.
In STEM subjects, where the subject matter is often particularly challenging, motivation to learn plays a crucial role in academic performance. Studies have shown a strong correlation between higher levels of intrinsic motivation and better academic outcomes, suggesting that students who demonstrate greater engagement in STEM subjects are more likely to persevere despite challenges [
20]. For example, Yeager et al. conducted a nationwide study showing that interventions aimed at promoting a growth mindset were effective in improving students’ grades across different demographic groups, highlighting the important link between motivation and academic success [
20]. Similarly, Daker et al. examined the negative effects of math anxiety, an issue closely linked to motivation, and emphasized its predictive role in STEM avoidance [
21]. These findings underscore the need to develop targeted interventions that address both motivational barriers and academic difficulties and reinforce the importance of incorporating psychological factors into academic support systems to maximize their effectiveness.
The results of learning motivation analysis can be integrated with LMS interaction logs to provide comprehensive insights into student engagement and behavioral patterns, both of which are critical to academic success. Santos and Henriques emphasized that examining various aspects of student interactions within LMS platforms can reveal early indicators of risk that facilitate data-driven decision-making for the implementation of targeted interventions [
22]. Furthermore, Akçapınar et al. developed an early warning system that utilizes eBook interaction logs to identify students at risk, demonstrating the potential of LMS data in establishing timely academic support mechanisms [
23]. In addition, Osborne and Lang’s research confirmed that LMS data can be effectively used to create predictive models that can identify at-risk students as early as the fifth week of the semester and achieve satisfactory predictive accuracy [
24].
Statistical models, such as logistic regression, are often used to predict academic performance due to their simplicity and interpretability. For example, Zakopoulos et al. developed a binary logistic regression model to identify students at risk in blended learning environments. The independent variables included attendance, participation in online discussions, and the completion of assignments. The model achieved a reported predictive accuracy of 0.82, underscoring the importance of engagement metrics in identifying students who may struggle, consistent with the findings that passive participation does not effectively predict performance [
25]. Yousafzai and Jamil examined the relationship between admission criteria and academic performance using correlation and regression analyses. The study demonstrated a significant relationship, reporting that metrics such as high school GPA and standardized test scores significantly correlated with college performance. This underscores the importance of using admission data as a predictive tool for academic success in higher education institutions [
26]. While these models are effective in identifying key predictive factors, they struggle to capture the intricate, nonlinear relationships inherent in educational datasets, limiting their ability to fully account for the complexity of student achievement patterns.
In contrast, ML models have proven to be powerful tools for uncovering hidden patterns in data, as shown by the results of Akçapınar et al. who demonstrated the effectiveness of ML techniques in developing early warning systems to identify at-risk students [
23]. Nabil et al. also emphasized that ML algorithms, especially deep neural networks, provide superior prediction accuracy by processing multidimensional datasets that traditional statistical methods may miss [
4]. This capability is particularly important, as Mahboob et al. have shown, as early identification of at-risk students through ML-based approaches enables timely interventions that can significantly improve educational outcomes [
27]. Sandoval et al. (2020) conducted a case study integrating neural networks and logistic regression to develop a model for predicting early dropout among college students. The model incorporated a number of predictors, including demographics, prior academic performance, and enrollment status, and achieved an accuracy of 0.87 and a sensitivity of 0.85 demonstrating its strong ability to identify at-risk students entering college [
28]. Similarly, Mogavi investigated different methods for predicting dropout in STEM subjects, focusing on ML approaches to assess student engagement and academic performance. The study reported an accuracy of 0.90 with an area under the receiver operating characteristic curve (AUC-ROC) of 0.93, highlighting the effectiveness of ML models in predicting dropout risk based on historical academic data. The model took into account several indicators, including attendance records, number of assignments submitted, and exam performance [
29]. In a more recent study, Won et al. developed a multimodal model for predicting dropout that combined structured data (e.g., GPA, attendance) with unstructured textual data from discussion forums and advising notes. By using a deep learning approach, the model achieved an accuracy of 0.92. This demonstrates the benefits of combining different data sources to improve predictive performance and capture the multifaceted nature of dropout risk [
30].
3. Materials and Methods
This study is based on data collected from the LMS platform Merlin, an implementation of the open-source system Moodle (version 4.2). The dataset comprises user activity logs, quiz scores, overall course performance metrics, and responses to two questionnaires conducted in the first week of the course.
The first questionnaire evaluated students’ prior mathematical knowledge based on three key indicators: high school mathematics grades and state matriculation examination results. The second questionnaire used the adapted academic motivation scale, translated and adapted into Croatian by G. Ribić [
31]. This 24-item instrument measured six motivation factors, which encompassed three types of extrinsic motivation (external regulation, introjected motivation, and identified motivation) and three forms of intrinsic motivation (motivation for knowledge, achievement, and stimulation). The responses collected provided insight into students’ academic backgrounds and motivational profiles, which were later analyzed in relation to their course performance.
Data collection was carried out in two phases. The first phase was a retrospective analysis based on data from the 2023/2024 academic year, which included 76 students enrolled in the compulsory course Mathematics 1 at the Faculty of Engineering, University of Rijeka. Among them, 26 students did not complete the course successfully. The second phase was a prospective analysis conducted on 70 students enrolled in the same course during the academic year 2024/2025. All records were anonymized prior to thhe analysis to ensure compliance with ethical standards and data protection regulations, thereby safeguarding student privacy.
The preprocessing phase included handling missing values and transforming independent variables for statistical analysis. In the retrospective dataset, students with missing data for any of the required variables were excluded from the analysis, resulting in a final dataset of 43 students for model evaluation.
Independent variables (as described in
Section 4) were originally numeric and converted to categorical dichotomous variables. The optimal cut-off point for dichotomization was determined using the Youden index, ensuring a statistically robust separation between categories. The Youden index [
32] is a measure of effectiveness that combines sensitivity and specificity and it is calculated as follows:
Specificity is a measure of the correct identification of negative cases, while sensitivity is a measure of the correct identification of positive cases. The Youden index ranges from 0 to 1. A value close to 1 indicates high model efficiency in distinguishing students who will pass the course from those who will not.
The variable Success in the retrospective analysis was defined as a dichotomous variable, where Success = 1 indicated that the student passed the course, and Success = 0 indicated failure. In the prospective analysis, Success was based on passing the first mid-term exam. The prospective dataset from 2024/2025 did not require handling missing values, as all required data were available to all students. The preprocessing was performed using R version 4.3.3.
Pearson’s chi-square test was used to identify the most relevant dichotomous predictors of
Success. The Pearson chi-square test [
33] is a statistical test used to determine whether there is a significant association between two categorical variables. It compares the observed frequencies (
O) with the expected frequencies (
E) to check if differences are due to chance. The value of the Pearson chi-square statistic (
) is defined as follows:
The LMS variables considered relevant on a weekly basis were those for which the corresponding
p-value of Pearson’s chi-square test was below the significance level of 0.05.
For each of the 15 weeks of teaching, the association between relevant variables and
Success was quantified using Cramér’s
V coefficient. This measure provided insight into the effect size of the relationships between categorical predictors and student outcomes. Cramér’s
V coefficient [
34] is based on the Pearson chi-square statistic, and its significance is determined based on the
p-value of the Pearson chi-square test. Cramér’s
V coefficient is defined as follows:
where
is the value of the chi-square statistic;
- n
is the total number of observations;
- k
is the number of categories of one variable; and
- r
is the number of categories of the other variable.
Based on the results of Cramér’s V measure, a scoring system was developed to predict student success, which represents the primary objective of this study.
Descriptive statistical techniques were used to summarize the data, including measures of central tendency (arithmetic mean and median) and dispersion (standard deviation and range). Frequency calculations and corresponding graphical representations were also included to provide a clearer overview of the dataset.
Model performance was evaluated using sensitivity, specificity, accuracy, and AUC-ROC. All statistical analyses were performed with R.
Students accessed Merlin from their personal computers, while researchers analyzed the data on a computer equipped with a 13th Gen Intel® Core™ i7-1360P processor (2.20 GHz, x64 architecture), manufactured by Intel Corporation, Santa Clara, CA, USA, 16.0 GB of installed RAM, and a 64-bit version of Windows 11 operating system.
4. Overview of the Variables Used in the Analysis
A clear understanding of the structure and assessment methods of the Mathematics 1 course is crucial for interpreting the variables used in this study.
The Mathematics 1 course is a compulsory first-year course at the Faculty of Engineering, University of Rijeka. The course is delivered through traditional in-person instruction for 15 weeks, with students attending three hours of lectures and three hours of exercises per week. In addition, students have access to the Mathematics 1 e-course via the LMS Merlin, which facilitates e-learning through the distribution of learning materials, communication tools, and online assessments. While the platform tracks student activity and generates descriptive reports, it does not offer predictive insights or personalized recommendations.
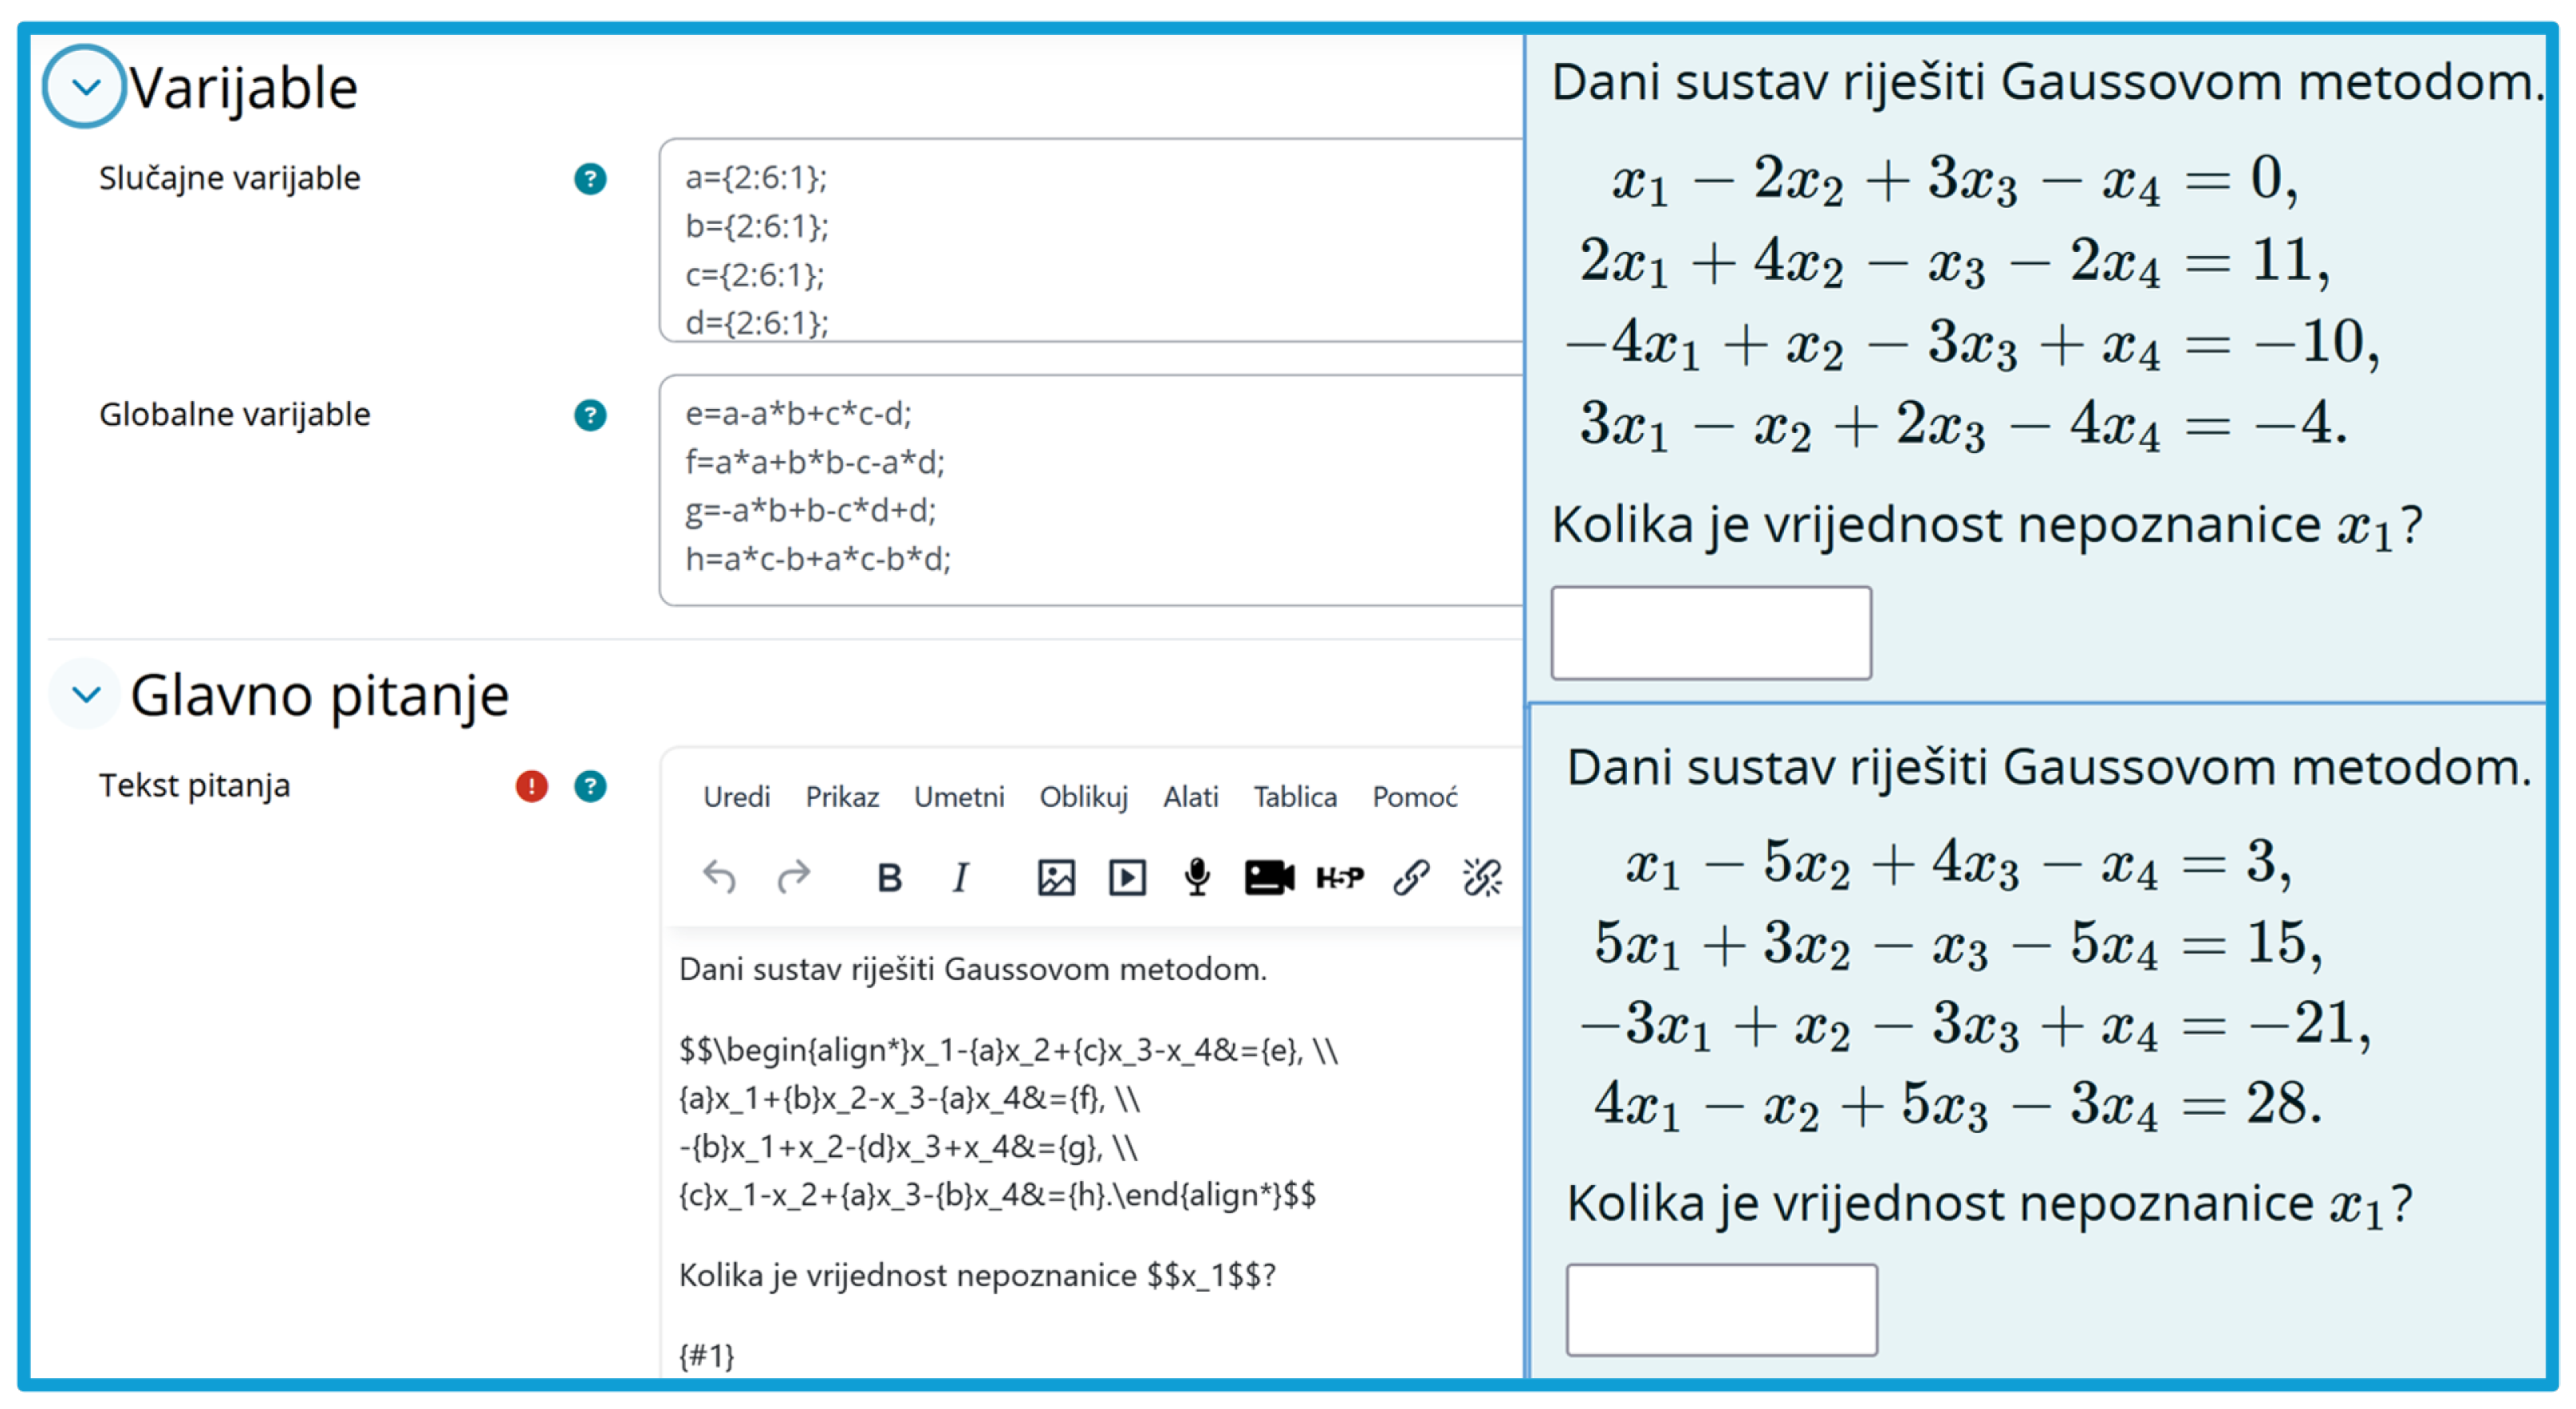
All exercise tasks in Merlin are stored as formulaic questions. This format allows for the use of global and local variables, enabling the generation of multiple versions of the same task. An example of a formulaic question code and two generated tasks can be found in
Figure 1. On the left side of
Figure 1, the code for creating a question is shown, containing variables (random and global) as well as the main question (i.e., the task text). On the right side of
Figure 1, two different tasks generated from this code are displayed.
These tasks serve as the basis for weekly tests. Each week, students take a test during exercises and later have the opportunity to solve equivalent learning tests at home, where parameters differ, allowing them to practice and independently verify their acquired knowledge.
The maximum attainable score in the course is 100 points. Throughout the semester, three midterm exams are held, contributing to a total of 70 points. The first mid-term takes place in week 5, the second in week 11, and the third in week 16 (the first week after the end of classes). Students who accumulate at least 35 points during the semester qualify for the final exam, which carries an additional 30 points. To pass the course, a student must obtain at least 15 points on the final exam. If a student does not accumulate 35 points during the semester or does not reach the minimum passing score on the final exam, they receive a failing grade (F) and must retake the course.
The analysis in this study relies on a set of variables that capture different aspects of student participation, assessment performance, and learning activity within the Mathematics 1 course.
The variable Number of learning tests represents the total number of instances in which a student has completed a learning test in a given week, including repeated attempts. The variable Maximum of learning tests records the highest percentage of points a student achieved in a given week, providing insight into their highest performance during that period.
The descriptive statistical indicators for these variables per week are presented in
Table 1. The table illustrates that students engage more actively in learning tests in the weeks preceding midterm exams. Their performance also improves during these periods, suggesting intensified preparation and focused study efforts.
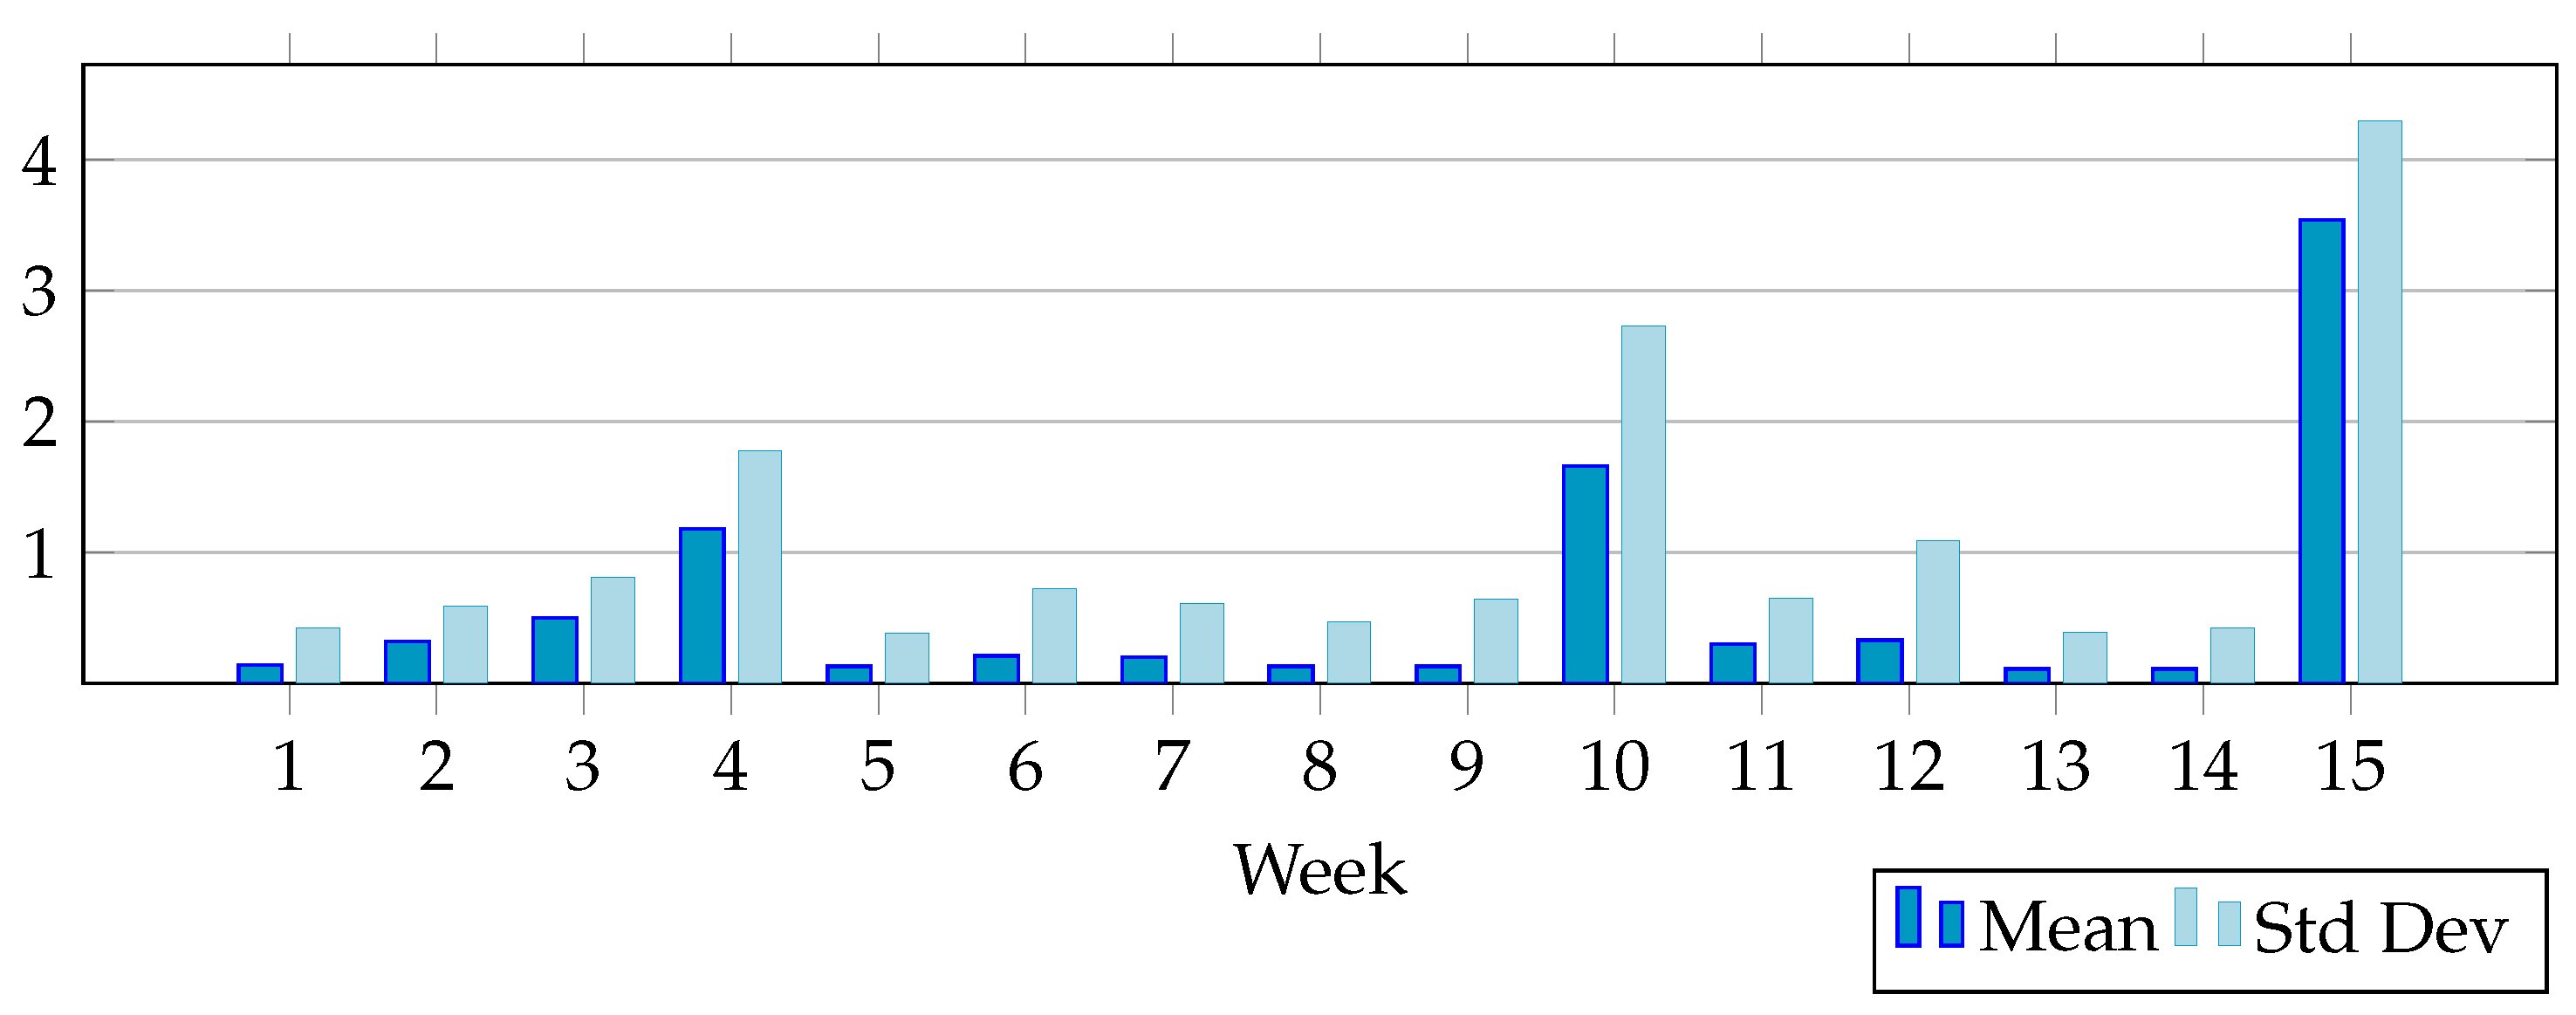
The graphical representation of the arithmetic mean and the standard deviation for the variable
Number of learning tests is shown in
Figure 2 to visually illustrate the increased activity of the students in the weeks before the midterm exams.
High values of the arithmetic mean and the standard deviation in the weeks before the midterm exams (especially at the end of the semester) indicate increased activity of the students in solving the weekly tests as well as considerable differences in the number of attempts to solve these tests among the students.
In addition to the learning tests, course participants have access to additional practice tests within the Merlin e-course. These practice tests are also generated from a database of formulaic questions, allowing students to engage with a diverse set of problems and reinforce their understanding of the material.
The variable Number of practice tests represents the total number of times a student has completed a practice test in a given week, including repeated attempts for further reinforcement. The variable Maximum of practice tests records the highest percentage of points a student achieved in that week, reflecting their best performance in all completed practice tests.
The descriptive statistical indicators for these variables per week are presented in
Table 2. The table indicates that students predominantly complete practice tests in the weeks leading up to midterm exams, mirroring the pattern observed with learning tests.
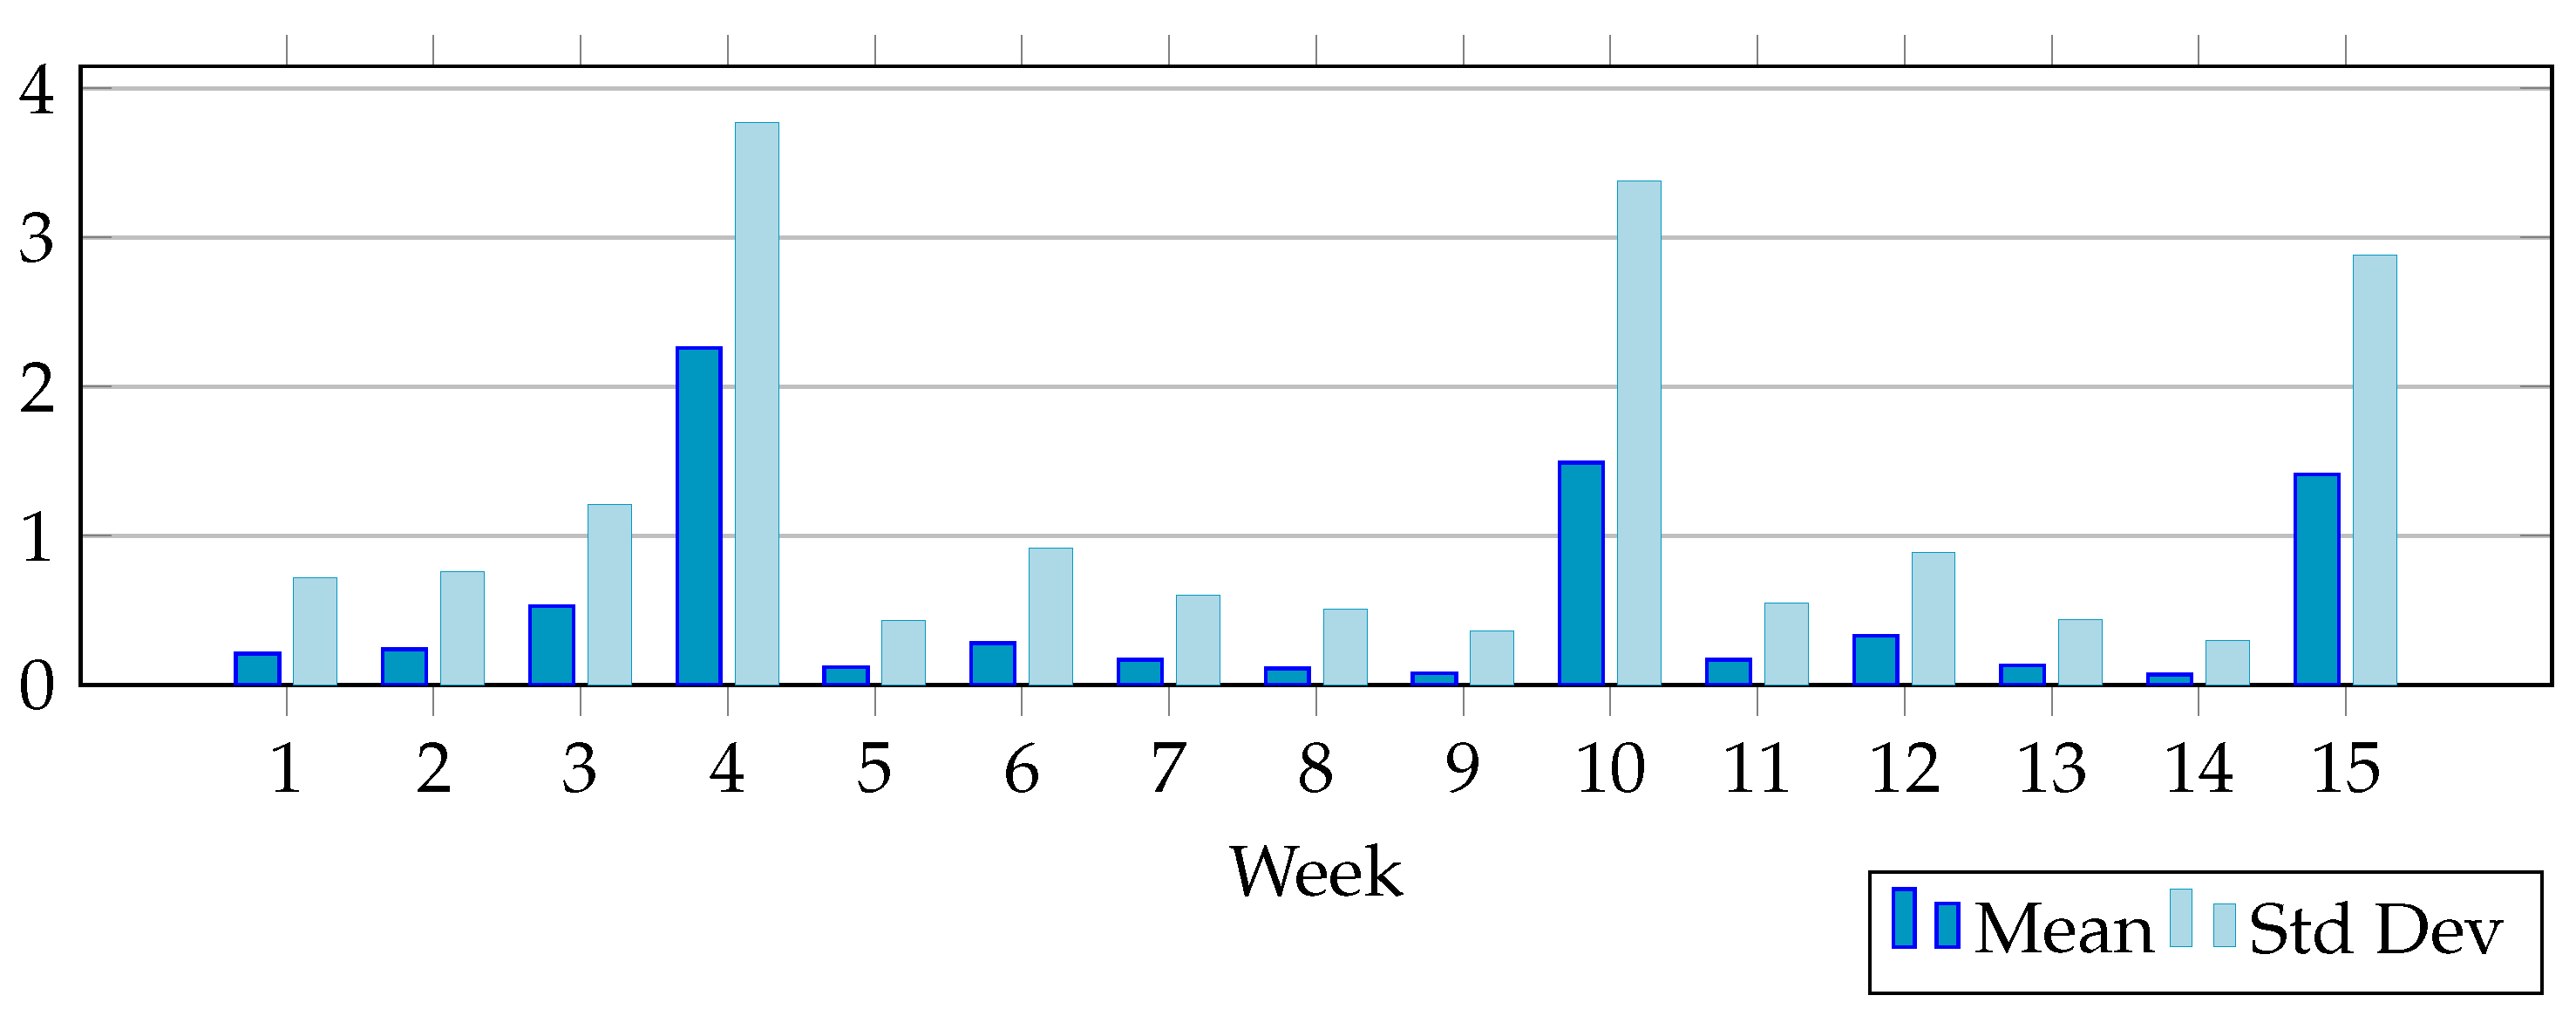
The graphical representation of the arithmetic mean and the standard deviation for the variable
Number of practice tests is shown in
Figure 3 to visually illustrate the increased activity of the students in the weeks before the midterm exams.
If we look at the weeks before midterm exams, we can see in
Figure 3 that interest in solving practice tests decreases throughout the semester, with interest being the highest in the week before the first midterm exam and the lowest in the week before the last midterm exam.
Within the Merlin e-courses, students have access to lecture presentations used by the professor. They are encouraged to download these presentations and take notes to support their learning. The course material is structured so that different presentations are used in specific weeks: the first presentation covers weeks 1–3, the second covers weeks 4–6, the third covers weeks 7–9, the fourth covers weeks 10–12, and the fifth covers weeks 13–15.
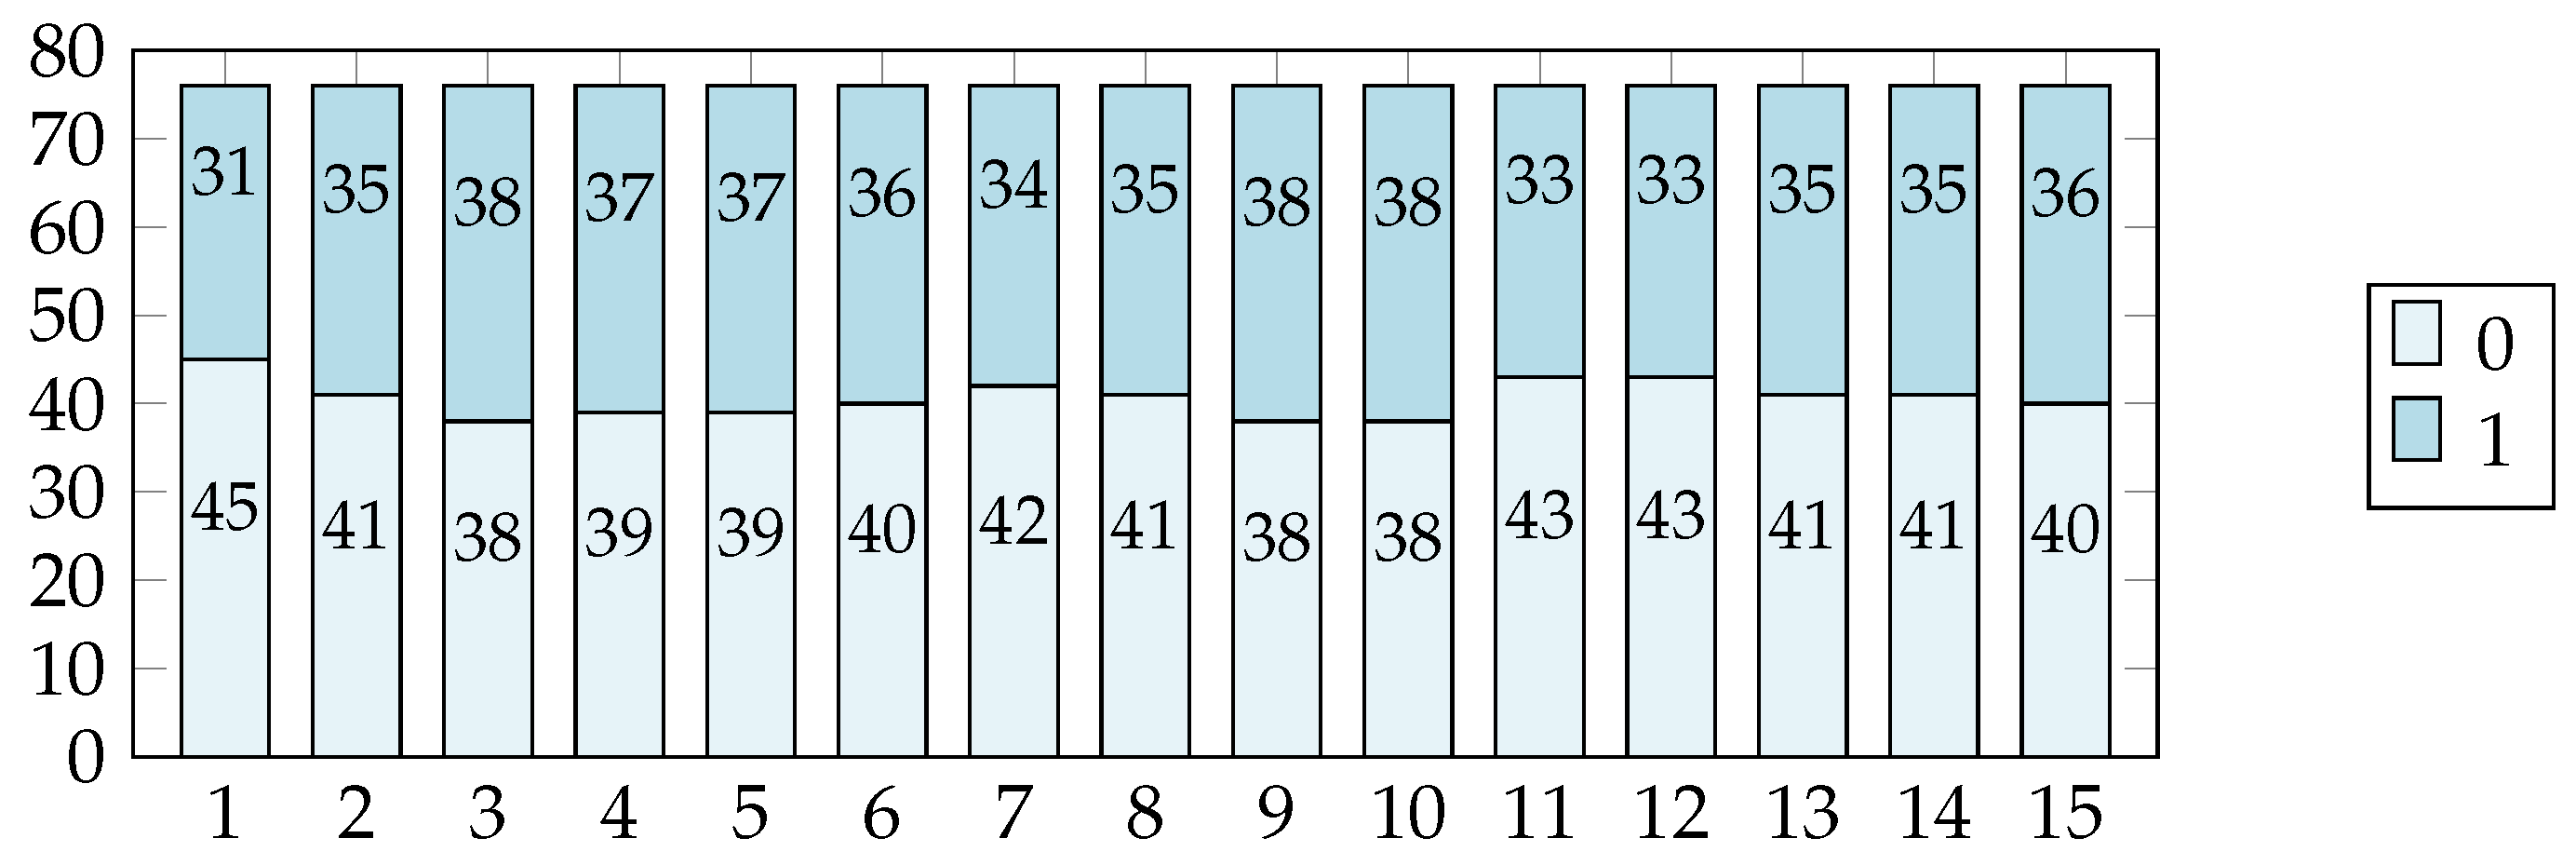
The variable Presentation indicates whether a student has downloaded the presentation for the corresponding week. It takes the value 1 if the presentation was downloaded and 0 otherwise. For example, if a student downloads the first presentation in the second week, the variable Presentation would have the values (0, 1, 1) for the first three weeks.
Since
Presentation is a dichotomous variable with only two possible values (0 and 1), its distribution across weeks is illustrated in
Figure 4. The values of this variable are relatively uniform across the weeks analyzed, suggesting a consistent pattern of engagement with the materials provided.
During the 2020/2021 academic year, lectures and exercises were conducted synchronously via remote access, and all exercise sessions were recorded. Based on these recordings, 15 video lessons were created and made available on Merlin, allowing students to access them as supplementary learning material.
The variable
Video represents the number of times a student accessed video lessons in a given week, including all previously available lessons. The descriptive statistical indicators for the variable
Video per week are presented in
Table 3. The table indicates that students tend to watch video lessons more frequently in the weeks leading up to midterm exams. Additionally, exceptionally high maximum values are observed, probably due to the way Merlin logs activity, registering an interaction whenever a video is accessed, regardless of whether it is watched in its entirety or merely opened and closed.
During the semester, students can earn up to 70 assessment points through three midterm exams. The first midterm takes place in week 5, the second in week 11, and the third in week 16. The results of the third midterm were not included in the analysis, as they were obtained at the very end of the semester and are therefore not relevant for the development of an early identification system.
In addition to the midterms, students take four short bonus tests throughout the semester. These tests provide the opportunity to earn up to 5 additional points, helping students improve their midterm results. The bonus tests are administered at weeks 4, 7, 10, and 13.
The variables
Colloquium 1 and
Colloquium 2 denote the percentage of points obtained in the first and second midterm exams, respectively. The variables
Test 1,
Test 2,
Test 3, and
Test 4 record the percentage of points earned in the corresponding bonus tests. Descriptive statistical indicators for these variables are presented in
Table 4.
The results in
Table 4 show that students performed significantly better on the first midterm exam (Mean = 0.72, Median = 0.80) compared to the second midterm exam (Mean = 0.44, Median = 0.38), indicating a decrease in performance as the semester progressed. Furthermore, while the first and last tests had relatively higher mean and median scores, intermediate tests show notably lower averages, suggesting that many students either did not attempt these tests or struggled to achieve points.
Data on previous mathematical knowledge, collected through a questionnaire, together with the corresponding variables, are presented in
Table 5.
The results of the motivation questionnaire, along with the corresponding variables, are presented in
Table 6. However, encouraging student participation in these questionnaires proved challenging, resulting in a high rate of non-responses. Consequently, these variables introduced problems with missing data.
Table 6 shows that students exhibit the highest levels of motivation in external regulation (Mean = 5.62, Median = 6.00) and introjected motivation (Mean = 5.50, Median = 6.00), indicating that external pressures and internalized expectations significantly influence their academic engagement. In contrast, motivation to experience stimulation (Mean = 3.88, Median = 3.75) and identified motivation (Mean = 3.76, Median = 3.50) received the lowest scores, implying that fewer students are driven by personal identification with learning goals or the enjoyment of studying itself. The relatively high variability in responses, particularly in identified motivation (Std Dev = 1.84), suggests notable differences in how students perceive their reasons for academic effort.
5. Results
The Youden index is used to determine the threshold value c when converting a numerical variable into a dichotomous one. The value of c, for which the Youden index is the highest, represents the optimal threshold for distinguishing between negative and positive outcomes.
For example, if the variable Colloquium 1, which records the percentage of points obtained on the first midterm exam (ranging from 0% to 100%), is to be converted into a dichotomous variable that takes values 0 or 1, the optimal threshold (cut-off point) can be determined using the Youden index. All percentage values lower than the optimal threshold c will be assigned a value of 0, while all values equal to or greater than c will be assigned a value of 1.
For different threshold values of the percentage of points obtained on the first midterm exam, the numerical variable is transformed into a dichotomous variable. Then, for this independent dichotomous variable and the known values of the dependent dichotomous variable Success, the Youden index is calculated. The value of c for which the Youden index is the highest is the optimal threshold value for converting the numerical variable into a dichotomous one.
Table 7 presents several different threshold values for the variable
Colloquium 1 along with the corresponding Youden index values. The maximum Youden index value is achieved at a threshold of 0.82, making it the optimal threshold value for the variable
Colloquium 1.
All values of the variable Colloquium 1 that are less than 0.82 are assigned the value 0 , while all other values are assigned the value 1 , thus converting Colloquium 1 into a dichotomous variable. Using this method, all numerical variables for each of the 15 weeks of teaching were converted into dichotomous variables and then used for further analysis.
To identify the most relevant predictors of student success, Pearson’s chi-square test was applied to all dichotomous variables. A variable was considered significant if its associated p-value was below the threshold of 0.05.
For example, the value of the Pearson chi-square statistic for the variable Colloquium 1 is (according to expression (1)). The corresponding p-value is very small (), indicating a significant association between the variables Colloquium 1 and Success. This suggests that Colloquium 1 is a relevant variable for predicting the variable Success.
Table 8 presents the list of variables that met this criterion, organized by week, highlighting which aspects of student engagement and performance exhibit a statistically significant association with course success at different stages of the semester.
Of the 20 variables analyzed, 16 were identified as relevant and included in the subsequent analysis to develop the scoring system. The number of relevant variables fluctuated throughout the semester, with the fewest () observed in the second week and the highest () in the final week.
Following the identification of relevant variables, their association with course success was quantified using the Cramér’s
V coefficient. If, for example, we want to determine the value of Cramér’s
V coefficient for the variables
Colloquium 1 and
Success (for which the chi-square statistic was previously calculated as
), the calculation, according to expression (2), is as follows:
Table 9 presents the computed Cramér’s
V values for all significant variables throughout the weeks, indicating the strength of their relationship with the
Success variable. Higher values suggest a stronger predictive influence on student performance.
The results in
Table 9 indicate that prior academic performance, particularly
School grade (Cramér’s V = 0.362) and
Matriculation percentage (Cramér’s V = 0.325), maintains a consistent association with course success throughout the semester. Among motivational factors,
Introjected motivation (Cramér’s V = 0.409) and
Motivation toward accomplishment (Cramér’s V = 0.393) exhibit the strongest relationships with student outcomes.
Regarding LMS activity, Number of learning tests and Maximum of learning tests show fluctuating but notable associations, particularly in the weeks preceding the assessments (e.g., week 4: Cramér’s V = 0.425). Colloquium 1 (Cramér’s V = 0.593) and Colloquium 2 (Cramér’s V = 0.503) emerge as the strongest predictors, reinforcing the importance of early assessment performance in determining final success. The Sum of Cramér’s V values per week suggests an increasing trend, peaking in week 15 (5.903), indicating a growing influence of these predictors as the semester progresses.
5.1. Development of the Predictive Model
The Cramér’s V coefficient values from
Table 9 were normalized by dividing each value by the total sum of Cramér’s V coefficients for the corresponding week, then multiplying by 100 and rounding to the nearest whole number. This approach ensures that the relative contribution of each variable is proportionally represented within a standardized framework.
As a result, a weekly scoring system was developed, assigning coefficient-based weights to relevant activities for each of the 15 weeks (
Table 10). Within this framework, a student can accumulate a maximum of 100 points per week, providing a structured and interpretable measure of engagement and performance across the semester.
For 43 students who completed both surveys and for whom data on all relevant activities in the LMS Merlin and the value of the
Success variable were available, the number of points they achieved in each week was calculated. Then, for each week, the optimal cut-off point of the number of points for which the value of the Youden index is highest was determined. The optimal cut-off points for the sum of scores per week are shown in
Table 11.
Based on these optimal cut-off points for the sum of scores for each week, the numeric variable is transformed into a dichotomous variable.
5.2. Development of the Prediction Algorithm
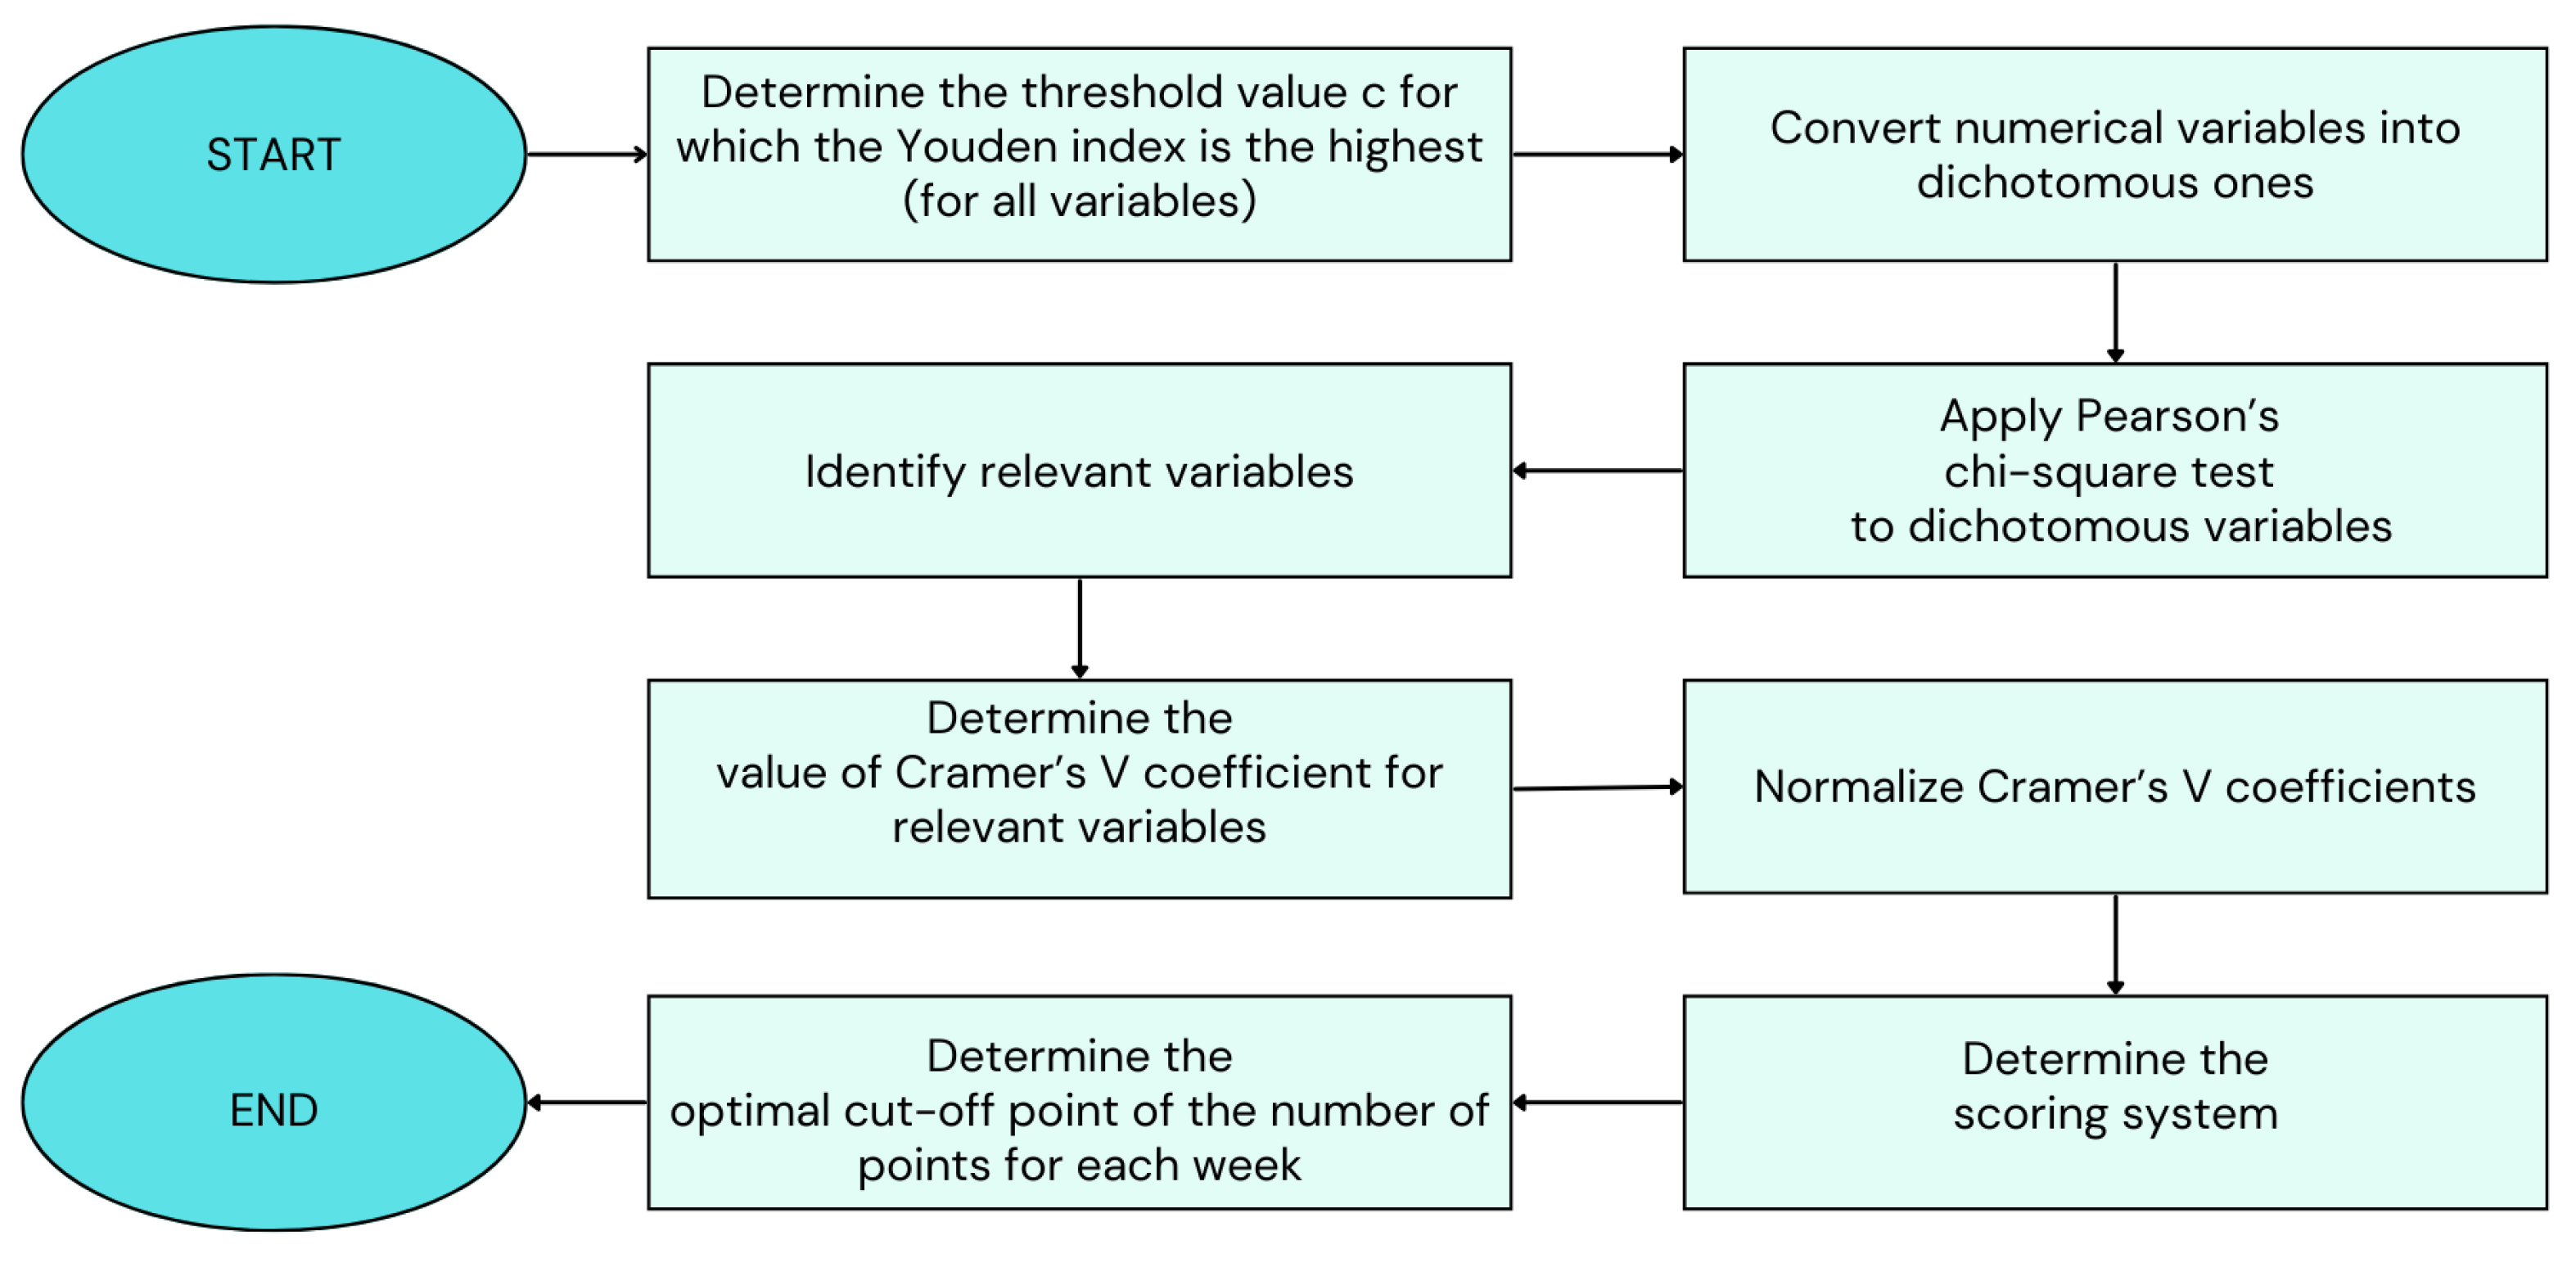
The scoring system is created at the end of the academic year when the values of the dependent variable, whether the student has passed or failed the course, are known. The described process of developing a scoring system that serves as a classification prediction model is illustrated by the flowchart in
Figure 5. By following this process, teachers can create their own scoring system. They must independently determine the student activities in their course that they want to track and consider as potential predictor variables. The model is applicable to different courses and different activities within a course. Once teachers have established their scoring system, they can use it in subsequent academic years to predict student success in the course.
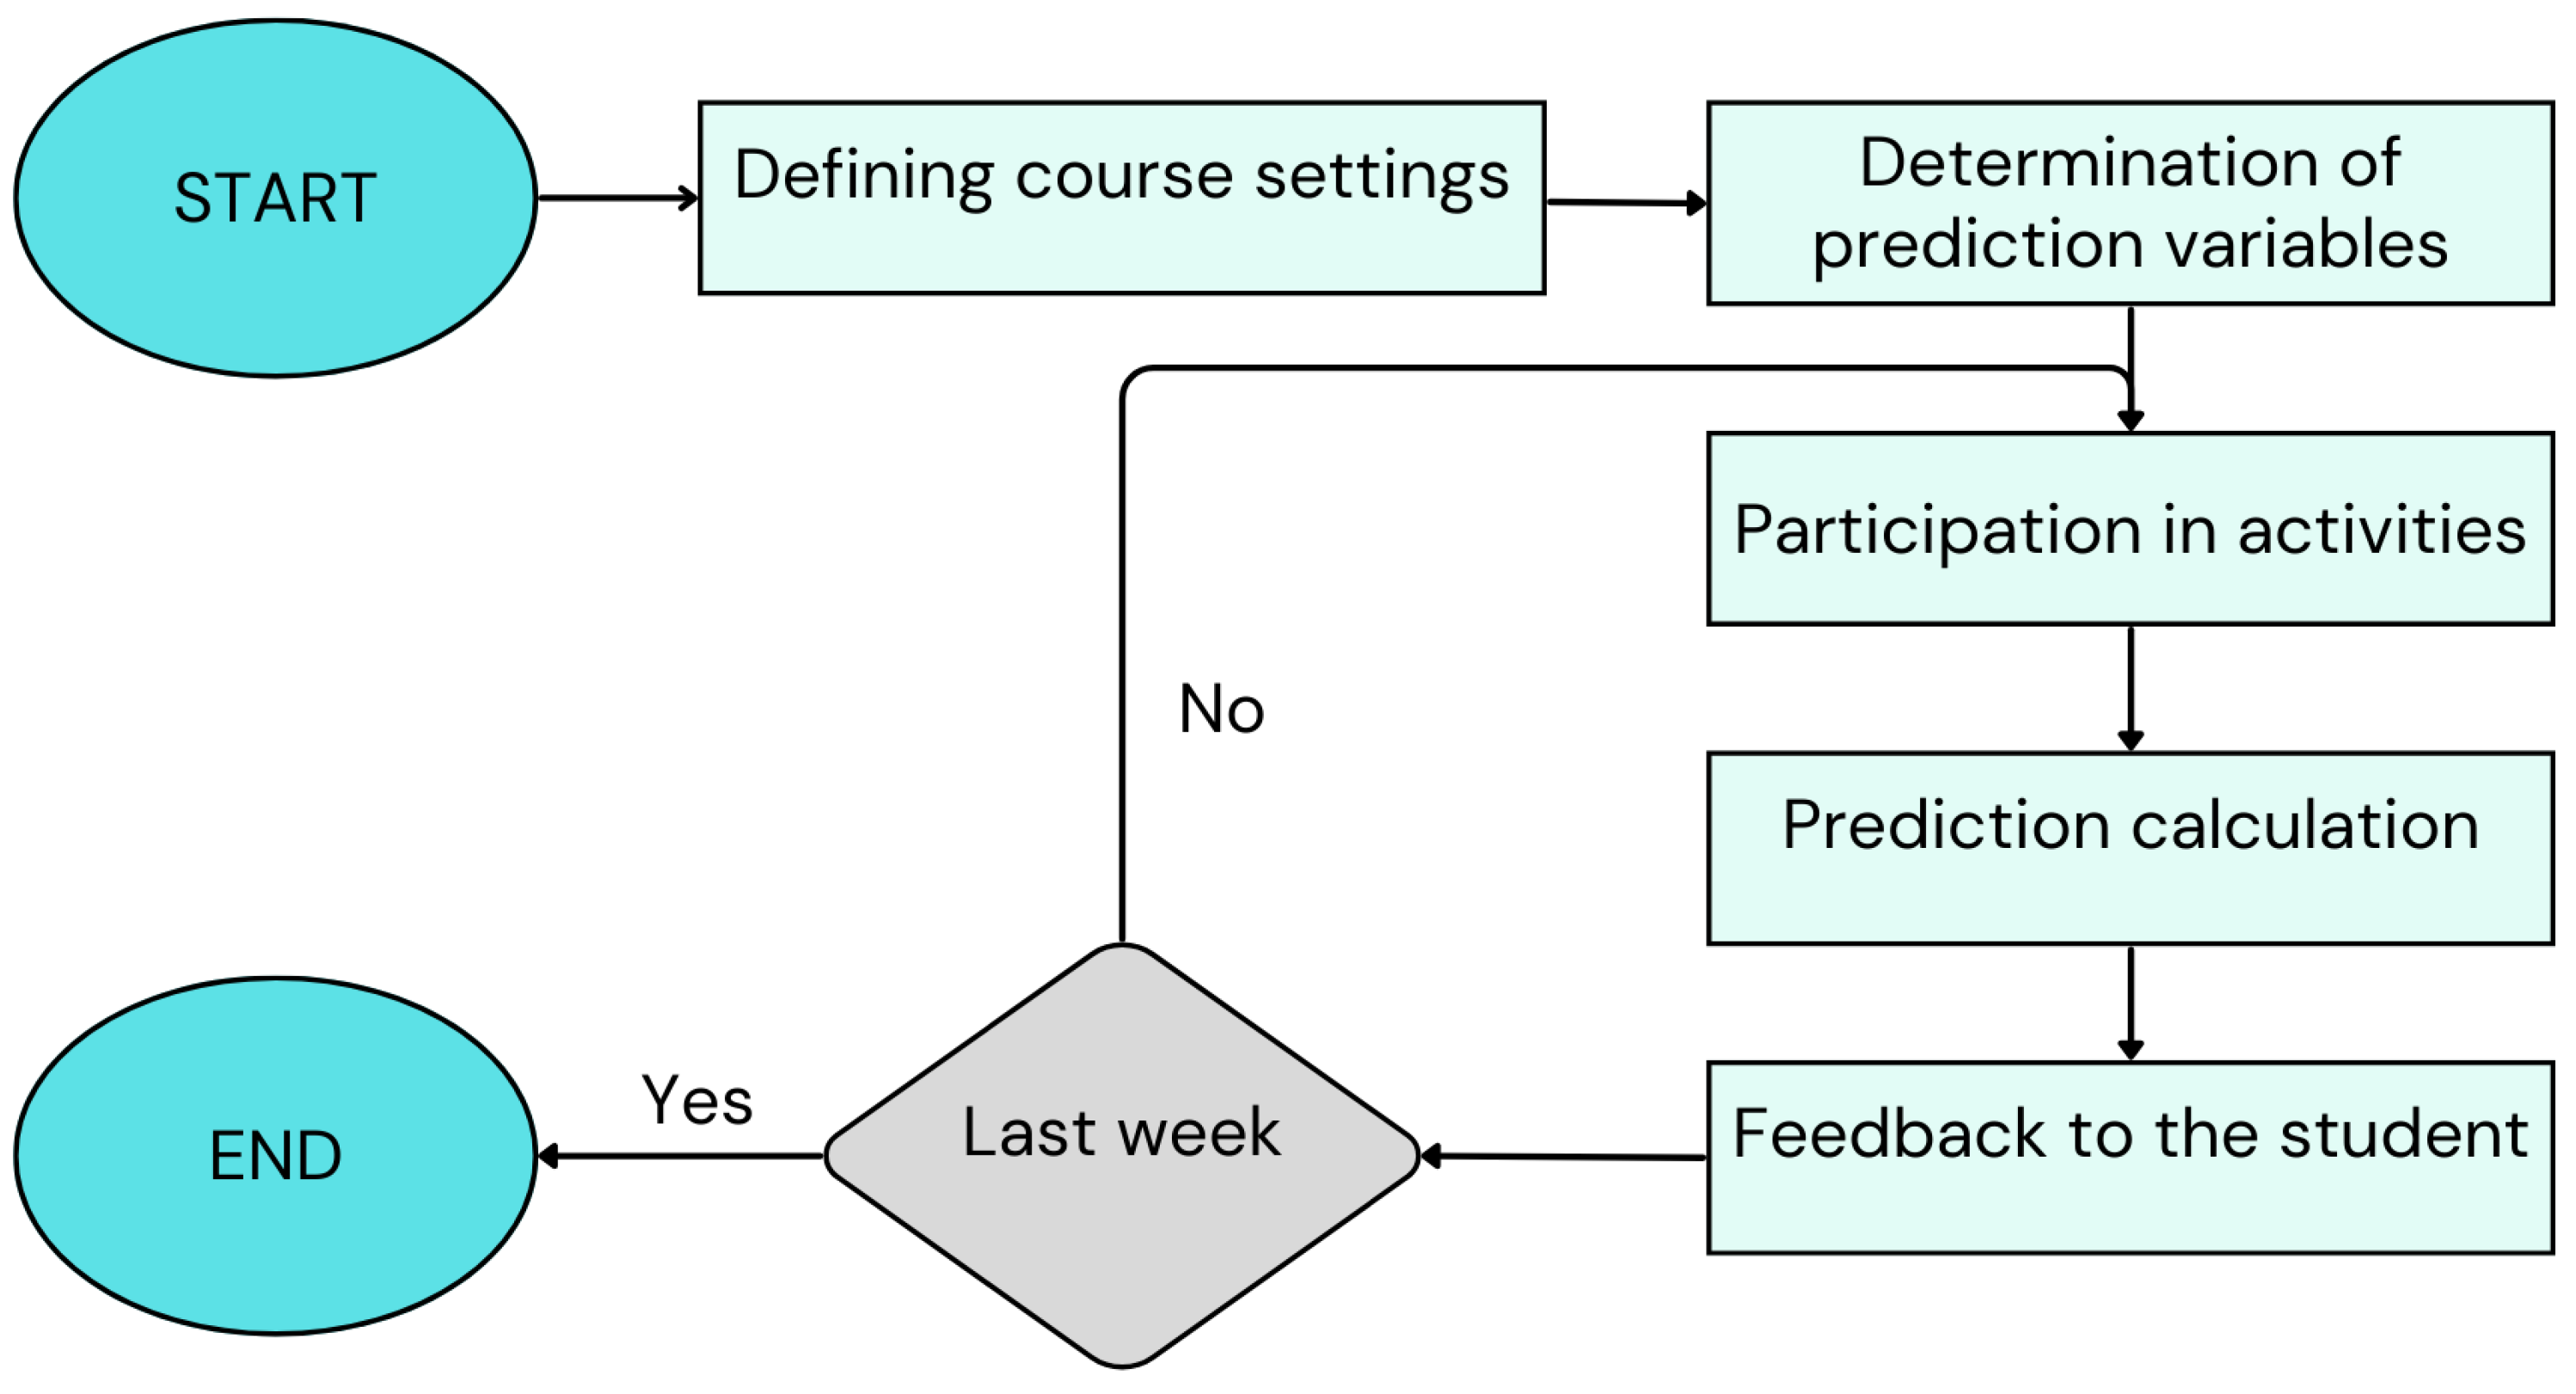
The predictive model was designed as a weekly classification system to assess the likelihood that students will fail the course. The algorithm follows a structured process, as illustrated in
Figure 6, ensuring that the predictions are continuously updated based on student engagement and performance data.
The process begins with the definition of the course settings, including the course structure, the grading policies, and key assessment milestones. The prediction variables are then determined, selecting relevant indicators such as attendance, participation, and self-reported engagement. These variables are collected through student surveys and activity logs.
Each week, the participation of students in the course activities is monitored, and based on their recorded participation a score is calculated. This score represents an aggregated measure of their academic performance and engagement up to that point. Students are then classified as “at risk” or “not at risk” based on a predefined cut-off threshold. If a student’s score falls below this threshold, they are flagged as at risk of failing the course.
This score-based classification is then used to provide personalized feedback to students, helping them understand their current risk level and encouraging corrective action if necessary. By making students aware of their status early in the semester, the system enables timely interventions that can improve their performance.
The process repeats weekly, updating the predictions dynamically. The system runs until the final week of the semester, at which point the iterative predictions stop.
This predictive model allows educators to implement targeted pedagogical strategies (feedback to the students) in real time. In our prospective study, these strategies include the following:
Individual consultation invitations, encouraging students to discuss their challenges and receive tailored guidance;
The integration of motivational narratives within lectures to reinforce resilience and engagement; and
The organization of group-based supplementary exercises, fostering peer learning and collaborative problem-solving.
Beyond direct interventions, predictive insights are also used to guide students toward specific learning resources. Based on their risk score, students are advised to review selected video lectures, attempt additional problem sets, or revisit fundamental concepts, ensuring that support is both personalized and actionable.
5.3. Retrospective Model Evaluation
To assess the performance of the predictive model, its predictions were compared with the true labels of the test dataset.
Table 12 presents the accuracy, specificity, sensitivity, and AUC-ROC values for each of the 15 weeks of teaching.
Performance metrics indicate that the model maintained stable accuracy throughout the weeks, with consistently high sensitivity values, suggesting that it effectively identified students at risk of failing the course. The AUC-ROC values remained above 0.78 in all weeks, peaking at week 15 (0.89), indicating strong discriminatory power. In particular, sensitivity was highest in the initial weeks but exhibited a gradual decrease towards the final weeks, which could be attributed to evolving student engagement patterns over the semester.
5.4. Prospective Model Evaluation
The system was evaluated a second time in the following academic year using data from 70 students attending the same course.
Table 13 presents the accuracy, specificity, sensitivity, and AUC-ROC values of the predictive model for the first four weeks.
For this analysis, the outcome variable Success was determined based on the results of the students in the first colloquium. Students who scored below the passing threshold were classified as “at risk”, while those who passed were classified as “successful”. This definition aligns with the objective of identifying at-risk students early enough to allow timely intervention.
In the context of early identification of at-risk students, the performance metrics for week 4, the week preceding the first colloquium, are particularly revealing. The model achieved an accuracy of 93%, with both specificity (92%) and sensitivity (95%) reaching their highest levels. This suggests that by week 4, the model was able to reliably distinguish between students who were likely to pass and those at risk of failing, providing a strong basis for early intervention strategies.
A comparison between retrospective and prospective evaluations reveals differences in model performance across academic years. While the overall trend of high sensitivity and stable accuracy is consistent, week 4 of the prospective evaluation shows significantly higher predictive power. These differences and their possible causes are further analyzed in the
Section 6.
6. Discussion
The scoring system was designed based on 16 variables. A direct numerical comparison of the relationships between different prediction variables and their impact on student performance across studies is limited due to methodological differences. However, the result remains qualitatively the same; it is crucial to identify which variables are relevant predictors, regardless of the method used.
Prior academic performance—specifically School grade (Cramér’s V = 0.362) and Matriculation percentage (Cramér’s V = 0.325)—emerges as the strongest predictor. This aligns with the foundational nature of mathematics, where new concepts build upon previously acquired knowledge.
Motivational variables also played a crucial role, with both intrinsic (
Toward accomplishment, Cramér’s V =
0.393) and extrinsic components (
Introjected, Cramér’s V =
0.409) emerging as consistent predictors across all weeks. These findings align with previous research [
5,
6], confirming that motivation significantly influences engagement and persistence, making it an essential component of predictive modeling.
However, a key challenge in incorporating both academic and non-academic variables lies in their method of collection. Unlike the variables obtained directly through the LMS, these data were collected using two voluntary questionnaires. In particular, 43% of the students did not complete them, leading to missing data that could impact the reliability of the predictions. Missing responses may introduce selection bias, where students who voluntarily participate in surveys differ systematically from those who do not, potentially skewing model results.
To ensure the robustness of the model, it is essential to address this limitation. Educators should clearly communicate the purpose and benefits of the prediction model to students, emphasizing how their participation can lead to better support and intervention strategies. Actively encouraging students to complete both questionnaires in the first week of instruction is crucial to ensuring the reliability of predictions. Increasing response rates, for instance, by embedding surveys into early course activities, could further enhance prediction accuracy.
The variables that capture students’ engagement in solving tasks throughout the semester (task engagement metrics:
Number of learning tests,
Maximum of learning tests,
Number of practice tests,
Maximum of practice tests) play a particularly significant role in predicting student outcomes. Our findings align with previous research [
7,
8], which also identified time spent on various course components, such as tests and assignments, along with quiz and assignment scores, as key predictors of overall course performance.
Specifically, these task engagement metrics emerge as significant predictors of Success in at least 6 out of 15 weeks. In contrast, variables Video and Presentation appear as relevant predictors in fewer weeks. This discrepancy may be attributed to the way LMS Merlin records these activities: The system records only whether an activity was accessed, lacking finer engagement metrics, such as time spent reviewing materials or depth of interaction, which may limit its predictive reliability. As a result, recorded engagement with these resources may not always reflect real learning activity, making them a less reliable predictor compared to interactive assessments such as tests and quizzes.
In line with [
9], our study underscores the importance of using historical academic performance data to predict future outcomes. Student assessment activities throughout the semester (
Test 1,
Test 2,
Test 4,
Colloquium 1,
Colloquium 2) consistently emerge as strong predictors of
Success in all weeks following their completion (Cramér’s V values between 0.322 and 0.593). These assessments represent critical intervention points. Identifying students with low performance early enables timely adjustments to instructional methods, including adaptive learning resources, targeted feedback, and structured peer support.
The scoring system was developed using classical statistical methods, with numerical variables transformed into categorical, dichotomous variables based on the Youden index, which optimally separates students at risk of failing from those predicted to succeed. The relationship between key variables and Success was quantified using Cramér’s V coefficients, allowing us to assess the strength of the association between predictor variables and student performance.
Cramér’s V and the Youden index were selected because of their suitability for the analysis of categorical data, the optimization of threshold values, and their practical interpretability in the field of education. Cramér’s V quantifies the strength of association between nominal or ordinal variables and is therefore particularly suitable for assessing the relationship between early course performance indicators and final student outcomes. Unlike Pearson’s correlation coefficient, which is designed for continuous variables and assumes a linear relationship, Cramér’s V captures nonlinear dependencies and allows for easy interpretation of categorical predictors [
34]. The Youden index has been used to establish optimal cut-off points for academic risk classification. While ROC curves provide a comprehensive assessment of classification performance by plotting sensitivity against specificity, they do not inherently define a single optimal threshold. The Youden index, on the other hand, directly identifies the threshold that maximizes both true-positive and true-negative rates, making it particularly effective for balancing sensitivity and specificity in early intervention strategies [
32].
The resulting scoring system and its associated algorithm function as a predictive classification model, forecasting student Success throughout all 15 weeks of instruction. What distinguishes this model is its transparency, ease of interpretation, and practical applicability. While complex machine learning models may offer marginally higher predictive accuracy, this approach provides educators with direct insights into the contribution of each variable to student performance, making it particularly suited for educational interventions.
Our study builds on previous research [
13,
14,
15], reinforcing the importance of interpretable models that not only achieve strong predictive performance but also offer actionable insights into their decision-making processes. By providing clear, interpretable predictions, this model enables instructors to implement proactive teaching strategies. For example, educators can use early warning indicators to tailor instructional pacing, design adaptive assignments, or introduce peer mentoring programs to support at-risk students.
The robustness of the model was evaluated in two phases: first in its development dataset and later in a new cohort where real-time interventions were introduced.
Evaluation of the original dataset demonstrated consistent performance across all weeks in identifying students at risk of failing Mathematics 1. With consistently high sensitivity, the model effectively flagged nearly all students who were genuinely at risk, aligning with the primary goal of the study. Specificity varied across weeks, occasionally flagging students as at risk when they were not. Future refinements could explore adaptive thresholds that dynamically adjust to student behavior trends, ensuring that interventions remain timely and precisely targeted. However, this trade-off is acceptable in this context, as the priority is to minimize false negatives, ensuring that no genuinely at-risk students go unnoticed. In an educational setting, identifying all at-risk students—even at the cost of a few false positives—is preferable to missing those who need support.
The consistently high AUC-ROC scores (above 0.80) confirm the model’s strong discriminative power, indicating its robustness in distinguishing between at-risk and non-at-risk students even as engagement patterns fluctuate over the semester. This stability suggests that the model captures core behavioral trends that persist across different teaching weeks, maintaining stable predictive power regardless of minor variations in student engagement patterns.
Given this strong discriminative performance, we next examined whether real-time interventions could further enhance the model’s effectiveness in guiding student behavior. The model was tested a second time using new data, now incorporating an intervention component. Each week, students received messages informing them of their scores and predicted risk of failing the course. Those identified as at risk also received targeted intervention messages with specific recommendations on how to improve their performance the following week.
As a result, performance metrics evolved over the first four weeks, reflecting the impact of these interventions. Students flagged as at-risk adjusted their behavior based on the feedback, leading to changes in their status over time. The most critical point of analysis is the fourth week, the week before the first colloquium, where the model demonstrated particularly high sensitivity (0.95). This is crucial as it ensures that almost all at-risk students are correctly identified and have the opportunity to take corrective action before a major assessment.
Our model achieves accuracy and AUC-ROC of 0.93 in the fourth week, performing as well as, or in some cases better than, other recently published models. For instance, Akçapınar et al. developed an early warning system to identify students at risk, with their model achieving its highest accuracy in the 3rd and 6th weeks, at 0.79 and 0.81, respectively [
23]. Additionally, Osborne and Lang’s research confirmed that LMS data can be effectively used to create predictive models capable of identifying at-risk students as early as the fifth week of the semester. Their model achieved an accuracy of 0.877, a sensitivity of 0.265, a precision of 0.601, a specificity of 0.973, and an AUC-ROC of 0.808 [
24].
The model’s effectiveness in early identification and intervention underscores its value as a proactive tool for improving student outcomes and reducing failure rates. These findings align with previous research [
17,
18,
19], reinforcing the idea that early predictions can significantly influence student success by enabling timely and targeted interventions. Future implementations should examine how predictor variables may need to be adapted for different subjects, particularly those that rely on project-based learning or qualitative assessment rather than structured problem-solving and quantitative exams.
The comparison between retrospective and prospective evaluations demonstrates the model’s adaptability across different student cohorts, further reinforcing its potential for broader application. While both evaluations confirmed high sensitivity and stable predictive power, key improvements emerged in the prospective evaluation, particularly when combined with an intervention component. The observed increase in early-stage accuracy and sensitivity suggests that students in the second cohort responded more actively to feedback, potentially due to greater awareness of their academic standing and the motivational effect of targeted intervention messages. These findings reinforce the importance of continuous monitoring and refinement of predictive models to ensure their effectiveness across different student cohorts. Future research should explore the model’s applicability across diverse student populations and learning environments, particularly in assessing whether predictive improvements remain consistent across different institutional and curricular structures. Additionally, further studies should examine how refining the timing, frequency, and messaging of interventions can maximize student responsiveness and long-term academic outcomes.
This study has opened several avenues for future research, particularly in the refinement of the prediction model and its practical application. One promising direction is to restructure the course organization to highlight the milestones that have the greatest impact on early risk detection. Identifying these critical points could allow instructional strategies to be optimized and assessments to be aligned with key moments of student engagement.
In addition, developing comprehensive guidelines for educators could facilitate the implementation of educational interventions and ensure that support mechanisms are both timely and effective. While this study has demonstrated the predictive accuracy of the model, future research should investigate how different types of feedback affect student motivation and performance. Understanding the psychological and behavioral responses to predictive analytics could shed light on how students adjust to receiving regular assessments of their academic performance. In addition, it is important to explore the applicability of the model beyond STEM disciplines to determine whether similar indicators have predictive power in fields that rely on qualitative assessment rather than structured problem-solving.
Beyond student-centered implications, faculty acceptance of predictive systems remains an open question. Investigating how teachers perceive and integrate such models into their teaching practice could reveal barriers to adoption and identify strategies to improve user confidence and system usability. The ethical implications of predictive learning analytics, particularly the trade-offs between early intervention, student autonomy, and data privacy, also require further investigation.
Ultimately, the refinement of predictive models should go beyond accuracy metrics and focus on their broader implications for student learning, institutional practices, and educational equity. By answering these questions, future research can contribute not only to improving the detection of academic risk, but also to shaping a more adaptive, responsive, and ethical educational environment.
7. Conclusions
The proposed algorithm provides a practical and adaptable framework for the early detection of students at risk of failure, offering a balance between predictive accuracy, interpretability, and ease of implementation. Its simplicity, ease of implementation, and minimal computational requirements make it highly accessible to a broad spectrum of educational institutions, regardless of their technological infrastructure. The model’s iterative weekly application allows for continuous monitoring and timely interventions, ensuring that students receive support before their performance declines significantly. Additionally, the integration of Cramér’s V measure and the Youden index enables systematic predictor selection and the establishment of clear risk thresholds.
The analysis showed that the most influential predictors included prior academic performance, with Cramér’s V values of 0.362 for grades and 0.325 for enrollment rates, as well as motivational factors, such as introjected motivation (0.409) and achievement motivation (0.393). Among the course engagement variables, weekly test performance and early assessments showed the highest predictive power, with Colloquium 1 and Colloquium 2 achieving Cramér’s V values of 0.593 and 0.503, respectively. The Youden index was applied to determine optimal thresholds for risk classification, with weekly thresholds ranging from 32 to 55 points, as shown in
Table 11. These scores provide an objective basis for early risk detection and enable timely and targeted interventions.
A key advantage of this approach is its methodological simplicity, relying on well-established statistical techniques that are widely accepted among educators. This increases the likelihood of adoption, particularly among senior instructors who may have reservations about more complex machine learning methods. Furthermore, the model combines objective indicators of prior knowledge, motivational characteristics, and student work habits, creating a holistic predictive model rather than relying solely on learning analytics from the LMS.
By structuring the model as an algorithm, its automation is straightforward, making it scalable for courses with large student enrollments. The model is also designed to accommodate weekly variations in student behavior, allowing educators to track changes over time and adjust interventions accordingly. A clear methodological framework is provided, making it adaptable to different courses, either through direct implementation or minor adjustments.
One of the most impactful aspects of the model is its intervention component, which enables educators to provide individualized support to at-risk students. The prospective analysis demonstrated that the model exhibited exceptionally high discriminative power in the week before the first major exam, ensuring that nearly all at-risk students were correctly identified in time for targeted interventions. The high sensitivity of the scoring system further guarantees that students in need of support are not overlooked.
Despite these strengths, some challenges remain. The relatively small sample size in this study was a limitation, although the prospective analysis indicated that this did not significantly affect the model’s performance. Additionally, collecting motivational and non-LMS data proved challenging, as it required voluntary student participation, potentially impacting response rates. While the model can be integrated into existing LMS platforms, some degree of manual processing may be required, posing an implementation challenge for large-scale adoption. Lastly, although alternative statistical methods (e.g., logistic regression) could be explored for further refinement, the choice of simpler techniques was intentional, prioritizing interpretability and practical application.
The proposed model has already been successfully implemented in our prospective analysis, where it was directly applied to real teaching scenarios without modification. Through this implementation, we utilized previously described pedagogical interventions, including individual consultations, motivational components in lectures, targeted study recommendations, and structured peer-support activities. Given the universal nature of academic risk factors, we believe that this framework could be effectively applied to all STEM courses, provided that appropriate interventions are systematically integrated into the instructional process.
From a broader perspective, the model’s meta-structure is highly adaptable across different courses and institutions. However, its implementation requires context-specific adjustments to align with institutional policies, such as the number of permitted assessments, methods of continuous evaluation, and ethical guidelines for data collection. While inherently designed for STEM disciplines, where structured assessment and standardized grading are prevalent, the model would require modifications for subjects involving laboratory work, such as chemistry, biology, or physics.
Beyond STEM fields, the model’s applicability in humanities and social sciences necessitates further investigation. These disciplines often emphasize discussion-based instruction and essay-style assessments, differing significantly from the quantitative evaluation methods used in STEM. However, with adequate quantification of qualitative indicators, a similar predictive framework could potentially be developed for these fields, expanding the model’s reach to a broader academic spectrum.
To enhance practical usability, efforts should focus on raising awareness among both students and faculty regarding the model’s potential benefits. Continuous faculty training and student orientation sessions would facilitate its seamless integration into the educational workflow. Furthermore, greater automation of the predictive process would streamline its implementation, reducing the need for manual data handling and increasing accessibility for instructors.
The model should also undergo periodic validation and refinement, ensuring its continued relevance by incorporating new predictors as educational environments evolve. Additionally, adapting course structures to better align with data-driven insights—for example, refining assessment schedules to generate key performance indicators earlier in the semester—could further enhance its predictive accuracy and effectiveness in guiding interventions. Ultimately, the long-term success of this model depends not only on its statistical robustness but also on its integration into institutional practices. By fostering a culture of data-informed teaching, facilitating contextual adaptations, and maintaining continuous model evaluation, this approach has the potential to become an invaluable tool for academic risk detection and personalized student support.
Future work should focus on validating the algorithm’s effectiveness across diverse datasets and educational systems, ensuring its scalability and adaptability. Expanding its applicability and refining its predictive capabilities will solidify its role as a scalable, data-driven solution for improving student retention, academic performance, and overall educational outcomes.


