Article

Hardware–Software Co-Design Architecture for Real-Time EMG Feature Processing in FPGA-Based Prosthetic Systems

by
Carlos Gabriel Mireles-Preciado
1,
Diana Carolina Toledo-Pérez
2,
Roberto Augusto Gómez-Loenzo
2,*,
Marcos Aviles
1 and
Juvenal Rodríguez-Reséndiz
2,*
1
Facultad de Informática, Universidad Autónoma de Querétaro, Querétaro 76230, Mexico
2
Facultad de Ingeniería, Universidad Autónoma de Querétaro, Querétaro 76010, Mexico
*
Authors to whom correspondence should be addressed.
Algorithms 2025, 18(10), 617; https://doi.org/10.3390/a18100617
Submission received: 21 August 2025 / Revised: 22 September 2025 / Accepted: 27 September 2025 / Published: 30 September 2025
(This article belongs to the Special Issue Machine Learning in Medical Signal and Image Processing (3rd Edition))

Abstract

This paper presents a novel hardware architecture for implementing real-time EMG feature extraction and dimensionality reduction in resource-constrained FPGA environments. The proposed co-processing architecture integrates four time-domain feature extractors (MAV, WL, SSC, ZC) with a specialized PCA matrix multiplication unit within a unified processing pipeline, demonstrating significant improvements in power efficiency and processing latency compared to traditional software-based approaches. Multiple matrix multiplication architectures are evaluated to optimize FPGA resource utilization while maintaining deterministic real-time performance using a Zed evaluation board as the development platform. This implementation achieves efficient dimensionality reduction with minimal hardware resources, making it suitable for embedded prosthetic applications. The functionality of this system is validated using a custom EMG database from previous studies. The results demonstrate a 7.3× speed improvement and 3.1× energy efficiency gain compared to ARM Cortex-A9 software implementation, validating the architectural approach for battery-powered prosthetic control applications.

1. Introduction

Field-Programmable Gate Arrays (FPGAs) have emerged as powerful platforms for implementing complex digital signal processing algorithms, offering unique advantages in parallel processing capabilities and real-time performance while maintaining low power consumption [1]. This combination of features has made FPGAs increasingly attractive for portable biomedical applications, where power efficiency and processing speed directly impact device usability and patient outcomes [2]. The reconfigurability of FPGAs also enables adaptive processing architectures that have been optimized for specific biomedical signal processing requirements [3].
In biomedical applications, FPGAs have demonstrated success across various domains, including ECG analysis [4,5], brain–computer interfaces [6], and real-time biosignal processing [7]. Electromyography (EMG) measures electrical activity produced by skeletal muscles during contraction and relaxation [8,9]. These signals are inherently complex, containing useful information about muscle activity but, unfortunately, also various types of noise from physiological and environmental sources [10]. The high-dimensional nature of raw EMG signals, combined with their non-stationary characteristics, presents significant challenges for real-time processing and analysis [11,12].
While existing EMG processing systems typically implement feature extraction and dimensionality reduction as separate software modules running on general-purpose processors, this approach suffers from significant latency overhead and power consumption issues in portable applications. Recent studies [13] have shown that Principal Component Analysis (PCA) and FPGA co-processing for biosignals, particularly EMG, are gaining traction. The key architectural innovation presented in this work is the co-integration of time-domain feature extraction with PCA transformation in a single FPGA processing pipeline, eliminating data transfer bottlenecks and enabling deterministic real-time processing suitable for prosthetic control applications.
This demands efficient processing architectures that operate within the constraints of portable devices; their implementation for EMG signal processing presents unique challenges, particularly in prosthetic control systems [14,15]. Traditional software-based approaches often struggle to meet these requirements, especially in real-time applications where processing latency directly impacts user experience [16].
While PCA implementations on FPGAs have been explored for various applications, EMG signal processing for prosthetic control presents unique challenges that general-purpose PCA implementations do not adequately address. Unlike many other applications, EMG-based prosthetic control requires: (1) ultra-low power operation to maximize battery life in wearable contexts, (2) deterministic real-time processing with latencies under 300 ms to maintain natural movement perception, and (3) sufficient accuracy with minimal resource utilization to enable integration into compact prosthetic devices. These specific constraints necessitate specialized architectural approaches beyond standard matrix multiplication implementations.
The accuracy and reliability of these applications depend heavily on effective signal processing techniques [17]. PCA has emerged as a powerful tool for EMG signal processing, offering multiple benefits for both analysis and practical applications [18], such as enabling more efficient pattern recognition in prosthetic applications [19]. The technique’s ability to reduce data dimensionality while preserving essential signal characteristics makes it particularly valuable for real-time processing systems [20,21]. By applying PCA to EMG signals, researchers remove the noise and artifacts interfering with prosthetic control [22,23], while extracting relevant features for pattern recognition [24,25], enabling more accurate identification of intended movements and gestures.
Implementing PCA on FPGAs, however, requires careful consideration of resource utilization and processing architecture to maintain real-time performance while minimizing power consumption [26].
Recent FPGA implementations of PCA for biomedical applications have explored various architectural approaches. Relevant recent contributions include FPGA-based PCA accelerators [27], energy-efficient EMG pre-processing [28,29], and co-processor solutions [30,31]. Some implementations have focused on maximizing accuracy through floating-point arithmetic, while others have prioritized resource efficiency through fixed-point arithmetic and optimized matrix operations [32]. However, these approaches often fail to achieve an optimal balance between resource utilization and processing accuracy, particularly for the specific requirements of EMG processing in prosthetic applications [33].
The growing complexity of prosthetic control systems has further emphasized the need for efficient dimensionality reduction techniques. Modern prosthetic devices often incorporate multiple EMG channels and sophisticated control algorithms, making the optimization of pre-processing steps, including feature extraction and dimensionality reduction, increasingly critical [34]. The real-time constraints of prosthetic control applications, typically requiring response times under 300 ms for natural movement, add another layer of complexity to the implementation challenge [17].
This paper presents an architectural case study that demonstrates the advantages of integrating EMG feature extraction with dimensionality reduction in embedded FPGA systems. The primary contributions are as follows:
  • A novel co-processing architecture that integrates time-domain feature extraction (Mean Absolute Value, MAV; Waveform Length, WL; Slope Sign Changes, SSC; Zero Crossings, ZC) with PCA transformation in a unified FPGA pipeline, eliminating traditional software processing bottlenecks.
  • Comparative architectural analysis of three matrix multiplication implementations (full, block-based, and column-based), demonstrating optimal resource utilization strategies for EMG processing in resource-constrained environments.
  • Quantitative performance evaluation showing 7.3× speed improvement and 3.1× energy efficiency gain compared to ARM Cortex-A9 software implementation, validating the architectural approach for battery-powered prosthetic applications.
  • A complete hardware–software co-design methodology using Zynq SoC platform that enables rapid prototyping and validation of EMG processing algorithms in embedded systems.
The proposed system leverages the processing capabilities of the Zynq SoC platform, combining the flexibility of a Linux-based operating system with the performance advantages of custom hardware accelerators. This hybrid approach enables efficient implementation of both the feature extraction and PCA computation stages while maintaining system flexibility for future upgrades and modifications [35].
The remainder of this paper is organized as follows. Section 2 describes the theoretical background of PCA and EMG feature extraction, including the mathematical foundations and implementation considerations. Section 3 presents a detailed description of the database structure and experimental system implementation, focusing on the hardware architecture and processing pipeline. Section 4 discusses the experimental results and performance analysis, including resource utilization metrics and processing latency measurements. Finally, Section 5 concludes the paper and suggests directions for future research in FPGA-based signal processing for prosthetic applications.

2. Methods

2.1. Hardware-Implemented EMG Feature Extraction Metrics

In Appendix A, several features in different domains are described. In this section, we describe the four features implemented in hardware (HW) as part of the FPGA firmware (FW), which are summarized in Table 1.

2.1.1. MAV—Mean Absolute Value

Definition: MAV is the average of the absolute values of the EMG signal over a certain window or segment of N samples:
MAV = 1 N i = 1 N | x i | ,
where x i is the EMG signal value at sample i, and N is the number of samples in the segment.
Application: MAV reflects the muscle activation level and is widely used in muscle fatigue studies and prosthetic control.

2.1.2. WL—Waveform Length

Definition: WL is the cumulative length of the waveform over a specific time segment:
WL = i = 1 N 1 | x i + 1 x i | ,
where x i is the EMG signal value at sample i, and N is the number of samples in the segment. It represents the complexity and energy of the signal.
Application: WL is sensitive to both amplitude and frequency changes in the EMG signal, making it useful for feature extraction in classification tasks.

2.1.3. SSC—Slope Sign Changes

Definition: SSC counts the number of times the slope of the EMG signal changes direction, surpassing a predefined threshold:
SSC = i = 2 N 1 ( x i x i 1 ) · ( x i + 1 x i ) < 0 | x i + 1 x i | > Δ ,
where  Δ is the threshold value; it measures the frequency content of the signal.
Application: Useful for identifying signal characteristics such as muscle contractions or fatigue.

2.1.4. ZC—Zero Crossings

Definition: ZC counts the number of times the EMG signal crosses the zero amplitude line within a segment, considering a threshold for noise reduction:
ZC = i = 1 N 1 ( x i · x i + 1 < 0 ) | x i x i + 1 | > Δ ,
where Δ is the threshold value.
Application: ZC is an indicator of signal frequency and is often used in pattern recognition for movement classification.

2.2. FPGA-Efficient PCA Matrix Computation Architecture

Given a set of n (properly scaled if necessary) samples x 1 , x 2 , …,  x n R m , they form the dataset
X = x 1 x 2 x n .
Each of the m features x 1 , j , x 2 , j , …,  x m , j of a particular sample  x j provides a different amount of “information” that is usually correlated up to some degree with the other features. The main goal of the Principal Component Analysis (PCA) is to “untangle” this information, that is, to detect the most relevant data, which is to be mapped to an r-dimensional data subspace with  r m . In other words, the goal is to reduce the dimensionality of each sample  x j by replacing it with an r-dimensional vector  x j (with r m ) that contains almost the same amount of information but, with a reduced dimension, is processed faster with the same computing power. This new dataset
X = x 1 x 2 x n , r m ,
is computed as follows:
  • The average/mean by row is computed,
    μ X = μ 1 μ 2 μ m = 1 n j = 1 n x 1 , j 1 n j = 1 n x 2 , j 1 n j = 1 n x m , j
  • Then, it is subtracted from each sample in the dataset,
    X μ X 1 = x 1 , 1 μ 1 x 1 , 2 μ 1 x 1 , n μ 1 x 2 , 1 μ 2 x 2 , 2 μ 2 x 2 , n μ 2 x m , 1 μ m x m , 2 μ m x m , n μ m
    (remember that  u v = u v T ), where  1 = ( 1 , , 1 ) R n ,
  • To compute the covariance matrix,
    Σ = 1 n 1 ( X μ X 1 ) ( X μ X 1 ) R m × m .
  • Given that Σ is a symmetric matrix, its eigenvectors  v 1 , …,  v m R m and its corresponding eigenvalues  λ 1 , …,  λ m are computed using the Jacobi eigenvalue algorithm [36] to obtain
    Λ = V 1 Σ V ,
    where
    V = v 1 v 2 v m , Λ = λ 1 0 0 0 λ 2 0 0 0 λ m ;
    notice that, given that  Σ is symmetric with real entries, V  is orthogonal, that is, V 1 = V T .
To reduce the data to a dimension r, the r eigenvectors v 1 , …,  v r associated with the r largest eigenvalues  λ 1 , …,  λ r are taken (the first r eigenvalues are the largest eigenvalues, that is,
| λ 1 | | λ 2 | | λ r | ,
given that the eigenvalues and their corresponding eigenvectors are rearranged to guarantee this), and then the original data is projected onto the vector subspace spanned by  v 1 , …,  v r , that is, coordinates t 1 , j , t 2 , j , …,  t r , j are determined in such a way that
proj x j = t 1 , j v 1 + t 2 , j v 2 + + t r , j v r .
Remark that, by definition, each x j proj x j must be orthogonal to every vector in the span of v 1 , v 2 , …,  v r , that is
( x j proj x j ) · v 1 = 0 , ( x j proj x j ) · v 2 = 0 , ( x j proj x j ) · v r = 0 ,
which is equivalent to,
v 1 T [ x j ( t 1 , j v 1 + t 2 , j v 2 + + t r , j v r ) ] = 0 , v 2 T [ x j ( t 1 , j v 1 + t 2 , j v 2 + + t r , j v r ) ] = 0 , v r T [ x j ( t 1 , j v 1 + t 2 , j v 2 + + t r , j v r ) ] = 0 .
By using the notations  V r = v 1 v 2 v r and t j = ( t 1 , j , t 2 , j , , t r , j ) , it is rewritten as
v 1 T [ x j V r t j ] = 0 , v 2 T [ x j V r t j ] = 0 , v r T [ x j V r t j ] = 0 ,
that is,
V r T ( x j V r t j ) = 0 ,
and thus
V r T V r t j = V r T x j .
Since the vectors v 1 , v 2 , …,  v r are orthogonal to each other (because they are eigenvectors of the symmetric matrix  Σ ), V r T V r = I , which simplifies the dimensionality reduction to
t j = V r T x j .
If the dataset  X is transposed, as usually is the case when samples are stored as rows and features as columns, we must compute
t j T = x j T V r ,
or, for the whole dataset,
T T = X T V r .
The FPGA-based computation of (1) is described in detail in Section 3.2.3. Given that  x j T is computed, as described in Section 2.1, in the same FPGA, there is no need to transfer the data from the microprocessor once  V r is stored in the FPGA, which accelerates greatly the performance (see Figure 10).

2.3. Architectural Design Rationale

The selection of time-domain features (MAV, WL, SSC, ZC) and PCA for this architectural study is based on computational compatibility rather than algorithmic novelty. These features were chosen because:
  • Hardware Simplicity: They require only basic arithmetic operations (addition, subtraction, comparison) that map efficiently to FPGA resources.
  • Pipeline Compatibility: Sequential computation pattern enables efficient streaming architecture with minimal memory requirements.
  • Established Baseline: Well-documented algorithms allow focus on architectural optimization rather than algorithmic development.
The primary research contribution is not the selection of these methods, but rather the demonstration that co-integrating feature extraction with dimensionality reduction in a single FPGA pipeline provides significant performance advantages over traditional separated processing approaches.

3. Database and Experimental System

In the following sections, we will describe the database used on the experimentation platform and provide a detailed overview of the hardware (HW) and software (SW) development performed for this paper.

3.1. Database

The database comprises EMG data collected from eight healthy subjects (four women and four men) using four sensors (S1, S2, S3, and S4) positioned at specific locations on the transtibial region—the area between the knee and ankle where a below-knee prosthesis would typically be fitted. Since prosthetic control systems require individual calibration for each user, the database prioritizes multiple movement repetitions per subject ( 20 repetitions × 6 movements ) rather than a large number of subjects. This approach aligns with the personalized nature of prosthetic control, where system performance depends on adaptation to individual EMG patterns rather than population-wide generalization.
For the data collection, each individual was asked to perform 20 repetitions of 6 distinct movements (AP, AT, LP, LT, PD, and PI) plus one more rest reference RR state (no movement and no contraction at all). On each repetition, the data from the four sensors was logged with a sampling rate of 1 ms, and a window of 5150 samples was stored in the database, adding up to 103,000 samples per movement.
The different movements that are sampled are described below:
  • AP Support toe without raising heel.
  • AT Support the heel without raising the toe.
  • LP Raise the toe.
  • LT Lift the heel.
  • PD Move tip to the right.
  • PI Move tip to the left.
  • RR Relaxed state or rest.
A single repetition for the AP movement is depicted in the left column of Figure 1. The data mean is calculated and then subtracted from the original data to obtain a zero-mean dataset, illustrated in column two of the same figure. The next step is to identify the starting point of the movement, which is shown in column three.
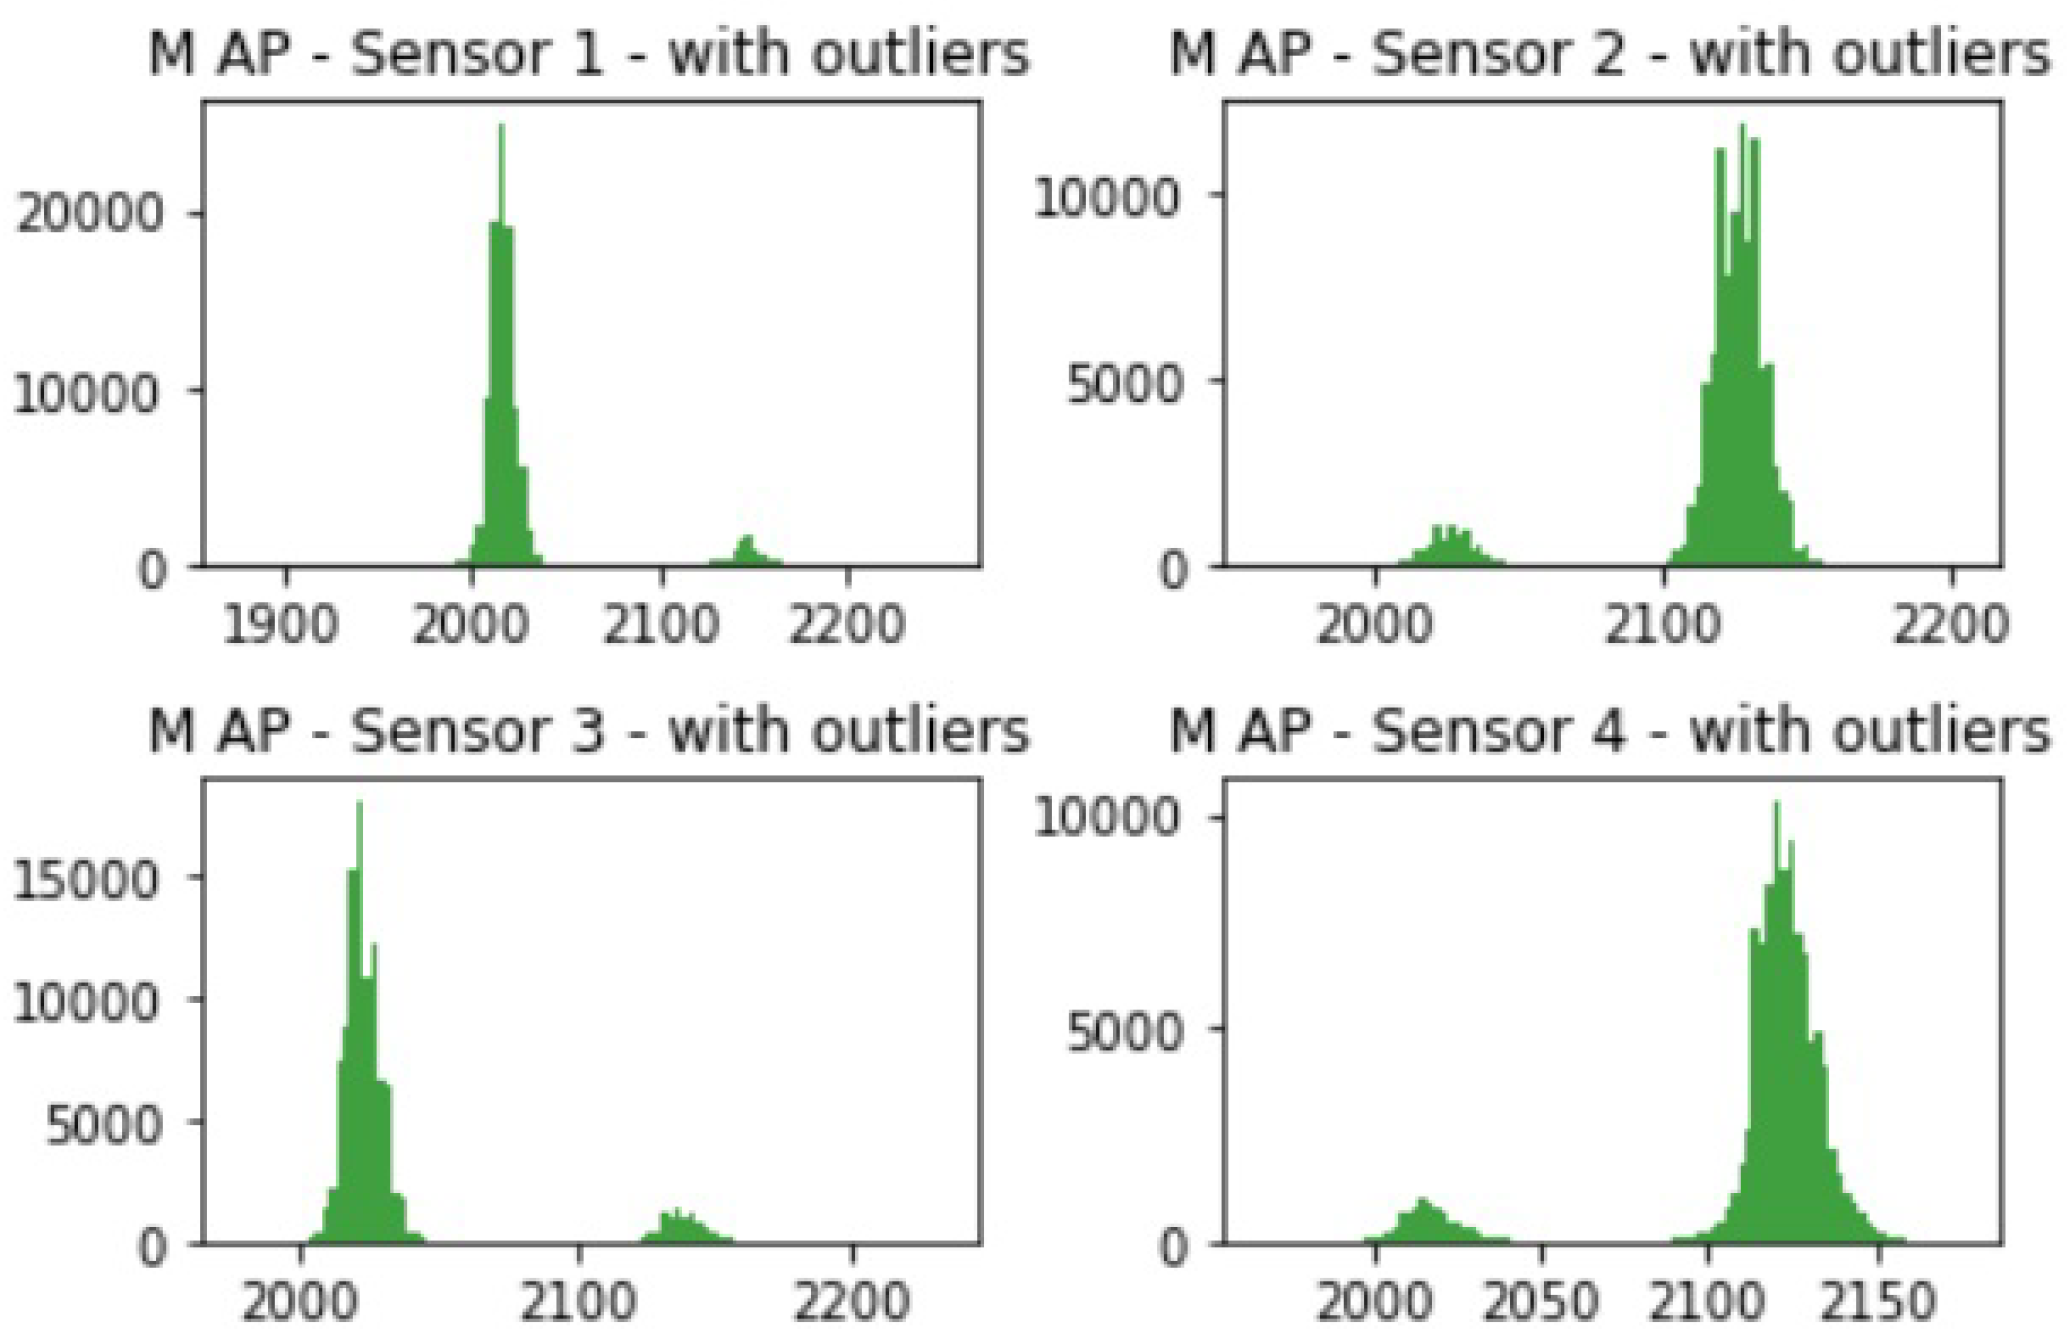
It is also important to look at how the data is statistically distributed. This allows us to see the nature of the data. A view of the statistical distribution is shown in Figure 2.

3.2. Experimentation Platform

The experimentation platform is based on a Zed Board from Digilent™ that incorporates a Xilinx™ Zynq device XC7Z020CLG484-1 (Xilinx Inc. 2100 Logic Drive, San Jose, CA, USA).

3.2.1. Design Choice Rationale

The selection of a programmable logic (PL) implementation for matrix multiplication operations over the processing system (PS) was based on quantitative performance considerations. While the ARM Cortex-A9 in the PS offers dedicated floating-point units, our preliminary testing revealed that a hardware-accelerated approach using PL provided superior performance for this specific application, as shown in Table 2.
The PL implementation achieves approximately 7.3× faster processing with 3.1× lower power consumption, resulting in a 22.63× improvement in energy efficiency per operation. This is critical for prosthetic applications where battery life directly impacts usability. Furthermore, the deterministic nature of the PL implementation provides consistent latency guarantees essential for real-time prosthetic control, unlike the PS, which may experience variable latency due to operating system overhead.
Regarding our choice of floating-point IP, we evaluated multiple options, including the vendor-provided Xilinx IP cores and the Johns Hopkins University library. We selected the JHU floating-point library primarily for its lightweight implementation, portability, and configurability, allowing us to optimize our specific EMG processing requirements. While the library dates from 2011, we managed to speed up its frequency operation from 25 MHz to 100 MHz; our benchmarking showed that for single-precision additions and subtractions in our particular use case, it provided 12.5% lower resource utilization compared to the equivalent Xilinx IP, with only a 7% increase in latency. We mitigated reliability concerns by using vendor IP for division operations, where the JHU library showed inconsistent results in our testing.

3.2.2. Hardware Description

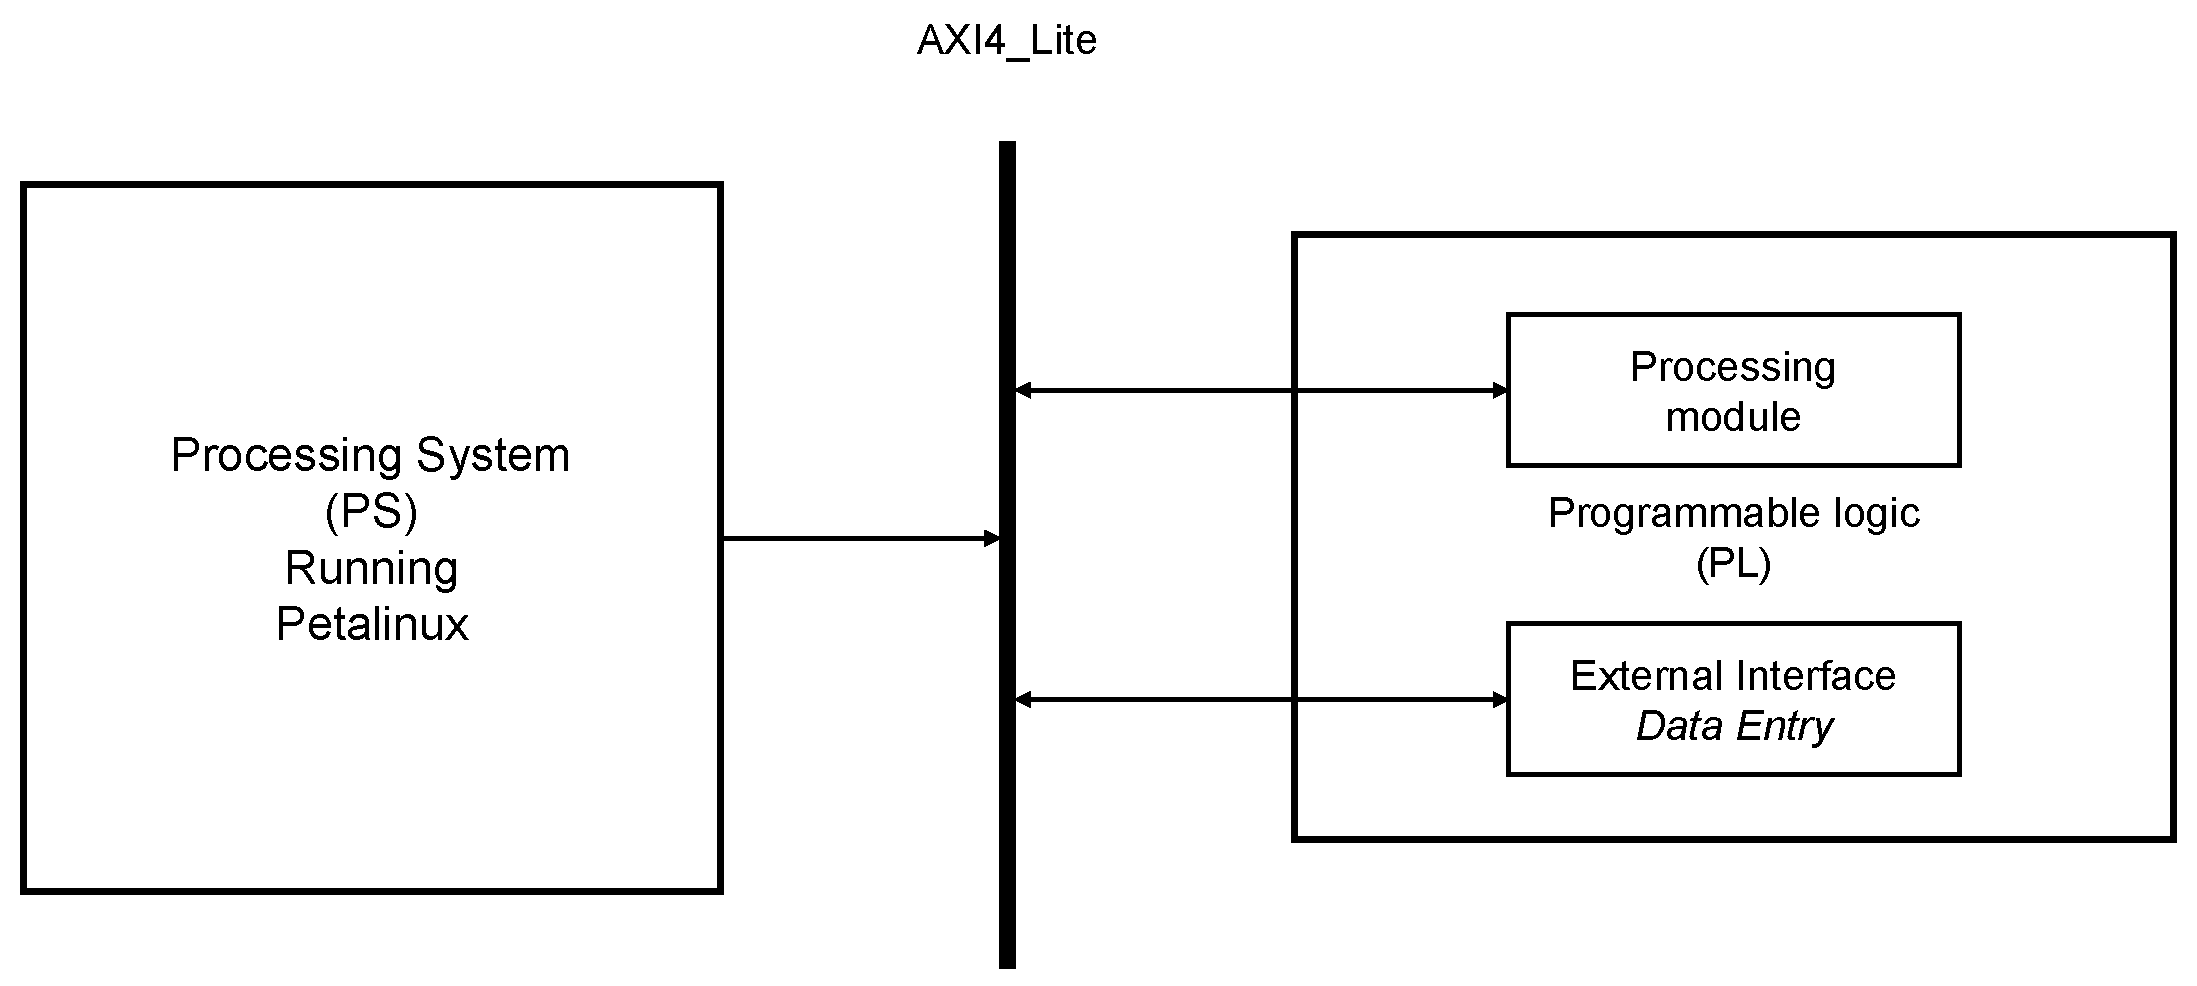
The system described above uses an FPGA System on Chip (SoC). The FPGA contains a Processing System (PS) based on a Dual-Core ARM A9 and a programmable logic (PL) area that communicate with each other using the AXI4-Lite interface. Figure 3 shows how the programmable logic section and the processing section on the FPGA-SoC system intercommunicate.
The implementation of the four metrics is achieved by creating state machines that receive a signal (see dataValid in Section 4.2) and then process the input data; this “Metrics” module calculates the four metrics describe in Section 2.1 for each sensor, producing an output of sixteen parameters that, after this process, are delivered to the “PCA” module that processes the Principal Component Analysis.
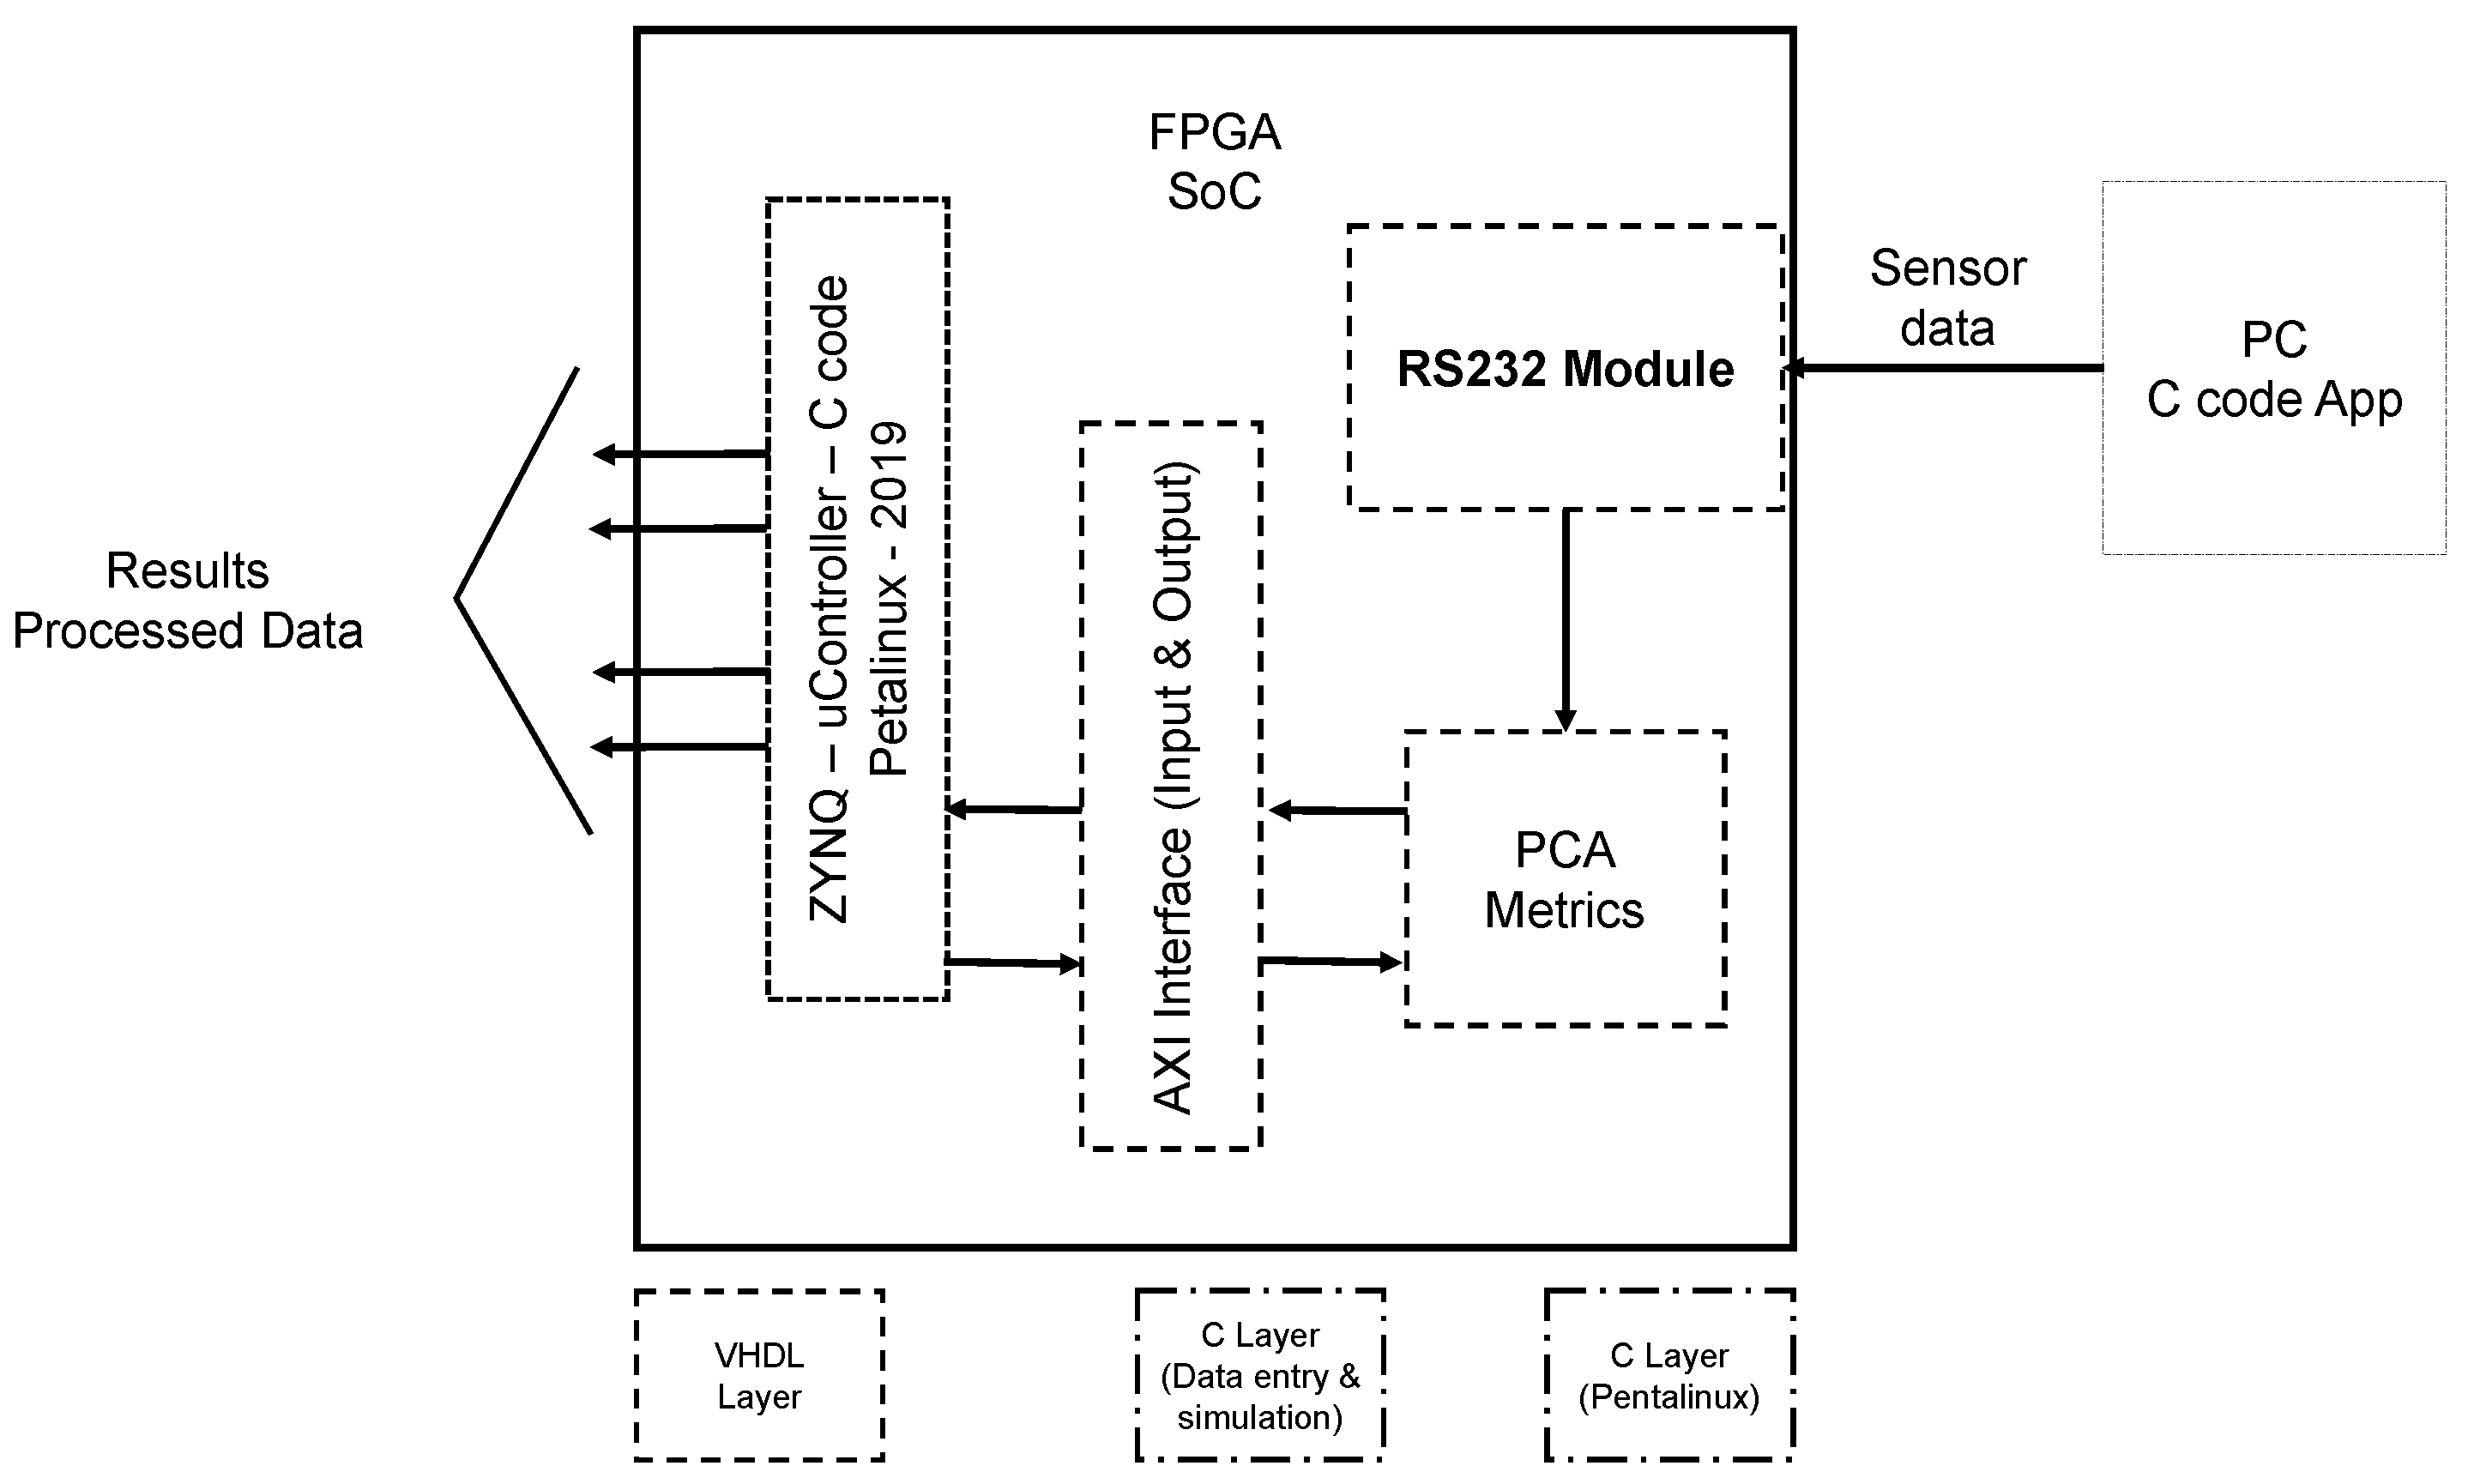
The input data is delivered to the processing modules by either an external interface developed using a C language program or by reading the BRAM inside the FPGA; these methods are used to check the processing and verify the results. A UART interface was integrated into the PL section to speed up the data entry process for simulation purposes. Even though serial interfaces are available in the PS section, it was better to use an interface in the PL to deliver the incoming data directly to the implemented modules for the algorithms running in the PL. By doing this, delays and unnecessary access to the Linux layer are avoided; thus, the simulation processes were faster to complete. Figure 4 shows the block diagram from the top view.
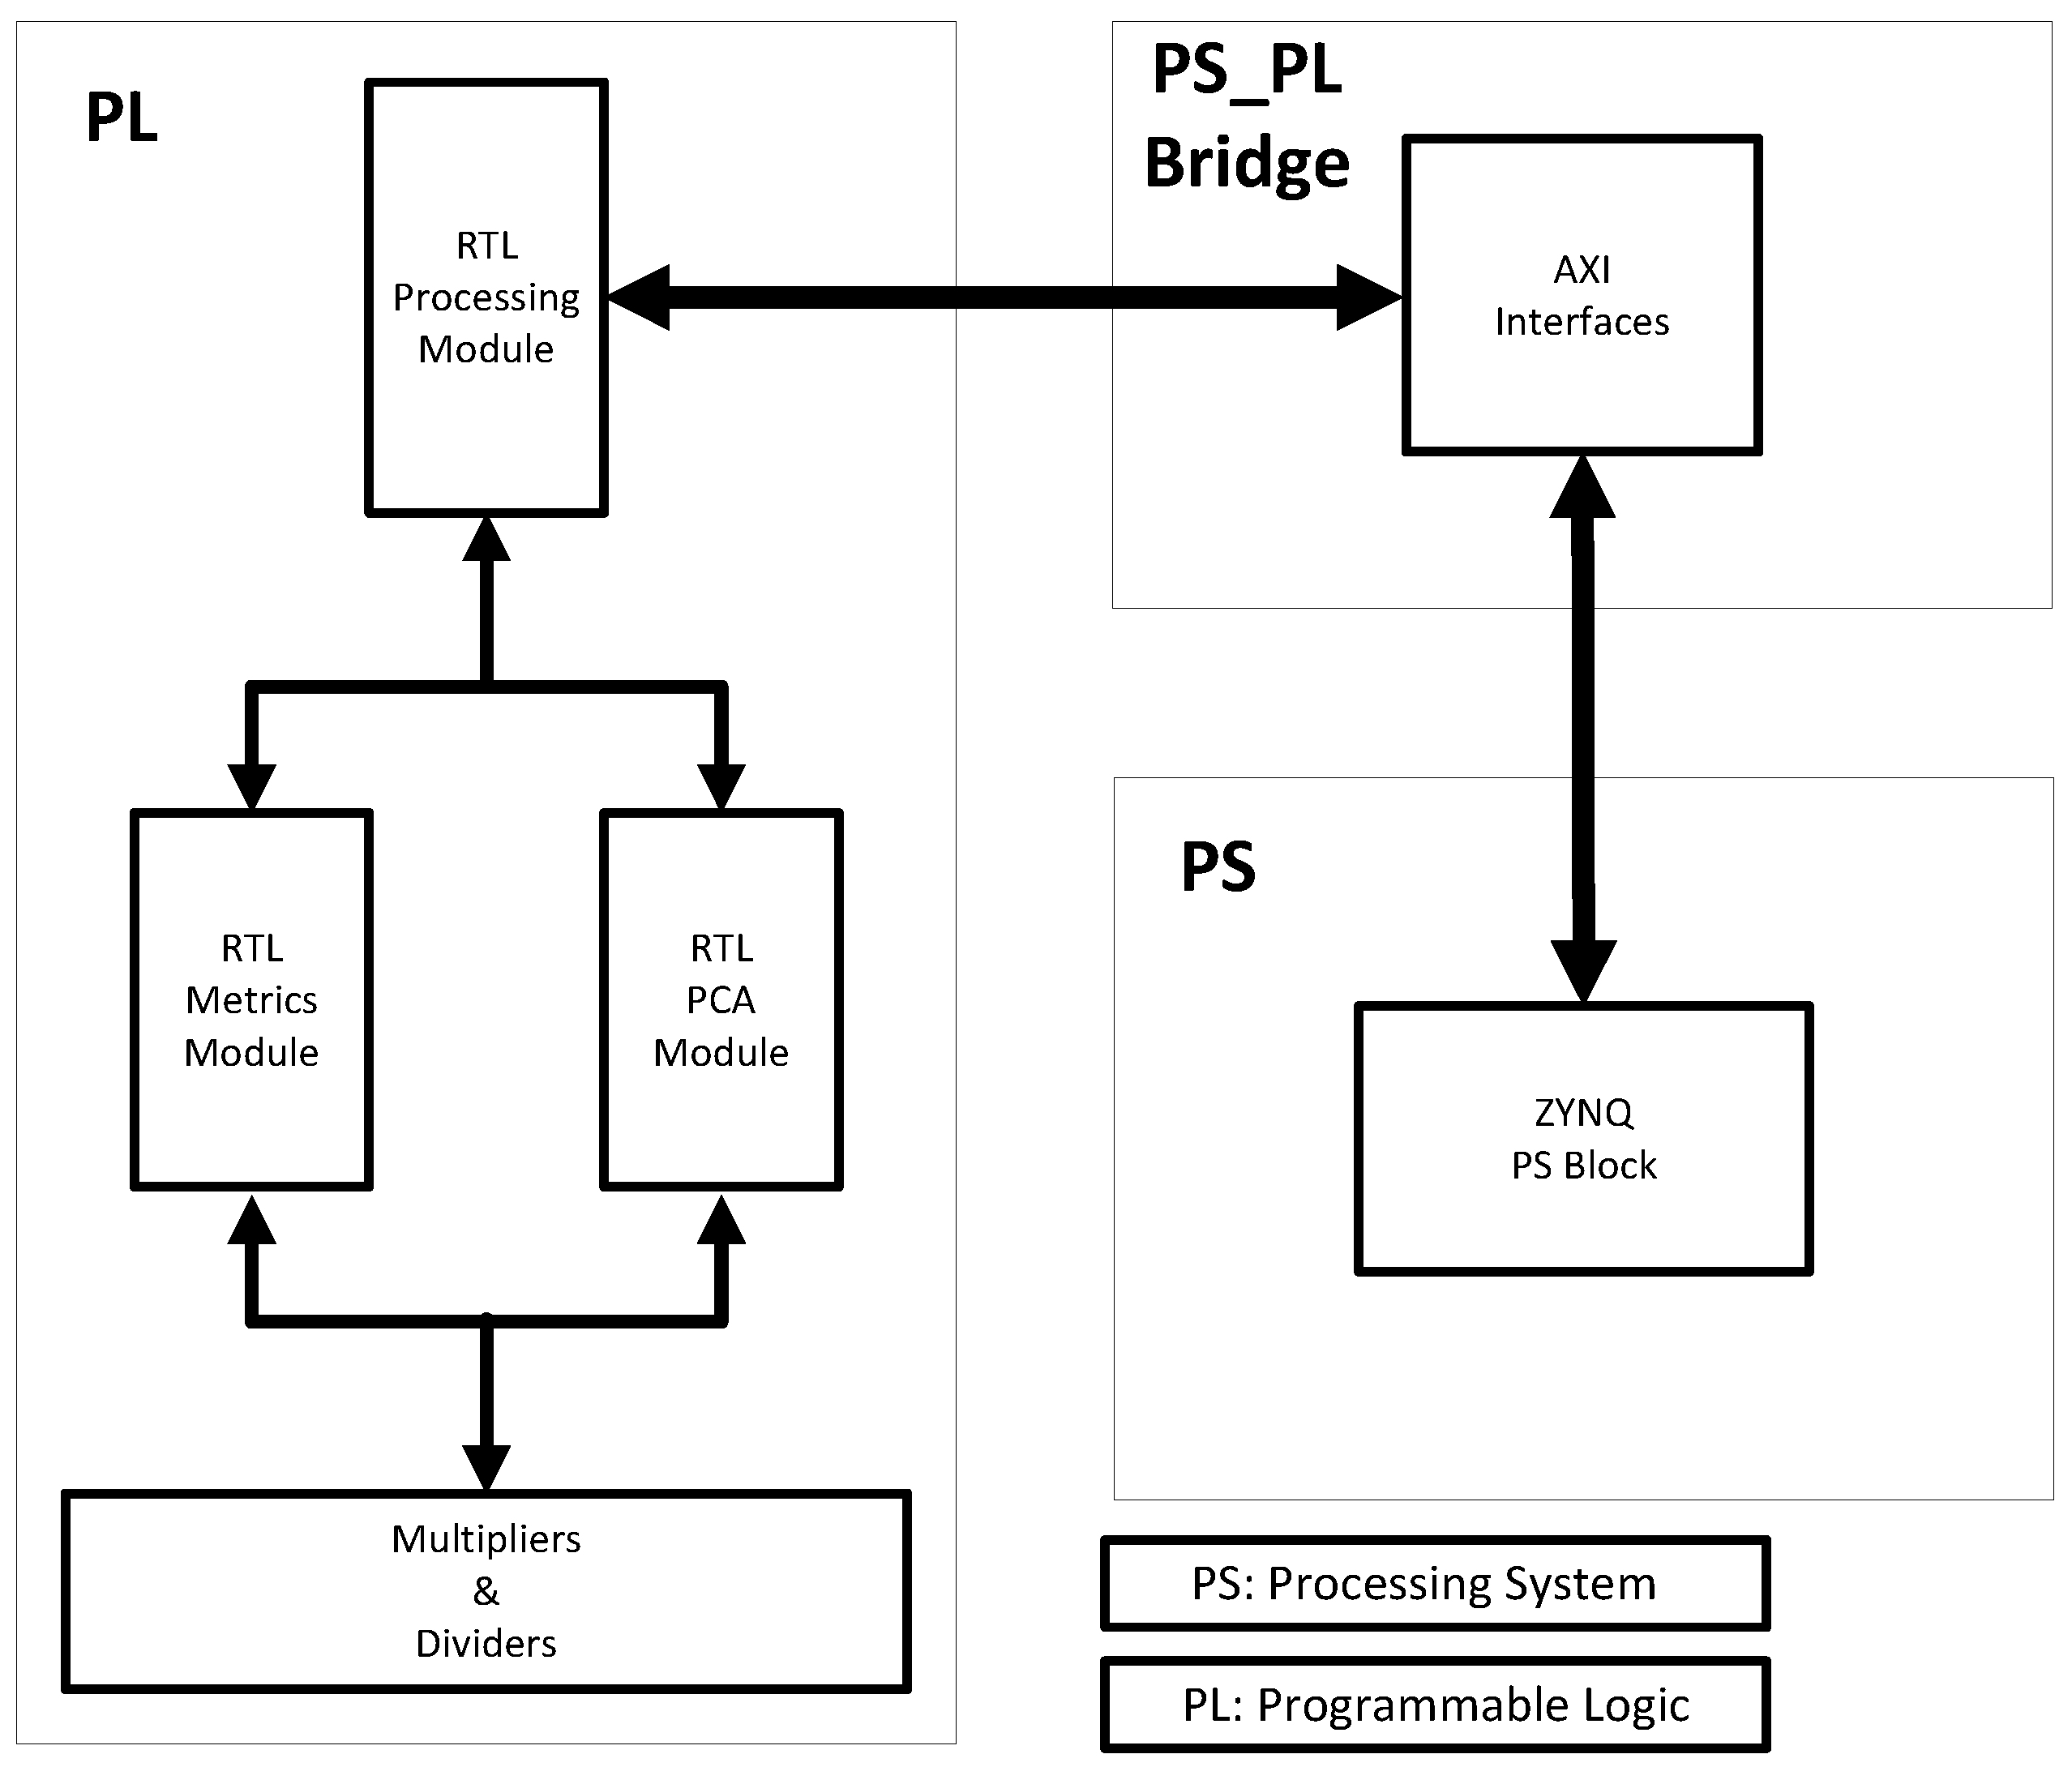
The system was implemented using Vivado 2019.1 and Petalinux 2019.1 (to ensure compatibility between the hardware and software components), as shown in Figure 4. The hardware architecture described using Vivado is illustrated in the block diagram from Figure 5, which consists of several key modules:
  • The AXI I/F module is the main communication interface between the PL and the PS; this interface implements a register-based communication protocol that enables data transfer between the PS, where the Petalinux software stack resides, and two primary processing modules in the PL: the “Metrics” module and the “PCA” module.
  • The main block from the perspective of where the calculations of the algorithm are performed is the “Processing” module shown as RTL near the center of Figure 5. This module coordinates the data entry from sensors and delivers these data to the “Metrics” module.
  • The “Metrics” module is encapsulated within the “Processing” module, and computes the four metrics for each sensor described in Section 2.1, thus producing 16 parameters that become the input data  x j to the “PCA” module.
  • The “PCA” module is also stored in the RTL module block and performs the change of coordinates from  x j to  t j given in Equation (1) using the procedure described in Section 3.2.3. The output  t j of the PCA module is then collected to review the first r components.
  • These two last modules rely on the modules depicted on the left, which are multipliers and dividers. The dividers on the “Metrics” module perform the division operations needed mainly within the MAV metric. The multipliers serve to compute the product of the computed metrics  x j with the PCA matrix  V (that is calculated beforehand in the C language program running in SW in Petalinux) as in Equation (1).
This work uses a VHDL library developed at Johns Hopkins University for floating-point operations [37]. The documentation for this floating-point library indicates that it was tested mainly for addition, subtraction, and product operations, reinforcing the comment that the division module might need attention—in this work, indeed, the multiplication and division modules sometimes, during simulations and on the actual HW, delivered results presenting discrepancies with our expected values, and it is for this reason that it was decided to use the external floating-point IP core from Xilinx, which is capable of performing several operations, among them the multiplication and division operations. The Johns Hopkins team declares they tested their modules at 25 MHz, and in this application the addition used is required to operate at 100 MHz, and it is working perfectly, no errors detected.
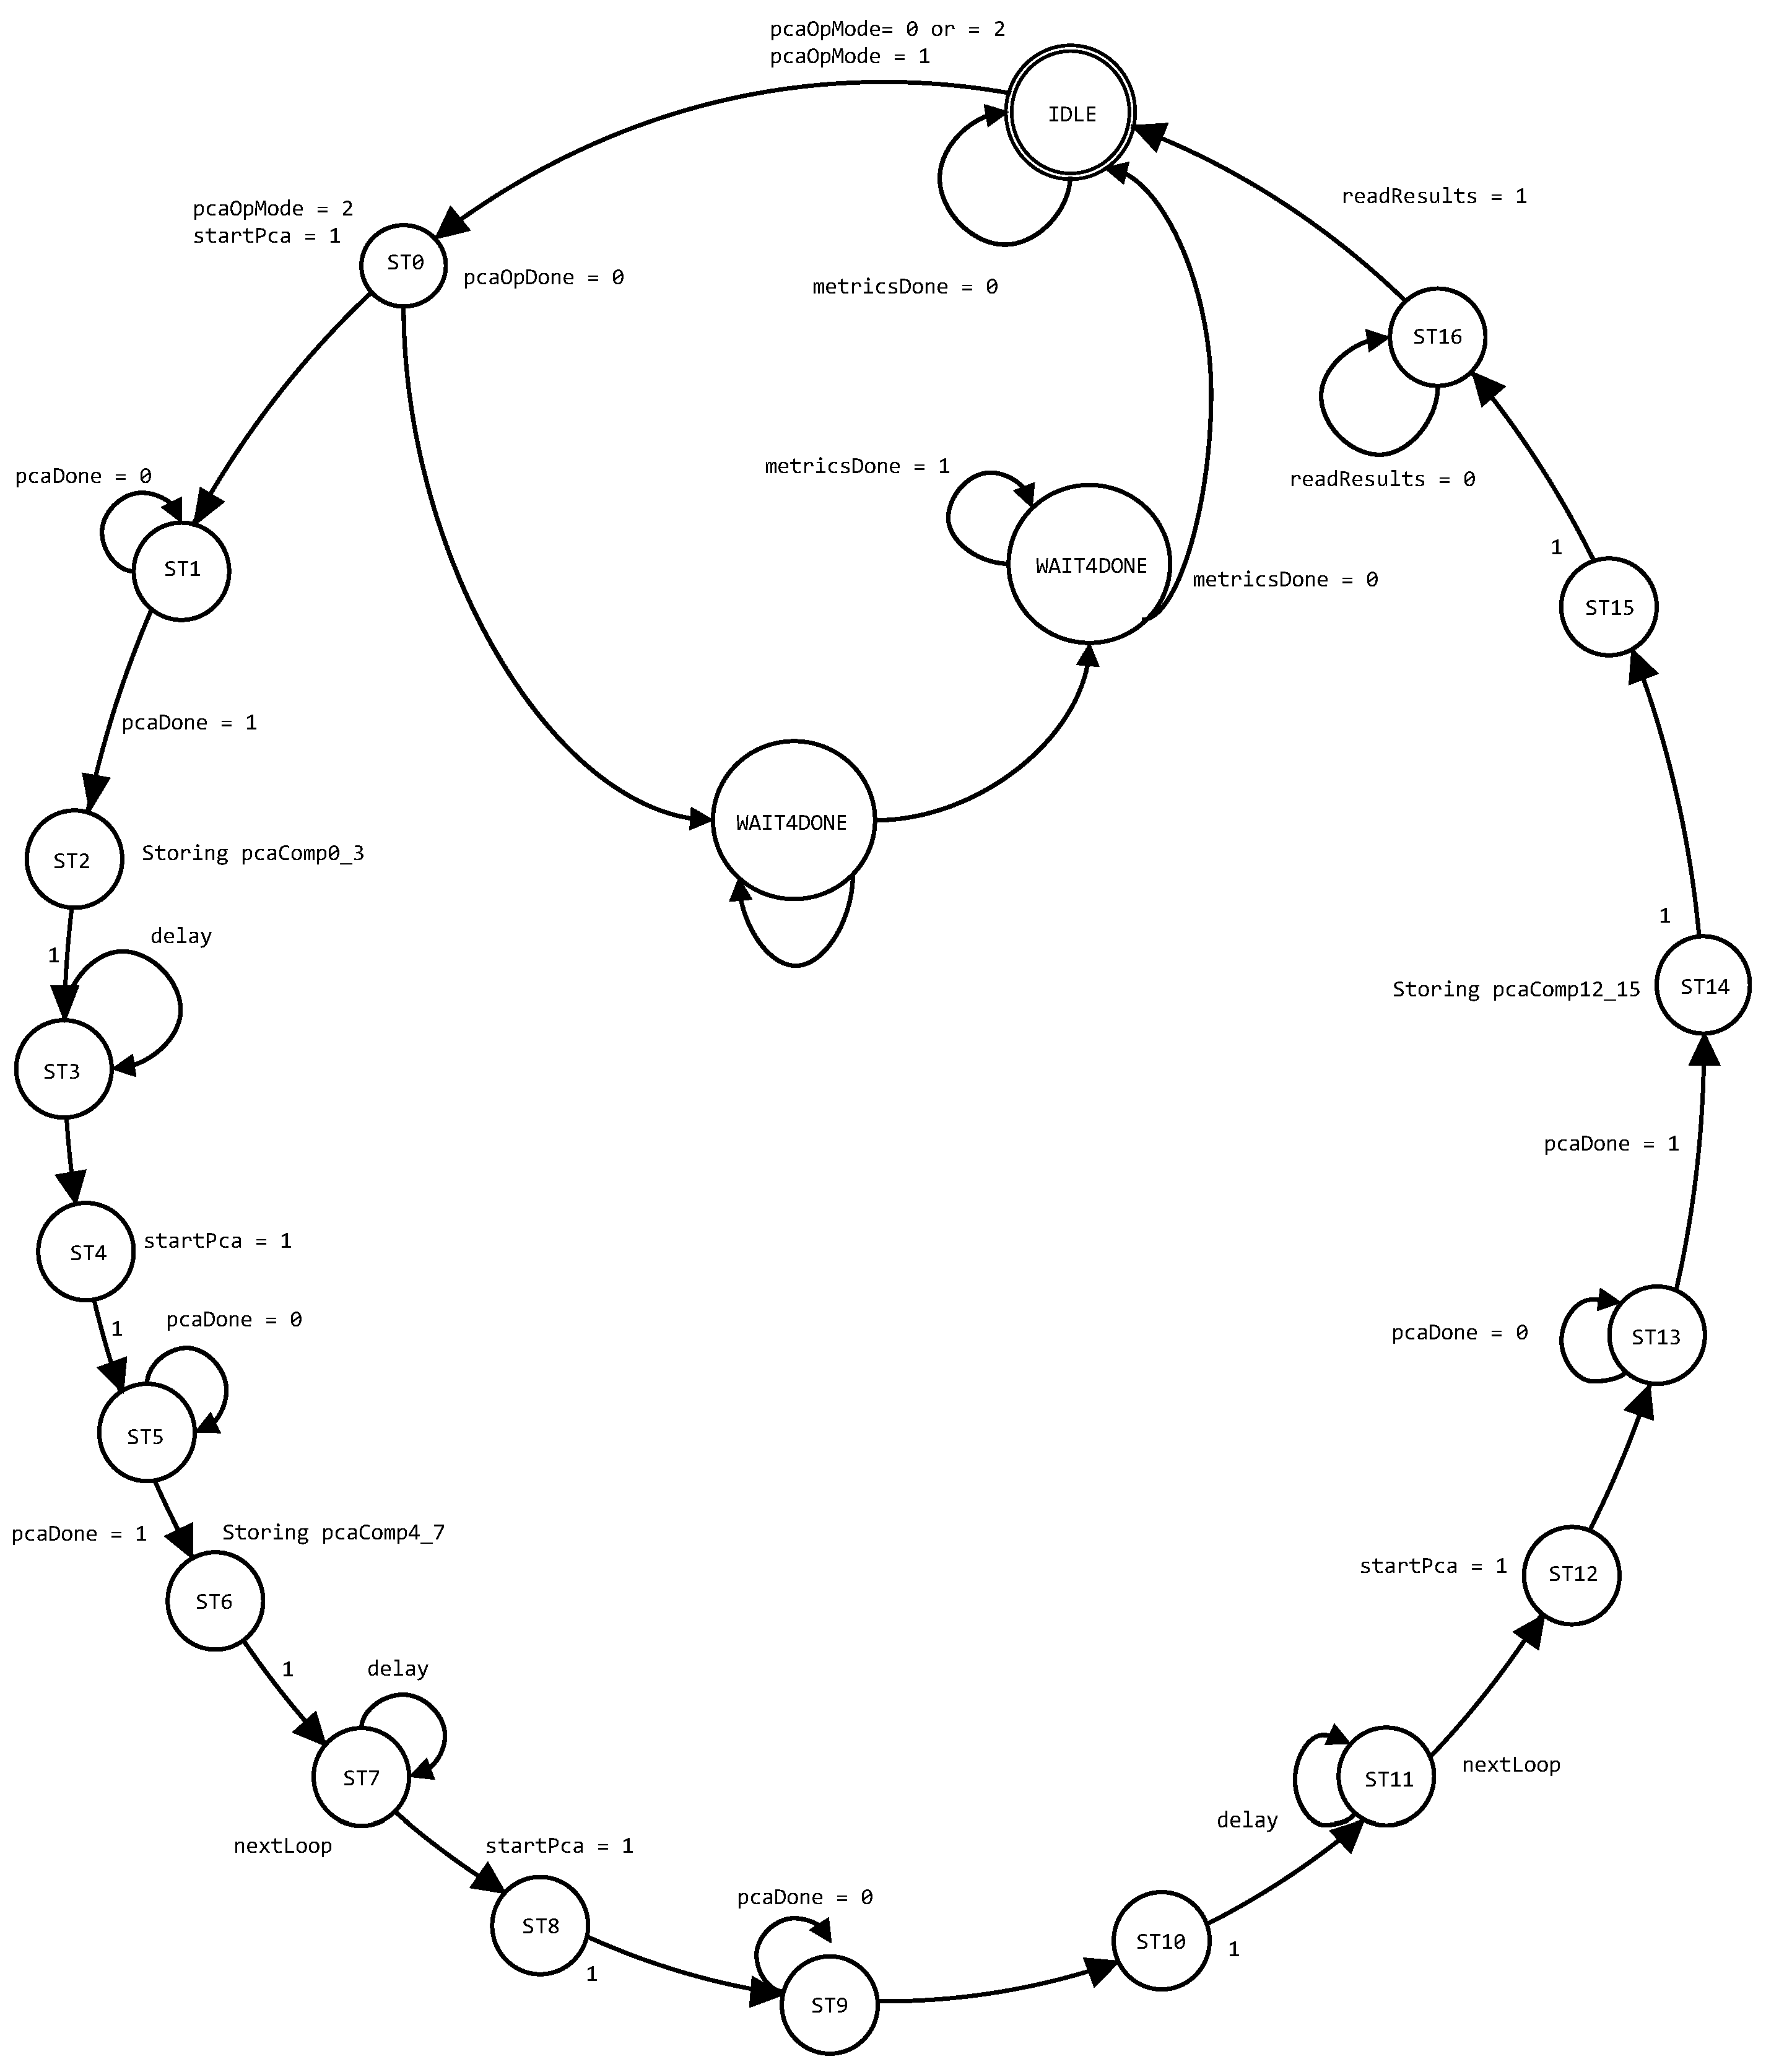
All of the PL modules are implemented through finite-state machines in VHDL. Figure 6 shows the state machine for the “PCA” module.
Figure 7 depicts the communication between the three main modules (“Processing,” “Metrics”, and “PCA”), which are described in VHDL. The “Processing” module coordinates the messages among the three modules. The “Metrics” module coordinates the start of the metrics’ calculations. Once the metrics are completed, the top module receives an interrupt, allowing the PCA module to receive those metrics. The metrics are received once the window size N is complete. The N parameter in this context is actually the N parameter in Section 2.1, which defines the number of terms in the different metrics described there.
The PCA module at receiving the metrics performs one of two tasks:
  • Send the received metrics vector to an array that later will be used to calculate the PCA matrix, if in matrix calculation mode;
  • Process the received metrics vector through the PCA matrix, if in continuous operation mode.
The system then processes the metrics vectors every time they become available after N samples.
The output from the PCA module is then transferred to the top processing module, where it is processed by the SW running on the upper SW layer.

3.2.3. PCA Matrix Multiplication Process

The system implemented for this application computes (1) with r = m = 16 by multiplying the row-vector
x j T = x 1 , j x 2 , j x 15 , j x 16 , j
with the matrix
V = m 1 , 1 m 1 , 2 m 1 , 15 m 1 , 16 m 2 , 1 m 2 , 2 m 2 , 15 m 2 , 16 m 15 , 1 m 15 , 2 m 15 , 15 m 15 , 16 m 16 , 1 m 16 , 2 m 16 , 15 m 16 , 16 .
Notice that there are four sensors and  x 4 ( k 1 ) + 1 , j , x 4 ( k 1 ) + 2 , j , x 4 ( k 1 ) + 3 , j , and  x 4 k , j are the four metrics computed from the k-th sensor.
Vector-matrix multiplication is a common performance bottleneck due to its computational complexity and resource requirements. In this case, there were two critical constraints to be addressed:
  • The amount of reprogrammable logical resources available in the FPGA.
  • The processing time it takes the matrix multiplication as part of the processing algorithm.
Different architectures for implementing the matrix multiplication
x j T V = x 1 , j x 2 , j x 15 , j x 16 , j m 1 , 1 m 1 , 2 m 1 , 15 m 1 , 16 m 2 , 1 m 2 , 2 m 2 , 15 m 2 , 16 m 15 , 1 m 15 , 2 m 15 , 15 m 15 , 16 m 16 , 1 m 16 , 2 m 16 , 15 m 16 , 16
have been evaluated:
  • Full Multiplication: The first and straightforward approach of performing the typical complete matrix multiplication, as described in Equation (2), was an early consideration. However, due to its excessive resource requirements, it was deemed infeasible for the target FPGA.
  • 4 × 4 -Block Multiplication: The second option was to split the multiplication operation in Equation (2) into 4 × 4 = 16 block operations of the form
    b 0 b 1 b 3 b 4 a 1 , 1 a 1 , 2 a 1 , 3 a 1 , 4 a 2 , 1 a 2 , 2 a 2 , 3 a 2 , 4 a 3 , 1 a 3 , 2 a 3 , 3 a 3 , 4 a 4 , 1 a 4 , 2 a 4 , 3 a 4 , 4
    by computing
    r k , 4 ( 1 ) + 1 , j r k , 4 ( 1 ) + 2 , j r k , 4 ( 1 ) + 3 , j r k , 4 , j                                                   = x 4 ( k 1 ) + 1 , j x 4 ( k 1 ) + 2 , j x 4 ( k 1 ) + 3 , j x 4 k , j                                                   × m 4 ( k 1 ) + 1 , 4 ( 1 ) + 1 m 4 ( k 1 ) + 1 , 4 ( 1 ) + 2 m 4 ( k 1 ) + 1 , 4 ( 1 ) + 3 m 4 ( k 1 ) + 1 , 4 m 4 ( k 1 ) + 2 , 4 ( 1 ) + 1 m 4 ( k 1 ) + 2 , 4 ( 1 ) + 2 m 4 ( k 1 ) + 2 , 4 ( 1 ) + 3 m 4 ( k 1 ) + 2 , 4 m 4 ( k 1 ) + 3 , 4 ( 1 ) + 1 m 4 ( k 1 ) + 3 , 4 ( 1 ) + 2 m 4 ( k 1 ) + 3 , 4 ( 1 ) + 3 m 4 ( k 1 ) + 3 , 4 m 4 k , 4 ( 1 ) + 1 m 4 k , 4 ( 1 ) + 2 m 4 k , 4 ( 1 ) + 3 m 4 k , 4
    for each sensor  k = 1 , 2, 3, 4, and for each column block  = 1 , 2, 3, 4. Keeping  fixed and summing over the sensor index k yields
    t 4 ( k 1 ) + 1 , j t 4 ( k 1 ) + 2 , j t 4 ( k 1 ) + 3 , j t 4 k , j                                                                                                     = = 1 4 r k , 4 ( 1 ) + 1 , j r k , 4 ( 1 ) + 2 , j r k , 4 ( 1 ) + 3 , j r k , 4 , j
    The results of this approach were not as good as expected, as the logic to control the sequence of multiplications and additions involved in the whole process required a large amount of logic within the FPGA.
  • 4-Column Multiplication Modules: The last approach implemented, which is the architecture that provided the best results, was achieved by ‘balancing’ the two previous approaches by multiplying the 16-entry vector  x j T times a 16 × 4 matrix, that is, by multiplying
    t 4 ( k 1 ) + 1 , j t 4 ( k 1 ) + 2 , j t 4 ( k 1 ) + 3 , j t 4 k , j                                                   = x 1 , j x 2 , j x 15 , j x 16 , j                                                                                                     × m 1 , 4 ( 1 ) + 1 m 1 , 4 ( 1 ) + 2 m 1 , 4 ( 1 ) + 3 m 1 , 4 m 2 , 4 ( 1 ) + 1 m 2 , 4 ( 1 ) + 2 m 2 , 4 ( 1 ) + 3 m 2 , 4 m 15 , 4 ( 1 ) + 1 m 15 , 4 ( 1 ) + 2 m 15 , 4 ( 1 ) + 3 m 15 , 4 m 16 , 4 ( 1 ) + 1 m 16 , 4 ( 1 ) + 2 m 16 , 4 ( 1 ) + 3 m 16 , 4
    for each column block  = 1 , 2, 3, 4. If less than 16 principal components are needed, the column block index can iterate over a smaller range. Remark that this approach has the advantage of directly producing actual components of  t j while at the same time offering a reasonable balance between resource requirements and the amount of logic required within the FPGA. Section 4 presents statistics on the resources used within the FPGA. Besides, this approach provides the expected results and complies with the timing requirements.

3.2.4. Software Description

The upper SW layer is hosted in a Petalinux (version 2019.1 in this case) environment provided by Xilinx within the PS. This allows having a complete Linux system, with some limitations, but for post-processing purposes, it is a fully functional system. It will enable many applications and daemons to be run. In this environment, we compile and run an object-oriented standard C language application whose modules/classes are depicted in Figure 8. After the HW section collects the samples and computes the metrics (see Section 3.2.5 for more details), the SW application stores the data in a 16-feature “DataSet” object, and then this data is normalized (each feature is centered at its mean and then divided by its standard deviation) employing a “Scaler” object. Then, a “PCA” object computes the eigenvectors and eigenvalues of the covariance matrix, which are then transferred back to the HW section. The previous section described the HW section, indicating that the last action performed in HW was the calculation of the PCA output vector  t j T , which is merely a multiplication of the calculated metrics vector  x j T times the PCA matrix  V . This last operation maps the metrics vector into a new orthogonalized space. After this high-speed multiplication occurs, the output vector from the PCA module is transferred back to the upper SW layer, ready for any post-processing, such as classification or identification.
The application interfaces with the modules implemented within the PL section of the FPGA part of the SoC system through an AXI interface that allows data to be sent/received to/from the internal registers on the FPGA. The C program gets data from the “Metrics” module or the “PCA” module through these internal registers. Both configuration and different modes of operation are set up through this AXI interface as well. The interface with the Petalinux environment is shown in Table 3.
The SW communicates using the different registers that hold results from operations performed within the PL area. The registers are mapped to an address at which all the system registers are accessible. In this case, this address is 0x43C00000 (the Vivado system determines this address); this base address is stored in a constant, namely, axi_ports_addr. Using different offset values, the registers that hold the metrics are accessible from this base address (for example, the computation of metric WL for sensor 1 is available at axi_ports[16], which means that this metric is 18 32-bit addresses from the base address). The way the C-layer accesses these registers at their offset addresses is then accessed for the different processes and calculations.

3.2.5. Operation Sequence and Operation Modes

The system in the PL section uses Finite-State Machines (FSMs) for control flow. The FSMs in the system communicate through signals, using the architecture depicted in Figure 7. The operation of the system involves coordinated interaction between the Processing System (PS) running Petalinux and the Programmable Logic (PL) containing the EMG processing modules. This interaction can be modeled as interrelated state machines that control the system’s behavior across different operational phases:
  • Initialization Phase:
    I1
    Both the PS and PL initialize their respective components.
    I2
    The PS configures the PL registers and sets up the data flow paths.
    I3
    Depending on the data input mode (external UART-based application or BRAM), the PL selects the four input channels of the sensor values to be processed.
  • Sampling:
    S1
    The PS signals the PL to collect metrics from incoming sensor data.
    S2
    The PL initializes the input sensor buffer.
    S3
    The “Processing” module (from the PL) reads the input sensor values (counting from  k = 0 to  N 1 , where N is the window size) and stores them in the 4-channel input buffer of length N.
    S4
    Once there are N samples, the “Metrics” module is prompted by the “Processing” module to immediately compute the four time-domain features (MAV, WL, SSC, ZC) per sensor:
    Sensor 1Sensor 2Sensor 3Sensor 4
    MAV-WL-ZC-SSCMAV-WL-ZC-SSCMAV-WL-ZC-SSCMAV-WL-ZC-SSC
    S5
    The PL transfers the computed metrics to the PS, which stores them (in a DataSet object) for PCA matrix calculation.
  • Learning Mode:
    L1
    The PS computes the covariance matrix  Σ from the collected metrics vectors.
    L2
    It performs Jacobi eigenvalue decomposition to find eigenvalues  Λ and eigenvectors  V .
    L3
    The PCA transformation matrix  V has its columns (eigenvectors) sorted in the proper descending order according to the magnitude of its corresponding eigenvalues.
    L4
    The PS transfers the PCA matrix coefficients  V to the PL through the AXI interface. The “PCA” module stores these coefficients in internal registers.
  • Operation Mode:
    O1
    The PS signals the PL to switch to operational mode.
    O2
    Instead of transferring metrics to the PS, the “PCA” module now applies the transformation matrix  V to the metrics vectors, that is, computes  t T = x T V .
    O3
    The resulting PCA components  t are transferred back to the PS for further analysis or classification.
In the next section, results that show the proper system operation of this system for an example case for a window size N = 7 are presented (in practice, we take N = 250 or N = 256 = 2 8 ). The sequence of operation illustrates the proper operation of the implemented system. The application that is executed in the system performs the PCA transformation from one domain to another for a given dataset, and the results obtained from the implemented system running inside the FPGA are compared to those of the same dataset processed but obtained through a different application running on the Petalinux layer, which runs as an independent and not correlated interface.
Figure 9 provides a simplified view of the combined system state machine that highlights the key interaction points between the PS and PL components.

4. Results

The experimental validation focuses on architectural performance metrics rather than algorithmic accuracy, as the latter has been extensively validated in previous EMG processing literature. Our evaluation demonstrates the efficiency gains achievable through hardware–software co-design compared to conventional software-only implementations.

4.1. FPGA Used Resources

The statistics on the resources used in the FPGA-SoC system are shown in Table 4 and Table 5, which identify the amount of resources used on the different implemented modules.
The statistics for the modules that perform the “metrics” and “PCA” processes are also shown in more detail in Table 5.

4.2. Application Results

In this section, we present a sequence of the process performed within the whole system while processing the input samples through the different modules (in evaluation mode, so we can check the process within).
  • A sample of the data entry for the four sensors. A sample of the sensor data is shown below:
     
    -0.00436020 -0.02589910 -0.00280167  0.00802203
    -0.02873340  0.00672732  0.00186870 -0.01589790
    0.00176235 -0.03466060 -0.01619870  0.02321670
    -0.03075060  0.03271290  0.01021340 -0.01982900
    0.00216684  0.00063915 -0.04133170 -0.00858940
    0.06235370  0.04674370  0.04463140  0.04991990
    -0.06014440 -0.09982760 -0.05358500 -0.06827760
    -0.04320210 -0.00448979  0.06629640  0.04391780
    -0.02117970  0.01781130 -0.01843370 -0.03890570
    -0.00947362 -0.02973350 -0.02852140  0.02709730
    0.00409025  0.03296500  0.01918160  0.00211551
    0.10056500  0.03024860 -0.04497290  0.03854670
    -0.06442331 -0.06319550  0.00636181 -0.04414980
     
  • Training—Creating PCA Matrix. Receiving data, most left represents data for sensor #1, then sensor #2, and so on. At start, the system is in what we call “learning mode”; during this time, the metrics vectors are used to create the PCA matrix. In this example, the process is completed using a window size N = 7 , which means that we require seven entry vectors of raw sensor data in order to have an output metrics vector.
     
    Sample#: 1
    Waiting for dataValid = 1
    S1:-0.004360 S2:-0.025899 S3:-0.002802 S4:0.008022
    Waiting for dataValid = 0
    Sample#: 2
    Waiting for dataValid = 1
    S1:-0.028733 S2:0.006727 S3:0.001869 S4:-0.015898
    Waiting for dataValid = 0
    Sample#: 3
    Waiting for dataValid = 1
    S1:0.001762 S2:-0.034661 S3:-0.016199 S4:0.023217
    Waiting for dataValid = 0
    Sample#: 4
    Waiting for dataValid = 1
    S1:-0.030751 S2:0.032713 S3:0.010213 S4:-0.019829
    Waiting for dataValid = 0
    Sample#: 5
    Waiting for dataValid = 1
    S1:0.002167 S2:0.000639 S3:-0.041332 S4:-0.008589
    Waiting for dataValid = 0
    Sample#: 6
    Waiting for dataValid = 1
    S1:0.062354 S2:0.046744 S3:0.044631 S4:0.049920
    Waiting for dataValid = 0
    Sample#: 7
    Waiting for dataValid = 1
    S1:-0.060144 S2:-0.099828 S3:-0.053585 S4:-0.068278
    Waiting for dataValid = 0
    Metrics done!
    Input to PCA Module:
    S1:AAV-WL-ZS-SSC; S2:AAV-WL-ZS-SSC;
    0.027182 0.302984 4.000000 4.000000
    0.035316 0.366137 4.000000 5.000000
    S3:AAV-WL-ZS-SSC; S4:AAV-WL-ZS-SSC;
    0.024376 0.284874 6.000000 5.000000
    0.027679 0.294027 5.000000 4.000000
    Sample for PCA calculation
     
    Once the indicated number of metrics’ vectors is reached, then the system goes into “operation mode”. In this example, the required number of entry metrics’ vectors is M = 7 . Thus, in our case, we required seven (7) windows of size N = 7 , so in total, we needed to process N M = 7 × 7 = 49 samples.
     
    Sample#: 43
    Waiting for dataValid = 1
    S1:-0.041569 S2:0.057423 S3:0.025218 S4:-0.018170
    Waiting for dataValid = 0
    Sample#: 44
    Waiting for dataValid = 1
    S1:0.033394 S2:-0.079262 S3:-0.038959 S4:0.036694
    Waiting for dataValid = 0
    Sample#: 45
    Waiting for dataValid = 1
    S1:0.006929 S2:0.051741 S3:-0.001391 S4:0.020102
    Waiting for dataValid = 0
    Sample#: 46
    Waiting for dataValid = 1
    S1:0.026344 S2:0.031666 S3:0.025776 S4:0.027777
    Waiting for dataValid = 0
    Sample#: 47
    Waiting for dataValid = 1
    S1:-0.036288 S2:-0.031773 S3:-0.018986 S4:-0.104803
    Waiting for dataValid = 0
    Sample#: 48
    Waiting for dataValid = 1
    S1:-0.070014 S2:0.032346 S3:0.067164 S4:0.001208
    Waiting for dataValid = 0
    Sample#: 49
    Waiting for dataValid = 1
    S1:0.067987 S2:0.035339 S3:-0.005998 S4:0.092489
    Waiting for dataValid = 0
    Metrics done!
    Input to PCA Module:
    S1:AAV-WL-ZS-SSC; S2:AAV-WL-ZS-SSC;
    0.040361 0.355202 3.000000 4.000000
    0.045650 0.418315 4.000000 3.000000
    S3:AAV-WL-ZS-SSC; S4:AAV-WL-ZS-SSC;
    0.026213 0.332987 5.000000 4.000000
    0.043035 0.409004 3.000000 4.000000
    Sample for PCA calculation
     
    The processes completed after capturing raw input data for sample #49 are the following:
    -
    Compute covariance using the received data (the data from the metrics’ vectors, calculated values derived from the raw input sensor’ data).
    -
    Calculate the Jacobi for the created matrix.
    -
    Calculate the eigensystem: eigenvalues and eigenvectors.
    -
    Determine the PCA matrix coefficients.
    -
    Transfer the PCA matrix coefficients to the FPGA internal registers to be used by the PCA module in the FW.
  • Operation mode. Once the system is running and the sequence is the same, we wait for ( N = 7 in the example shown) raw entry data vectors to get one output metrics vector, and then this metrics vector is processed by the PCA module. The output of the FPGA implementation is then compared with another process running in the Petalinux system for comparison purposes, which are shown as “Calculated PCA Components”.
The PCA module inside the FPGA delivers a result vector representing the PCA components. See below an example of such a vector.
 
Results from FPGA:
PCA Comp 00_03  3.474750   6.473070  -1.006910   1.853277
PCA Comp 04_07  2.989338   3.810144   0.082271  -2.816533
PCA Comp 08_11  0.116517  -0.031517   1.053864  -0.191054
PCA Comp 12_15 -0.008754   1.873763   0.036685~-0.136512
Calculated PCA Components:
PCA Comp 00_03  3.474750   6.473071  -1.006910   1.853276
PCA Comp 04_07  2.989338   3.810143   0.082271  -2.816533
PCA Comp 08_11  0.116517  -0.031517   1.053864  -0.191054
PCA Comp 12_15 -0.008754   1.873763   0.036685  -0.136512
 
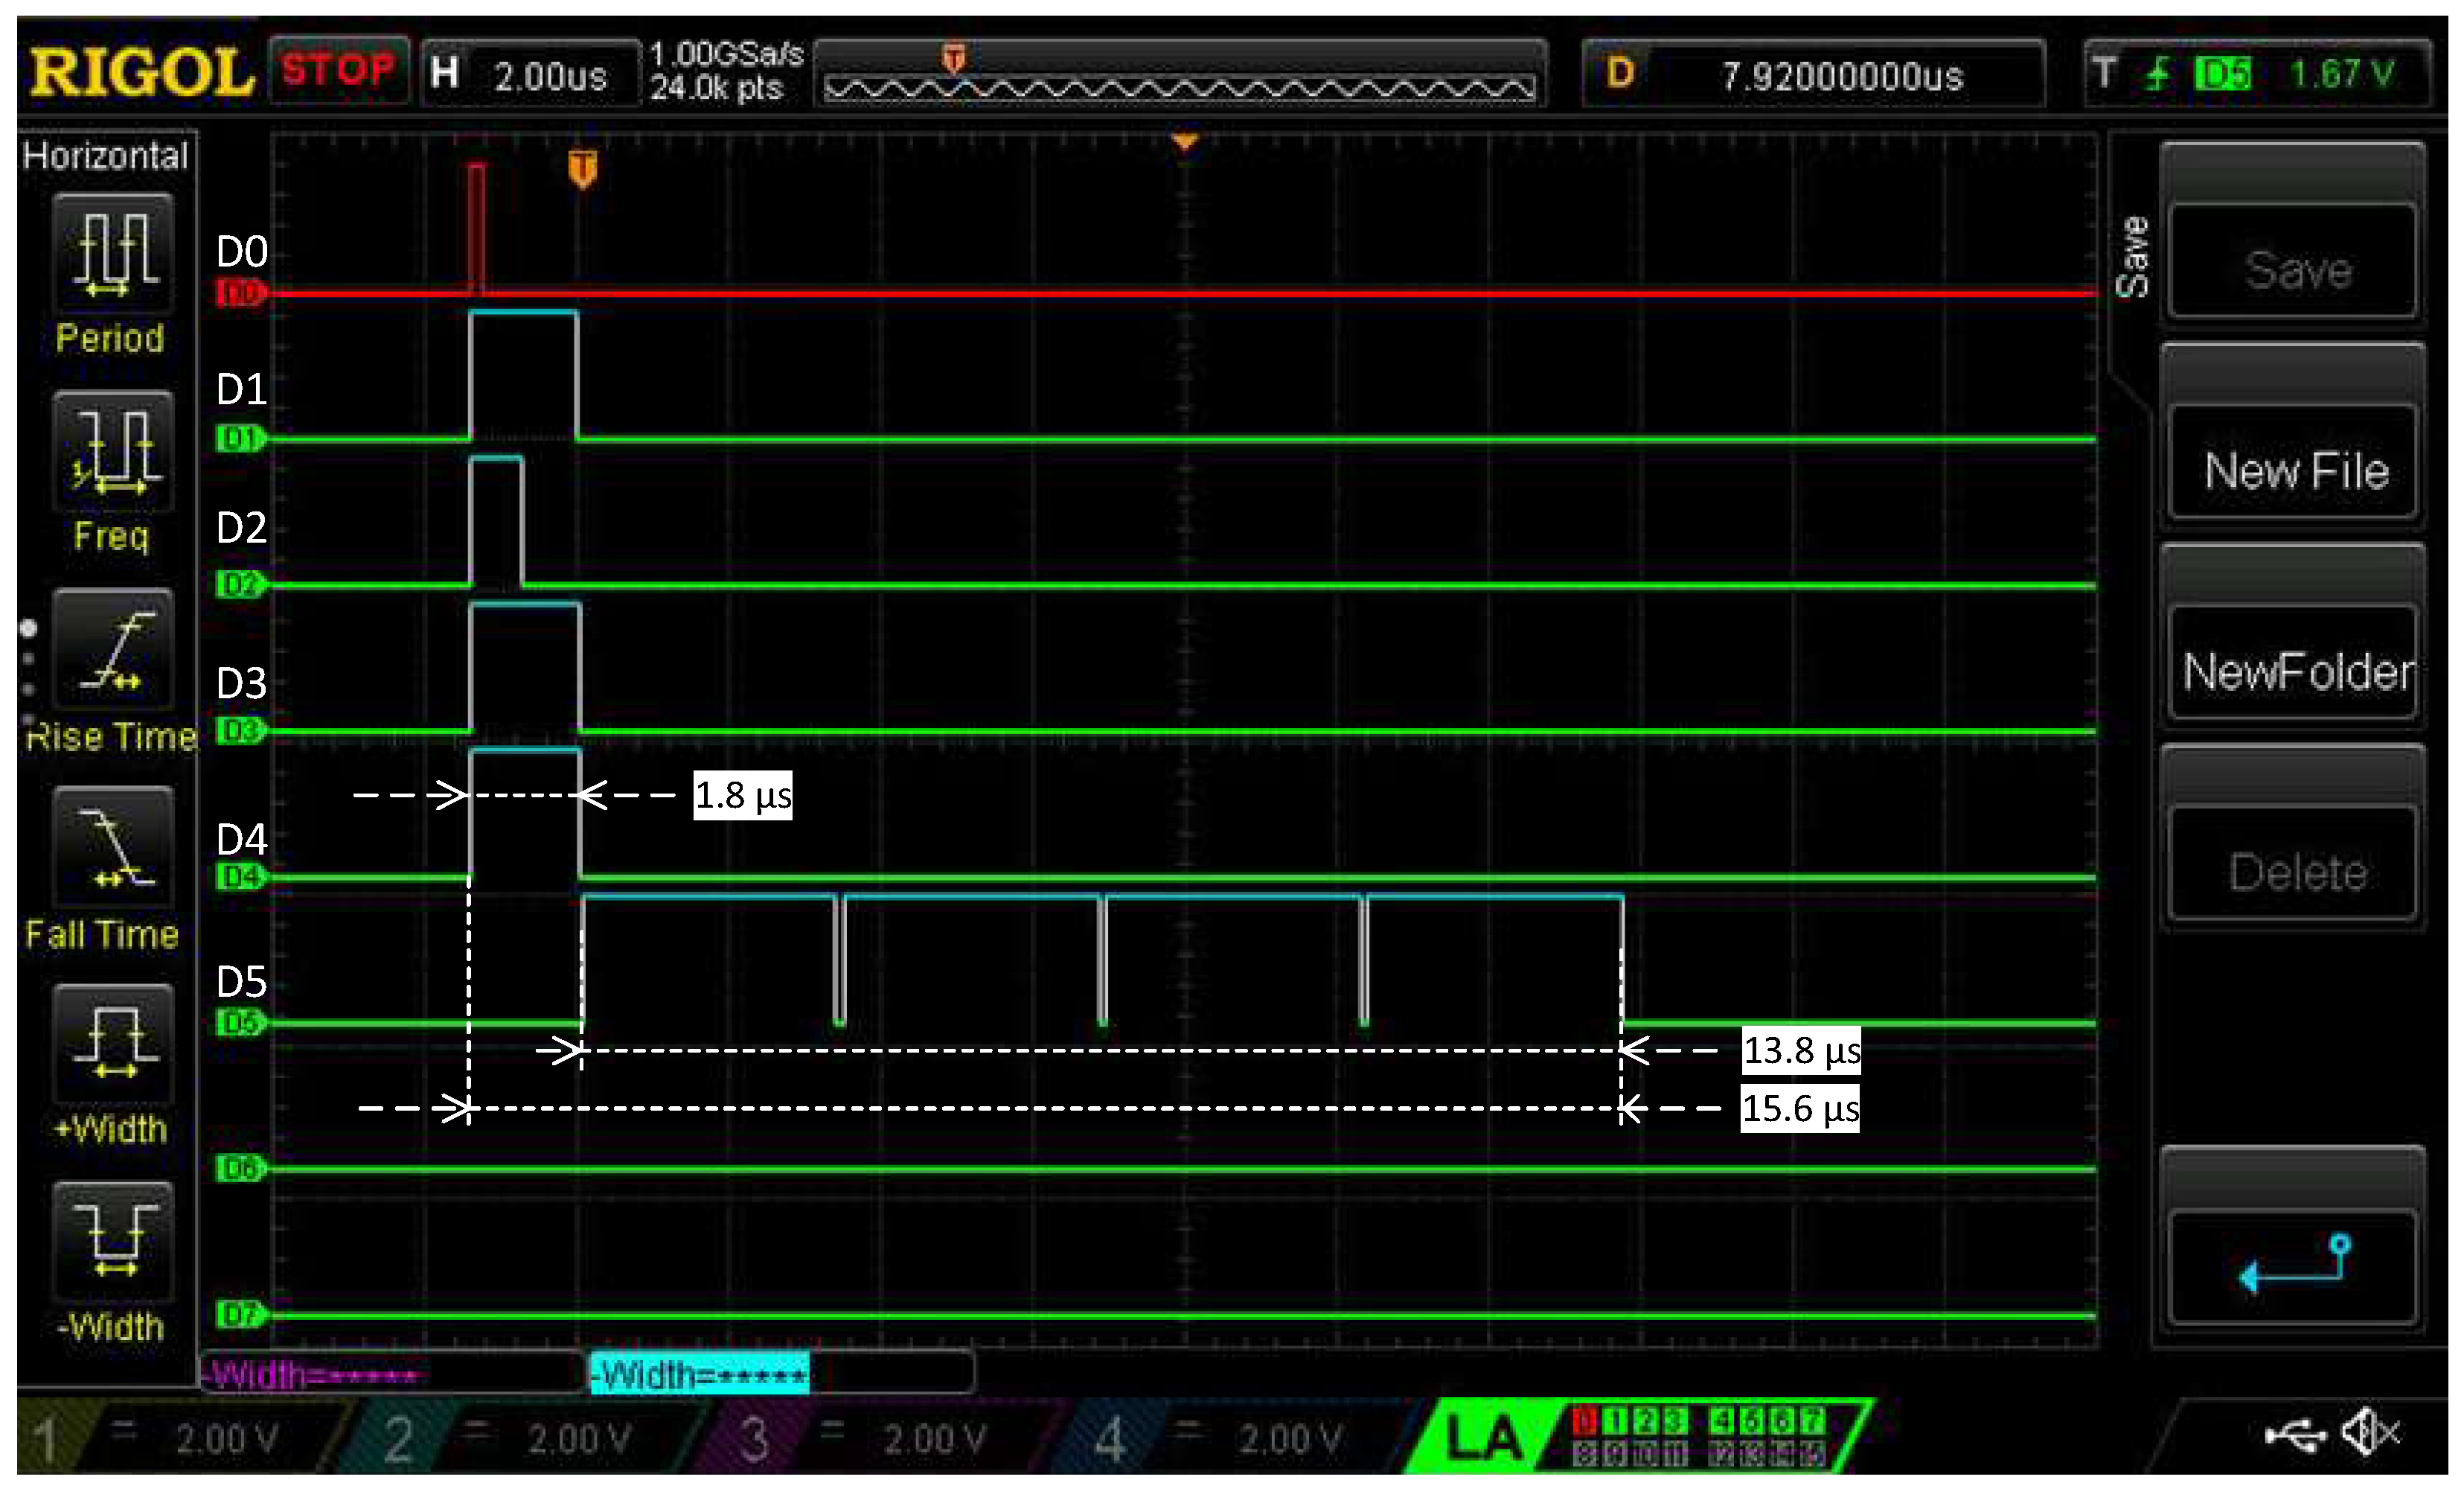
Figure 10 shows a logic analyzer capture measuring the duration of each subprocess during the last sensor data entry processing cycle. The 1.8 µs section represents the span of the calculation process for the metrics. The pulse in timeline D0 serves as the start signal for the i-th step in the metrics sequence. Once the process begins, the different metrics are calculated in parallel. Timeline D1 is the time duration for metrics MAV & WL (they are processed simultaneously); timeline D2 is the duration for metric ZC and timeline D3 is the duration for metric SSC. The process time for each metric is different; thus, a module monitors and indicates when all metrics are completed, and provides a pulse that represents the total time duration for all metric calculations—this pulse is shown in timeline D4. In this way, N 1 metric processes are performed; then, once the very last process is completed, the multiplication process starts (which is part of the task performed by the PCA module), which takes 13.8 µs. Figure 10 shows the time duration for each of these processes.
For some EMG applications, the sample time is in the order of 1 ms, so having this process completed within 15.6 µs allows this leftover time to be used for other processes, such as classification. It is important to mention that this paper does not discuss classification (as it will be described in a later publication). Therefore, for a process with N = 256 , the time to process a complete sequence would be 250 ms, and only on the last entry sample, the process takes the longest (in this case, the 15.6 µs), but allowing, as stated before, having practically all the sample period for other processes and/or calculations.

5. Conclusions and Future Work

This work presents an architectural case study demonstrating the feasibility and advantages of integrating EMG feature extraction with PCA-based dimensionality reduction in embedded FPGA systems. The key finding is that co-processing architectures can achieve significant performance improvements (7.3× speed, 3.1× energy efficiency) compared to traditional software approaches, making them suitable for battery-powered prosthetic applications. The architectural methodology presented here can be extended to other feature extraction algorithms and dimensionality reduction techniques, providing a foundation for future embedded EMG processing systems.
This work is a modular system in which a few of the most common metrics used in the EMG field are implemented. These metrics were implemented in VHDL, and the wrapper of it is embedded within a Petalinux system that interacts with the firmware that resides in the programmable logic area. The purpose underlying this work is to obtain a system that has the potential to be used on a portable application for transtibial prosthesis.
With the purpose of comparing the FPGA resources reported in this paper, the authors assembled Table 6, where two similar systems, the first for ECG denoising [38] and the second for pre-processing blocks [39], are compared.
Due to resource limitations on the evaluation board, a few blocks of filters are currently implemented outside the FPGA. However, if using a bigger FPGA, the filter bank to clean the signal from the sensors can be added as part of the firmware, allowing for a more robust system.
Other possible future areas are to add an RTOS system within the Petalinux system so that the training of the PCA matrix can be performed as a periodic process, allowing the system to learn from the history of the samples entering the system and that are processed through it.
This work focuses on architectural contributions rather than algorithmic innovation. The selection of time-domain features and PCA represents established methods chosen specifically for their hardware implementation characteristics. The primary contribution is the demonstration that integrated hardware architectures can significantly improve processing efficiency in resource-constrained embedded EMG systems, providing a foundation for future prosthetic control applications.

Author Contributions

Conceptualization, C.G.M.-P. and R.A.G.-L.; Data curation, M.A.; Formal analysis, J.R.-R.; Investigation, D.C.T.-P.; Methodology, D.C.T.-P.; Project administration, C.G.M.-P. and R.A.G.-L.; Resources, D.C.T.-P.; Software, C.G.M.-P. and R.A.G.-L.; Supervision, J.R.-R.; Validation, C.G.M.-P.; Writing—original draft, C.G.M.-P. and R.A.G.-L.; Writing—review and editing, M.A. All authors have read and agreed to the published version of the manuscript.

Funding

The authors would like to thank SECIHTI of Mexico for the funding required to generate the databases used for this research.

Informed Consent Statement

In this work, a database from a previous research was used. This database was obtained with the collaboration of eight subjects; however, this work only uses the database and there was no interaction with these persons.

Data Availability Statement

The database is available from the authors upon request.

Conflicts of Interest

The authors declare no conflicts of interest.

Abbreviations

The following abbreviations are used in this manuscript:
AXIAdvanced eXtensible Interface
ECGElectrocardiograms
EMGElectromyography
FPGAField-Programmable Gate Array
FSMFinite State Machine
FWFirmware
HWHardware
I/FInterface
IPIntellectual Property
MAVMean Absolute Value
PCAPrincipal Component Analysis
PLProgrammable Logic
PSProcessing System
RTLRegister Transfer Level
SSCSlope Sign Changes
SWSoftware
UARTUniversal Asynchronous Receiver-Transmitter
WLWaveform Length
ZCZero Crossings

Appendix A

Below is a summary of common features extracted from EMG signals in different domains.
  • Time-Domain Features: These features are computed directly from the raw EMG signal.
    • Mean Absolute Value (MAV):
      MAV = 1 N i = 1 N | x [ i ] | .
      This is also known as the Average Rectified Value (ARV) and is a commonly used feature to quantify muscle activity and can be used to assess muscle fatigue.
    • Root Mean Square (RMS):
      RMS = 1 N i = 1 N ( x [ i ] ) 2 .
      The RMS value is proportional to the amplitude of the EMG signal and reflects the intensity of muscle contraction. RMS is less sensitive to noise than the MAV.
    • Zero Crossings (ZC): Counts the number of times the signal crosses zero with a threshold to avoid noise.
    • Slope Sign Changes (SSC): Counts the number of changes in the slope direction, indicating fluctuations in the signal.
    • Waveform Length (WL):
      WL = i = 1 N 1 | x [ i + 1 ] x [ i ] |
    • Integrated EMG (IEMG):
      IEMG = i = 1 N | x [ i ] |
  • Frequency-Domain Features: These features are obtained after applying a transform such as the Fast Fourier Transform (FFT).
    • Mean Frequency (MNF):
      MNF = f k · P k P k
    • Median Frequency (MDF): The frequency that divides the power spectrum into two equal halves.
    • Power Spectrum Entropy (PSE): Measures the distribution of power across different frequencies.
    • Total Power: The sum of all power spectral densities, representing the overall power of the signal.
  • Time-Frequency Domain Features: These features provide information about the signal in both time and frequency domains.
    • Wavelet Coefficients: Extracted using wavelet decomposition, capturing both time and frequency information.
    • Spectrogram Features: Time-varying frequency content, useful for non-stationary signals.
  • Statistical Features: These features describe the statistical properties of the EMG signal.
    • Mean: The average value of the signal.
    • Standard Deviation (STD): Measures the variability of the signal.
    • Skewness: Indicates the asymmetry of the signal distribution.
    • Kurtosis: Measures the "tailedness" of the signal distribution.
  • Non-linear Features: These features capture the complex, non-linear nature of EMG signals.
    • Approximate Entropy (ApEn): Measures the complexity of the signal, with higher values indicating more irregularity.
    • Fractal Dimension (FD): Describes the self-similarity of the signal.
    • Lyapunov Exponent: Measures the chaotic behavior of the signal; positive values indicate chaos.

References

  1. Namboothiripad, M.K.; Vadhyan, G. Efficient implementation of artificial neural networks on FPGAs using high-level synthesis and parallelism. Int. J. Adv. Technol. Eng. Explor. 2024, 11, 1497–1511. [Google Scholar] [CrossRef]
  2. Fejér, A.; Nagy, Z.; Benois-Pineau, J.; Szolgay, P.; de Rugy, A.; Domenger, J.P. Implementation of Scale Invariant Feature Transform detector on FPGA for low-power wearable devices for prostheses control. Int. J. Circuit Theory Appl. 2021, 49, 2255–2273. [Google Scholar] [CrossRef]
  3. Pal, S.; Upadhyaya, B.K.; Majumder, T.; Dasgupta, S.; Das, N.; Bhattacharjee, A. Dynamic configuration optimization of FPGA accelerators through reinforcement learning for enhanced performance and resource utilization. Eng. Res. Express 2025, 7, 015317. [Google Scholar] [CrossRef]
  4. Patel, V.; Shah, A. Design and implementation of low power FPGA-based optimal multiband filter with Spline function for denoising ECG signals. Comput. Methods Biomech. Biomed. Eng. 2025, 28, 226–237. [Google Scholar] [CrossRef]
  5. Reddy, V.H.P.; Kumar, P.K. FPGA enabled ECG signal reconstruction based on an enhanced orthogonal matching pursuit algorithm. Integration 2025, 101, 102311. [Google Scholar] [CrossRef]
  6. Cai, Z.; Li, P.; Cheng, L.; Yuan, D.; Li, M.; Li, H. A high performance heterogeneous hardware architecture for brain computer interface. Biomed. Eng. Lett. 2024, 15, 217–227. [Google Scholar] [CrossRef]
  7. Pillai, H.H.; P S, L.P.; Ekanayaka, K.U.; Suthakorn, J.; Pillai, B.M. Bio-Signal Activated FPGA-Based System for Robotic-Assisted Rehabilitation. In Proceedings of the 2023 3rd International Conference on Robotics, Automation and Artificial Intelligence (RAAI), Singapore, 14–16 December 2023; pp. 195–199. [Google Scholar] [CrossRef]
  8. Perry, J.; Bekey, G. EMG-force relationships in skeletal muscle. Crit. Rev. Biomed. Eng. 1981, 7, 1–22. [Google Scholar] [PubMed]
  9. Gao, B.; Han, Y.; Zhou, Y.; Yu, J.; Li, S.; Dong, A. Wireless Portable Dry Electrode Multi-channel sEMG Acquisition System. In Proceedings of the Wireless Artificial Intelligent Computing Systems and Applications; Cai, Z., Takabi, D., Guo, S., Zou, Y.,, Eds.; Springer: Cham, Switzerland, 2025; pp. 124–135. [Google Scholar] [CrossRef]
  10. Gautam, Y.; Jebelli, H. Design of flexible polyimide-based serpentine EMG sensor for AI-enabled fatigue detection in construction. Sens. Bio-Sens. Res. 2024, 46, 100713. [Google Scholar] [CrossRef]
  11. Hambly, M.J.; de Sousa, A.C.C.; Pizzolato, C. Comparison of filtering methods for real-time extraction of the volitional EMG component in electrically stimulated muscles. Biomed. Signal Process. Control 2024, 87, 105471. [Google Scholar] [CrossRef]
  12. Esposito, D.; Centracchio, J.; Bifulco, P.; Andreozzi, E. A smart approach to EMG envelope extraction and powerful denoising for human–machine interfaces. Sci. Rep. 2023, 13, 7768. [Google Scholar] [CrossRef]
  13. Choi, H.S. Electromyogram (EMG) Signal Classification Based on Light-Weight Neural Network with FPGAs for Wearable Application. Electronics. 2023, 12, 1398. [Google Scholar] [CrossRef]
  14. Kok, C.L.; Ho, C.K.; Tan, F.K.; Koh, Y.Y. Machine Learning-Based Feature Extraction and Classification of EMG Signals for Intuitive Prosthetic Control. Appl. Sci. 2024, 14, 5784. [Google Scholar] [CrossRef]
  15. Dhanush Babu, R.; Siva Adithya, S.; Dhanalakshmi, M. Design and development of an EMG controlled transfemoral prosthesis. Meas. Sensors 2024, 36, 101399. [Google Scholar] [CrossRef]
  16. Boschmann, A.; Agne, A.; Thombansen, G.; Witschen, L.; Kraus, F.; Platzner, M. Zynq-based acceleration of robust high density myoelectric signal processing. J. Parallel Distrib. Comput. 2019, 123, 77–89. [Google Scholar] [CrossRef]
  17. Farina, D.; Merletti, R.; Enoka, R.M. The extraction of neural strategies from the surface EMG: 2004–2024. J. Appl. Physiol. 2025, 138, 121–135. [Google Scholar] [CrossRef]
  18. Andalib, A.; Farina, D.; Vujaklija, I.; Negro, F.; Aszmann, O.C.; Bashirullah, R.; Principe, J.C. Unsupervised decoding of spinal motor neuron spike trains for estimating hand kinematics following targeted muscle reinnervation. arXiv 2019. [Google Scholar] [CrossRef]
  19. Konuk, M.E.; Şahin, D.O.; Kılıç, E. EMG Verilerinin Sınıflandırılmasında PCA Boyut İndirgeme Tekniğinin Etkisinin İncelenmesi/Investigating the Effect of PCA Dimension Reduction Technique in Classifying EMG Data. In Proceedings of the 2024 International Congress on Human–Computer Interaction, Optimization and Robotic Applications (HORA), Istanbul, Turkiye, 23–25 May 2024; pp. 1–6. [Google Scholar] [CrossRef]
  20. Bosco, G. Principal component analysis of electromyographic signals: An overview. Open Rehabil. J. 2010, 3, 127–131. [Google Scholar] [CrossRef]
  21. Zhu, M.; Guan, X.; Li, Z.; He, L.; Wang, Z.; Cai, K. sEMG-based lower limb motion prediction using CNN-LSTM with improved PCA optimization algorithm. J. Bionic Eng. 2023, 20, 612–627. [Google Scholar] [CrossRef]
  22. Matrone, G.C.; Cipriani, C.; Carrozza, M.C.; Magenes, G. Real-time myoelectric control of a multi-fingered hand prosthesis using principal components analysis. J. NeuroEng. Rehabil. 2012, 9, 40. [Google Scholar] [CrossRef]
  23. Cabegin, K.; Lim, M.; Fernan, D.T.; Garcia Santos, R.; Magwili, G. Electromyography-based Control of Prosthetic Arm for Transradial Amputees using Principal Component Analysis and Support Vector Machine Algorithms. In Proceedings of the 2019 IEEE 11th International Conference on Humanoid, Nanotechnology, Information Technology, Communication and Control, Environment, and Management, HNICEM 2019, Laoag, Philippines, 29 November–1 December 2019. [Google Scholar] [CrossRef]
  24. Geethanjali, P. Comparative study of PCA in classification of multichannel EMG signals. Australas. Phys. Eng. Sci. Med. 2015, 38, 331–343. [Google Scholar] [CrossRef] [PubMed]
  25. Qi, J.; Jiang, G.; Li, G.; Sun, Y.; Tao, B. Surface EMG hand gesture recognition system based on PCA and GRNN. Neural Comput. Appl. 2020, 32, 6343–6351. [Google Scholar] [CrossRef]
  26. Bachanna, P.; Gadgay, B.; Chatterjee, S. Probabilistic Principle Component Analysis based Feature Extraction of Embedded System Applications with Deep Neural Network based Implementation in FPGA. Int. J. Recent Innov. Trends Comput. Commun. 2023, 11, 45–51. [Google Scholar] [CrossRef]
  27. Yadav, M.; Koul, R.; Suneja, K. FPGA Based Hardware Design of PCA for Face Recognition. In Proceedings of the 2020 7th International Conference on Signal Processing and Integrated Networks (SPIN), Noida, India, 27–28 February 2020; pp. 642–646. [Google Scholar] [CrossRef]
  28. Ghasemzadeh, H.; Fallahzadeh, R.; Jafari, R. A Hardware-Assisted Energy-Efficient Processing Model for Activity Recognition Using Wearables. ACM Trans. Des. Autom. Electron. Syst. 2016, 21, 1–27. [Google Scholar] [CrossRef]
  29. Castruita-López, J.F.; Aviles, M.; Toledo-Pérez, D.C.; Macías-Socarrás, I.; Rodríguez-Reséndiz, J. Electromyography Signals in Embedded Systems: A Review of Processing and Classification Techniques. Biomimetics 2025, 10, 166. [Google Scholar] [CrossRef] [PubMed]
  30. Cerina, L.; Cancian, P.; Franco, G.; Santambrogio, M.D. A hardware acceleration for surface EMG non-negative matrix factorization. In Proceedings of the 2017 IEEE International Parallel and Distributed Processing Symposium Workshops (IPDPSW), Lake Buena Vista, FL, USA, 29 May–2 June 2017; pp. 168–174. [Google Scholar] [CrossRef]
  31. Najafi, T.A.; Calero, J.A.M.; Thevenot, J.; Duc, B.; Albini, S.; Amirshahi, A.; Taji, H.; Beneyto, M.J.B.; Affanni, A.; Atienza, D. VersaSens: An Extendable Multimodal Platform for Next-Generation Edge-AI Wearables. IEEE Trans. Circuits Syst. Artif. Intell. 2024, 1, 83–96. [Google Scholar] [CrossRef]
  32. Meddah, K.; Zairi, H.; Bessekri, B.; Cherrih, H.; Kedir-Talha, M. FPGA implementation of Epileptic Seizure detection based on DWT, PCA and Support Vector Machine. In Proceedings of the 2020 Second International Conference on Embedded & Distributed Systems (EDiS), Oran, Algeria, 3 November 2020; pp. 141–146. [Google Scholar] [CrossRef]
  33. Cerina, L.; Franco, G.; Cancian, P.; Santambrogio, M.D. Robustness of Surface EMG Classifiers with Fixed-Point Decomposition on Reconfigurable Architecture. In Proceedings of the 2018 IEEE International Parallel and Distributed Processing Symposium Workshops (IPDPSW), Vancouver, BC, Canada, 21–25 May 2018; pp. 146–153. [Google Scholar] [CrossRef]
  34. Lv, H.; Wang, Y.; Hao, B. Lower limb joint angle estimation based on surface electromyography signals. Biomed. Signal Process. Control 2025, 104, 107563. [Google Scholar] [CrossRef]
  35. Kokkinis, A.; Siozios, K. Fast Resource Estimation of FPGA-Based MLP Accelerators for TinyML Applications. Electronics 2025, 14, 247. [Google Scholar] [CrossRef]
  36. Press, W.H.; Teukolsky, S.A.; Vetterling, W.T.; Flannery, B.P. Numerical Recipes: Example Book C, 2nd ed.; Cambridge University Press: Cambridge, UK, 1992. [Google Scholar]
  37. Fay, R.; Hsieh, A.; Jeang, D.; Jenkins, B. Floating Point Library. 2023. Available online: https://github.com/xesscorp/Floating_Point_Library-JHU (accessed on 5 May 2023).
  38. Kirti; Sohal, H.; Jain, S. FPGA implementation of collateral and sequence pre-processing modules for low power ECG denoising module. Inform. Med. Unlocked 2022, 28, 100838. [Google Scholar] [CrossRef]
  39. Sohal, H.; Jain, S. FPGA Implementation of Power-Efficient ECG Pre-Processing Block; Jaypee University of Information Technology: Solan, India, 2019. [Google Scholar]
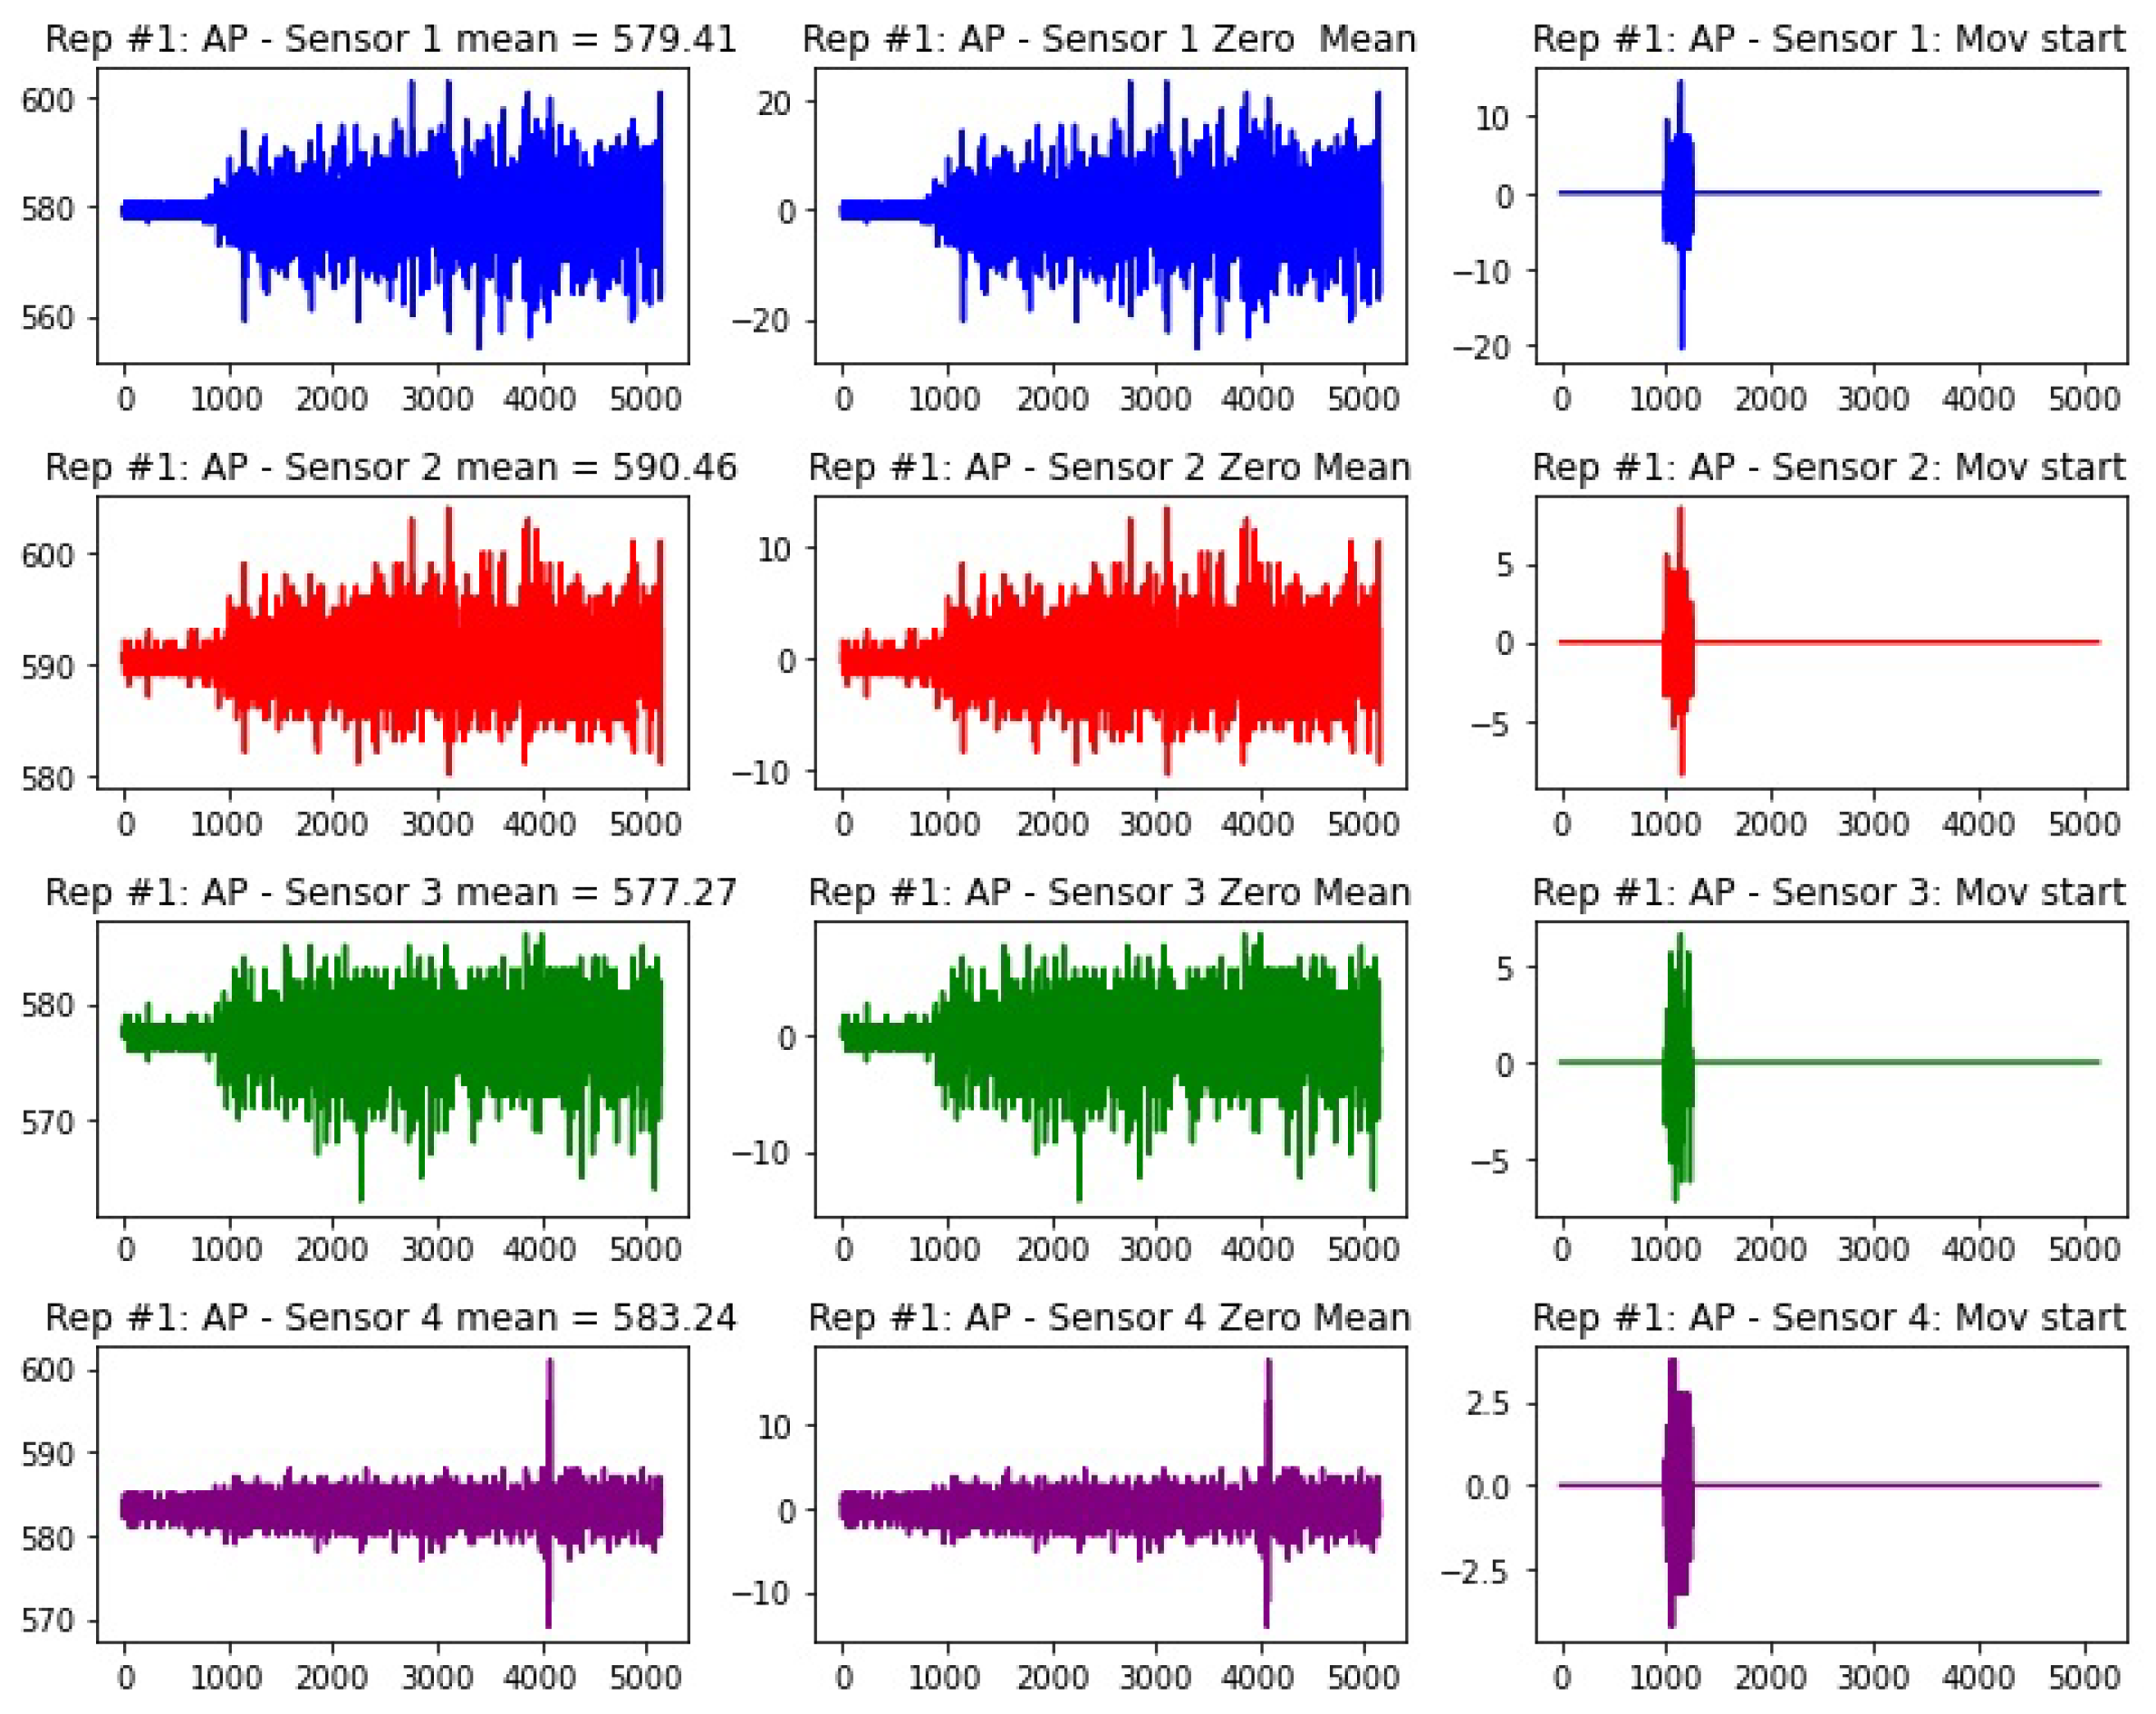
Figure 1. A repetition for the AP movement. The horizontal axis is scaled in samples while the vertical axis is scaled in ADC counts, The first column shows the original signal, the second column is the signal minus its mean, and the third column displays only the first 250 samples after the movement onset.
Algorithms 18 00617 g001
Figure 2. Statistical distribution (histogram) for the AP movement with the raw data from the sensors. The horizontal axis bundles the ADC count before scaling, and the vertical axis bundles the frequency distribution.
Algorithms 18 00617 g002
Figure 3. Use of the AXI4-Lite interface for communicating the PS and PL sides. The communication with modules implemented in the PL section is achieved through the AXI4-Lite interface.
Algorithms 18 00617 g003
Figure 4. System Block Diagram showing the data input external interface and the interconnection between the PS & PL sections. The different layers are color-coded.
Algorithms 18 00617 g004
Figure 5. System Block Diagram showing input external interface.
Algorithms 18 00617 g005
Figure 6. State machine used on most of the processes implemented in VHDL. This is the case for the “PCA” process.
Algorithms 18 00617 g006
Figure 7. Diagram showing the intercommunication among the “PCA”, “Metrics” and the main “Processing” modules, which synchronizes the events from the other two.
Algorithms 18 00617 g007
Figure 8. UML class diagram for the C language code that computes the PCA matrix V . Notice that * refers to data indirection, and double indirection refers to an array of pointers for a dynamic bi-dimensional array.
Algorithms 18 00617 g008
Figure 9. Combined system state machine showing the flow between PS and PL operations.
Algorithms 18 00617 g009
Figure 10. Oscilloscope measurement of the time intervals: D0: DataValid; Metrics: D1: MAV & WL available; D2: ZC available; D3: SSC available; D4: All metrics’ available time (OR’ed D1, D2 and D3); D5: PCA multiplication processes.
Algorithms 18 00617 g010
Table 1. Summary of the four metrics implemented on the system.
MetricMain PurposeSensitivityApplications
MAVMeasures average amplitude.Signal amplitude.Muscle activation, fatigue.
WLCaptures signal complexity and energy.Amplitude and frequency.Feature extraction, signal analysis.
SSCMeasures frequency content.Changes in slope.Movement detection, fatigue.
ZCMeasures signal frequency.Zero-crossing events.Pattern recognition, movement control.
Table 2. Comparison of PL vs. PS implementation for PCA operations.
ImplementationProcessing Time (µs)Power (mW)
PS (ARM Cortex-A9)6601531
PL (Custom Logic)90489
Table 3. C Layer communication link-access to FPGA registers in FW through AXI I/F.
OffsetAddressDescription
1843C0048MAV Sensor 1
1643C0040WL Sensor 1
2243C0058ZC Sensor 1
3043C0078SSC Sensor 1
1543C003CMAV Sensor 2
1343C0034WL Sensor 2
2143C0054ZC Sensor 2
2943C0074SSC Sensor 2
1243C0030MAV Sensor 3
1043C0028WL Sensor 3
2043C0050ZC Sensor 3
2843C0070SSC Sensor 3
943C0024MAV Sensor 4
743C001CWL Sensor 4
1943C004CZC Sensor 4
2743C006CSSC Sensor 4
Table 4. Resource utilization report from Vivado 2019.1. It describes how the available resources are distributed across the different modules.
Module (ID)LUTsRegistersF7MuxF8MuxSliceLUT/LogicLUT/MemoryRAMDSPs
AXI BRAM_CTRL1841970086184000
AXI MEM_GEN91200107220
fp_divAav17641352002577283600
fp_divAav27641352002727283600
fp_divAav37641352002717283600
fp_divAav47641352003157283600
fp_mulPCA0871660079751202
fp_mulPCA1861660071751102
fp_mulPCA2871660076751202
fp_mulPCA3871660079751102
mySystemip2509440564017292509000
processing_module24,02519,02923681184913724,025000
Processing_system000000000
AXI_Periph537496002134983900
rst_ps7_100M1640001515100
fp_S1SSC_Div7641352003087283600
fp_S1ZC_Div7641352002637283600
fp_S2SSC_Div7641352003027283600
fp_S2ZC_Div7641352002797283600
fp_S3SSC_Div7641352002647283600
fp_S3ZC_Div7641352002887283600
fp_S4SSC_Div7641352002657283600
fp_S4ZC_Div7641352002867283600
Total36,79541,0672432118414,86536,27452028
Table 5. Resource utilization for the most important modules in the system: Metrics and PCA. In this section, the report is for the logic used inside these modules. The proprietary IPs (to perform multiplication & division) are not part of this section of the utilization report and the 7 multipliers are reported as DSPs in Table 4.
Module (ID)LUTsRegistersF7MuxF8MuxSliceLUT/LogicLUT/MemoryRAMDSPs
module_metrics15,395702800479315,395000
met_mod_s1385017570012613850000
met_mod_s2385117570012143851000
met_mod_s3384517570013523845000
met_mod_s4384917570012363849000
pca_module842710,4982368118447318427000
gen_add_mul_073413000217734000
gen_add_mul_173413000213734000
gen_add_mul_273313000206733000
gen_add_mul_373713000210737000
Total42,15525,0742368118415,43342,155000
Table 6. Comparison between the present work and two similar applications.
ProjectSectionsDSPsSlice DUTPower (W)
ECG denoising paper [38]Wavelet Implementations
Wavelet Haar183090.262
Wavelet Daubechies347290.316
Wavelet Coiflets347290.313
Wavelet Biorthogonal347290.301
Totals 12024961.192
Pre-processing paper [39]
Hanning72250.144
Kaiser62200.121
Hamming62200.136
Bartlett62200.121
Rectangular62470.136
Blackman72470.142
Totals 3813790.8
This workModules and Main Areas
Metrics Module015,412
PCA Module810,507
Clocks 0.104
Signals 0.179
Logic 0.191
DSP 0.006
BRAM and IOs 0.009
Totals 825,9190.489
Disclaimer/Publisher’s Note: The statements, opinions and data contained in all publications are solely those of the individual author(s) and contributor(s) and not of MDPI and/or the editor(s). MDPI and/or the editor(s) disclaim responsibility for any injury to people or property resulting from any ideas, methods, instructions or products referred to in the content.