Article

A New Algorithm for Detecting GPN Protein Expression and Overexpression of IDC and ILC Her2+ Subtypes on Polyacrylamide Gels Associated with Breast Cancer

by
Jorge Juarez-Lucero
1,
Maria Guevara-Villa
2,
Anabel Sanchez-Sanchez
1,*,
Raquel Diaz-Hernandez
1 and
Leopoldo Altamirano-Robles
1
1
Instituto Nacional de Astrofisica Optica y Electronica, Luis Enrique Erro # 1, Tonantzintla, Puebla 72840, Mexico
2
Faculty of Architecture, Meritorious Autonomous University of Puebla, 4 Sur 104 Centro Histórico, Puebla 72000, Mexico
*
Author to whom correspondence should be addressed.
Algorithms 2024, 17(4), 149; https://doi.org/10.3390/a17040149
Submission received: 24 January 2024 / Revised: 22 March 2024 / Accepted: 26 March 2024 / Published: 2 April 2024
(This article belongs to the Special Issue Machine Learning for Pattern Recognition)

Abstract

:
Sodium dodecyl sulfate–polyacrylamide gel electrophoresis (SDS-PAGE) is used to identify protein presence, absence, or overexpression and usually, their interpretation is visual. Some published methods can localize the position of proteins using image analysis on images of SDS-PAGE gels. However, they cannot automatically determine a particular protein band’s concentration or molecular weight. In this article, a new methodology to identify the number of samples present in an SDS-PAGE gel and the molecular weight of the recombinant protein is developed. SDS-PAGE images of different concentrations of pure GPN protein were created to produce homogeneous gels. Then, these images were analyzed using the developed methodology called Image Profile Based on Binarized Image Segmentation (IPBBIS). It is based on detecting the maximum intensity values of the analyzed bands and produces the segmentation of images filtered by a binary mask. The IPBBIS was developed to identify the number of samples in an SDS-PAGE gel and the molecular weight of the recombinant protein of interest, with a margin of error of 3.35%. An accuracy of 0.9850521 was achieved for homogeneous gels and 0.91736 for heterogeneous gels of low quality.

1. Introduction

Among the techniques used to identify the presence, absence, or overexpression of proteins of biological interest, sodium dodecyl sulfate–polyacrylamide gel electrophoresis (SDS-PAGE) is present. This technique separates proteins by applying an electric field to the gel. The proteins move through the gel and are retained in different positions according to molecular weight. The gel is stained using Coomassie blue. Each of the samples analyzed is represented in columns (lanes), and the horizontal bands correspond to the proteins detected in each piece. Thicker bands indicate higher protein concentration [1] (see Figure 1).
The gels obtained are used to visually find proteins and gene fragments in DNA gels [2,3,4] or as a method for disease diagnosis [3,4,5,6]. Unlike DNA gels, protein gels can contain many bands per sample, making them difficult for the human eye to interpret (see lane 4 in Figure 1). As a result, misinterpretations of protein gels can occur due to errors generated by optical illusions, visual sensitivity, or fatigue [3,5,6,7].
Image analysis has been used to interpret the DNA and protein bands in the images of SDS-PAGE gels. These analyses include background noise removal, lane detection, and segmentation of the lanes to analyze the protein or gene sought [8,9].
Many techniques have been used to remove background noise, such as contourlet and wavelet transforms, top-hat transforms, Gaussian low-pass filters, normalization, intensity shifts, median filters, adaptive thresholding, non-linear Gaussians, Fourier analysis, fuzzy-c-means, and some convolution matrix and image slices to search for regions of interest. These methods have been used individually or in combination to obtain improved and noise-free image profiles to extract gel features [1,3,4,5,7,8,10,11,12,13,14,15,16,17,18,19,20].
Several tools have been employed to detect lanes and segmentation of the bands [1,3,4,5,7,8,10,11,12,13,14,15,16,18,19,20,21,22]. These techniques involve various methods to improve segmentation by selecting necessary pixels related to background contrast. They include edge detection using Bayesian approximations, thresholding, or Otsu segmentation. Users can choose a region of interest to reduce size, minimize noise, calculate standard deviation, and manually set a threshold to generate the gel profile. Division of the area between user-specified lanes can be achieved using Gaussian functions or templates. Sobel filters can be applied to identify lanes and bands in the gel.
Additionally, Gaussian processes or templates can split the region between user-specified lanes. Sobel filters can also detect peaks and troughs in the intensity profiles, aiding in identifying the gaps between lanes. Brightness changes can be measured, and the number of pixels in the lanes can be counted to determine their distances using variations in grey levels. Spectral density can be calculated to average the width of lanes, allowing for the selection of specific regions within the image. An analysis is also performed on the profile of the peaks through their areas to group them using techniques such as K-means, and the bands are delimited with ellipses to avoid their intersection and to determine the separation of the lanes. Among all the proposed methods, the ones that have shown the best results include the user’s choice of regions of interest to reduce noise and generate more accurate profiles, which facilitates the identification of the minima related to the separation of lanes in the gel.
Currently, programs such as Scanalytics, GelcomparII, GelJ, Gel-Pro Analyzer, ImageJ, PyElph, TotalLab, PDQuest, Proteomweaver, Dcyder 2D, imageMaster, Melanie, BioNumerics, Redfin, Gel IQ, Z3, and Delta2D Flicker are used to analyze images of DNA or protein gels [1,10,23,24,25,26,27,28,29]. These programs employ semi-automatic filters to remove noise, meaning the operator must manually select the column or band of interest. The user also adjusts the intensity changes and decides the threshold that reduces the background noise. However, due to the dependence on analysts with little knowledge of intensities and thresholding, this often results in poor gel analysis.
In this article, the methodology described in reference [30] is used to obtain different concentrations of pure GPN protein added to a bacterial cell extract to create SDS-PAGE gels. The incorrect or excessive expression of some proteins may be associated with an imbalance in health. So, this research produces gels representing patient samples with different amounts of protein expression, including absence and different levels of overexpression, to emulate various stages of Invasive Ductal Carcinoma (IDC) and Invasive Lobular Carcinoma (ILC) Her2+ breast cancer. Therefore, identifying specific proteins can be helpful in disease diagnosis. Examples of such proteins are GTPases, such as Rho, Rab27, and GPN, which have been linked to the development of breast cancer [31]. Reference [30], an article by the same authors as the present article, describes a new methodology for obtaining pure GPN protein in high levels in homogeneous form. In the current research, an algorithm was proposed for a new method to identify the lanes and bands of samples present in an SDS-PAGE gel and the molecular weight, to identify the overexpressed protein related to breast cancer. For that, the obtained images were analyzed using the newly developed image analysis methodology to identify different levels of expression of the GPN protein expressed per sample. This methodology is based on detecting the pixel values of the white color of the histogram segmentation of images filtered by a binary mask.

1.1. Novelty

Current investigations to search proteins in SDS-PAGE gels require manually selecting the area corresponding to the protein of interest to locate the separation between proteins by processing. The methodology proposed in this article automatically identifies the protein of interest and automatically determines its overexpression levels, and has not been presented in other works.

1.2. Limitations and Challenges

Although the algorithm performs best in finding the protein of interest automatically, the gel image must be of a minimum good quality, otherwise, the algorithm will fail. A database of polyacrylamide gel does not exist to apply and train a neural network to find the overexpressed protein. It is difficult to obtain samples of various stages of IDC and ILC Her2+ breast cancer.
This article is segmented as follows: Section 1 shows the advances in SDS-PAGE gel image analysis to identify proteins and their overexpression. Section 2 describes the procedure IPBBIS for obtaining overexpression gels. The IPBBIS method includes preprocessing techniques, diagrams, and pseudocodes that determine the number of samples present in a gel, the protein bands, and their overexpression. Section 3 details the results obtained and their discussion. At the end for Section 4 of the article, conclusions and future work are described.

2. Materials and Methods

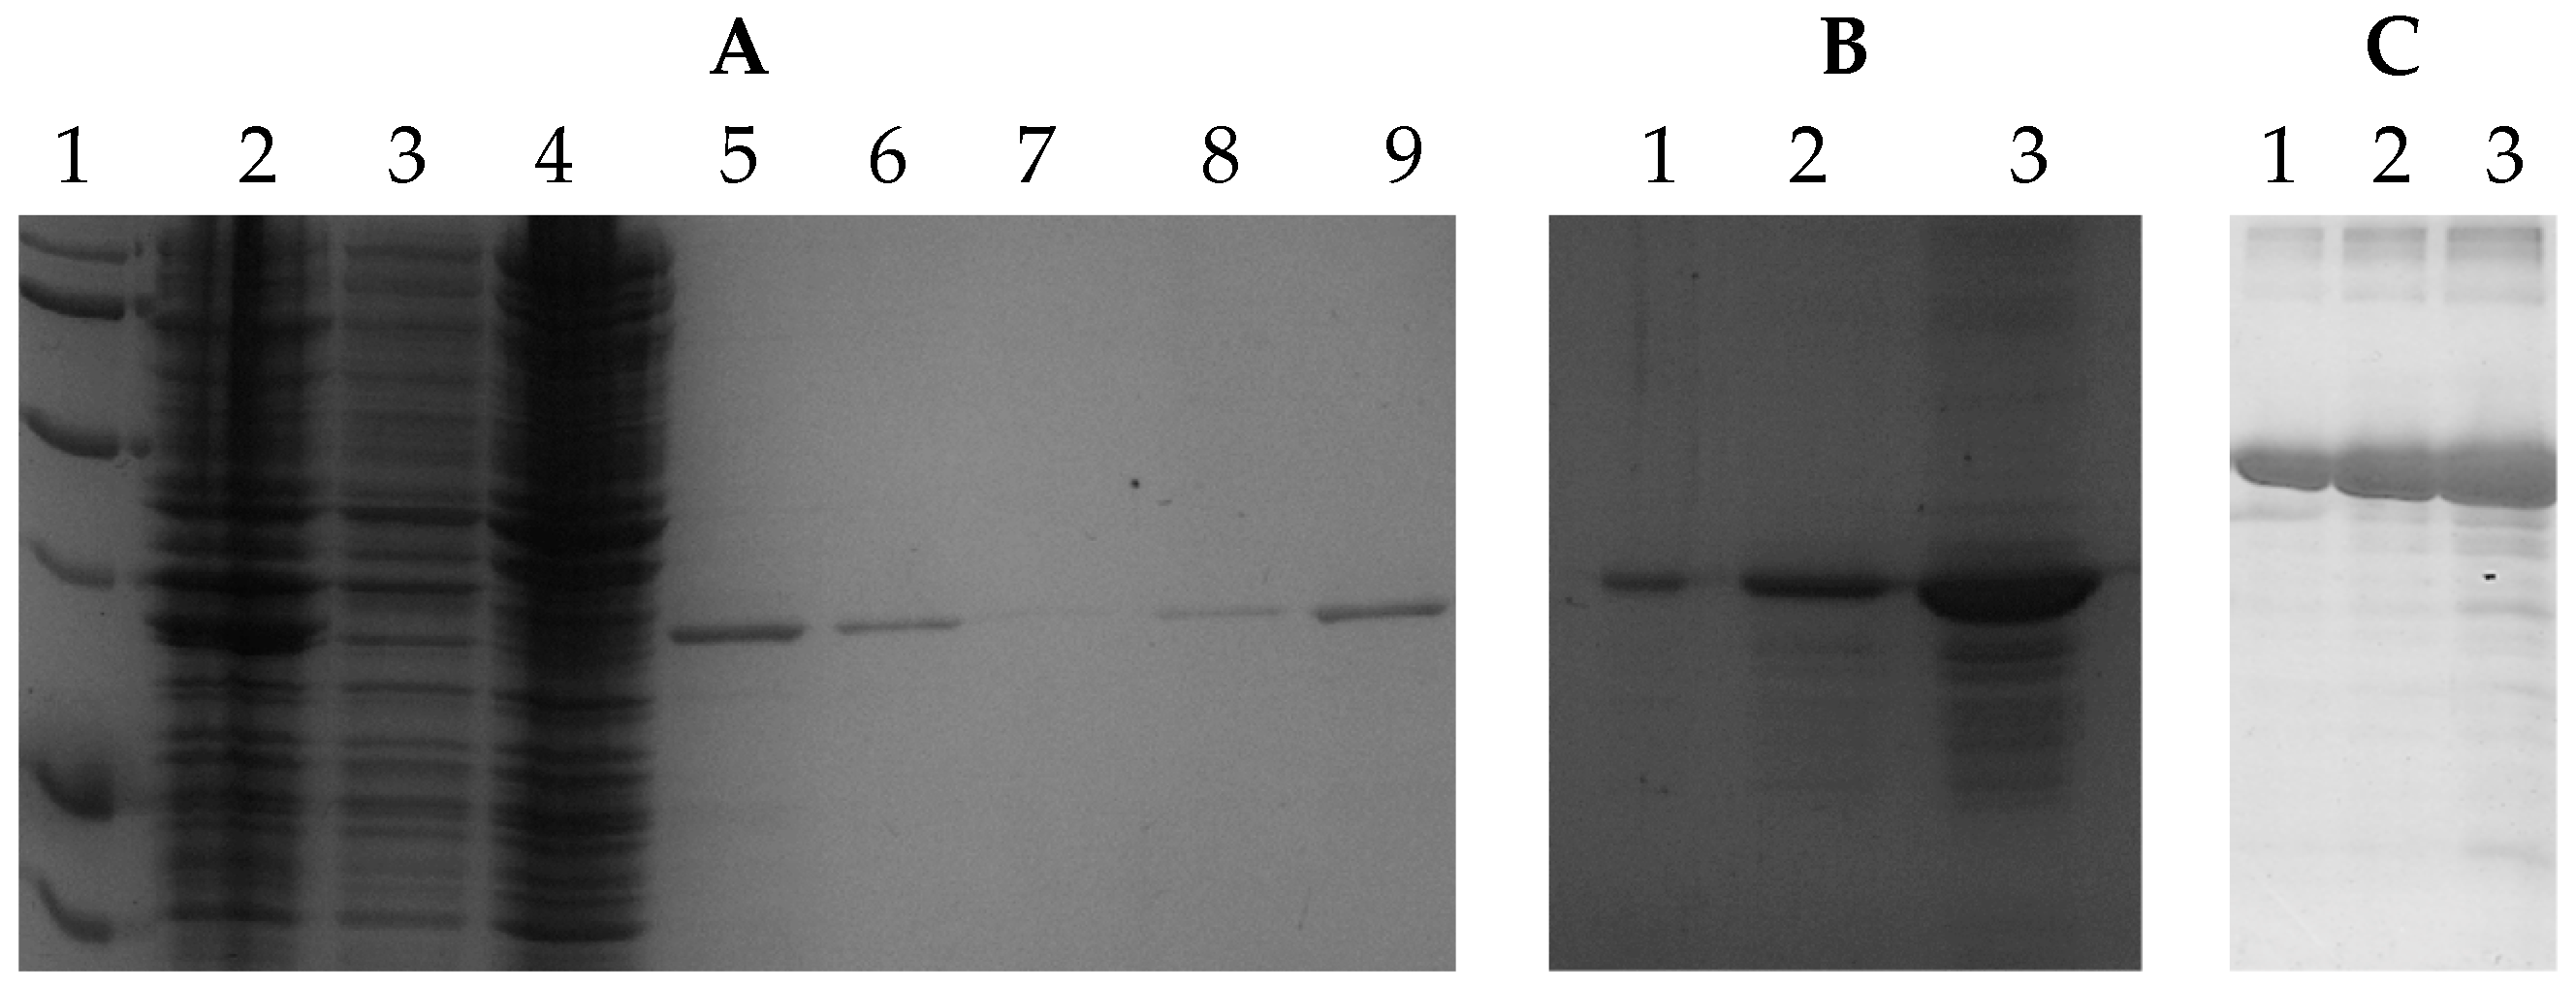
2.1. Creation of Samples with Different GPN Concentrations

SDS-PAGE images corresponding to samples of different concentrations were obtained to replicate or emulate the GPN protein overexpression in vivo during the involvement of IDC and ILC Her2+ breast cancer [31]. For this activity, the purification methodology shown in [30] was followed. Images of the gels are shown in Figure 2A,B.
In addition, to obtain SDS-PAGE images from controlled concentrations, a dilution of bovine serum albumin (BSA) protein obtained from the Bio-Rad Protein Assay kit was prepared to get three samples with the following concentrations: 2 mg/mL, 1 mg/mL, and 0.5 mg/mL (lanes 1, 2, and 3, respectively, in Figure 2C). This experiment demonstrated that the methodology proposed here also achieves the set goal for other protein classes.
Samples numbering 2230 were used, including endogenous Escherichia coli proteins with random addition of GPN at different concentrations. Two minibatches were used from this dataset. The first one, 1561 samples, was called heterogeneous because the samples presented different degrees of staining, smiley face effects. or curved lines, and even SDS-PAGE breaks. The second minibatch comprised 669 homogeneous samples because the gel characteristics did not vary. For each minibatch, 70% was used for training and the rest for testing.

2.2. Image Acquisition

SDS-PAE images were obtained with a Gel Doc XR+ photo documenter system based on CCD high resolution, using image Lab Software to capture pictures following the specifications of the supplier Bio-Rad. The resolution of the images was 4 megapixels, and the pixel density was 4096 ppi [32].

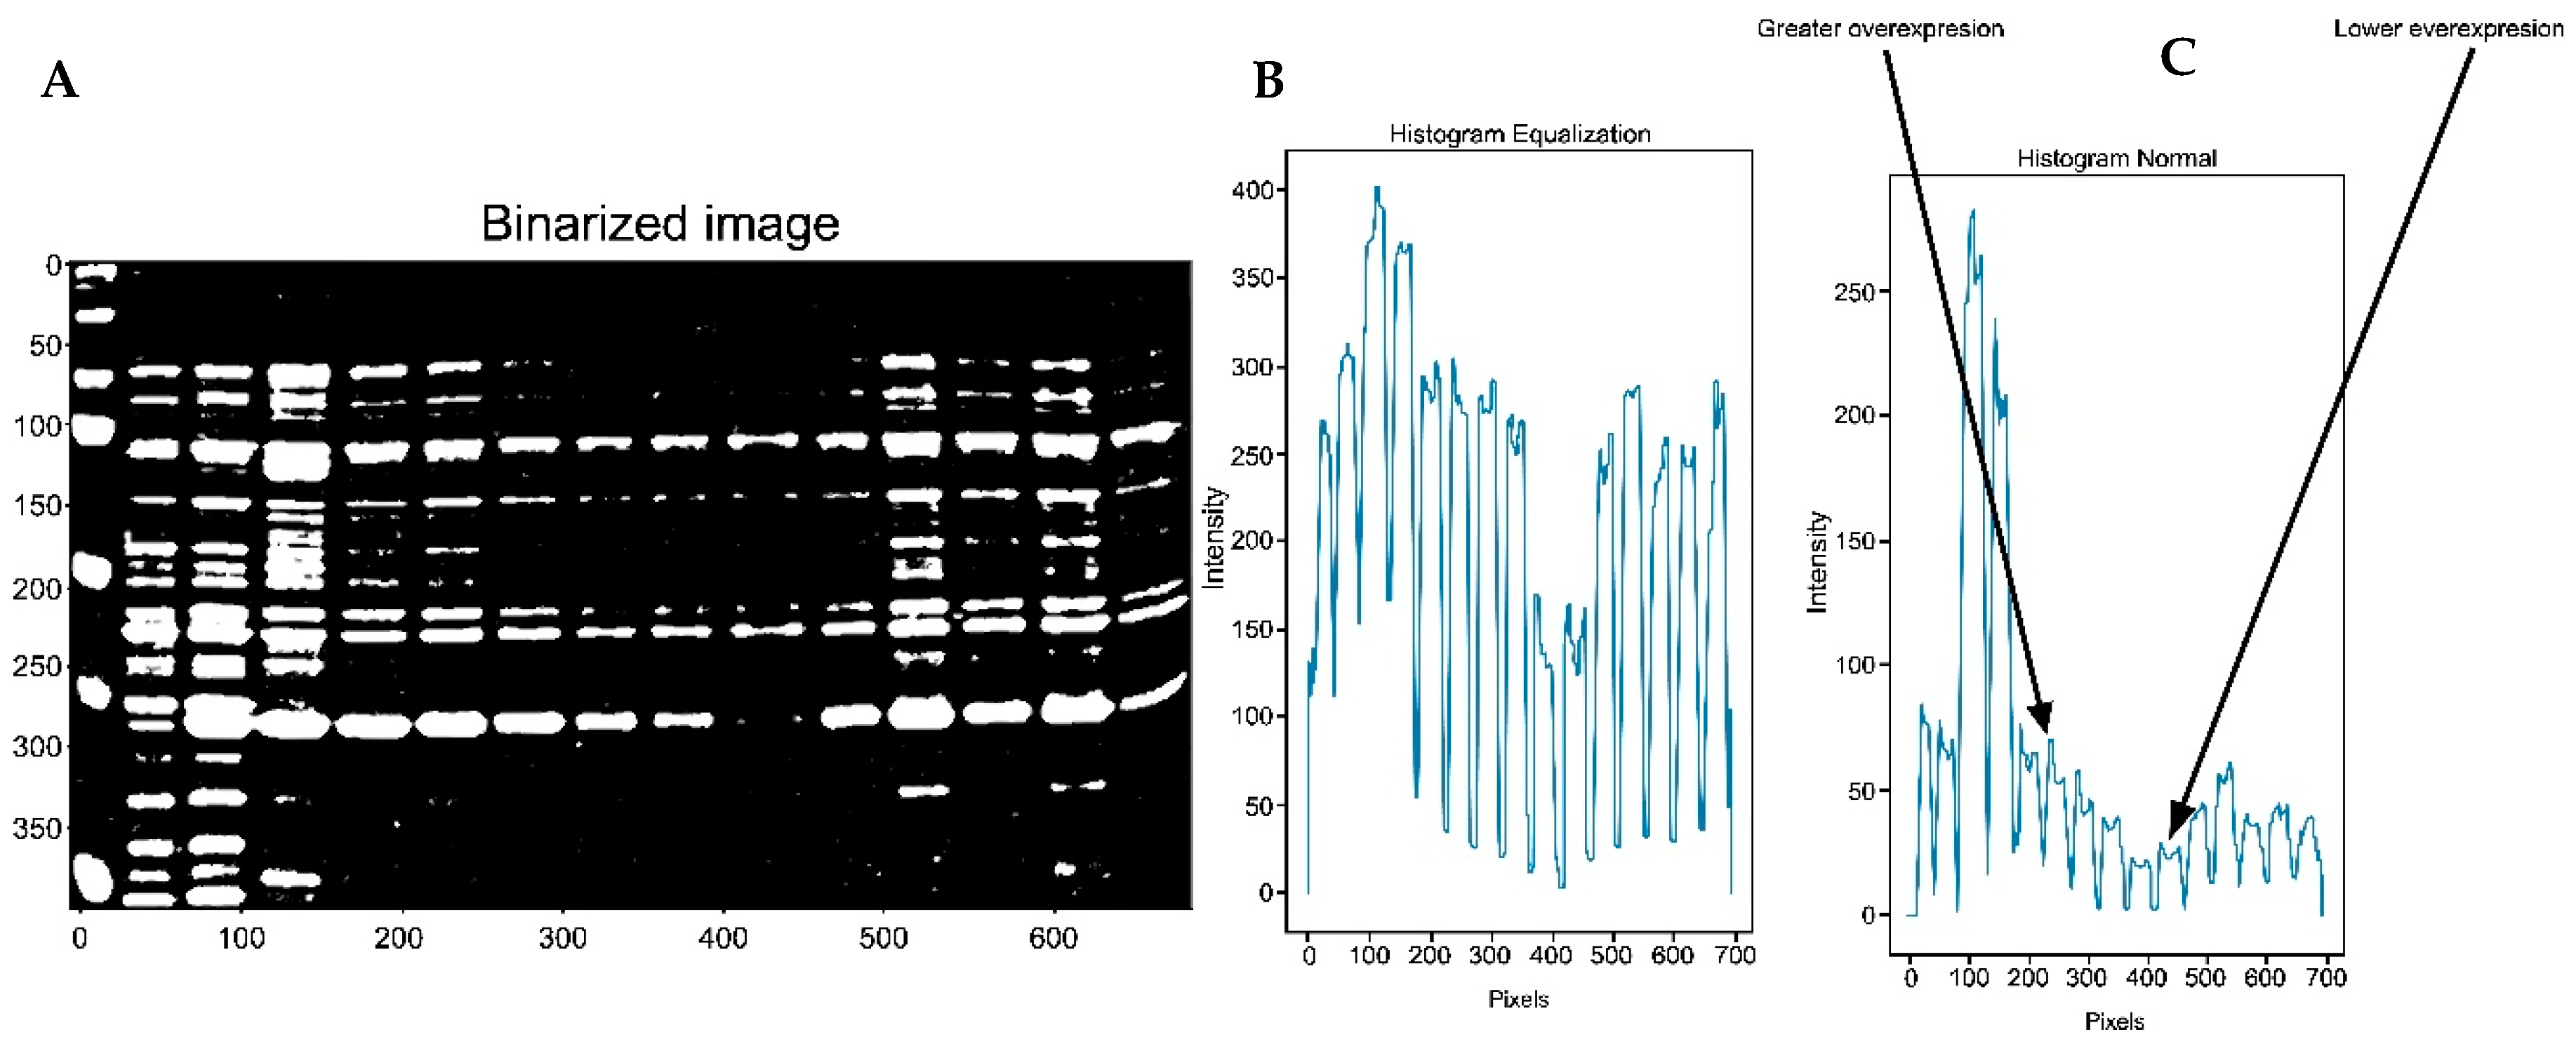
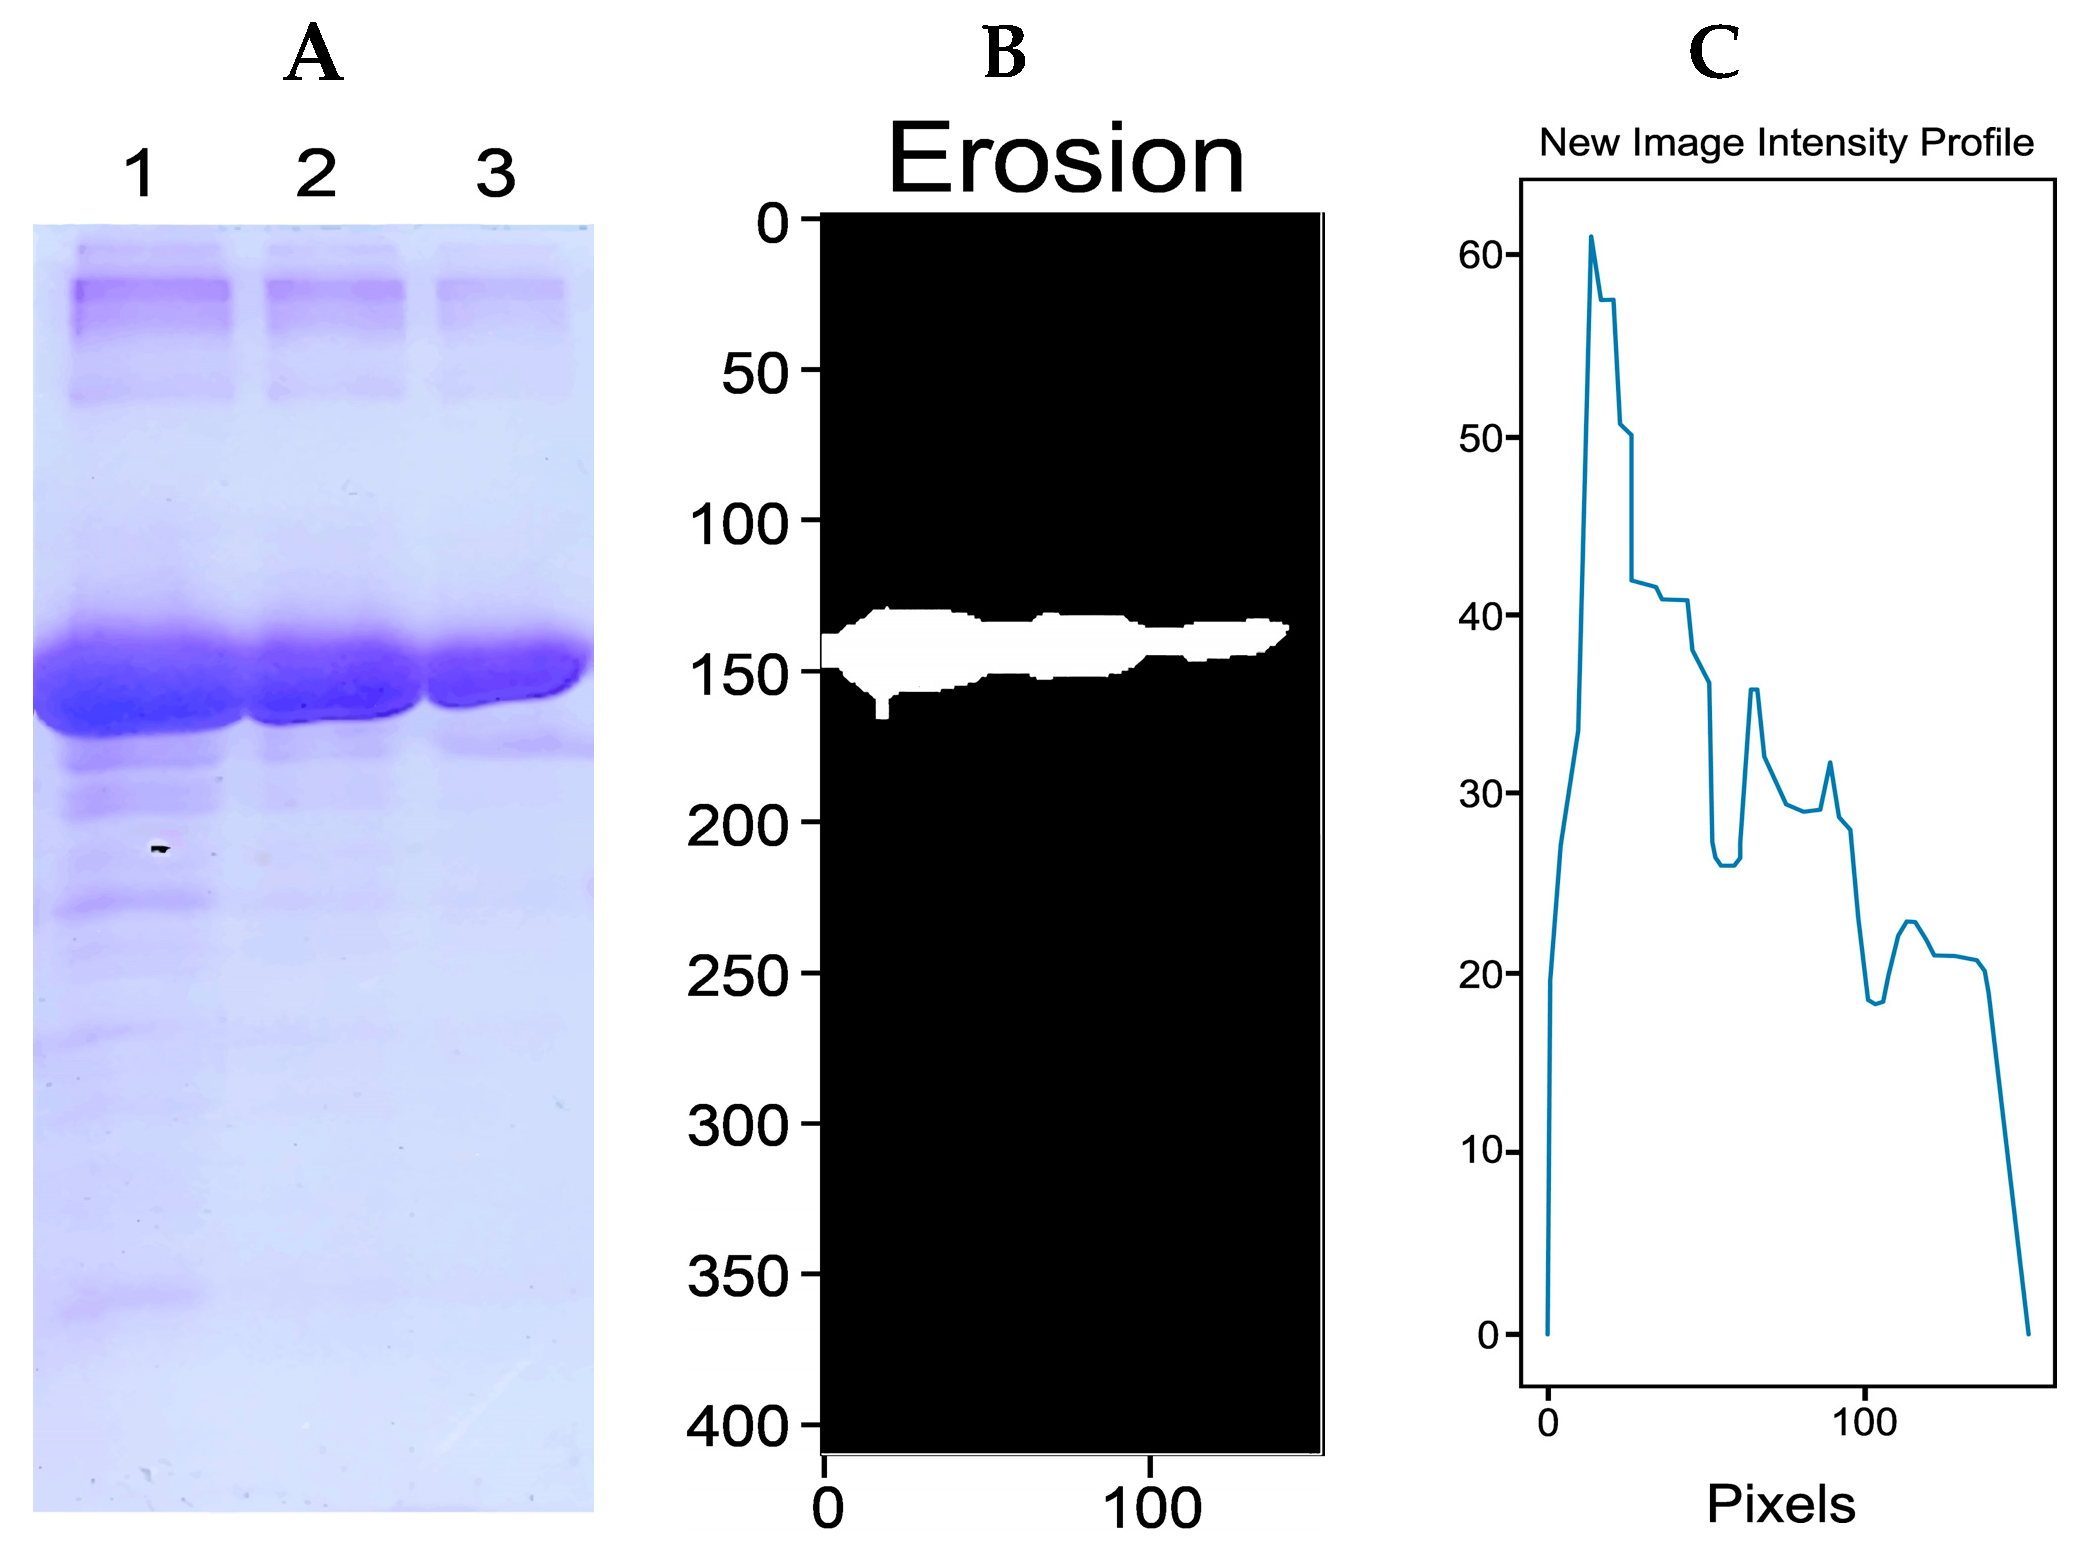
2.3. Preprocessing and Feature Extraction

Preprocessing and feature extraction were carried out through the identification of the number of white pixels by an image segmentation histogram using a binary mask (profile-based image segmentation, algorithm showed in Figure 3) as follows:
Size adjustment: The SDS-PAGE images obtained from the Gel Doc XR+ photo documenter system, were resized to images of 600 by 400 pixels size. Image equalization was performed if the samples in the gels had a high protein concentration. Subsequently, all images were binarized and dilated, as shown in Figure 3. The images were inverted after an erosion operation was applied.
Analysis of lanes and bands: A binary mask with a dimension of 1 pixel wide (MAXWIDE variable) and 400 pixels high (MAXHIGH variable) was used for the lanes. For the study of the bands present per sample, the value of 1 pixel wide for the MAXWIDE variable was used, assigning 50 pixels for the MAXHIGH variable of the binary mask. The mask was displaced pixel by pixel across the entire image width, that is, 600 data (one for each pixel for lanes) or 400 data (one for each pixel for bands).
Application of the binary mask: The histogram of the image region delimited by the binary mask was calculated. Since the bands in this process are white, the value corresponding to the number of white pixels in the histogram of the binarized image (position 255 of the histogram) was used and stored in an array. The array data were plotted and called the “new image profile”.
Interpretation of the “new image profile”: For the analysis of the full SDS-PAGE image, the multiple minimum values present in the new image profile are related to the separation between every lane of the gel image. In this region, the number of white pixel values in the array obtained decreases, which helps find the number of lanes in the image. On the other hand, when the analysis was performed for each lane, the multiple maximum values of the new profile of the image were related to the position of the proteins, as they are represented in white. Places of maximum intensity represent the presence of proteins, and places of lower intensity represent the absence of proteins (between two protein separations, the average was calculated to obtain a single maximum), as shown in Figure 3.
This procedure uses several parameters. Nonetheless, more of them are set in the program and worked well for most of the experiments carried out in this research. The value of the structuring element for erosion and dilation was 25 for lanes and 3 for bands, which allowed the detection of the total number of samples and bands per protein per sample present in an SDS-PAGE gel. The threshold values for the segmentation operation were calculated using the OTSU method. The program was developed in Python with the Pytorch framework, OpenCV to evaluate the images and histograms, and numpy with matplotlib to calculate the graphs.
Figure 3 presents an overall summary of the preprocessing and feature extraction. The pseudocode is shown in Algorithm 1.
Algorithm 1. Pseudocode to find the number of lanes and bands in the polyacrylamide gel image.
Algorithm for band and lane detection
1:Resize the image to 600 × 400 px for light processing
2:if Excess_of_protein:
3:  Histogram equalization
4:end if
5:Obtain a binarized Image
6:Image dilation
7:Image invert
8:Image erosion
9:Column = 1
10:If Lane detection:
11:  MAXWIDE = 400 px
12:else:    # band detection
13:   MAXWIDE = 50 px
14:end else
15:end if
16:Apply Binary Mask on the resized image
17:Initialize Array to zero
18:while Column ‹=  MAXWIDE:
19:  Get the Histogram_of_image
20:  Otsu_Segmentation_Applied_to_Binary_Mask_Size_zone
21:  Get the number of white pixels in the Histogram of the segmented region, Histogram[white_position]
# get the quantity of white color in the histogram binarized
22:  Array [Column] = Number_White_Pixels_Histogram [255]
23:  Column++
24:end while
25:Plott Array
26:if Lane_Analysis:
27:  Multiple_Minimum_correlate_Lane_Separation(Array)
28:   Multiple_Maximus_related_Band_Separation(Array)
29:
30:
else#band_analysis
Average_Multiples_Maximums_between_separations_To_Get_One_Maximum
31:end else
32:end if

3. Results and Discussion

3.1. Traditional Analysis of GPN Protein Gels at Different Concentrations

Lanes 5 to 9 of Figure 2A reveal an image of polyacrylamide gel untreated with pure recombinant GPN protein. These lanes show the protein concentration at different values (see Figure 2B). An image of polyacrylamide gel untreated with GPN protein in various concentrations is presented in Figure 4A. The thicker bands (highlighted in red) correspond to the GPN protein with higher concentration.
Images of the SDS-PAGE gels, revealed with Coomassie blue, were analyzed using the intensity profile as shown in Figure 4. The gel image in Figure 4A includes samples of GPN protein at different concentrations (lanes 2 to 11 enclosed in a red box). Preliminary analyses were performed on the image to verify whether the intensity profile plots can detect the presence of the protein and its overexpression. Figure 4B shows the intensity profile of the molecular weight control or ladder (lane 1, Figure 4A). The minimum values of the graph coincide with the position of the protein bands of lane one or the control sample, which is used to determine the molecular weight of the samples analyzed in the rest of the gel. Figure 4C shows the intensity profile of lane 4, where the minimum enclosed in a red box indicates the presence of the protein with the highest expression or concentration within the lane. Finally, Figure 4D shows the intensity profile of the region containing the GPN protein at different concentrations (graph corresponding to the proteins enclosed in the red box in Figure 4A, lanes 2 to 11). The background noise generated by the proteins in the total extract and the different concentrations of GPN in the samples can be seen. The multiple maxima in the graph cannot be related to each different expression of the GPN protein.

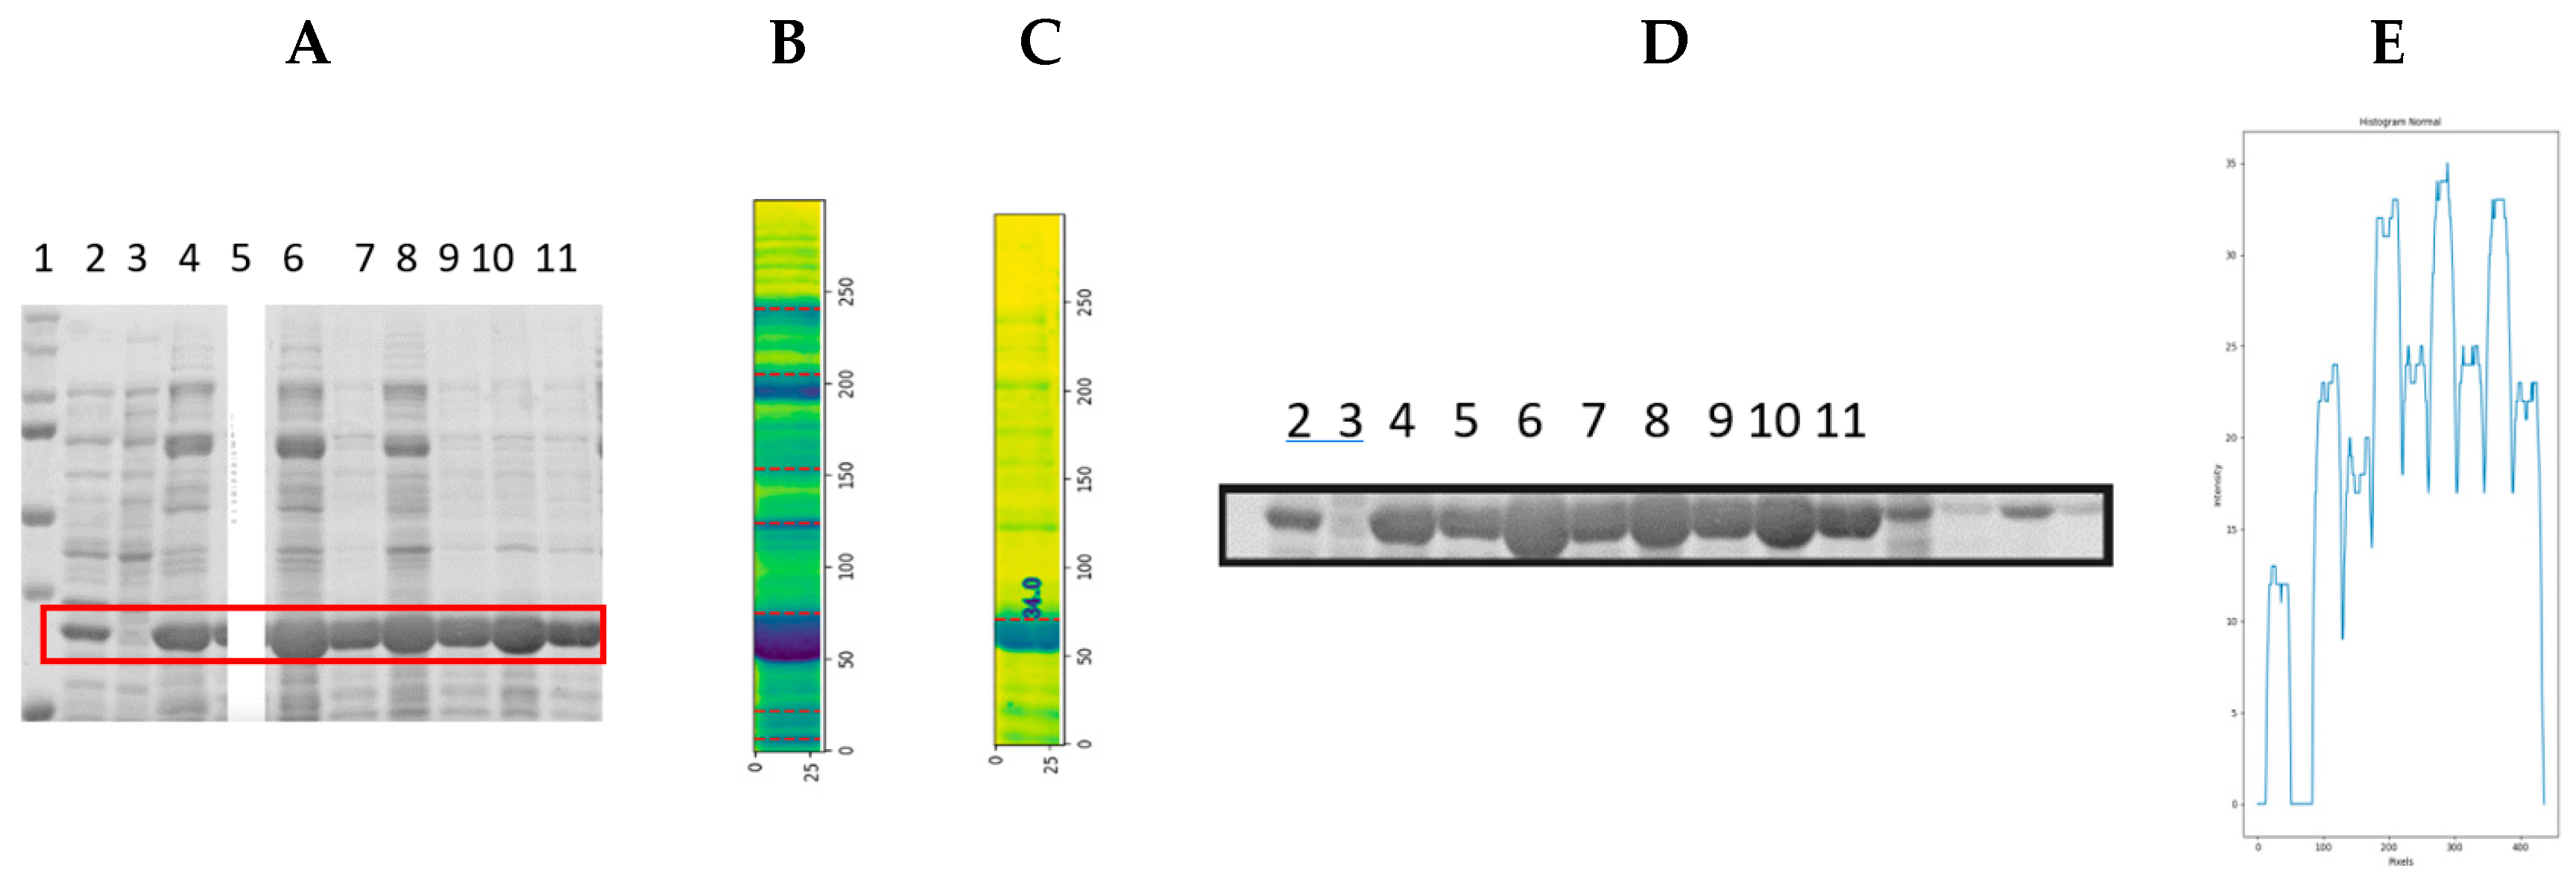
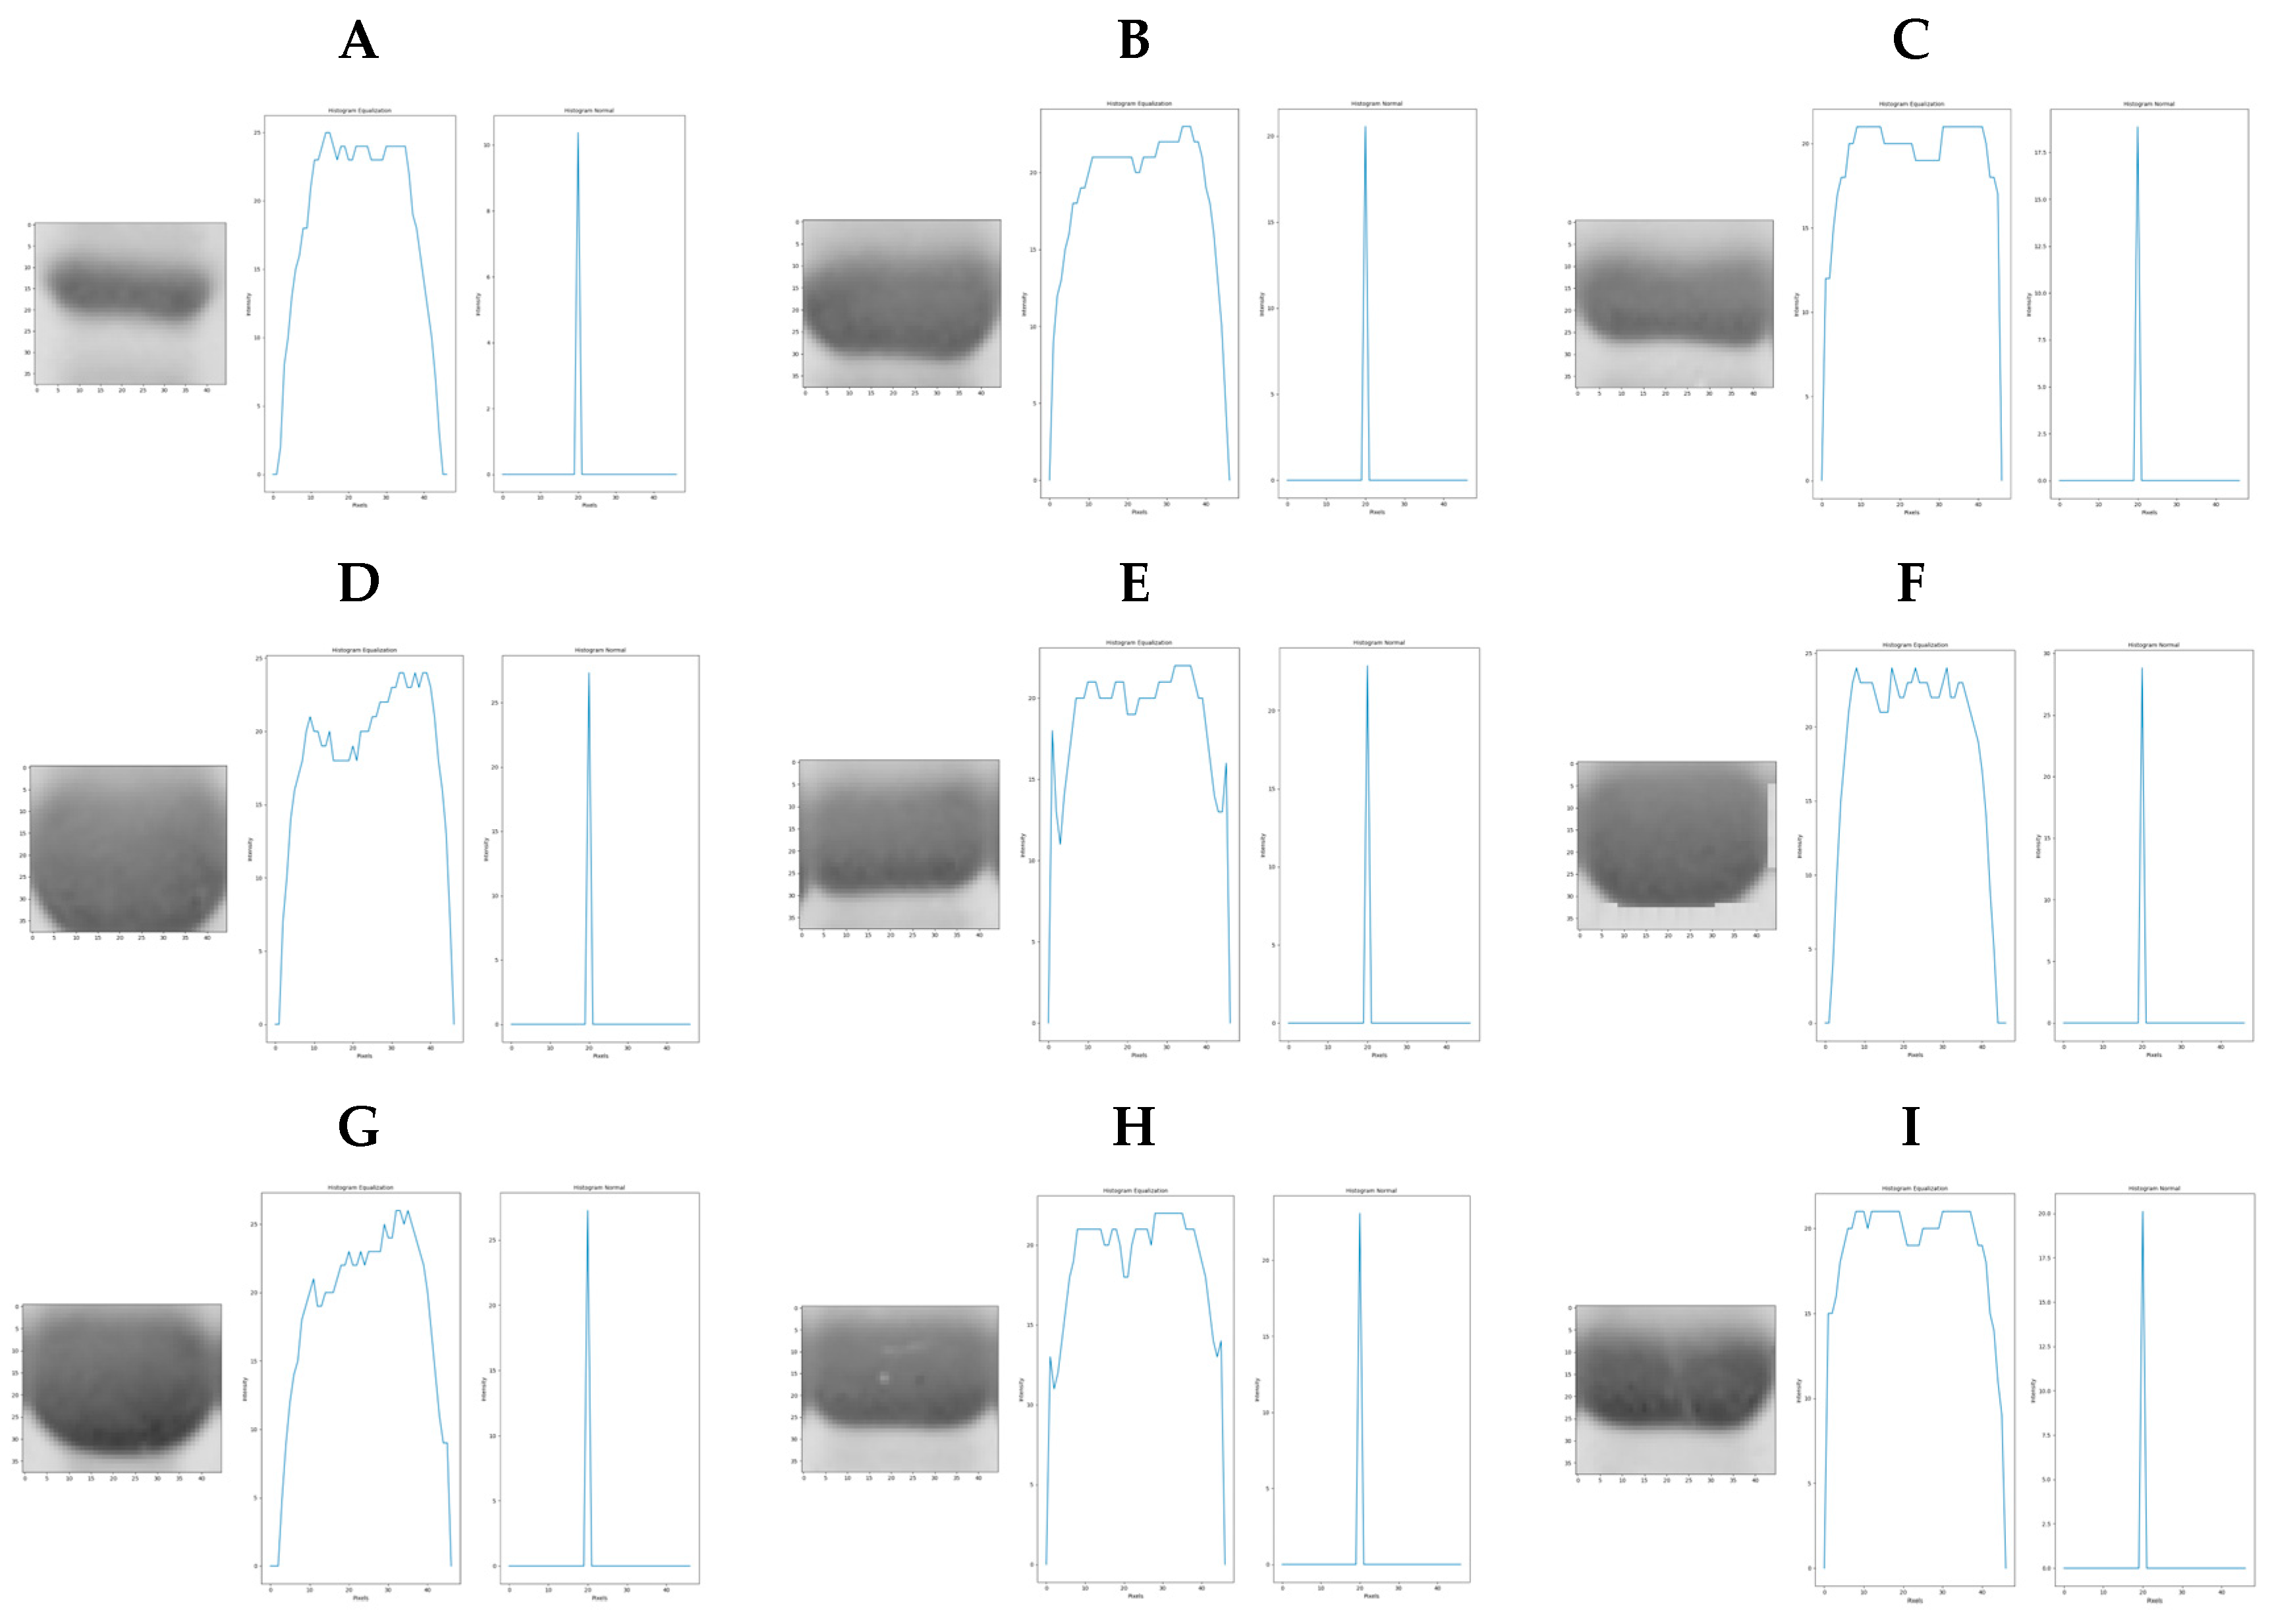
3.2. Preprocessing and Feature Extraction Using the Proposed Algorithm

Before analyzing SDS-PAGE images with the new methodology: “Image Profile Based on Binarized Image Segmentation” (IPBBIS), the images were adjusted to the size defined by the variables MAXWIDE = 600 (width in pixels), MAXHIGH = 400 (height in pixels).
The SDS-PAGE protein gel image was converted to greyscale and then binarized. In addition, an erosion operation was performed to increase the spacing between samples and bands (see Figure 5). Next, the IPBBIS method was applied to perform feature extraction.
The image from the preprocessing (Figure 5C and Figure 6) was filtered with a binary mask consisting of a matrix of 1 × 400 pixels (Figure 6B). The IPBBIS method was applied, and different binarization techniques such as Niblack, Sauvola, and Otsu were used. There were no significant variations in the obtained results.
By calculating the histogram in the lane region covered by the binary mask (MAXWIDE = 1 × MAXHIGH = 400, for complete gel analysis or MAXWIDE = 1 × MAXHIGH = 50, for band analysis), the pattern in Figure 6C was obtained, which shows the distribution of the pixels. On the other hand, by performing the binary segmentation of the same region (inside the mask), the histogram shown in the graph in Figure 6D was generated. As the image is binarized, this pattern only shows the maximum intensity values for black (pixel 0) and white (pixel 255). The number of white pixels is stored in an array with all gel values selected by the binary mask.
The array obtained by applying the binary mask in Figure 6A generated the new image intensity profile. Figure 7 shows the maxima representing the center of each analyzed band and the multiple minima separating them.

3.3. Detection of Protein Overexpression in Gels Using the IPBBIS Algorithm

3.3.1. Application of the New Intensity Profile on the Complete Gel Image

The IPBBIS method was used to identify GPN protein overexpression in the gel shown in Figure 8A. In this Figure, lane 1 contains the ladder or molecular weight control. Lane 2 is the negative control, lane 3 is the positive control for GPN protein expression, lane 4 is the concentrated cell extract control, and lanes 5 to 15 represent extracts with the same amount of endogenous proteins to which different concentrations of recombinant protein have been added. The thickness of the spots indicates a higher concentration of GPN in lanes 5, 6, 11, 12, and 14, while lanes 9 and 10 show a lower concentration of the protein. These values were identified in the plot of the new image intensity profile (Figure 8B,C), where maximum peaks are observed in lanes 5, 6, 11, 12, and 14, and lower peaks correspond to the bands with lower concentrations of recombinant protein, i.e., lower overexpression (lanes 9 and 10). Image analysis was performed by equalizing the image (Figure 8B) and not equalizing it (Figure 8C).
The data of the average values resulting from the multiple maxima of the graph corresponding to the different samples in Figure 8C are shown in Table 1. It can be corroborated that the maximum intensity value was obtained in lane 5, indicating the highest overexpression of GPN protein in that sample. The lowest expressions were recorded in lanes 9 and 10, with maximum values of 23 and 29, respectively. The maxima assigned to lanes 1 to 4 were not shown as they correspond to the ladder, controls for GPN, and GPN with total protein extract expression.

3.3.2. Application of the IPBBIS Method on a Sample with Controlled Concentrations

A controlled protein concentration was expressed to evaluate the method’s effectiveness. Figure 9A shows the gel obtained, where bandwidth (or stain) increases as the protein is concentrated. Subsequently, the image was pre-treated (binarization, dilation, color inversion, and erosion; Figure 9B) for image analysis using IPBBIS. This procedure originated the new image profile graph shown in Figure 9C, where the maximum peak corresponds to the highest concentration of BSA protein (2 mg/mL). The lowest peak is related to the lowest BSA concentration (0.5 mg/mL).

3.3.3. Effectiveness of the IPBBIS Method Using Known Concentrations

An experiment was carried out to evaluate the effectiveness of the method. GPN protein concentrations with known values (Table 2) were prepared by adding diverse cell extracts to include different proteins and increase the background noise, obtaining the samples presented in the gel image of Figure 10A by placing other concentrations in randomly chosen positions.
Samples with different concentrations of recombinant GPN protein are distributed on the polyacrylamide gel in Figure 10A.
The results of applying the IPBBIS method to the image in Figure 10A (GPN protein at different concentrations) indicated that samples with a higher protein concentration had peaks with higher intensity values (Figure 10B). However, when comparing lane 3 (which has no GPN protein concentration, Figure 10A), the graph showed that it has a higher peak or maximum compared to peaks 5, 7, 9, and 11 (which correspond to different GPN protein concentrations), indicating a higher overexpression of the protein. This fact does not agree with the prepared concentrations, with lane 3 having a concentration of 0.0 mg/mL, lane 5 of 9.5 mg/mL, lane 7 of 18 mg/mL, lane 9 of 18.5 mg/mL, and lane 11 of 14 mg/mL (see Table 2).
This inconsistency in the results is because lane 3 had more proteins in the total extract than in samples 5, 7, 9, and 11. This behavior corroborated that the IPBBSI method can only calculate the overexpression of the proteins of interest when the background noise decreases, i.e., only when there is the same amount of proteins in the total extract can the level of overexpression of the protein of interest be detected. Proteins that are not of interest, those on the top and bottom of the recombinant protein (GPN), can be considered contaminants and should, therefore, be removed.

3.3.4. Elimination of Impurities through the Determination of the Molecular Weight of the Target Protein

A procedure is proposed to eliminate contaminants. To this end, it is necessary to find the molecular weight of the protein of interest (GPN) and separate it from the rest of the proteins present in the same sample to apply the IPBBIS method and find its level of overexpression.
Considering that the molecular weight control does not present background noise, the ladder or control in Figure 10A (lane 1) was selected, separated from the rest of the gel, changed to a horizontal orientation (see Figure 11A), and the IPBBIS method was applied, which provided the graph shown in Figure 11B. The multiple maxima represent each protein position in the ladder (Figure 11C).
A relationship was established between the molecular weights of the ladder or control (provided by the manufacturer, Bio-Rad S.A. Mexico D.F.) and the multiple maxima obtained by the IPBBIS method. Due to the absence of background noise, the positions of the control proteins were automatically detected and marked with blue lines for identification, as shown in the gel image of Figure 11C. At the same time, the data were stored in an array. The stored data represent the positions of the control proteins and the values of their molecular weights. They were processed by applying numerical methods of linear interpolation, nearest interpolation, and cubic interpolation to obtain an equation. This equation was used to know and predict the molecular weight of proteins present in any position of the remaining samples of the gel image to be analyzed (see Figure 12 and Table 3). Figure 12 shows the interpolation methods used to predict the molecular weight of the detected proteins. The X-axis corresponds to the pixel positions of the bands, while the Y-axis represents the molecular weights.
The results obtained in Table 3 indicate that the linear interpolation method showed the lowest error, with a value of 3.35%, when correlating the actual weight of the GPN protein (34.56 kilodaltons, kDa) with that predicted by the interpolation method used.
Therefore, the formula used to identify the molecular weight of the proteins detected in the rest of the samples corresponds to the linear interpolation method and is defined by Equation (1):
y x = y i + y i + 1 y i x x i x i + 1 x i
where 0 ≤ xi ≤ 400 corresponds to the interval containing the number of pixels corresponding to the image height of each sample, and 0 ≤ yi ≤ 250 corresponds to the molecular weight of the proteins.

3.3.5. Choice of Threshold for the Elimination of Multiple Maximums

IPBBIS automatically detected the number of samples present in a gel image. The multiple minimum values between the various maxima indicated the number of samples in the polyacrylamide gel. Sometimes, when matching these values, marked by blue dotted vertical lines, it was impossible to detect the number of samples in the gel image (see Figure 13A). The amount of contaminating proteins caused the excess background noise in the samples. We chose a threshold containing the minimum values for this case to eliminate the background noise. In this way, we allowed the elimination of the multiple maxima detected in the graph obtained by the new image intensity profile. These multiple maxima were removed with a low-pass filter (represented by the black line in Figure 13B) applied to the latest image intensity profile, and a new graph was obtained in which the minima corresponded perfectly to the existing separations with every sample present in the gel image (Figure 13C). This method allowed us to automatically select the regions with the tiniest white pixels and link them to the regions where the samples are separated. As a result, the experiments present in the gel were automatically detected and identified with blue dotted vertical lines that perfectly matched the sample separations in the image (Figure 13D). They were identified with blue lines drawn on the gel image to verify their correspondence with the different samples. The data were stored in an array to determine the position of each of the samples in subsequent analyses.

3.3.6. Analysis of the Region of Interest Using the IPBBIS Methods, Manual Area Calculation, Area Calculation by K-Means Segmentation, and Area Calculation by Otsu Segmentation

A random sample was selected on the gel to repeat the molecular weight detection process (lane 5, Figure 14A). The developed IPBBIS method was applied to detect the bands present per sample, as indicated in Figure 14B; knowing the molecular weight of the GPN protein, approximately 34 KDa, the interpolation method was applied to detect it automatically within the gel, and it was identified as indicated in Figure 14C.
Once the positions separating the samples in the gel were detected (Figure 14B), the molecular weight of the GPN protein and its place within the gel (Figure 14C) were identified, then the region of interest (ROI) that included the expression of the recombinant protein at different concentrations from all samples (red box in Figure 14A including lanes 2 to 11) was selected and isolated as shown in Figure 14D. Analysis was then performed to compare protein overexpression and to identify whether image profiling based on binarized image segmentation can detect proteins with higher or lower overexpression. Before this, the image color in Figure 14D was changed from RGB to HSV. The result is shown in Figure 14E, where the height of the peaks is related to the level of overexpression of the protein analyzed. Every sample with protein contained in the region of interest (ROI) in Figure 14D (lanes 2, 4, 5, 6, 6, 7, 8, 9, 10, and 11) was isolated to obtain a higher precision in the analysis. IPBBIS was applied separately to obtain one graph per sample, as shown in Figure 15. The average of the multiple maxima obtained was calculated to produce a single maximum value per sample (Figure 15A–I), which was related to the amount of protein concentrated in each of the different samples analyzed; these values were aggregated in Table 4 for future reference (row ROI-GPN Table 4). Image profiling based on binarized image segmentation was applied to each of the nine samples containing GPN protein at different concentrations in the ROI region of interest gel in Figure 14D. As shown in the Table 4, we obtained additional data by analyzing the different samples at different concentrations of recombinant GPN protein distributed on the polyacrylamide gel in Figure 14D.
The array data obtained (ROI-GPN row in Table 4) revealed that the lane 2 sample (with a maximum value of 10.38 and a concentration of 2 mg/mL) shows the lowest overexpression, followed in order of overexpression by lane 5 (18.67, 9.5 mg/mL), lane 11 (20.11, 14 mg/mL), lane 4 (20.55, 14.5 mg/mL), lane 7 (22.87, 18 mg/mL), lane 9 (23.08, 18.5 mg/mL), lane 10 (27.26, 26 mg/mL), lane 6 (27.34, 27 mg/mL), and lane 8 (28.82, 30 mg/mL). These results show that the array data obtained for the new image profile calculated by the IPBBIS method for each sample are related to the concentration of each protein and can be used to calculate the level of GPN overexpression by comparing every sample present in the gel image.

3.3.7. IPBBIS Study on the Image Dataset Using the Confusion Matrix

After verifying that the IPBBIS method can automatically identify the level of overexpression in each sample, the polyacrylamide gel image dataset was divided into homogeneous and heterogeneous gels to test their efficiency.
The so-called homogeneous gels (dataset of 44 gels with a total of 669 samples) showed similar characteristics, such as the same color and quality, and no imperfections, such as breaks or distortions due to incorrect preparation. In this research, a confusion matrix defines true positives (TP) as cases where IPBBIS correctly detected the lane or protein band. False negatives (FN) occurred when the lane existed but was not found, false positives (FP) when the lane did not exist but was detected, and true negatives (TN) when the lane did not exist and was also not detected. The confusion matrix obtained after analyzing the 669 samples is presented in Table 5. The precision obtained was 0.985052 (see Table 6, the precision of homogeneous gels).
Then, the analysis was repeated using the IPBBIS method on the heterogeneous gels, a total of 90 gels with different conditions, which included distorted (smiley face effect), broken, or incorrectly stained gels. In total, 1561 samples were analyzed for GPN protein overexpression. The accuracy of this analysis was measured using the same confusion matrix with the TP, FN, TN, and FP values defined above for the homogeneous gels. The confusion matrix is shown in Table 7, and the precision obtained was 0.91736 (see Table 6, the precision of heterogeneous gels). This precision was lower than that obtained with homogeneous gels since the SDS-PAGE gels analyzed present characteristics that make them different, such as breaks, distortions due to incorrect preparation, or insufficient Coomassie blue staining.

3.3.8. Functionality of the Methods Analyzed to Find GPN Protein Overexpression: IPBBIS, Manual Area Calculation, Area Calculation by K-Means Segmentation, and Area Calculation by Otsu Segmentation

To calculate protein overexpression, the areas of each of the GPN protein bands expressed at different concentrations in Figure 14D were measured manually by outlining the contour of the band and using the K-means segmentation and Otsu segmentation techniques (see Figure 16) and then compared with the measurement performed by the IPBBIS method.
For the manual measurements, K-means segmentation and Otsu segmentation, it was necessary to cut out each of the bands and separate them from the gel image as neither of these methods can analyze the whole gel. The results of the measurements of each of the bands at different concentrations are aggregated in Table 4, indicating the type of methodology used in the row.
The data in Table 4 were normalized to verify the functionality of the methodologies used to assess protein overexpression within the gel in the different samples (Figure 14D). The data in Table 4, corresponding to the intensity values in Figure 14D, were sorted according to the amount of expressed protein from lowest to highest overexpression and placed in Table 8, normalized (see Table 9), and used to measure the correct level of GPN protein overexpression for each of the methods used by the following operation:
Let xn be the n-th value of the measured area, and xm be the value of the measured area in the band with the highest protein concentration.
If xm > xn ⇒ xm − xn > 0. This expression indicates that the measurement of the overexpression level is correct since positive values are expected if the concentration is increasing. On the other hand, if xm < xn ⇒ xm − xn < 0, it indicates that the overexpression level was miscalculated. The analyzed method presents errors in its measurement because the protein concentration is increasing and not decreasing.
As seen in Table 10, the results of the above analysis, applied to each of the measurements, indicate that the proposed image profiling method based on binarized image segmentation (ROI-GPN) does not show any negative values. In contrast, the manual method shows two negative values (lanes 4 and 8 in Table 10), the K-means segmentation shows two negative values (lanes 4 and 8 in Table 10), and the Otsu segmentation shows two negative values (lanes 8 and 9 in Table 10).
These results demonstrate that the developed IPBBIS profiling allows for discovering overexpression and correctly identifying the level of overexpression related to GPN protein concentration. On the other hand, the manual methods, K-means segmentation and Otsu segmentation, presented errors in the measurements.
In addition, the IPBBIS method can analyze the ROI region without cutting out each of the samples present in the gel. In contrast, manual techniques, like K-means segmentation and Otsu segmentation, require the samples to be separated, as they cannot analyze the whole gel.
The ROI-GPN has values of the array data with the number of white pixels analyzed by binary mask. The other methods have values in pixel areas, and normalization was performed to realize a comparison. The normalization was made by taking the maximum value measured by each method when applying four methods to identify the overexpression manually (since there is no automatic one) and dividing it by each of the values of its respective method. Thus, the maximum value for all samples is unity. When sorted by the designed concentration value (lowest to highest), the normalized values increase and do not decrease, as did all the previous methods except for the IPBBIS method developed in this work. The increase only occurs if the methods correctly calculate the size of the bands (by area or by intensity).
These results indicate that traditional methods can identify the position of proteins. However, they cannot identify a particular protein band nor determine the concentration or molecular weight, and the rest of the new intensity profile plot cannot be related to any of the proteins present in the same sample. The IPBBIS method identified the most minor and most overexpressed GPN protein and even detected the order of overexpression.
These results indicate that the IPBBIS method can be used to identify GPN protein overexpression related to IDC and ILC Her2+ breast cancer and can also be applied to identify overexpression of other proteins of biological interest and to detect the progression of cancer stages in different samples from the same patient.
In summary, the IPBBIS method applies a binary mask pixel by pixel, choosing the white intensity value and storing it in an array. The array contains multiple maxima and multiple minima. The intensity value of the minima is related to the separation of the number of samples when analyzing a full gel. As the number of targets decreases, this indicates the separation between proteins. When analyzing per sample for proteins in SDS-PAGE gels, the new image profile values of the multiple minima quantify the level of overexpression of proteins present per sample.
Current methods for searching for proteins in SDS-PAGE gels perform image profiling, processing techniques, threshold, and brightness changes but require the analyst to select the region of interest. The IPBBIS method automatically identifies the number of samples in the gel and the amount of proteins in a sample. It also detects the level of overexpression based on molecular weight.

4. Conclusions

A new methodology called IPBBIS was developed to identify the number of samples present in an SDS-PAGE gel and the molecular weight of the recombinant protein of interest, with a margin of error of 3.35%. An accuracy of 0.985052 was obtained when the gels analyzed were homogeneous, i.e., free of errors such as smiley face distortion, breaks, or poor staining. For gels with such errors, the accuracy was 0.91736.
The IPBBIS method enables the identification of the target protein in the gel by its molecular weight, allowing confirmation of overexpression levels. In contrast to manual area calculation, K-means segmentation, and Otsu segmentation, the IPBBIS approach demonstrated the capability to detect overexpression across the entire gel, eliminating the need to isolate specific areas as other methods require.
Thus, image profiling based on binarized image segmentation can be an auxiliary tool to detect protein overexpression at a lower cost than other molecular techniques, helping to ascertain whether cancer treatment is working.
  • Future Work
It is hoped that the IPBBIS method will be applied to identify any overexpression of proteins present in polyacrylamide gels.
In future work, we would like to apply this methodology to detect separations in close objects, such as a cell cluster or tissue images, and identify cellular overexpression.
Since the IPBBIS method allows the calculation of the gaps between protein bands in a polyacrylamide gel, its application is sought in imaging samples with cells corresponding to different stages of cancer. Since the cells increase in number during each phase, the spaces between them decrease.

Author Contributions

Conceptualization, J.J.-L. and L.A.-R.; methodology and software and polyacrylamide gel preparation, M.G.-V. and J.J.-L.; validation and formal analysis, R.D.-H.; investigation, A.S.-S.; writing—original, J.J.-L. and A.S.-S.; draft preparation A.S.-S.; writing—review and editing, L.A.-R., R.D.-H. and A.S.-S.; supervision, L.A.-R. All authors have read and agreed to the published version of the manuscript.

Funding

This research received no external funding.

Data Availability Statement

Data are contained within the article.

Conflicts of Interest

The authors declare no conflicts of interest.

References

  1. Kaabouch, N.; Schultz, R.R.; Milavetz, B. An analysis system for DNA Gel Electrophoresis images based on automatic thresholding and enhancement. In Proceedings of the 2007 IEEE International Conference on Electro/Information Technology, Chicago, IL, USA, 17–20 May 2007; pp. 1–6. [Google Scholar]
  2. Ferrari, M.; Cremonesi, L.; Carrera, P.; Bonini, P. Diagnosis of genetic disease by DNA technology. Pure Appl. Chem. 1991, 63, 1089–1096. [Google Scholar] [CrossRef]
  3. Goez, M.M.; Torres-Madroñero, M.C.; Röthlisberger, S.; Delgado-Trejo, E. Preprocessing of 2-Dimensional Gel Electrophoresis Images Applied to Proteomic Analysis: A Review. Genom. Proteom. Bioinform. 2018, 16, 63–72. [Google Scholar] [CrossRef] [PubMed]
  4. Intarapanich, A.; Kaewkamnerd, S.; Shaw, P.J.; Ukosakit, K.; Tragoonrung, S.; Tongsima, S. Automatic DNA diagnosis for 1D Gel Electrophoresis Images using Bio-image Processing Technique. BMC Genom. 2015, 16, S15. [Google Scholar] [CrossRef] [PubMed]
  5. Jian-Derr, L.; Chung-Hsien, H.; Neng-Wei, W.; Chen-Song, L. Automatic DNA sequencing for electrophoresis gels using image processing algorithms. J. Biomed. Sci. Eng. 2011, 4, 523–528. [Google Scholar]
  6. Taher, R.S.; Jamil, N.; Nordin, S.; Bahari, U.M. A new false peak elimination method for poor DNA gel images analysis. In Proceedings of the 2014 14th International Conference on Intelligent Systems Design and Applications, Okinawa, Japan, 28–30 November 2014; pp. 180–186. [Google Scholar]
  7. Koprowski, R.; Wróbel, Z.; Korzynska, A.; Chwialkowska, K.; Kwasniewski, M. Automatic analysis of 2D polyacrylamide gels in the diagnosis of DNA polymorphisms. Biomed. Eng. 2013, 12, 68. [Google Scholar] [CrossRef] [PubMed]
  8. Cai, F.; Liu, S.; Dijke, P.T.; Verbeek, F.J. Image analysis and pattern extraction of proteins classes from one-dimensional gels electrophoresis. Int. J. Biosci. Biochem. Bioinform. 2017, 7, 201–212. [Google Scholar] [CrossRef]
  9. Ahmed, N.E. EgyGene GelAnalyzer4: A powerful image analysis software for one-dimensional gel electrophoresis. J. Genet. Eng. Biotechnol. 2021, 19, 18. [Google Scholar] [CrossRef]
  10. Alnamoly, M.H.; Alzohairy, A.M.; Mahmoud, I.; El-Henawy, I.M. EGBIOIMAGE: A software tool for gel images analysis and hierarchical clustering. IEEE Access 2019, 8, 10768–10781. [Google Scholar] [CrossRef]
  11. Juárez, J.; Guevara-Villa, M.; Sánchez-Sánchez, A.; Díaz-Hernández, R.; Altamirano-Robles, L. Tridimensional structure prediction and purification of human protein GPN2 to high concentrations by nickel affinity chromatography in presence of amino acids for improving impurities elimination. In Transactions on Computational Science & Computational Intelligence; Springer Nature: Cham, Switzerland, 2021. [Google Scholar]
  12. Abadi, M.F. Processing of DNA and Protein Electrophoresis Gels by Image Processing. Sci. J. 2015, 36, 3486–3494. [Google Scholar]
  13. Abeykoon, A.; Dhanapala, M.; Yapa, R.; Sooriyapathirana, S. An automated system for analyzing agarose and polyacrylamide gel images. Ceylon J. Sci. 2015, 44, 45–54. [Google Scholar] [CrossRef]
  14. Bajla, I.; Holländer, I.; Fluch, S.; Burg, K.; Kollár, M. An alternative method for electrophoresis gel image analysis in the GelMaster software. Comput. Methods Programs Biomed. 2005, 77, 209–231. [Google Scholar] [CrossRef] [PubMed]
  15. Brauner, J.M.; Groemer, T.W.; Stroebel, A.; Grosse-Holz, S.; Oberstein, T.; Wiltfeang, J.; Maler, J.M. Spot quantification in two-dimensional gel electrophoresis image analysis: Comparison of different approaches and presentation of a novel compound fitting algorithm. Bioinformatics 2014, 15, 181. [Google Scholar] [CrossRef] [PubMed]
  16. Efrat, A.; Hoffmann, F.; Kriegel, K.; Schultz, C.; Wenk, C. Geometric algorithms for the analysis of 2D-Electrophoresis gels. J. Comput. Biol. 2002, 9, 299–315. [Google Scholar] [CrossRef]
  17. Faisal, M.; Vasiljevic, T.; Donkor, O.N. A review on methodologies for extraction, identification and quantification of allergenic proteins in prawns. Food Res. Int. 2019, 121, 307–318. [Google Scholar] [CrossRef]
  18. Fernández-Lozano, C.; Seoane, J.A.; Gestal, M.; Gaunt, T.R.; Dorado, J.; Pazos, A.; Campbell, C. Texture analysis in gel electrophoresis images using an integrative kernel-based approach. Sci. Rep. 2016, 6, 19256. [Google Scholar] [CrossRef] [PubMed]
  19. Kaur, N.; Sharma, P.; Jaimni, S.; Kehinde, B.A.; Kaur, S. Recent developments in purification techniques and industrial applications for whey valorization: A review. Chem. Eng. Commun. 2019, 207, 123–138. [Google Scholar] [CrossRef]
  20. Labyed, N.; Kaabouch, N.; Schultz, R.R.; Singh, B.B. Automatic segmentation and band detection of protein images based on the standard deviation profile and its derivative. In Proceedings of the 2007 IEEE International Conference on Electro/Information Technology, Chicago, IL, USA, 17–20 May 2007; pp. 577–582. [Google Scholar]
  21. Ramaswamy, G.; Wu, B.; MacEvilly, U. Knowledge management of 1D SDS PAGE Gel protein image information. J. Digit. Inf. Manag. 2010, 8, 223–232. [Google Scholar]
  22. Rezaei, M.; Amiri, M.; Mohajery, P. A new algorithm for lane detection and tracking on pulsed field gel electrophoresis images. Chemom. Intell. Lab. Syst. 2016, 157, 1–6. [Google Scholar] [CrossRef]
  23. Viswanathan, S.; Ünlü, M.; Minden, J. Two-dimensional difference gel electrophoresis. Nat. Protoc. 2006, 1, 1351–1358. [Google Scholar] [CrossRef]
  24. Heras, J.; Domínguez, C.; Mata, E.; Pascual, V.; Lozano, C.; Torres, C.; Zarazaga, M. GelJ—A tool for analyzing DNA fingerprint gel images. BMC Bioinform. 2015, 16, 270. [Google Scholar] [CrossRef]
  25. Alawdi, R.M.; Amer RB, M.; Alzohairy, A.M.; Khedr, W.M. The Computational Techniques Developed to Analyze DNA Gel Images. Int. J. Adv. Eng. Res. Sci. 2016, 3, 139–149. [Google Scholar]
  26. Heras, J.; Domínguez, C.; Mata, E.; Pascual, V.; Lozano, C.; Torres, C.; Zarazaga, M. A survey of tools for analysing DNA fingerprints. Brief. Bioinform. 2015, 17, 903–911. [Google Scholar] [CrossRef] [PubMed]
  27. Pavel, A.B.; Vasile, C.I. PyElph-a software tool for gel images analysis and phylogenetics. BMC Bioinform. 2012, 13, 9. [Google Scholar] [CrossRef] [PubMed]
  28. Khakabimamaghani, S.; Najafi, A.; Ranjbar, R.; Raam, M. GelClust: A software tool for gel electrophoresis images analysis and dendrogram generation. Comput. Methods Programs Biomed. 2013, 111, 512–518. [Google Scholar] [CrossRef] [PubMed]
  29. Alnamoly, M.H.; Alzohairy, A.M.; El-Henawy, I.M. A survey on gel image analysis software tools. J. Intell. Syst. Internet Things 2020, 1, 40–47. [Google Scholar]
  30. Juárez-Lucero, J.; Guevara-Villa, M.G.; Sánchez-Sánchez, A.; Díaz-Hernández, R.; Altamirano-Robles, L. Development of a Methodology to Adapt an Equilibrium Buffer/Wash Applied to the Purification of hGPN2 Protein Expressed in Escherichia coli Using an IMAC Immobilized Metal Affinity Chromatography System. Separations 2022, 9, 164. [Google Scholar] [CrossRef]
  31. Lara-Chacón, B.; Guerrero-Rodríguez, S.L.; Ramírez-Hernández, K.J.; Robledo-Rivera, A.Y.; Velazquez MA, V.; Sánchez-Olea, R.; Calera, M.R. Gpn3 is essential for cell proliferation of breast cancer cells independent of their malignancy degree. Technol. Cancer Res. Treat. 2019, 18. [Google Scholar] [CrossRef]
  32. Juárez, J.; Guevara-Villa MD, R.; Sánchez, A.; Díaz, R.; Altamirano, L. Image Segmentation Applied to Line Separation and Determination of GPN2 Protein Overexpression for Its Detection in Polyacrylamide Gels. In Progress in Artificial Intelligence and Pattern Recognition; Lecture Notes in Computer Science; Springer: Cham, Switzerland, 2021; pp. 303–315. [Google Scholar]
Figure 1. Image of a polyacrylamide protein gel. The vertical columns or lanes represent different experiments placed within the gel (numbered 1 to 15). The horizontal lines or bands represent the proteins identified per column.
Algorithms 17 00149 g001
Figure 2. (A) Purification of recombinant GPN protein from Escherichia coli bacteria. Lane 1: Molecular weight control. Lane 2: Positive control of GPN protein expression. Lane 3: Negative expression control. Lane 4: Total protein extract. Lanes 5–9: purified GPN protein. (B) Different concentrations of purified GPN protein. (C) Different concentrations of BSA protein.
Algorithms 17 00149 g002
Figure 3. Preprocessing and feature extraction to analyze the complete gel image.
Algorithms 17 00149 g003
Figure 4. (A) SDS-PAGE gel containing GPN protein expressed at different concentrations. Lane 1, molecular weight control; lanes 2–11, GPN at the following concentrations: 2.0, 0.0, 14.5, 9.5, 27, 18, 30, 18.5, 26, and 14 µg/mL, respectively. (B) The intensity profile of lane 1 of (A) (weight control). (C) The intensity profile of lane 4 for (A). (D) The intensity profile of the bands for the recombinant GPN protein region, highlighted in red from the gel in (A).
Algorithms 17 00149 g004
Figure 5. Preprocessing of SDS-PAGE gel images. (A) Grayscale image. (B) Binarized image. (C) Eroded image.
Algorithms 17 00149 g005
Figure 6. IPBBIS. (A) Binarized and eroded image. (B) Representation of the binary mask with a size of 1 × 400 pixels placed at pixel 7. (C) A simple histogram of the region contained in the binary mask, (D) Histogram of the region after applying Otsu segmentation to (C).
Algorithms 17 00149 g006
Figure 7. A new image intensity profile was obtained by plotting the array’s values containing only the white pixels generated by the IPBBIS method.
Algorithms 17 00149 g007
Figure 8. (A) A complete gel is shown. (B) A plot was generated using the image profile based on binarized image segmentation after image equalization. (C) The IPBBIS plot was obtained from the non-equalized Figure 6A.
Algorithms 17 00149 g008
Figure 9. (A) SDS-PAGE gel of BSA protein with the concentrations 2 mg/mL (lane 1), 1 mg/mL (lane 2), and 0.5 mg/mL (lane 3). (B) Image of binary, dilated, segmented, and eroded (A). (C) Plot of the new intensity profile of the (A) gel using IPBBIS.
Algorithms 17 00149 g009
Figure 10. (A) Initial image of the gel with GPN samples at different concentrations before preprocessing. (B) A plot was generated using the IPBBIS method applied to (A).
Algorithms 17 00149 g010
Figure 11. (A) Molecular weight control was obtained from lane one or the ladder in Figure 10A. (B) The IPBBSI plot applied to (A). (C) Bands automatically detected by IPBBIS marked with blue lines.
Algorithms 17 00149 g011
Figure 12. Results of the interpolation methods for the molecular weight of the detected proteins.
Algorithms 17 00149 g012
Figure 13. (A) Detected maxima (blue dash lines). (B) Threshold that allows obtaining a cut-off region that includes only the minima that represent the separation of the samples. (C) Graph obtained from the cut-off region. (D) Total of automatically detected samples (blue dash lines).
Algorithms 17 00149 g013
Figure 14. (A) Random sample selection within the gel (red box in the image). (B) Automatic band detection using image profiling based on binarized image segmentation. (C) Molecular weight detection using IPBBIS for GPN protein. (D) Selection of GPN protein bands from different samples for ROI. (E) The application of the image profile is carried out in the binarized image segmentation of (D).
Algorithms 17 00149 g014
Figure 15. Image profiling of Figure 14D, based on binarized image segmentation in the region of interest. (A) lane 2, (B) lane 4, (C) lane 5, (D) lane 6, (E) lane 7, (F) lane 8, (G) lane 9, (H) lane 10, and (I) lane 11.
Algorithms 17 00149 g015
Figure 16. (A) Manual calculation of the band area by outlining the spot contour. (B) Area calculated by K-means segmentation. (C) Area calculated by Otsu segmentation.
Algorithms 17 00149 g016
Table 1. Peak maximum values obtained from the graph in Figure 8C.
Lane56789101112131415
Value7971584023294561414541
Table 2. GPN protein concentrations with known values.
Lane234567891011
Concentration
mg/mL
2.00.014.59.527183018.52614
GelAlgorithms 17 00149 i001Algorithms 17 00149 i002Algorithms 17 00149 i003Algorithms 17 00149 i004Algorithms 17 00149 i005Algorithms 17 00149 i006Algorithms 17 00149 i007Algorithms 17 00149 i008Algorithms 17 00149 i009Algorithms 17 00149 i010
Table 3. The table shows the error obtained by applying three numerical interpolation methods to the polyacrylamide gel ladder in Figure 11A.
Interpolation MethodCalculated Weight (kDa)Total Error %
Linear33.43.35648148
Nearest37.07.060185185
Cubic31.389.194960019
Table 4. Different samples Data of GPN concentrations.
Lane234567891011
Concentration
mg/mL
2.00.014.59.527183018.52614
ROI-GPN10.380.020.5518.6727.3422.8728.8223.0827.2620.11
Area Manual513.620.0830.25680.121373.80830.001061.50934.50983.50869.25
Area K-means segmentation495.500.0969.62933.001457.201132.201336.201134.901422.10993.13
Area Otsu segmentation535.750.01189.81023.41646.81318.21557.11269.11585.91174.6
Table 5. Confusion matrix obtained by analyzing 669 samples expressing GPN protein at different concentrations on homogeneous SDS-PAGE gels.
Predicted
PositiveNegative
RealPositiveTP = 310FN = 8
NegativeFP = 2TN = 349
Table 6. The Table shows the accuracy results obtained from the confusion matrices in Table 5 and Table 7.
Accuracy of Homogeneous GelsAccuracy of Heterogeneous Gels
0.9850520.91736
Table 7. Confusion matrix obtained by analyzing 1561 samples with GPN protein expressed at different concentrations on heterogeneous SDS-PAGE gels.
Predicted
PositiveNegative
RealPositiveTP = 671FN = 105
NegativeFP = 24TN = 761
Table 8. The data in Table 4 are ordered according to the amount of protein expressed from lowest to highest overexpression.
Concentration mg/mL029.51414.51818.5262730
Lane325114791068
ROI-GPN010.3818.6720.1120.5522.8723.0827.2627.3428.82
Manual Area0513.6680.1869.25830.25830934.5983.51373.81061.5
K-means segmentation Area0495.5933993.13969.6211321134.91422.11457.21336.2
Otsu segmentation Area0535.810231174.61189.813181269.11585.91646.81557.1
Table 9. Normalization of the data from Table 8.
Normalized Data
Concentration mg/mL0.000.070.320.470.480.600.620.870.901.00
Lane325114791068
ROI-GPN0.000.360.650.700.710.790.800.950.951.00
Manual Area0.000.370.500.630.600.600.680.721.000.77
K-means segmentation Area0.000.340.640.680.670.780.780.981.000.92
Otsu segmentation Area0.000.330.620.710.720.800.770.961.000.95
Table 10. Data from Table 9 normalized and compared to the predecessor to identify if there are negative variations corresponding to mismeasurement in protein overexpression.
Concentration mg/mL0.000.070.320.470.480.600.620.870.901.00
Lane325114791068
ROI-GPN0.000.360.290.050.020.080.010.150.000.05
Comparison of Manual Area 0.000.370.120.14−0.030.000.080.040.28−0.23
Comparison of K-means Segmentation Area0.000.340.300.04−0.020.110.000.200.02−0.08
Comparison of Otsu Segmentation Area0.000.330.300.090.010.08−0.030.190.04−0.05
Disclaimer/Publisher’s Note: The statements, opinions and data contained in all publications are solely those of the individual author(s) and contributor(s) and not of MDPI and/or the editor(s). MDPI and/or the editor(s) disclaim responsibility for any injury to people or property resulting from any ideas, methods, instructions or products referred to in the content.

