1. Introduction
In recent years, the emerged customer needs and product trends define the ever-changing nowadays industry, since the technology has made huge leaps towards the future. In order to stay competitive, manufacturers are constantly working towards rapidly introducing and manufacturing new products that meet the customer expectations. To this end, production planning strategies, e.g., mass personalization, could be employed in an effort to enhance the productivity of manufacturing systems and the diversity of the offered products [
1]. However, their application involves a series of challenges that increase the corresponding operational costs, e.g., storage costs. These challenges, among others, include the production of low-quality items, raw material consumption, and fluctuating customer demand. If not properly tackled, they could substantially hinder the long-term sustainability and cost-effectiveness of production systems due to the associated rising costs. Furthermore, governments require production plants’ compliance to environmental regulations and policies in an effort to mitigate the effects of climate change and global warming [
2,
3].
Given the above, the digitization of processes and operations could be considered as an effective approach to achieving a sustainable production environment [
4]. This transformation represents one of the aims of Industry 4.0. Often regarded as the fourth industrial revolution, Industry 4.0 is a manufacturing concept that strives to transform traditional production plants into smart ones, aiming to optimize their productivity and cost-effectiveness through intelligent manufacturing [
5]. It is a transition achieved through the coupling of integrated manufacturing operations and components, e.g., machines, with intelligent technologies, including Internet of Things (IoT) [
6,
7]. These devices communicate with the system, gathering significant data [
8,
9]. With the aid of machine learning, they analyze and utilize the accumulated data to schedule operations, predict failures, manage product inventory, and conduct quality inspections [
10,
11]. As a result, corresponding predictive models are developed and assume an integral role in the decision-making process conducted within smart production system [
12,
13].
Along with Industry 4.0, the lean green manufacturing concept could be employed as well to improve both sustainability and output product quality within smart production systems [
14,
15]. It is a relatively new paradigm that simultaneously exploits the strengths of lean and green manufacturing in order to identify waste and assess environmental effects [
16]. To understand the strengths of lean and green manufacturing, let us define each concept separately. Devised by Toyota, lean manufacturing is a manufacturing paradigm that intends to improve the value of a product. It attempts to reduce material waste within manufacturing systems and to support seamless collaboration between entities, including suppliers and customers, involved in manufacturing operations and processes [
17,
18]. The goal of this application is to promptly and cost-effectively manufacture high-quality items [
19]. One of the limitations of lean manufacturing is the lack of performance metrics that assess the environmental impact of manufacturing processes [
20]. On the other hand, green manufacturing endeavors to improve the plants’ productivity with circular economy practices, such as recycling and refurbishing [
21]. It aims at producing items that demonstrate conformance to the quality and environmental standards by decreasing the negative impact associated with human intervention [
22]. However, the implementation of lean and green practices within production systems is still hindered by a plethora of barriers, including the lack of proper training, inventory management, and effective maintenance plans [
23]. Industry 4.0 could solve these barriers with its technologies and finally enable the integration of lean green manufacturing in the actual industry [
24].
With regard to the above, the present paper aims to formulate smart production environments that are lean, sustainable, and eco-friendly. It presents a scheduling optimization framework that devises joint control policies for multi-stage manufacturing systems. For this effort, it exploits a reinforcement learning (RL) decision-making technique. RL, as suggested by [
25], is a machine learning approach that attempts to learn an action in an effort to increase the obtained reward. Compared to methods, e.g., Dynamic Programming, RL attempts to solve decision-making problems without requiring an explicit model of its environment [
26,
27].
The RL-based decision-making process is complemented with lean green practices. These practices combine two types of manufacturing; that is, lean manufacturing and green manufacturing. Considering the lean part, the present paper adopts pull production and total productive maintenance, which are two well-known lean manufacturing techniques [
28]. In this respect, pull production is enabled through ad hoc policies, such as Base Stock [
29,
30], while total productive maintenance is integrated through predictive maintenance policies, e.g., condition-based maintenance, that seek to minimize maintenance costs and improve the availability of processing machines [
31]. The implemented ad hoc policies are frequently employed in the real-world industry and the academic literature [
32,
33]. On the other hand, the green manufacturing part is supported with circular economy policies, namely refurbishing and remanufacturing. These policies aim to minimize the environmental impact of products by extending their lifecycle [
34]. In this respect, low-quality or returned material is processed again in order to create new and usable products. This leads to a substantial reduction in material consumption and raw material dependence.
In terms of evaluation, the proposed mechanism is implemented in a multi-stage manufacturing system, influenced by degradation failures. The multi-stage manufacturing system is commonly integrated in the real-world industry. An example of such a system is provided as follows. Let us consider a manufacturing environment that manufactures gears. The gear manufacturing process involves two stages, that is, forming and machining. In the forming stage, the system procures raw materials. Thereafter, these materials are processed by the corresponding machine. This process involves activities, e.g., casting, sintering, extruding, etc., that create preforms of the gears. In this regard, each item completed during the first stage is called work-in-progress (WIP), since they are not in their final form. These WIP gears are stored in the inventory of the first machine until they are moved in the second stage, where the machining process is materialized. During this stage, the involved operations, e.g., milling, sharping, grinding, etc., complete the gears, forming their final characteristics, such as gear teeth. The final items are stored in the inventory before they are delivered to customers. Given the sophistication and robustness of such systems, a similar one is employed in the present paper. This system involves a two-stage manufacturing/remanufacturing process. In this context, the system can generate new items, or reform defective ones. Considering the behavior, the system is prone to a variety of random events impacting on its sustainability and flexibility in terms of quality and cost-effectiveness.
The paper’s objectives are summarized in the succeeding key points. Firstly, a degrading two-stage manufacturing/remanufacturing system prone to stochastic behavior is investigated. Both raw materials and returned products are considered as well. Secondly, a scheduling mechanism is formulated and presented in an attempt to jointly control and optimize the behavior and sustainability of the examined system through lean green manufacturing practices. This mechanism employs a RL algorithm and ad hoc policies. Using this implementation, the aim is to form combined scheduling policies of production, maintenance, remanufacturing, raw material procurement, and refurbishing operations, with the aim of formulating lean and sustainable production environments. Thirdly, simulation experiments are carried out to explore the proposed mechanism’s functionality considering revenues, obtained costs, and output product quality. Furthermore, the effect of average activity rates on the manufacturing system’s cost-effectiveness is investigated as well.
The rest of this paper is organized as follows.
Section 2 reviews the pertinent literature. The architecture and behavior of the system in question is summarized in
Section 3.
Section 4 details the presented methodology.
Section 5 analyzes the efficiency of the proposed approach in terms of system profitability. Finally, the findings of this paper and future research are summarized and outlined in the final section.
3. Investigated System Overview
The system investigated in this paper involves a two-stage manufacturing process in order to complete one type of goods; that is, it comprises two manufacturing and storage facilities. The production process can be described as follows. In the first stage, the system procures raw materials prior to producing WIP goods. In the next stage, the second manufacturing facility processes the WIP products completed in the first stage. As a result, the final items are completed and stored in the second storage facility.
In terms of operability, frequent failures persistently degrade the completed products and the system. In this context, the system condition can be divided into o phases; with each failure, the examined system is moved from o into . To preempt any further degradation, the system is being maintained systematically. It is considered that the maintenance cost is considerable increased at late deterioration stages. In case of complete inoperability, repair activities restore the operability of the system by restoring its good condition ().
The system produces standard products and defective items due to the persistent deterioration. In terms of minimizing material waste, the faulty goods can be remanufactured by the system. Considering the system revenues, the system can sell standard and remanufactured products to the customers. However, if the customers feel dissatisfied with their purchased products, they can return them to the system. These items can be refurbished. The refurbished items can be sold to customers.
4. Scheduling Optimization Framework
This methodology is a two-agent reinforcement learning/ad hoc control approach that endeavors to minimize the overall operational costs and thus improve the sustainability of the system.
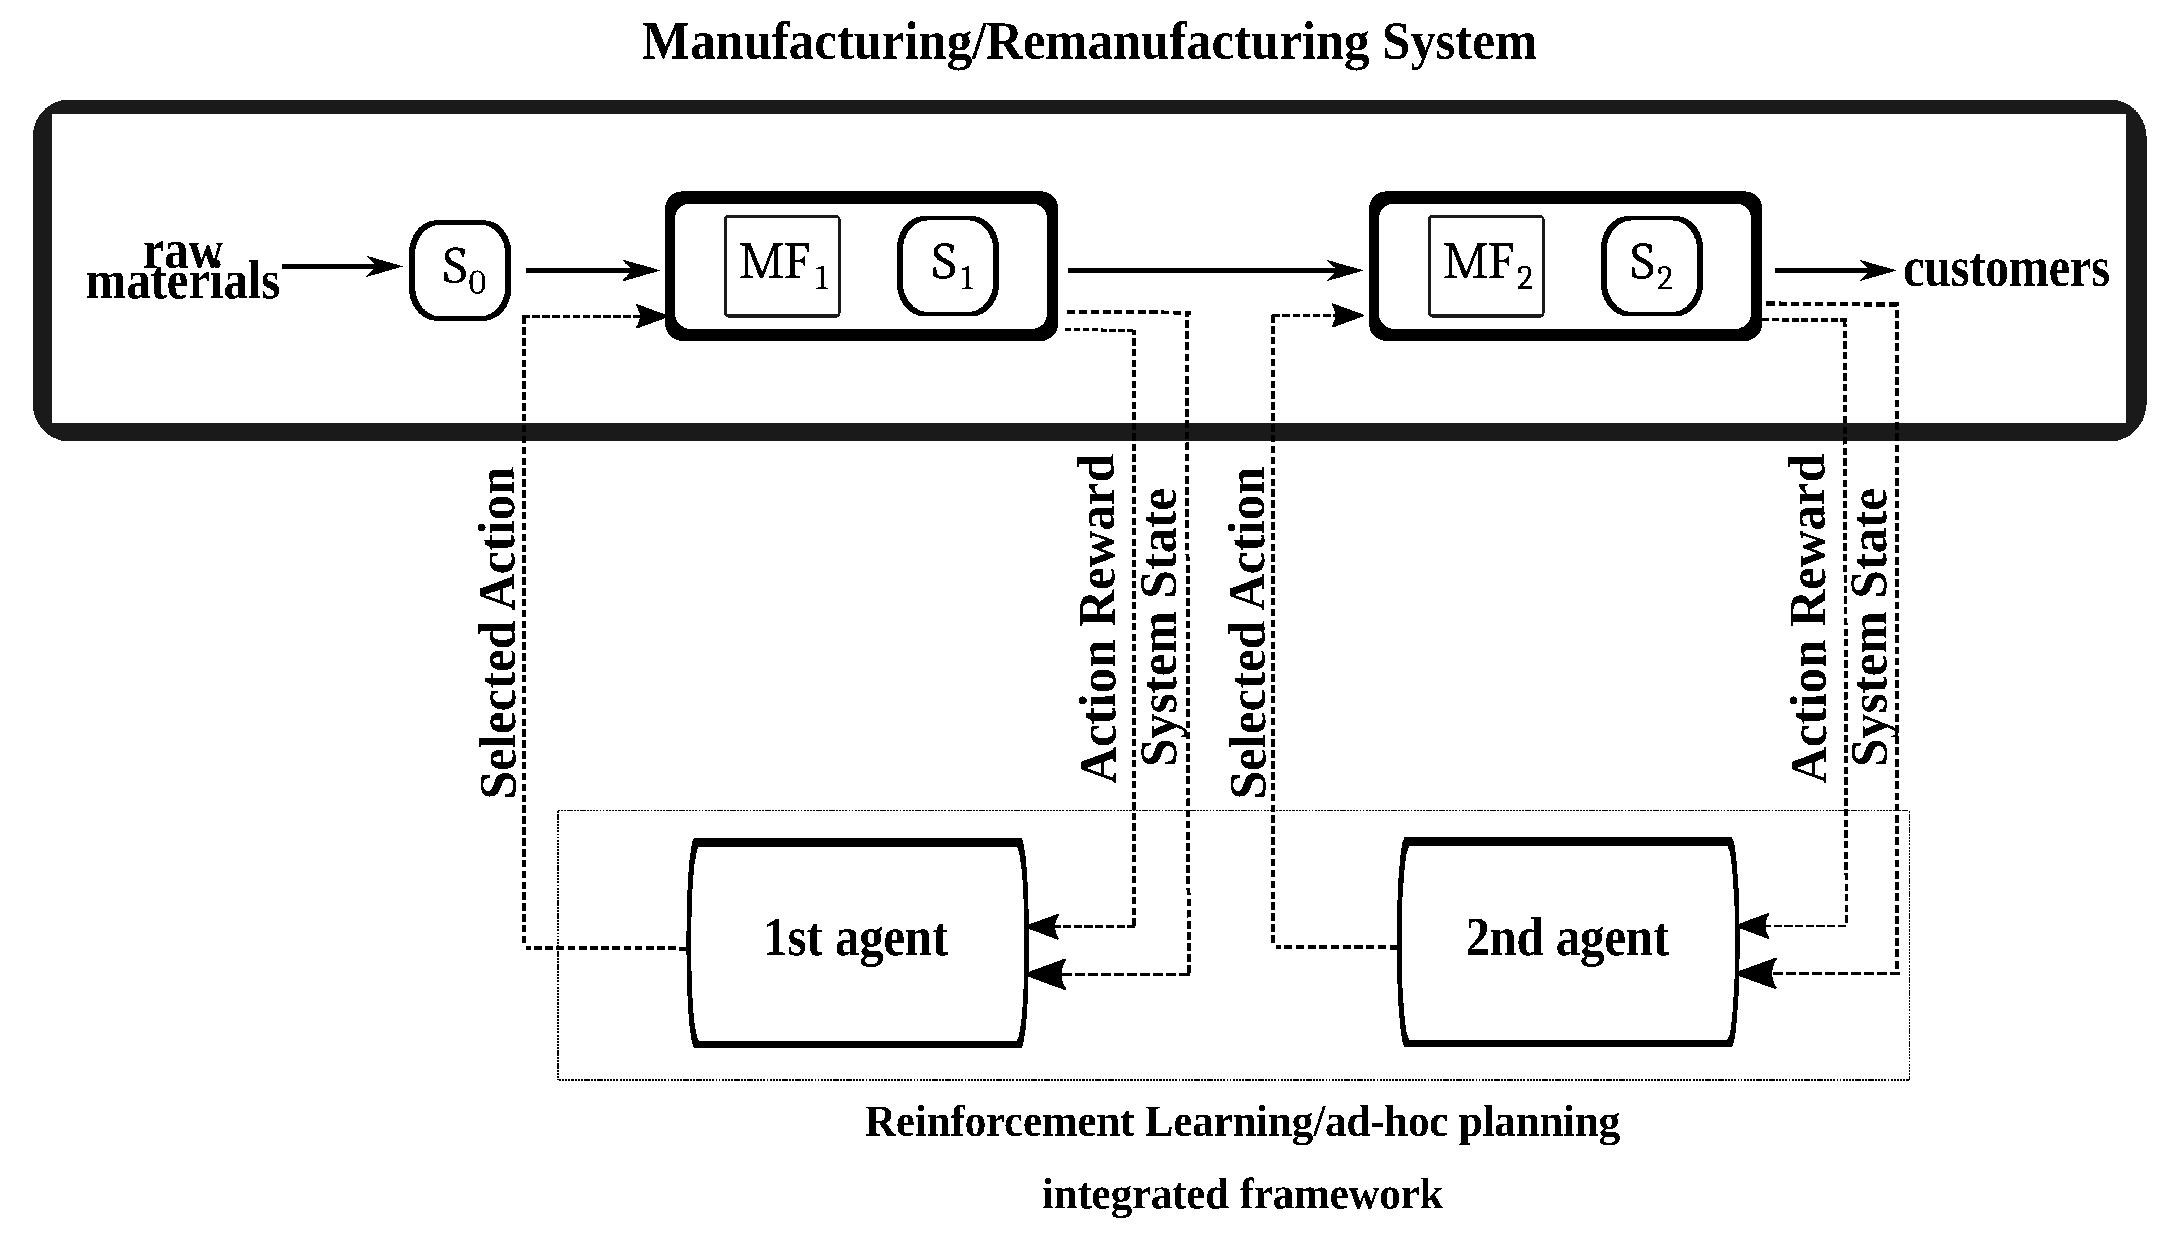
Figure 1 demonstrates the flow of information on basis of the interaction between manufacturing system and mechanism, where
and
denote manufacturing facilities, and
,
and
represent storage of raw materials, WIP, and output goods, respectively. This flow can be described as follows. The mechanism interchanges dynamic information with the integrated facilities of the investigated system. For this purpose, it implements two agents which interact with each manufacturing facility. This type of communication is a two-way process. In this regard, the mechanism observes continuously its environment and the system operates based on the policy obtained by the mechanism. Furthermore, the integration of production and maintenance ad hoc policies complements the functionality of the presented mechanism by endeavoring to authorize only the needed operations that sustain the system condition and functionality.
4.1. State Representation
The mechanism conducts decision-making at epochs
. These epochs are: (a) after a production activity, (b) after the maintenance of the system, (c) after the system repair, and (d) when the system is idle. In order to make a decision, the mechanism receives the present state of each manufacturing facility at
. In this regard, the mathematical formulation of each manufacturing facility is given as follows:
In the expression above, refers to the degradation of the manufacturing facility, denotes the status of the manufacturing facilities, and represents the inventory of standard and faulty goods, respectively. Furthermore, it does not perform decision-making if any machine ceases operation, or and reach their maximum capacity.
4.2. Actions
Through its two agents, the mechanism devises policies that initiate production and maintenance operations using parametric policies, procure raw materials, authorize refurbishing and remanufacturing activities for returned and faulty items, respectively. The set of the actions can be formulated as:
In this paragraph, let us describe the decision-making process of the mechanism according to the mathematical expressions presented above. The decision-making agents decide to produce new items with an ad hoc production policy prior to any system degradation . In the case of filling both storage facilities with standard items , raw materials are procured, or the manufacturing facilities are maintained with an ad hoc maintenance policy. Last but not least, the system can either remanufacture or refurbish goods when the storage facilities contain only faulty products. These circular economy operations support green manufacturing within the manufacturing system.
4.3. Ad Hoc Production and Preventive Maintenance Policies
To support lean green manufacturing within the investigated system, the proposed RL-based scheduling mechanism integrates lean manufacturing policies, along with green manufacturing operations, namely remanufacturing and refurbishing. With this implementation, the mechanism strives to identify and reduce waste in manufacturing systems. To this end, it implements pull production and total productive maintenance techniques.
Pull production involves the manufacturing of items according to the current demand, which is defined in the form of placed orders. In this paper, the proposed mechanism employs the following pull policies: Extended KANBAN, Base Stock, KANBAN. On the other hand, total productive maintenance is integrated through predictive maintenance policies. These policies include condition-based maintenance, preventive maintenance, and corrective maintenance. They are employed to keep the integrated processing machines in operation and minimize the likelihood of manufacturing disruption.
Furthermore, a push production mechanism (that is, ) is considered as well. This mechanism attempts to create stock on the basis of future customer demand. Filling the inventory with products is not always the best option, considering the related storage costs and the likelihood of unsold products. Nevertheless, with this implementation, the aim is to investigate the performance of lean manufacturing approach compared to an alternative manufacturing one; that is, push production.
4.3.1. Production Policies
KANBAN [
61] dictates that every item stored in the storage facilities is coupled with a KANBAN card.
Figure 2 depicts the functionality of KANBAN in a two-stage manufacturing system. In this figure,
and
represent the queue of KANBAN cards in
and
. Analytically, KANBAN operates as follows. When an item is moved to
or sold to a customer, its card is detached and transferred to
, beginning the production in that facility. It is sensible to assume that the KANBAN cards represent the ongoing customer demand for new products. On the other hand, under the
policy [
62], the manufacturing system produces items in respect to defined thresholds associated with the product inventory. In this regard, the thresholds are
s and
S, denoting the minimum and maximum allowable inventory, respectively. When the product inventory is less than
s, the production process is initiated in the facilities. If the inventory reaches
S, then the facilities stop producing items.
An alternative approach to production control is Base Stock (BS) [
63], authorizing manufacturing activities in every facility integrated in the system after an order is placed by customers.
Figure 2 illustrates BS. In terms of notation,
and
denote the queue of pending orders, and
represents the queue of customer demand. According to
Figure 3,
receives orders from the customers. Later, these are sent to
and
in order to begin the production process.
Lastly, the Extended KANBAN (EK) [
64] is formed on the basis of BS and KANBAN policies. The functionality of this policy is presented in
Figure 4, and can be described as follows. After the placement of new orders,
and
receive information regarding the customer demand. To begin the production process in
and
, a product must be removed from the facilities and its KANBAN card must be sent to the respective
and
.
4.3.2. Maintenance Policies
Condition-based maintenance (CBM) is controlled by parameter c. This parameter refers to a predefined degradation stage. When the manufacturing system finds itself in c, CBM renders the system into maintenance mode. In the same line, preventive maintenance (PM) implements a block-replacement policy characterized by parameter , representing the ready-to-be replaced equipment of the manufacturing system. In this respect, when , PM maintains manufacturing systems by facilitating the ad hoc replacement of severely damaged, or worn-out equipment during the operation of facilities. By following a different approach, corrective maintenance (CM) is conducted as soon as the facilities sustain a failure. Let denote the observed failure in the system. While , maintenance activities are being authorized by CM. The aim is to preempt the further degradation of the system by authorizing immediate maintenance activities.
4.4. Learning Algorithm
At
, the agents devise a sequence of actions, that is, a policy
p, for the manufacturing system. This policy is associated with a relative reward. The system attains this reward in the subsequent
. The following expression estimates the expected reward under
p:
In (
5),
and
denote the costs associated with producing and storing products.
refers to the cost of procuring raw materials.
is the cost of maintenance occurred at
, and
represents the cost of repair activities. Note that
.
,
and
are the cost of remanufacturing, refurbishing, and the fee of returned goods, respectively. In regard to system profits,
refers to the standard product revenue, and
denotes the remanufactured product revenue. Lastly,
is the revenue associated with sold refurbished products.
At every step, the mechanism attempts to increase
using (
5). Clearly, this expression is the objective function of the agents. In other words, the proposed mechanism seeks to formulate a policy
p that maximizes the defined goal. In this regard, the agents integrate a Markov Decision Process. During this process, the next environment state and the expected reward can be estimated on the basis of the present state and opted action using (
6). According to Sutton and Barto [
25], both expressions represent the dynamics of the interacting environment. Therefore, the dynamics of the studied manufacturing environment are estimated as follows (for the sake of brevity, the time variables are omitted):
where
denotes the action at
.
For deriving a policy, the agents use a model-free average reward RL algorithm, called R-Learning. This algorithm strives to attain the optimum reward at every step [
25,
65]. To achieve that, it considers two values: a state-action value and a reward. The following expressions estimate these values:
where
,
are the current state and the action at
,
and
denote the subsequent state and action in the next epoch
,
A and
correspond to the reward and average reward obtained by the agents, and
is a hyper-parameter that assumes real values. The state-action value corresponds to the action taken in a specific system state. Every value is stored in a table, called “q-table”, which is updated at every
with (
7).
The actions are selected by exploring/exploiting the state-action space. To this end, the e-greedy strategy is used. This strategy can opt for a greedy action (i.e., the action with the optimum value in the q-table) with probability
, or a random one with probability
e. When the greedy action is opted, the corresponding reward is calculated as follows:
where
is a real-valued hyper-parameter.
5. Analysis of Simulation Experiments
This section is an experimental analysis presenting the efficiency of the mechanism implemented in the multi-stage system. A small portion of the experiments designed for the study’s purposes are presented in
Table 2. In this table, one can find the average rates constituting events occurred in the examined production system. The mathematical notations of the rates used in
Table 2 are as follows.
,
and
are order, production, and failure rates;
and
refer to rates related to maintenance and repair operations; and finally,
and
denote the frequency of remanufacturing and refurbishing activities. Considering the maintenance and failure frequencies, it is considered that
and
.
By defining these rates, the two-stage manufacturing system is evaluated by mimicking and simulating real-world-like circumstances, e.g., unforeseen machine failures, which have great effects on it. The scope of the experiments is to study the performance of the presented methodology under the simulated stochastic manufacturing system. For this reason, the rates are specifically formulated to be pertinent to the frequency of customer orders, production operations, equipment failures, maintenance, repair, remanufacturing, and refurbishing activities. In this respect, let us examine the ninth experimental scenario presented in
Table 2 to demonstrate the concept of the performed experiments. According to this scenario, the system moderately initiates new production, remanufacturing, and refurbishing activities, while accepting a fair number of orders from incoming customers. Within this context, the system degradation failures are occasional. These could affect moderately the “well-being” of the manufacturing machines. To this end, the intention was to scarcely authorize maintenance and repair in the system. That is, their corresponding rates received moderate values.
Furthermore, since the experiments simulated the behavior of the examined stochastic system, preliminary experiments were conducted to determine how many times the experiments would be replicated in order to obtain satisfactory results. During these experiments, the performance of the studied manufacturing under R-Smart was assessed to determine the appropriate number of replication. For simplicity reasons, the preliminary experiments were based on the 1st scenario listed in
Table 2, and the number of the completed item inventory was kept constant at 6 million, since it does not considerably affect the performance of the simulated system. In this respect, the simulation of two-stage manufacturing system under the 1st experimental scenario was replicated 2–20 times. The obtained results demonstrated that the system was efficient in the case of experiments, where the replication parameter assumed values equal, or above 15. Therefore, it was reasonable to replicate every experiment scenario 15 times, stockpiling 6 million goods in the second storage facility.
The values assumed by parameters of the experimental setup are listed in
Table 3. Considering the table’s notation,
and
are the product manufacturing and storing cost coefficients,
,
and
are the relative cost coefficients related to raw materials, maintenance, and repair,
,
denote the coefficients of remanufacturing and refurbishing costs,
,
, and
represent coefficients of profits procured after selling standard products, remanufactured, and refurbished goods. Finally,
is the fee coefficient relevant to returned items.
Finally, the experimental analysis presented in later sections compares different versions of the presented mechanism. The implemented mechanism versions are: (a) RL(EK-CBM), (b) RL(EK-CM), (c) RL(EK-PM), (d) RL(BS-PM), (e) RL(BS-CM), (f) RL(BS-CBM), (g) RL(
-CBM), (h) RL(
-PM), (i) RL(
-CM), (j) RL(KANBAN-CBM), (k) RL(KANBAN-PM), (l) RL(KANBAN-CM), (m) RL(CBM), (n) RL(PM), (o) RL(CM), (p) RL(R-Learning).
Table 4 disseminates the ad hoc production and maintenance policies that are integrated in the RL-based mechanisms, excluding RL(R-Learning). Using these policies, the RL agent initiates production and maintenance in the system according to (
2) and (
3).
RL(CBM), RL(PM), RL(CM), and RL(R-Learning) were adapted from the approaches presented in [
26,
60,
66]. Elaborately, as presented in [
26,
66], RL(R-Learning) integrates a single R-Learning-based agent for the joint control optimization of single-stage production systems. Similarly, RL(CBM), RL(PM), and RL(CM) employ one agent for deriving policies. This agent follows the RL-based decision-making approach [
60], which involved ad hoc production policies instead of maintenance ones. Given the above, the behavior of RL(CBM), RL(PM), RL(CM), and RL(R-Learning) was accordingly adjusted for the purposes of the present study.
Note, in the following figures, that each illustrated quantity is associated with its respective unit. Analytically, the average inventory is measured in parts; the average event rates (e.g., ) are measured in time units; the obtained revenues and costs are associated with monetary units; the simulation scenarios are dimensionless. For readability reasons, these units, except for “parts”, are abbreviated, and the following notation is utilized: “t.u.” denotes time unit, “m.u.” represents monetary unit, and “d.u.” refers to dimensionless unity.
5.1. Performance Analysis
Figure 5 compares the performance of the implemented RL-based frameworks. Observing this figure, one can indicate that the RL/ad hoc control mechanisms demonstrate better performance in terms of profitability. Specifically, the two-stage manufacturing system is considerably profitable when controlled by RL(EK-CBM) and RL(BS-CBM). It is evident that the coupling of EK, BS, and CBM enhances the decision-making process of the two-agents by including awareness regarding customer demand, waste produced by low-quality items and potential maintenance activities. Another remark can be made concerning the similar performance demonstrated by the implemented versions of the proposed reinforcement learning mechanism. This could be attributed to the exploited parametric manufacturing control policies. For example, let us examine the performance of RL(EK-PM) and RL(BS-PM). Utilizing the same maintenance policy, that is, PM, they incorporate different manufacturing policies, namely EK and BS. The exploited manufacturing policies, as described in
Section 4.3, implement a similar functionality, as EK is formed according to BS and KANBAN. In this regard, both policies authorize production operations taking into consideration the incoming orders. As a result, their performance is not substantially dissimilar.
An analogous performance is displayed by frameworks, which exploit diverse parametric control policies. For instance, RL(, CM) and RL(KANBAN-CBM) obtain nearly identical revenues. Clearly, the amalgamation of these policies considerably improves the efficiency of the manufacturing system in terms of manufacturing and maintenance operations. As KANBAN and control manufacturing process on the basis of inventory levels, CM and CBM maintain the system according to the observed failures and a predefined threshold, respectively. It is likely that the maintenance operations are regularly authorized, as the equipment is frequently deteriorated due to the manufacturing operations. As a result, the system scarcely finds itself in downtime and the product stock is in good condition. Finally, RL(R-Learning) does not display the same awareness as that demonstrated by its counterparts. This is behavior is attributed to its decision-making agents, which are merely dependable on the state of their environment. In that case, the system would generate a stock of products that would not be remanufactured, or sold to customers. Moreover, it is assumable that maintenance activities are recurring in the system improving the system’s condition. Although, they are significantly costly when they are conducted in later degradation stages.
Figure 6 illustrates the profits attained by best-performing versions of the proposed mechanism compared to those obtained by ones integrating only maintenance policies. A clear indication is that the inclusion of production policies, such as EK, improves the sustainability of the manufacturing system, when the customers recurrently place orders and the manufacturing activities are not scarce. In that case, the stock is often replenished with a high variety of new products. Thus, the system satisfies the customers, whether the products are standard, remanufactured, or refurbished. However, this is not evident in the case of mechanism versions that authorize only ad hoc-based maintenance operations. These versions constantly maintain the two-stage system, and thus the good condition of the system is ensured. In this regard, the produced goods are of standard quality, although they are not sufficient to satisfy customers due to the increased overall maintenance cost.
5.2. Cost Analysis
This section analyzes the performance of RL-based mechanisms in terms of costs. The evaluated mechanisms are namely RL(EK-CBM), RL(BS-CBM), RL(PM), RL(CM), RL(CBM), and RL(R-Learning). The aim of the analysis is to investigate the impact of maintenance, remanufacturing and refurbishing costs on the cost-effectiveness of the investigated system under those mechanisms. In respect to that aim, the selection of the RL-based mechanisms was based on their performance depicted in
Figure 5 and
Figure 6. According to these figures, RL(EK-CBM) and RL(BS-CBM) are the best-performing mechanisms, while RL(PM), RL(CM), RL(CBM), and RL(R-Learning) are the worst-performing ones. Given that, the analysis of this section attempts to explain their performance by assessing the number of maintenance, remanufacturing, and refurbishing operations they authorized within the system.
Figure 7 shows the maintenance costs attained by different versions of the proposed scheduling mechanism. In this figure, RL(R-Learning) procured increased costs compared to its counterparts. This illustrates that the decision-making agent of this version decided to recurrently maintain the system to prevent degradation. Due to this repetition, essential processes, such as remanufacturing and manufacturing, were likely delayed, resulting in decreasing the productivity of the system, which is merely verified in
Figure 5. Moreover, the maintenance-related costs of the versions integrating only ad hoc maintenance policies are lesser than the ones of RL(EK-CBM) and RL(BS-CBM). It is likely that the two-stage system under the latter mechanisms was maintained in late degradation stages. Finding itself in these stages, the system tends to procure increased costs maintenance-related costs, as mentioned in
Section 4. Despite that, RL(EK-CBM) and RL(BS-CBM) managed to be sufficiently profitable as suggested by
Figure 5 and
Figure 6.
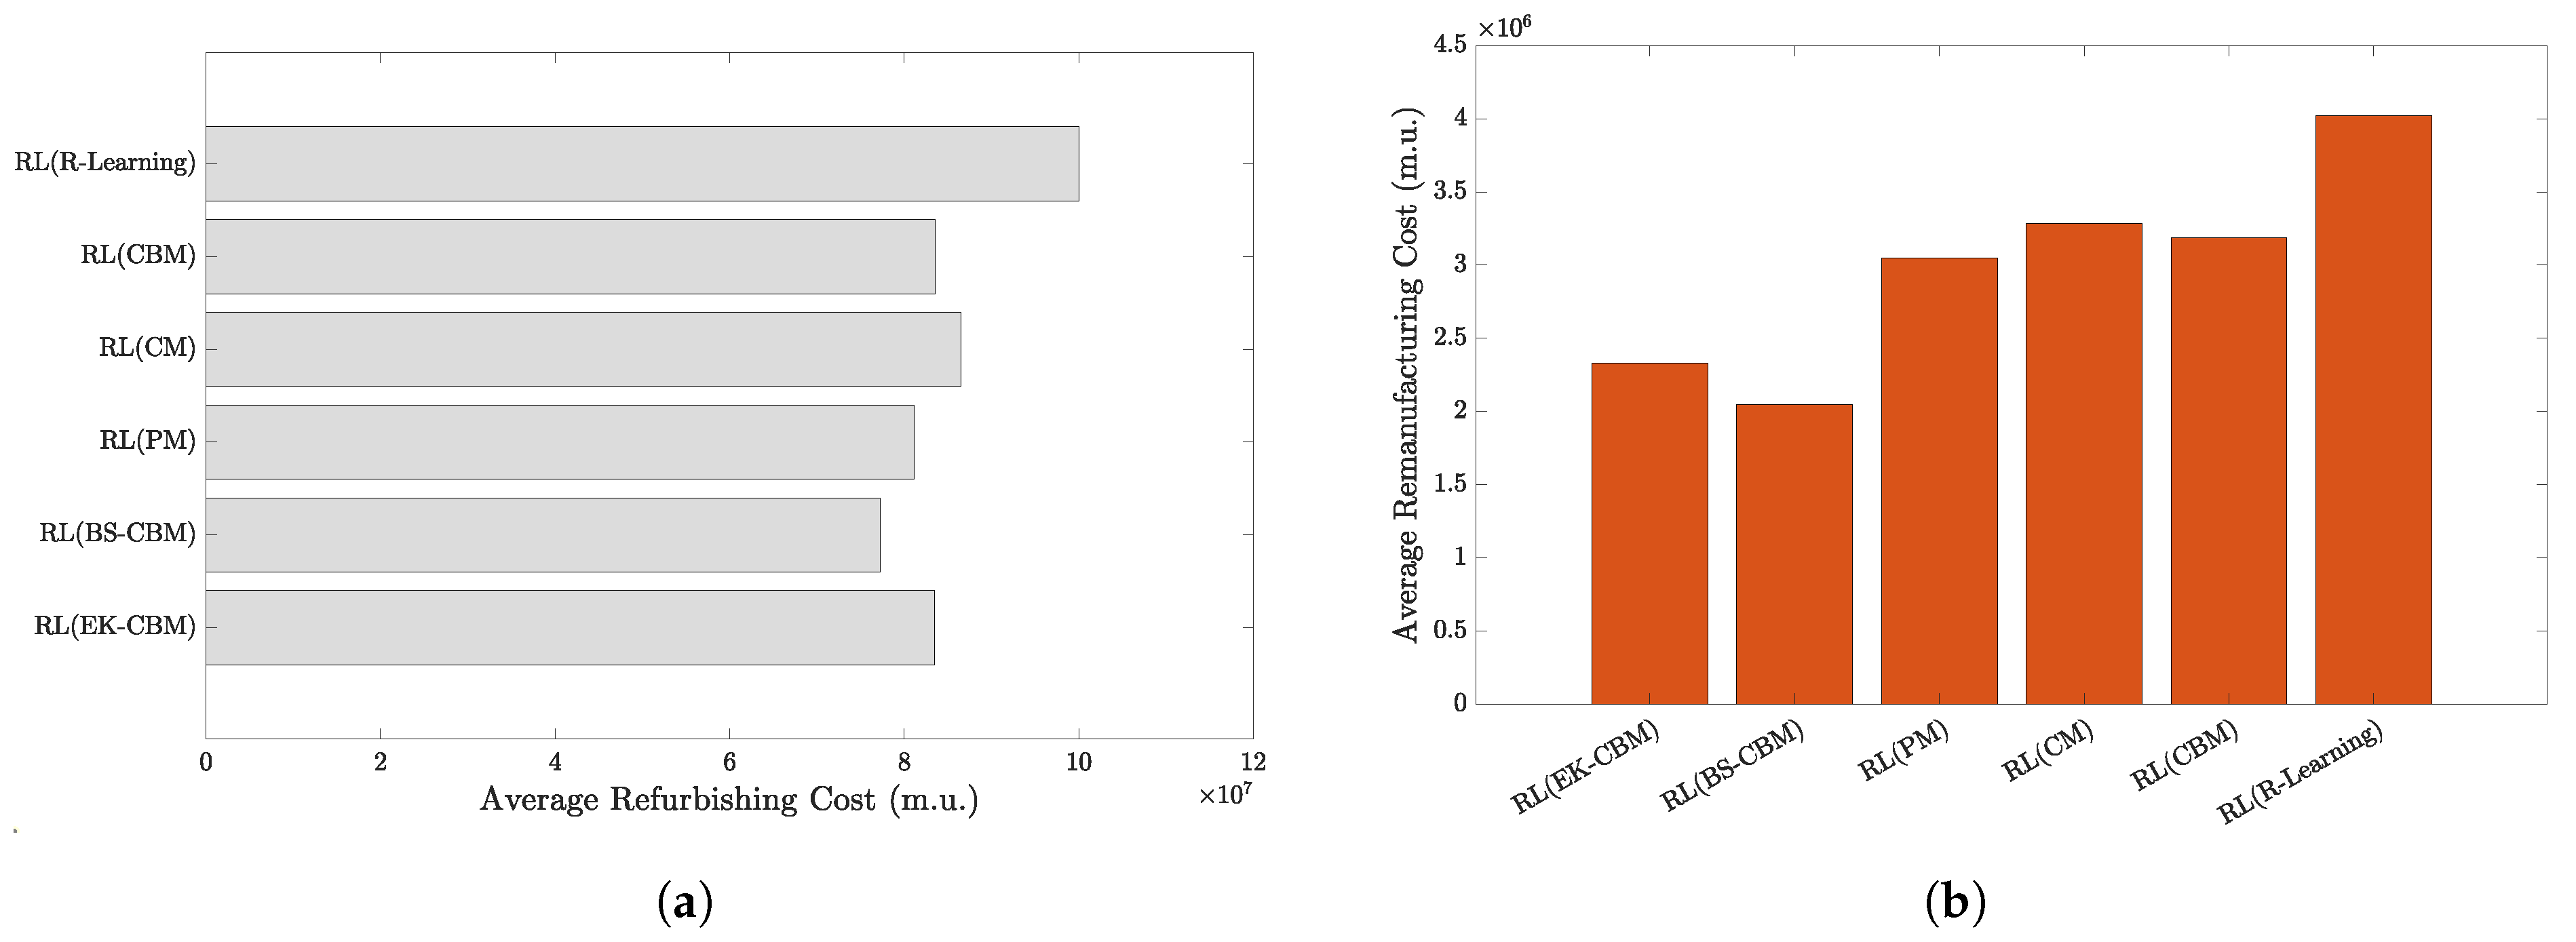
Figure 8a,b illustrate how variations in the proposed mechanism perform in terms of remanufacturing and refurbishing-related costs. Based on these figures, an interesting note should be made in respect to the attained costs. That is, the costs relevant to refurbishing activities are relative higher than the ones procured after conducting remanufacturing operations. This indication can be attributed to the significant quantity of items received from customers, considering the number of refurbished products illustrated in
Figure 7. Clearly, the system revenue stream is depended on the refurbishing of returned items. Furthermore, similar to
Figure 7, the costly version of the mechanism is RL(R-Learning), procuring the highest remanufacturing and refurbishing costs compared to its counterparts. That is, this indication suggests that the described variation’s agent decided on frequently generating remanufactured and refurbished items to decrease the amount of faulty and return products, respectively.
In terms of refurbishing activities,
Figure 8a suggests that RL(BS-CBM) receives lesser costs compared to the other variations. By merely integrating BS policy, the mechanism achieves at generating stock of products by transmitting explicit information regarding demand to facilities. In this context, BS-integrated mechanism outperforms EK-based one, despite being the most profitable variant throughout the simulations. In terms of conducted remanufacturing operations, though,
Figure 8b illustrates the cost-effectiveness of both RL(BS-CBM) and RL(EK-CBM). This can be likely attributed to the decreased storage of faulty products. In that case, the majority of the manufactured items are of standard quality, as the system is well-maintained under the CBM policy. Thus, remanufacturing activities are considered to be redundant.
5.3. Product Quality Analysis
In this section, the dissemination of completed products in terms of quality is investigated. For this investigation, RL(EK-CBM) is employed, since it is the best performing version of the proposed mechanism.
Figure 9 depicts the standard and faulty products produced over the course of the conducted simulations. It is indicated that an increased quantity of standard products is completed and stored in the facilities, while faulty items are either limited or zeroed. The latter observation is supported by
Figure 10, which indicates the small quantity of remanufactured items. This clearly illustrates that CBM control policy succeeds at keeping the manufacturing facilities in good condition, due to the observed number of standard products. Additionally, it is likely that the agents preferred to remanufacture faulty items in order to produce enough goods for customers. This contributes positively to the minimization and reuse of product waste in an effort to generate revenues. However, there is a high probability of returning acquired items to the system. The returned are stockpiled in the storage facilities until they are refurbished.
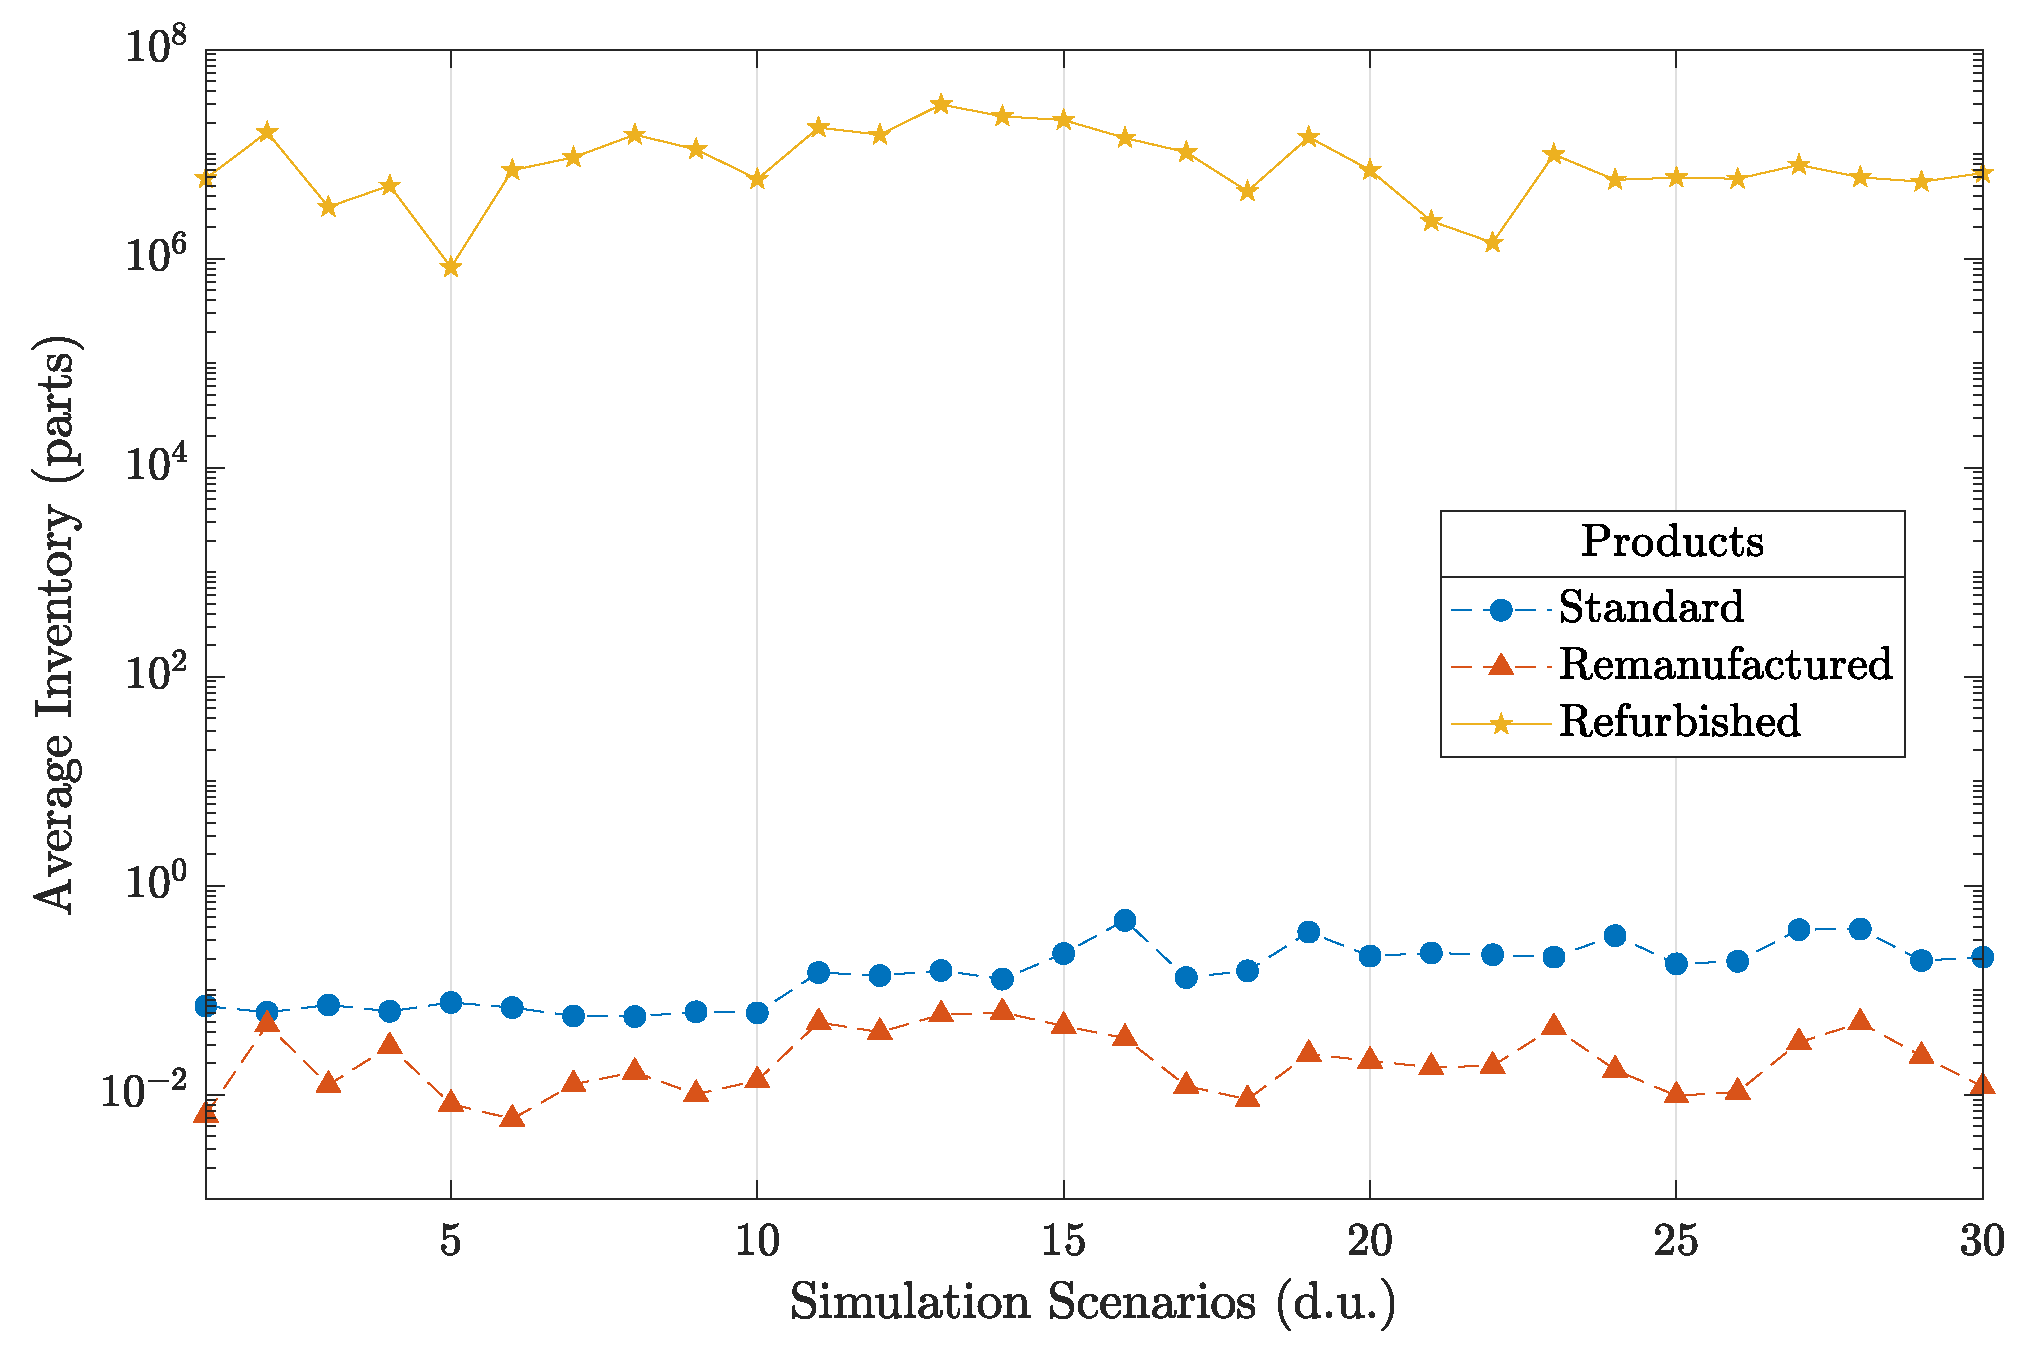
Figure 10 disseminates the inventory of ready-to-be-sold products. This figure demonstrates that the refurbished items are the ones that fill out the inventory throughout the simulation scenarios. This is a clear indication that customers are constantly dissatisfied with their purchase, and thus they are returning it to the manufacturing/remanufacturing system. These returned items are stored until they are refurbished. Since their number is high, the manufacturing facilities are unable to merely carry out the production process, as the inventory does not have space for new goods. Due to this fact, the produced and remanufactured items are limited. Nevertheless, the filling of facilities with refurbished items is a clear indication that the two-agent mechanism turns the loss associated with returned products into an effective and sustainable revenue stream for the examined system, since the refurbished items are later sold to customers.
5.4. Average Rate Analysis
This section analyzes and examines the impact of the average activity rates upon revenues of the system. Note that scenario 1 defined in
Table 1 served as a basis for the conducted experiments. In a similar fashion to the previous subsection, RL(EK-CBM) is used here as well.
Figure 11a,b show the profitability of the system depended on fluctuations of average production, failure, remanufacturing, and refurbishing activity rates. As indicated in
Figure 11a, the revenues are increased, as both rates are increased as well. That is, the production activities and failures become significantly scarce, when their respective rates assume high values. This observation is highly correlated with the product inventory indicated in
Figure 10, which shows that the system mainly contains refurbished products. Another remark is the scarcity of failures that result in decreasing faulty items. This is achieved by the authorization of CBM activities that mitigate any degradation occurred by failures and thus the good system condition is ensured. Furthermore,
Figure 11b demonstrates that the increased values of remanufacturing and refurbishing rates contribute positively to the system’s revenues. It indicates that the system is in position of manufacturing and offering standard products, as the remanufacturing and refurbishing activities are becoming noticeably scarce due to the assumed values of their rates.
Figure 12a,b compare average manufacturing rate against remanufacturing and refurbishing ones in terms of system revenues. In
Figure 12a, the increased rates of production improve the system’s cost-effectiveness. In that case, the production process is not initiated recurrently and thus the standard products would be in small numbers. This indicates that the revenue stream of the two-stage system is purely dependable on the already stored products. In this regard, as demonstrated in
Figure 10, the agents refurbish returned items to complete the placed customer orders. However,
Figure 12b shows that the revenues are high when the average refurbishing activity rate is increased. In that case, the agents decide to remanufacture faulty goods as the refurbishing activities are scarce. Furthermore, when the manufacturing facilities recurrently produce items, the profitability of the system is low. This can be attributed to the associated costs listed in
Table 3. In this regard, the production activities are costly for the system and therefore the overall revenues are low.
5.5. Analysis of Hyper-Parameters
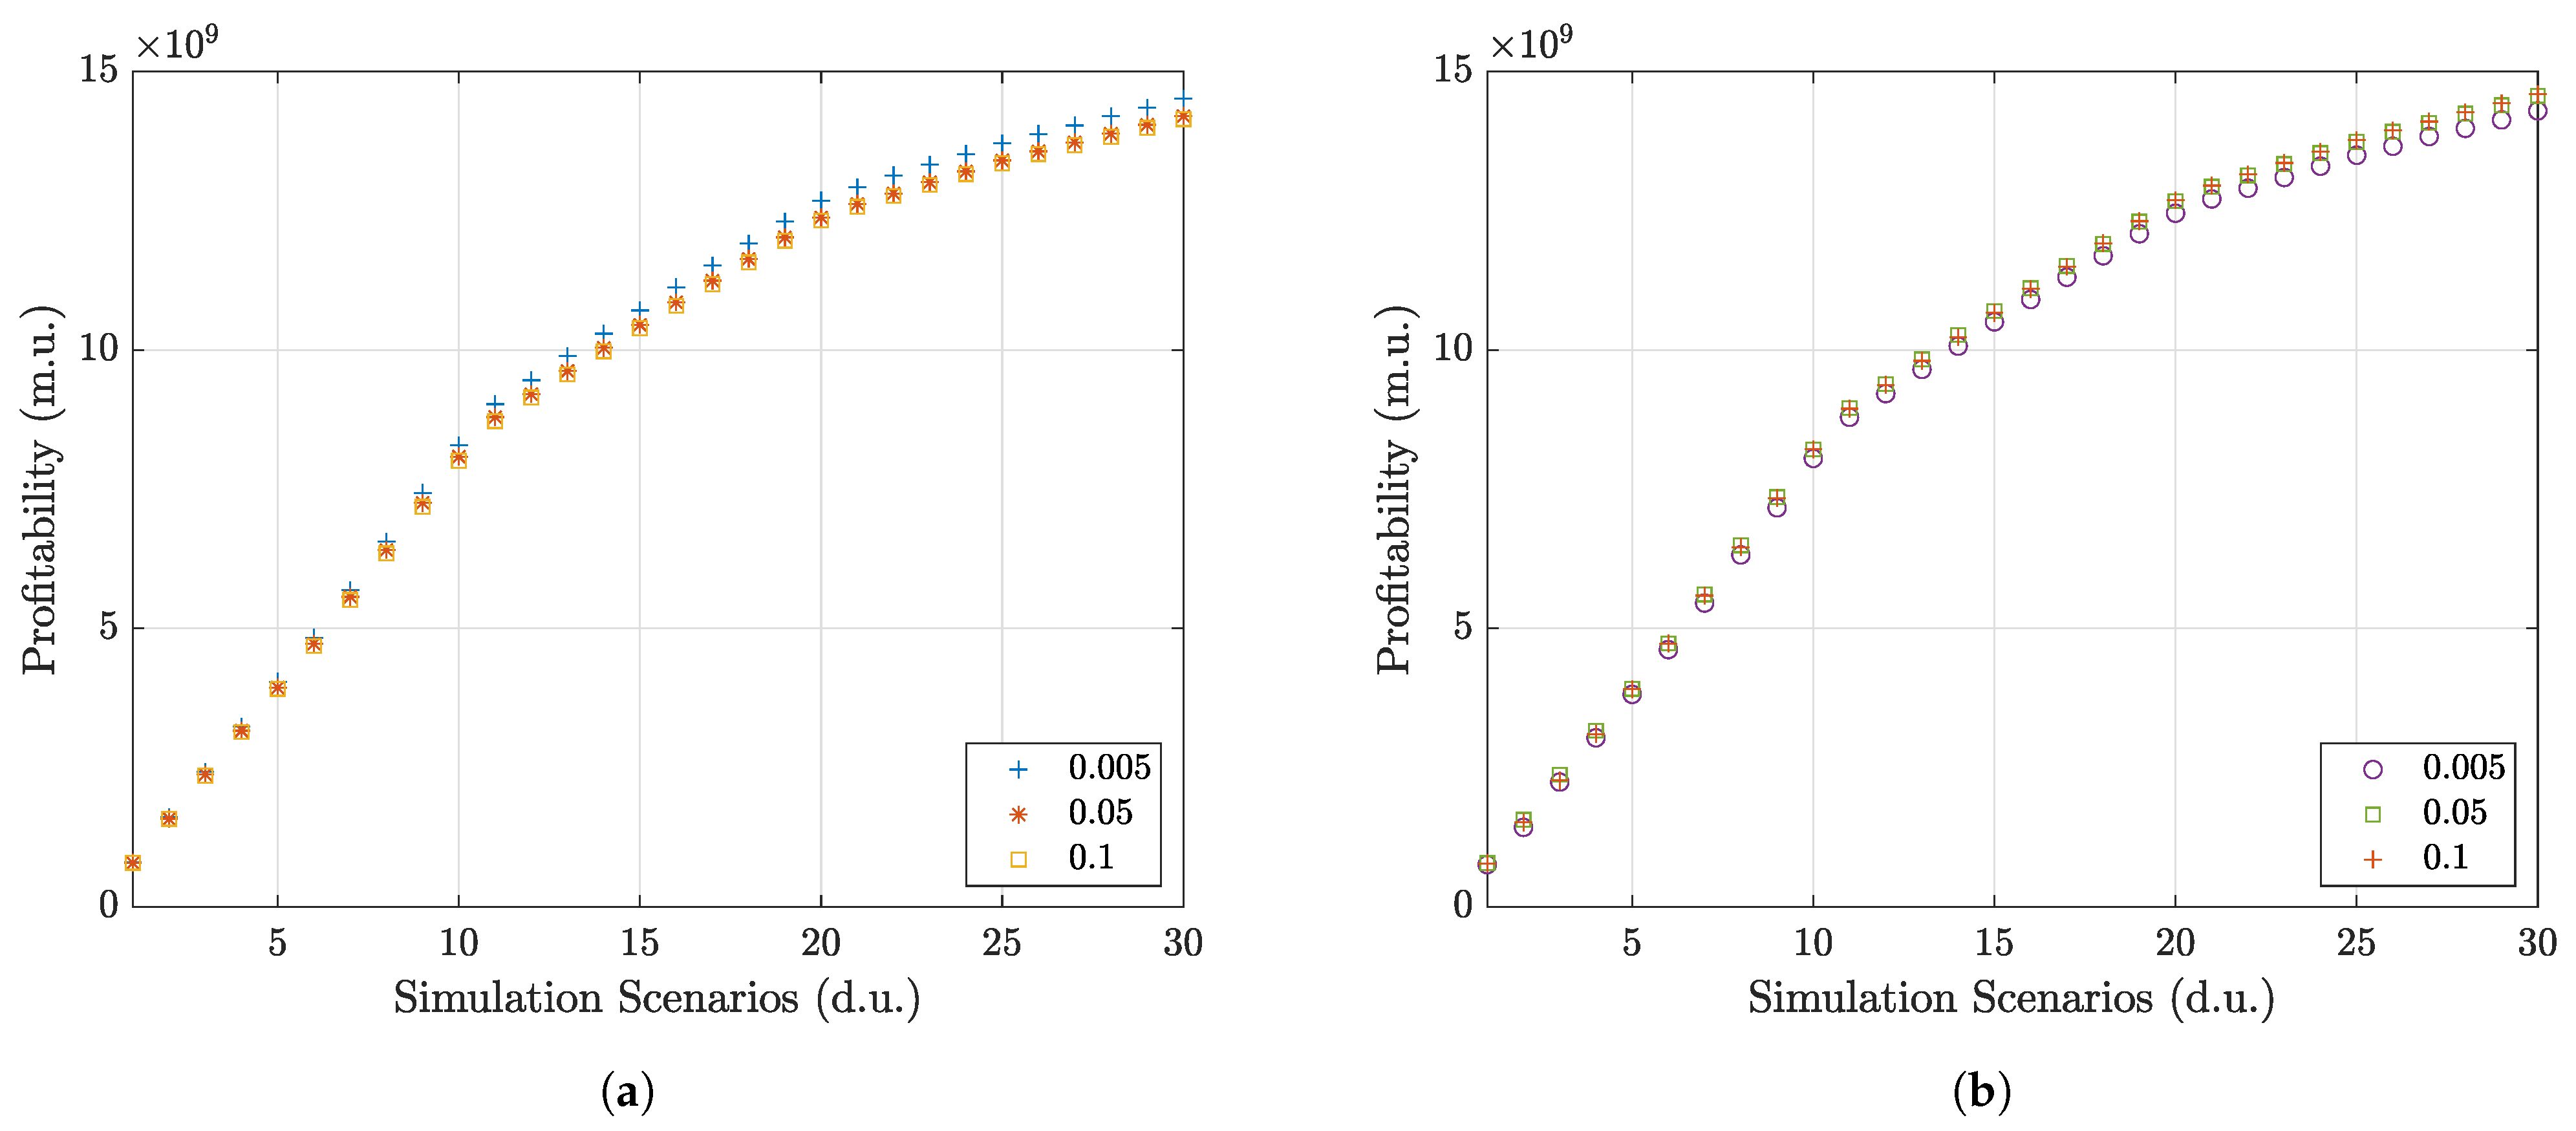
Figure 13a,b depict the effect of the variance of the hyper-parameters
and
upon the profitability of the system under RL(EK-CBM). It is depicted that both hyper-parameters affect the decision-making conducted by the agents of RL(EK-CBM). More specifically, in
Figure 13a, the
improves the performance of mechanism, when the former is equivalent to 0.005. This improvement is evident in simulation scenarios (e.g., scenario 20), wherein the system finds itself under frequent stochastic events, including increased order arrivals and recurrent system failures. In that case, it is likely that the agents initiated recurrent production and maintenance operations to address the current demand and deterioration within the system. This approach results in increasing the revenues in the system. Contrariwise,
Figure 13b indicates that the small value of
reduce the profitability of the system after scenario 20, where remanufacturing and refurbishing activities are not frequently authorized. Given the frequency of order arrivals and failures, the system did not produce enough products for customers. Instead, it is likely that it contained a large quantity of faulty products, which were scarcely remanufactured. As such, a substantial number of pending orders remained unfulfilled, resulting in increasing lost sales for the system.
6. Discussion
Due to the results presented above, one can suggest the proposed mechanism’s integration in real-world manufacturing plants. To better understand its applicability, let us examine the functionality of the presented reinforcement learning-based optimization framework in a real-world industry context. In this regard, the mechanism could gather data on the state of manufacturing machines involved in plants. These data could range from the quality of output inventory to the suppliers providing raw materials. Corresponding to the gathered data, the mechanism could make adjustments to operations, processes, output, and returned products, aiming at improving the revenue stream of the plant. Specifically, it was indicated in the previous section that the mechanism prefers reusing manufactured material over producing new items. Under these terms, the generation of low-cost products is supported by remanufacturing and refurbishing low-quality and used goods contained in inventory.
Furthermore, the mechanism could improve the efficiency and productivity of implemented manufacturing machine by generating make-to-stock items, given the demand awareness demonstrated by production policies, e.g., BS. Along with this, the machine could sustain the near-perfect condition of machines and output products through ad hoc maintenance policies, such as CBM. Summarizing the mentioned merits, the proposed reinforcement learning-based optimization framework supports smart lean-green manufacturing and enhances the decision-making happened on highly complex plants by intelligently automating the operation scheduling. Finally, despite being evaluated in a two-stage system, the proposed approach could be handily employed for a plethora of manufacturing systems, e.g., assembly systems, that regularly process items over multiple stages. In this context, the nature of the reinforcement learning/parametric control approach could be marginally modified by the decision-makers. This modification is feasible, as the approach does not require of an explicit model of manufacturing environments and involves configurable parameters that provide effective control over manufacturing and maintenance operations. Therefore, the presented mechanism could be considered as a robust and easily-configurable framework that could be employed in a breadth of real-world manufacturing applications, such as manufacturing scheduling.
Despite its strengths, the application of the proposed approach in real-world production systems might involve several challenges. This paragraph examines two challenges that might hinder the real-world implementation of the presented mechanism. Plausible solutions to these challenges are presented as well. The first challenge is the learning process of the agents. The agents would require a high amount of data to achieve optimal behavior within real-world production systems, given their complexity. This process could be costly and resource-intensive, as the RL agents learn by exploiting/exploring the state-action space. To tackle such a challenge, it would be sensible to implement the presented mechanism for the control of specific components of the systems, e.g., processing machines. The second challenge is the cross-domain application of the derived policies, as they are applicable to specific environments. To this, data mining techniques could be used for the creation of general production rules based on the derived policies. The feasibility of such an approach has been demonstrated in several publications [
29,
33].
Finally, the presented framework could be used and expanded by researchers, as it efficiently implements lean green in multi-stage manufacturing systems. In this regard, the framework is capable of minimizing material consumption, improving productivity and quality of the integrated operations, along with assuming an eco-friendly approach with lean green practices. Thus, it could be considered as a proof-of-concept of robust and smart lean green manufacturing framework implemented in a real-world-inspired manufacturing system, as the lean green manufacturing concept is novel, and its implications are still assessed by researchers [
50,
67]. Furthermore, the nature of the framework could facilitate researchers to effortlessly evaluate it in other manufacturing problems, e.g., job-shop scheduling, with marginal modifications. That is, the framework could be appropriately modified through its hyperparameters in order to tackle manufacturing decision-making problems, e.g., resource management, as it would be performant due to its illustrated awareness. Finally, the proposed methodology could be expanded with the functionality of lean tools, such as VSM and 5S, in an effort to compose a more holistic and sophisticated approach to lean manufacturing. This would pave the way for implementation of lean green manufacturing in high-complex environments, including supply chains.
7. Conclusions
In this paper, a two-agent scheduling framework was presented and implemented in a two-stage production system, prone to degradation. The aim of this implementation was to formulate a smart lean, and sustainable environment, having minimal environmental impact. To this end, the proposed scheduling framework combines RL-based decision-making with lean green manufacturing. Considering the latter, pull production, total productive maintenance and circular economy policies are considered. The experimental evaluation of the proposed mechanism demonstrated that the production system, controlled by the policies devised by the mechanism, succeeds at being profitable and sustainable. Implementing pull control and predictive maintenance policies, the mechanism promptly produces enough stock of standard products, without any disruption in manufacturing flow. As such, the storage costs and material consumption are dramatically reduced, as the manufacturing activities are authorized only when an order is placed. Furthermore, already produced material, forming faulty and returned items, is effectively being reused as well, extending the lifecycle of products.
In terms of performance, the results mentioned above are comparable to the ones presented in several publications [
60,
66]. That is, the framework can be considered as effective as the ones presented in cited literature. However, the functionality of the latter is focused and limited on the manufacturing problem and system studied in their respective publications. In that case, the applicability of the presented framework can be considered more robust and flexible. Analytically, the proposed mechanism can be applied to a plethora of manufacturing environments and research problems with minimal modifications, due to the nature of implemented amalgamation of reinforcement learning and parametric control policies. Furthermore, due to the employment of machine learning and lean green manufacturing strategies, it is clear that the presented approach facilitates the creation of smart lean and sustainable production environments in contrast to other methodologies, e.g., VSM [
47]. It can dynamically assess the manufacturing environment and tackle in real-time emerging issues, e.g., manufacturing waste, with joint policies related to operations, e.g., raw material procurement. In this regard, the proposed mechanism can be considered as a holistic solution to lean and sustainable production.
Concluding this section, future guidelines of this study are provided as follows. In future research, the mechanism could be employed for complex job-shop systems in an effort to tackle task scheduling problems. In that case, it would be imperative to construct a thorough model of the system applying to it machine learning algorithms, such as deep learning, since the task scheduling problems are rather multifaceted. Moreover, the proposed mechanism involved ad hoc policies for manufacturing and maintenance policies. To expand the mechanism’s functionality, one could include policies relevant to the procurement of raw materials, remanufacturing and refurbishing activities. Such an implementation would offer additional insights on activities, other than manufacturing and maintenance.


