Abstract
The distributed denial of service (DDoS) attack is one of the most pernicious threats in cyberspace. Catastrophic failures over the past two decades have resulted in catastrophic and costly disruption of services across all sectors and critical infrastructure. Machine-learning-based approaches have shown promise in developing intrusion detection systems (IDSs) for detecting cyber-attacks, such as DDoS. Herein, we present a solution to detect DDoS attacks through an ensemble-based machine learning approach that combines supervised and unsupervised machine learning ensemble frameworks. This combination produces higher performance in detecting known DDoS attacks using supervised ensemble and for zero-day DDoS attacks using an unsupervised ensemble. The unsupervised ensemble, which employs novelty and outlier detection, is effective in identifying prior unseen attacks. The ensemble framework is tested using three well-known benchmark datasets, NSL-KDD, UNSW-NB15, and CICIDS2017. The results show that ensemble classifiers significantly outperform single-classifier-based approaches. Our model with combined supervised and unsupervised ensemble models correctly detects up to 99.1% of the DDoS attacks, with a negligible rate of false alarms.
1. Introduction
Denial of service (DoS) is a cyber-attack that an adversary launches on a network service by sending a huge number of service requests, in various shapes and forms, beyond what the server can handle. The attack disrupts the normal functioning of the server and, depending on the severity, can result in a slowdown of performance or, ultimately, a complete shutdown. Distributed denial of service (DDoS), a more dangerous variant of DoS, attacks are often carried out by utilizing botnets from many different compromised devices that send simultaneous and coordinated service requests to the targeted server. DDoS, which was initially a tool used by hacktivists, has effectively been weaponized by cyber criminals to disrupt and extort organizations in ways that shut down operations and reduce accessibility to existing networking infrastructure capability.
The first reported DoS attack was perpetrated against Panix, the third-oldest internet service provider (ISP), in September of 1996 [1]. The first reported DDoS attack brought down e-commerce sites of large companies like Amazon, Yahoo!, eBay, Dell, and others in February of 2000 [2]. Despite numerous technological innovations devised to prevent and countermeasure DDoS attacks, according to NETSCOUT’s DDoS Threat Intelligence Report, there were approximately 7.9 million DDoS attacks in the first half of 2023, which is a 31% year-over-year increase.
Extensive research has been carried out to develop methods for detecting and preventing such attacks [3]. Typically, intrusion detection systems (IDSs) are based on known attack signatures as well as significant and unique heuristics. Unfortunately, these techniques are becoming less effective against these attacks, making them inadequate in detecting zero-day (i.e., unseen) attacks that have novel or hidden attack patterns with an unknown signature. Machine learning (ML)-based techniques are being employed to make detection more accurate and effective, thereby improving the reliability and resiliency of our networking infrastructure.
Three basic machine learning techniques, namely supervised, semisupervised, and unsupervised techniques, are used for differentiating network packets with anomalous content from those with normal content. Supervised methods use labeled datasets to differentiate anomalous instances from normal instances. Unsupervised methods use unlabeled datasets and create different clusters. Novelty and outlier detection strategies create “inlier” clusters with normal instances, where anomalous instances stay as outliers [4]. Semisupervised methods use small portions of labeled datasets for initially training the models and then continue with large amounts of unlabeled datasets.
1.1. Study Motivation
Most of the ML-based IDSs use one of the many classifiers to train their models for detecting DDoS attacks. However, different classification models learn the patterns in the datasets differently. Some DDoS-attack-related intrusions can be generalized well via simple linear classifiers, like logistic regression, while others may require more complex nonlinear classifiers, like support vector machines with kernels. Thus, a system that uses a combination of classifiers (i.e., an ensemble) performs better for generalizing different data patterns [5]. It has been shown that ML ensemble provides better accuracy and decisive results than individual data classifications [3,6,7,8]. This motivated us to employ ensemble-based classification for DDoS detection.
1.2. Contributions
The contributions of this work are enumerated below:
- Five standalone supervised and five unsupervised classifications were used, and their performance in detecting DDoS attacks were recorded.
- The classification results of individual supervised models were combined to create six ensemble models using (i) majority voting, (ii) logistic regression, (iii) naïve Bayes, (iv) neural network, (v) decision tree, and (vi) support vector machine.
- Similarly, the classification results of individual unsupervised models were combined to create six ensemble models.
- Comparative analyses demonstrated that, for both the supervised and unsupervised cases, the ensemble models outperformed the corresponding individual models.
- These supervised and unsupervised ensemble frameworks were then combined, providing results that detect both seen and unseen DDoS attacks with higher accuracy.
- Three well-known IDS benchmark datasets were used for experimentation and to validate the scheme. The detailed performance evaluation results with these datasets proved the robustness and effectiveness of the scheme.
- The scheme iwass further verified using a verification dataset consisting of ground truths.
1.3. Organization
The remainder of this article is organized as follows: In Section 2, we review machine-learning-based approaches to network intrusion detection from the literature. The threat model is given in Section 3. Section 4 describes the machine learning algorithms, including the ensemble mechanism, used in this study. The machine learning ensemble-based framework of the proposed solution is presented in Section 5. Experiments with the framework using the NSL-KDD, UNSW-NB15, and CICIDS2017 datasets are described in Section 6. The results of the experiments are discussed in Section 7. In Section 8, we present the conclusions and future work. Additional graphs and tables showing results for all three datasets are given in the Appendix A.
2. Related Work
Herein, we summarize the studies that focused on the detection of DDoS attacks using different machine learning methods and techniques. We also discuss how our method is different from those attempts and in what ways our method improves on the current state of this research area.
Belavagi and Muniyal [9] used supervised learning and Ashfaq et al. [10] used semisupervised learning to build training models to detect DDoS attacks. Meera Gandhi [11] investigated the performance of four supervised classifiers, including J48, IBk, multilayer perceptron (MLP), and naïve Bayes (NB), using the DARPA-Lincoln dataset [12] in detecting intrusion, including DoS. Perez et al. [13] used both supervised and unsupervised classifiers, including artificial neural network (ANN), support vector machine (SVM), k-nearest neighbor (kNN), principal component analysis (PCA), and generalized random forest (GRF). Villalobos et al. [14] proposed a distributed and collaborative architecture for a network intrusion detection system using an in-memory distributed graph, employing the unsupervised k-means method using a synthetic dataset composed of mainly DNS traffic. Jabez and Muthukumar [15] used the neighborhood outlier factor (NOF) for intrusion detection with a dataset that consisted of network data collected using snort, an open-source packet sniffer. Bindra and Sood [16] used only supervised methods, such as linear SVM, Gaussian NB, kNN, random forest (RF), logistic regression (LR), and linear discriminant analysis (LDA), using four datasets. However, none of these datasets included recent DDoS attacks. The best results obtained included a 96% accuracy with LR. Similarly, Lima-Filho et al. [17] used individual supervised ML models, namely, RF, LR, AdaBoost, stochastic gradient descent (SGD), decision tree (DT), and MLP, on the CIC-DoS, CICIDS2017, and CSE-CIC-IDS2018 datasets, producing similar accuracy.
Idhammad et al. [18] used sequential semisupervised learning and entropy estimation, coclustering, and information gain ratio for reducing the feature space and then used various extra-trees semisupervised methods to detect DDoS attacks on three public datasets, namely, NSL-KDD, UNB ISCX 12, and UNSW-NB15, obtaining accuracies of 98.23%, 99.88%, and 93.71% on those datasets, respectively. Suresh et al. [19] used chi-square and the information gain ratio for feature selection and then used NB, C4.5, SVM, kNN, K-means, and fuzzy c-means clustering methods, with fuzzy c-means clustering giving higher accuracy in identifying DDoS attacks. Usha et al. [20] used different machine learning algorithms (extreme gradient boosting, kNN, SGD, and NB) and a deep learning architecture (convolutional neural network (CNN)) to identify and classify attacks. The result showed that XGBoost achieved the highest accuracy, while CNN and kNN also gave comparable figures. They used the CICDDoS2019 dataset for validating their approach. Zhang et al. [21] presented a detection algorithm that combines the power spectral density (PSD) entropy function and SVM to detect low-rate DoS (LDoS) traffic from normal traffic. The decision algorithm uses the detection rate and efficiency as adjustable parameters. Yuan et al. [22] used a recurrent neural network (RNN) to learn patterns from sequences of network traffic and trace network attack activities. They reported an error rate of 2.103% in their validation of the approach using the UNB ISCX Intrusion Detection Evaluation 2012 dataset. Hou et al. [23] proposed a hybrid scheme whereby the features in the traffic data are selected using NetFlow, and the attack detection is determined using a number of supervised machine learning methods, including SVM, C4.5 DT, Adaboost, and RF. They reported a 99% accuracy with a 0.5% false-positive rate on the CICIDS 2017 dataset.
Ensemble [5] is a way of combining multiple classifiers to achieve better performance compared to that of a single classifier, and many classification problems have benefited from this idea. There are generally two types of ensembles: homogeneous and heterogeneous. In homogeneous ensembles (e.g., bagging and boosting), a number of similar types of classifiers are combined to build the training model. In heterogeneous ensembles (e.g., stacking) [24], different types of classifiers are combined to construct the training model. Aburomman and Riaz [3] provided a detailed survey of ensembles with homogeneous, heterogeneous, and hybrid classifiers and the usage and shortfalls of machine learning ensembles in network security. Smyth et al. [25] used stacked density estimation and showed that this outperforms the best single-classifier models. Hybrid supervised models were used by Hosseini and Azizi [26] for DDoS detection. Das et al. [6,7] used supervised and unsupervised ensemble for detecting DDoS attacks using the NSL-KDD dataset. Xiang et al. [27] improved the supervised model’s accuracy by combining supervised and unsupervised models using MAP estimation with the quasi-Newton method to obtain the coordinates’ mapping embedded space into the object–group co-occurrence matrix.
Mittal et al. [28] surveyed deep-learning-based DDoS attack detection proposals in the literature. They compared the different works based on ‘accuracy’, which is not a useful performance metric to determine the attack detection capability of the techniques. Nevertheless, they reported that the best accuracy rating among the methods they surveyed was 99.1% on the NSLKDD dataset and 99.9% on the CICIDS2017 dataset. They also observed that there was a lack of work on unseen data and zero-day attacks.
Our literature review shows that a number of researchers used only supervised methods or unsupervised methods for DDoS detection; however, none of them used ensemble-based approaches that combine both supervised and unsupervised methods. Unlike these previous studies, we devised an effective scheme that forms two sets of stacking ensembles, one consisting of supervised models and another of unsupervised models. The detection of DDoS attacks is achieved by the best-performing models from each set. The framework supports feature selection, hyperparameter tuning, and data curation. Table 6 in Section 6 gives a comparative performance summary of our work with some existing works.
3. Threat Model
In a DDoS attack, an adversary uses a network of bots to overload the targeted server with a flood of service requests. This overwhelms the request-handling capacity of the server, rendering it unable to process legitimate service requests properly or at all, hence effectively denying the service.
The threat model used in this study assumes that
- The DDoS traffic originates from many different compromised hosts or botnets.
- The attacks can be caused by IP spoofing or flooding requests.
- The attacks can target the different OSI layers of the target network.
- Either high-volume traffic (including DNS amplification) or low-volume traffic can cause a DDoS attack.
- The attackers can initiate various attack vectors, including Back Attack, Land Attack, Ping of Death, Smurf Attack, HTTP Flood, Heartbleed, etc. (more information about these DDoS attacks can be found in Balaban [29]).
Our proposed method, combining supervised and unsupervised ensemble, is capable of detecting these DDoS attacks while having a very low false-positive rate. We applied an empirical validation approach (i.e., experiment-based) to this threat model by analyzing the results of the experiments. The validation process also compared the results with those of existing methods.
4. Machine Learning Algorithms
In this section, we list the single-classifier machine learning algorithms used to construct the ensemble frameworks and briefly describe the ensemble model used in our proposed scheme. The single-classifier ML algorithms are well known in the literature, and a good overview of these learning algorithms can be found in [30].
4.1. Supervised Learning Algorithms
Supervised learning algorithms use labeled data, i.e., where the training data instances are marked or “labeled” with known correct responses. The five supervised learning algorithms used in the supervised learning framework are
- Logistic regression;
- Support vector machine;
- Naïve Bayes with Gaussian function;
- Decision tree
- Neural networks.
4.2. Unsupervised Learning Algorithms
Unsupervised learning algorithms are trained using unlabeled data. The algorithm searches for similarities among the inputs so that inputs having commonalities are grouped (i.e., categorized) together. The algorithm learns hidden patterns from the input data characteristics. Later, these learned patterns are used to predict responses to test inputs. The five unsupervised learning algorithms used are as follows:
- One-class SVM with linear kernel;
- One-class SVM with polynomial kernel;
- Isolation forests;
- Elliptic envelope;
- Local outlier factor.
4.3. Ensemble Learning Method
The ensemble learning method is a meta approach that combines multiple machine learning (ML) algorithms. These ensembles have been shown to provide better predictive performance than those of any of the constituent algorithms alone. There are two broad categories of ensembles: homogeneous and heterogeneous. In homogeneous ensembles, for example, bagging and boosting, a number of similar types of classifiers are combined to build one training model. In heterogeneous ensembles, like stacking, different types of classifiers are combined to construct the training model.
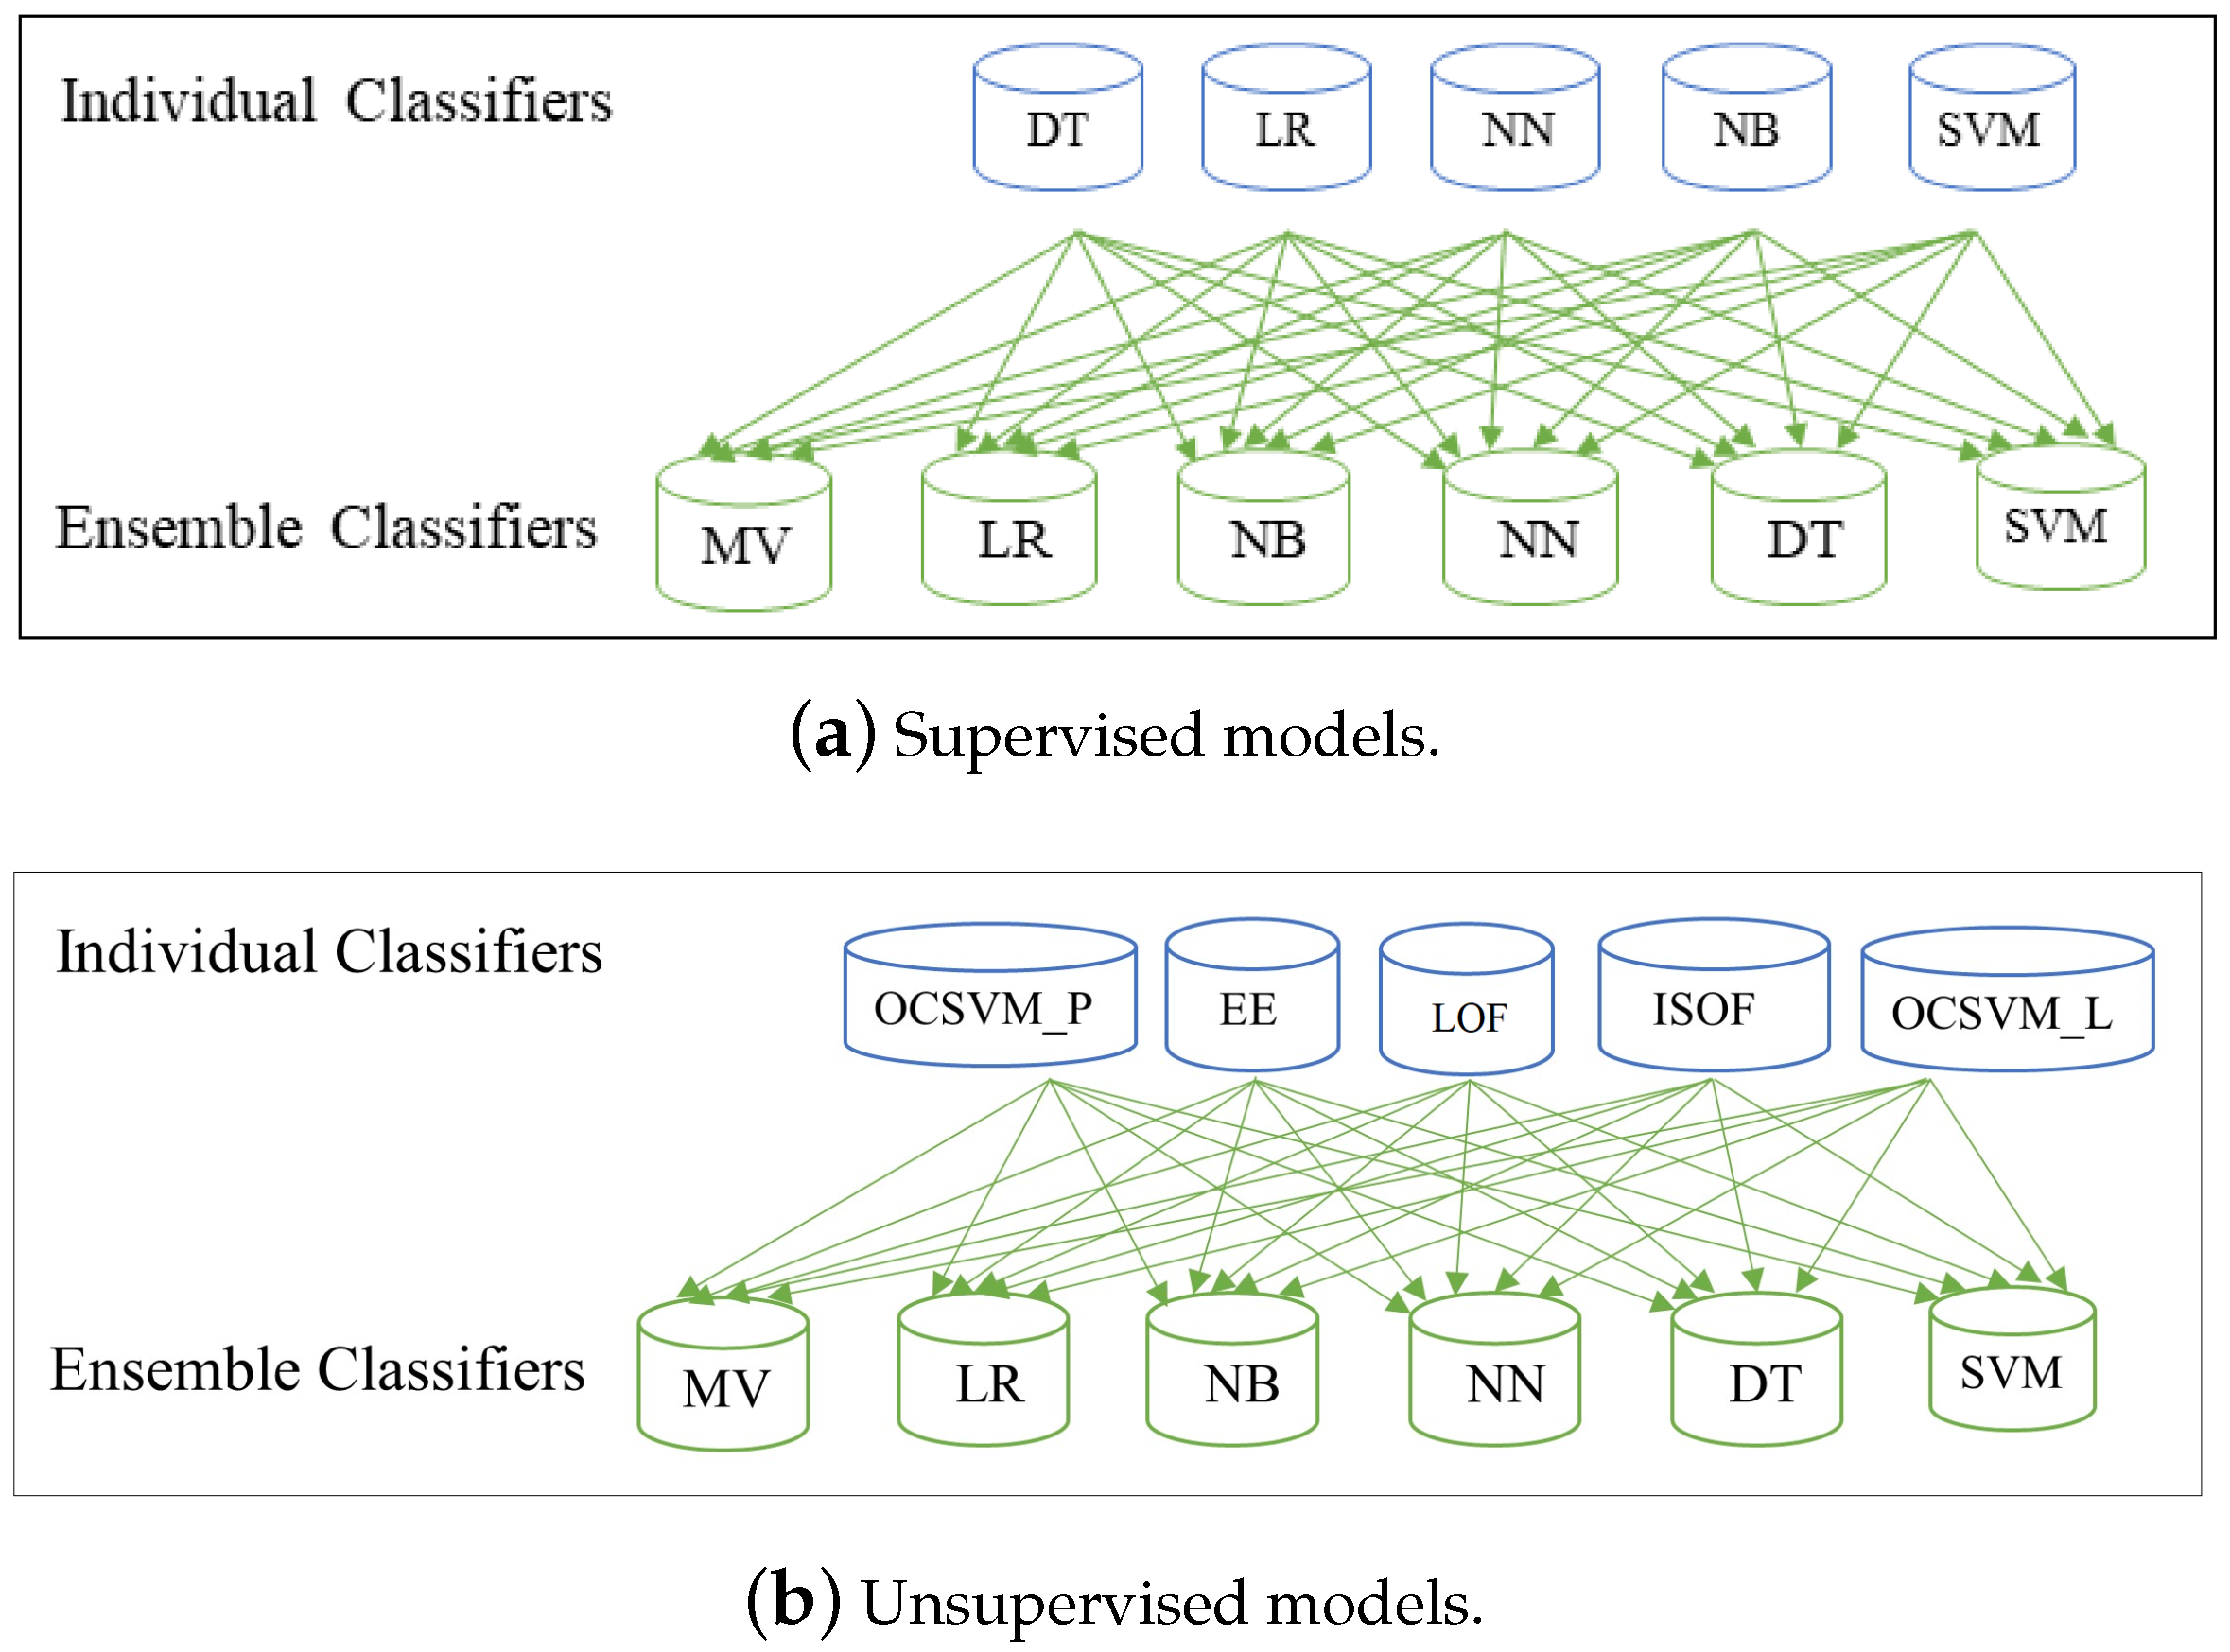
In this work, we used heterogeneous ensemble learning. We stacked five supervised learning algorithms to construct one set of ensemble models and separately stacked five unsupervised learning algorithms to construct another set of ensemble models. Each set of these two ensemble models was created using six metaclassifiers to classify the outcomes from five individual models. The metaclassifiers included majority voting (Ens_MV), logistic regression (Ens_LR), naïve Bayes (Ens_NB), decision tree (Ens_DT), neural network (Ens_NN), and support vector machine (Ens_SVM). Again, these meta-classifiers are ensemble classifiers that combine multiple ML algorithms.
In this paper, we use the terms metaclassifiers and ensemble classifiers interchangeably. The ensemble process we used is detailed in Section 5. Figure 1 illustrates how the individual classifiers are combined in the ensemble models.

Figure 1.
Illustration of how the individual classifications are combined using different ensemble models.
5. Proposed Method
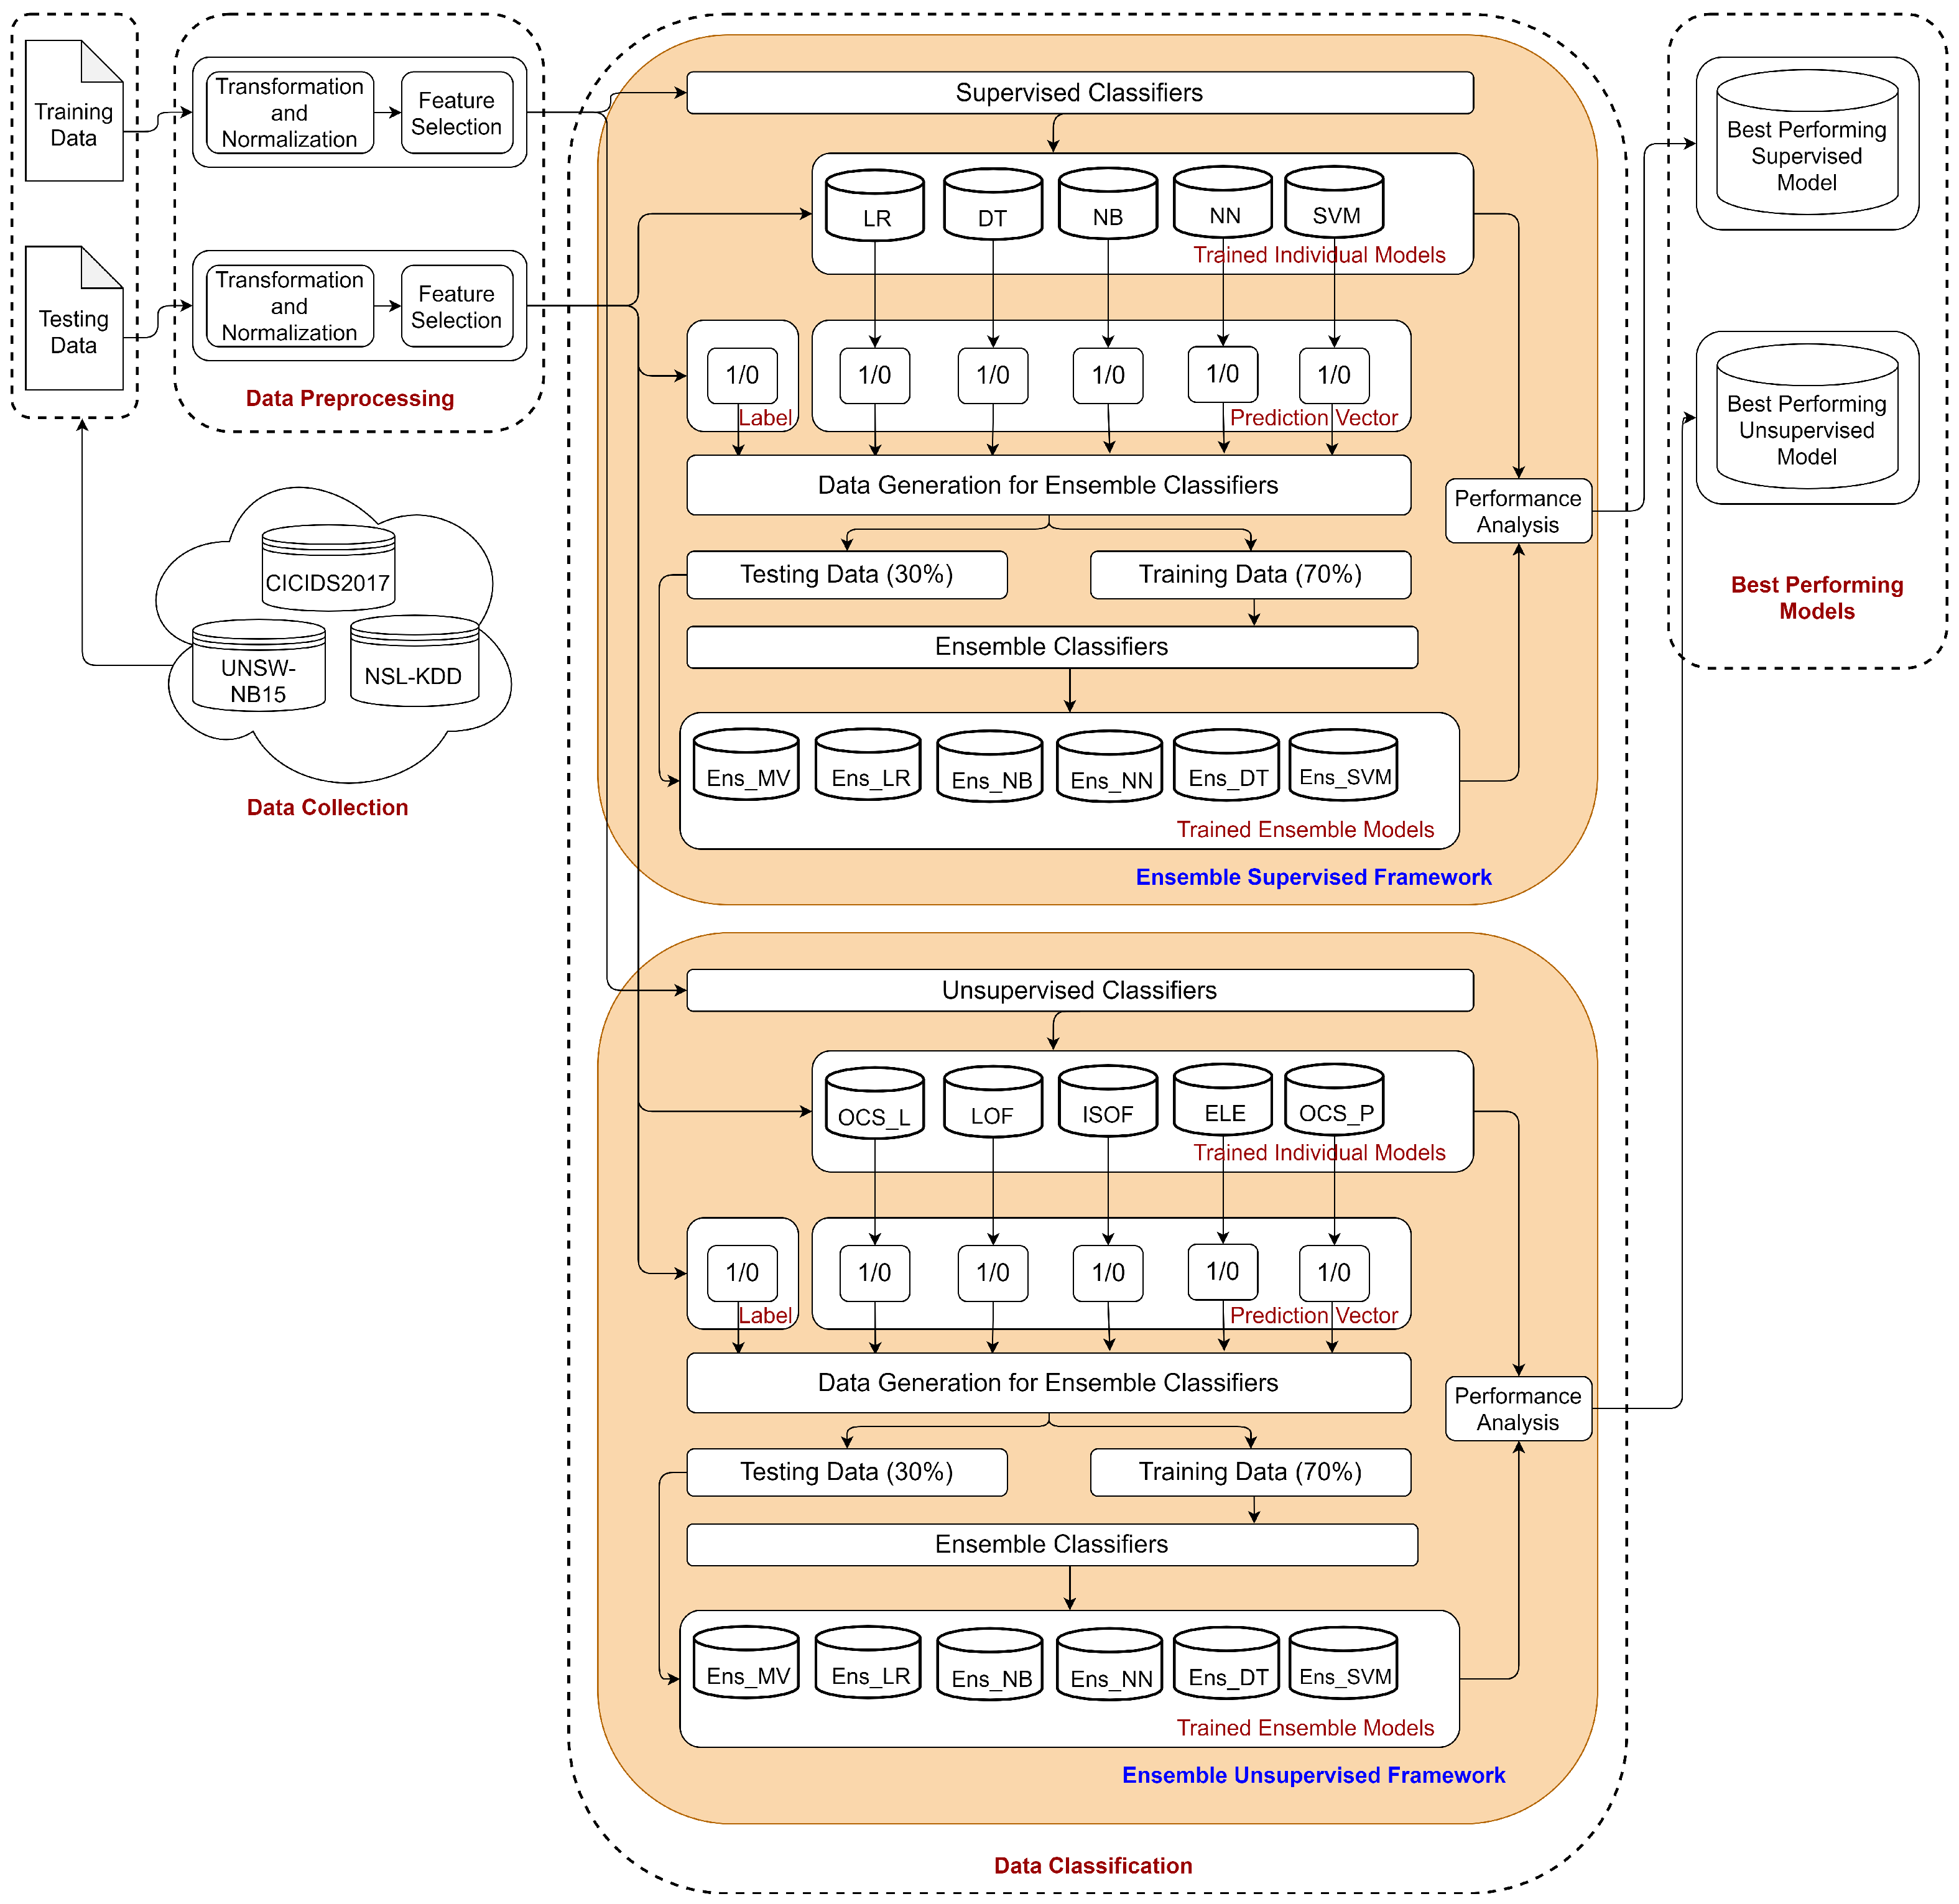
This section describes the proposed ensemble-based DDoS attack detection scheme. Figure 2 depicts the detailed architectural diagram of the process flow. The individual processing phases are (1) data collection, (2) data preprocessing, (3) feature selection, (4) data classification, and (5) DDoS detection.
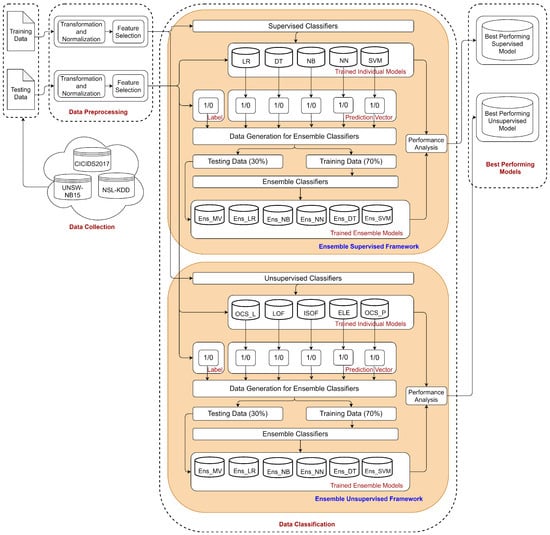
Figure 2.
Process flow of the proposed ensemble approach to detect DDoS attacks.
5.1. Data Collection
For the data collection phase, we used three well-known benchmark datasets (i) NSL-KDD, (ii) UNSW-NB15, and (iii) CICIDS2017. These datasets are described in detail in Section 6.2. Each dataset has two subsets of data instances: the training set and the testing set. In addition, we set aside 1000 randomly chosen data instances to be used as verification data to simulate real-time traffic. The verification data were not used before either for training or for testing purposes.
5.2. Data Preprocessing
During the data preprocessing phase, the data are sanitized by converting the data, scaling, removing invalid data, etc. The details of data preprocessing are described in Section 6.3.
5.3. Feature Selection
Feature selection is used to reduce the number of features or dimensions in the input data instances. This process ranks the features according to their contribution or impact on classifications. After the ranking, the least important features can be removed from the training data. Different inbuilt selection mechanisms or domain knowledge are used for feature selection. Feature selection helps the model achieve optimal model performance in the shortest elapsed time. Section 6.4, discusses feature selection methods for the datasets.
5.4. Data Classification
The data classification phase represents the core of our ensemble approach. There are primarily two functions: the supervised and the unsupervised ensemble frameworks. Each framework consists of two layers of classifications. In the initial layer, 5 different individual classifiers are invoked to classify data. In the 2nd layer, the output from the initial layer classifiers are used for input to 6 different metaclassifiers. Afterward, all individual and ensemble models are evaluated using the standard performance metrics for selecting the best-performing model.
Figure 2 identifies two ensemble frameworks used for the data classification phase. The construction mechanism of these two ensemble frameworks are nearly the same. However, they are derived from two different types of classifiers, one is supervised and the other unsupervised. Hence, the framework performs data classification using both supervised and unsupervised ML algorithms.
As mentioned above, individual classification is performed, and then the outcomes from these individual models are fed to ensemble classifiers to combine them. Combining these outcomes requires the creation of a prediction matrix. Prediction matrices are binary matrices containing the outputs from individual models, with each row corresponding to one record from the input dataset. Each cell contains either a “1” or a “0”. The value of an element is “1” if the corresponding model identifies the record as “DDoS”, and as “0” if identified as “Benign”. Five individual models (both supervised and unsupervised) are used to generate a prediction matrix; each column of the matrix is treated as a feature or dimension for the ensemble classifiers. Appended by the label, the prediction matrix forms the data for ensemble classifiers. This dataset was divided into training and testing data (70:30 ratio). Then, we trained and tested six ensemble classifiers. The ensemble classifiers used in both frameworks are ensemble majority voting (Ens_MV), ensemble logistic regression (Ens_LR), ensemble naïve Bayes (Ens_NB), ensemble neural network (Ens_NN), ensemble decision tree (Ens_DT), and ensemble support vector machine (Ens_SVM).
The performance of all individual classifiers and their respective ensemble models were measured and compared using standard model evaluation metrics, which are detailed in Section 7.1. Thus, the best-performing supervised and unsupervised models were identified and chosen from the two different ensemble frameworks, resulting in one from each model type (i.e., supervised and unsupervised).
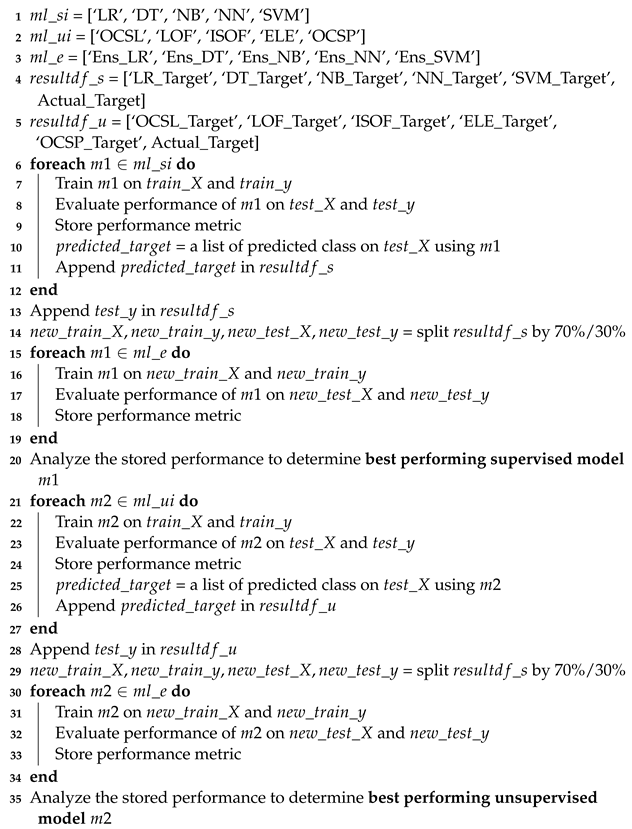
The Ensemble Algorithm
The ensemble algorithm for combining supervised and unsupervised models implements the ensemble framework. The algorithm is given in Algorithm 1. The algorithm starts by initializing a list of machine learning models for individual supervised (), individual unsupervised () and ensemble () classifications in lines 1–3. Also, the data structure for storing the individual model prediction results is initialized here as and for supervised and unsupervised classifications, respectively. In lines 6–12, each supervised individual models are trained, evaluated, and the prediction matrices are stored in the data structure, . The accumulated results are used for ensemble classification as a new dataset where the individual classification outputs serve as features and the target is derived from the ground truth in the original dataset. This new dataset is consequently split 70%/30% as training and testing sets respectively, for the ensemble classification as is shown in lines 15-18. After analyzing and comparing the performance of five individual and six ensemble models, the best-performing supervised model is retained. The operations in lines 21–27 are similar to lines 6–12, but in this round the unsupervised classifiers are invoked. Similarly, the prediction matrices obtained from these individual unsupervised models are accumulated and a new dataset is created for ensemble classification. Again lines 30–34 perform the same operations as lines 15–19, but with this different datasets. Finally, the algorithm produces the two best-performing models: from the supervised ensemble framework and from the unsupervised ensemble framework, which are subsequently used later for DDoS detection purposes.
5.5. DDoS Detection
Once the individual and ensemble classifier models are trained in the previous phase and the best-performing supervised and unsupervised models are identified, these models then can be deployed on the perimeter of a real-world network to detect DDoS intrusions as part of an IDS. Figure 3 depicts the flowchart of the DDoS detection mechanism using these models in the ensemble framework. The network traffic undergoes data preprocessing steps, where they are sanitized, feature-reduced, and then classified by the ensemble framework that detects any DDoS attack and provides an alert regarding it.
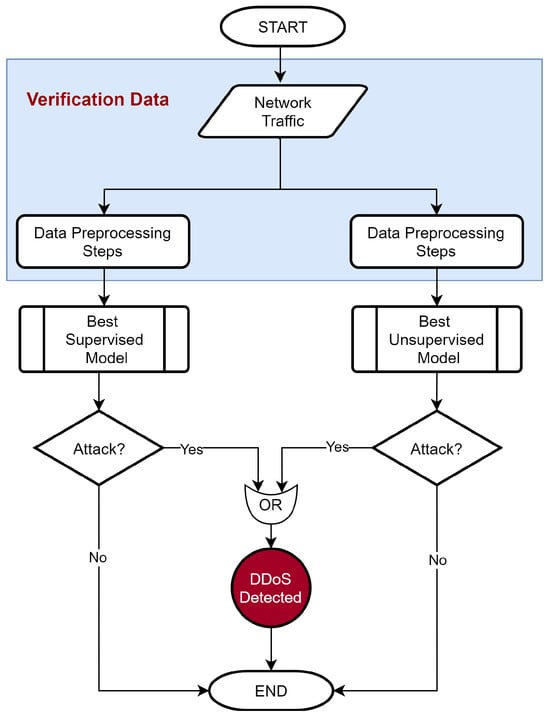
Figure 3.
DDoS detection using the combined best performing supervised and unsupervised models.
In our experimental setup, we used verification data (described in Section 5.1) to mimic the real-time network traffic.
| Algorithm 1: Combined ensemble (supervised and unsupervised) classification |
| Input: train features, train target, test features, test target |
| Output: , best-performing supervised and unsupervised models |
 |
6. Experiments
In this section, we present the set of experiments performed with the ensemble framework using three benchmark datasets, which have been thoroughly studied.
6.1. Software and Hardware Preliminaries
Our proposed ensembling framework iwass implemented using the Python programming language and the Python machine learning library scikit-learn [31]. The experiments were carried out on a computer with an Intel® CORE™i5-6600K CPU@3.50GHz and 8 GB memory running a 64-bit Ubuntu Linux operating system.
6.2. Datasets
In this study, three different datasets, as mentioned above, were used for experimentation, as shown in Table 1. The details include, for example, the number of instances that were used in the experiments for training, testing, and verification purposes across both supervised and unsupervised techniques. Next, we briefly detail those datasets.

Table 1.
Data instances within datasets used for experimentation.
6.2.1. NSL-KDD Dataset
The NSL-KDD dataset was created by curating the KDD’99 dataset [32]. Although the NSL-KDD dataset may not be a perfect representative of existing real networks, it can be applied as an effective benchmark dataset to help researchers compare different intrusion detection methods. The dataset contains eight data files of different formats that are compatible with most experimental platforms. The dataset consists of 41 predictor attributes and 1 target attribute, indicating 1 of 39 different attacks. Out these 39 attacks, 10 of them are DDoS attacks, namely, back, land, neptune, pod, smurf, teardrop, apache2, mailbomb, processtable, and udpstorm.
6.2.2. UNSW-NB15 Dataset
The UNSW-NB15 dataset [33] was created in the Cyber Range Lab of the Australian Centre for Cyber Security (ACCS) at the University of New South Wales using the IXIA PerfectStorm tool. A well-known network too, tcpdump, was used to capture 100 GB of raw network traffic. This dataset has nine different types of attacks. For our experiment, we retained the DDoS attacks and filtered out the others. The dataset has a total of 49 features including the class label.
6.2.3. CICIDS2017 Dataset
The CICIDS2017 [34] dataset was created by the Canadian Institute for Cybersecurity at the University of New Brunswick, Canada. The dataset was created by capturing network traffic for 5 days and then labeling the attack and normal data using CICFlowMeter tool based on timestamps, source and destination IPs, source and destination ports, protocols, and attacks. The attacks include brute-force FTP, brute-force SSH, DoS, heartbleed, web attack, infiltration, botnet and DDoS. In the preprocessing phase, we retained data instances related to only the DDoS attacks and filtered out all the other attacks.
6.3. Data Preprocessing
The text-based categorical variables in all three datasets were label-encoded, i.e., converted to integer-based categorical variables, using OneHot encoding. OneHot encoding was also applied to the CICIDS2017 dataset to convert the categorical values into numeric values. The column ‘id’ from the UNSW-NB15 dataset was deleted. The single space before each of the feature names in the CICIDS2017 dataset were stripped. Rows that contained invalid values such as “.” or “infinity” in some columns were discarded. We used standard scaling mechanism to normalize the data to handle the variation in data ranges. The standard scaling standardized features by removing the mean and scaling to unit variance.
Because normal network traffic represents by far most of the data instances, all three datasets are imbalanced. Roughly 90–95% of the data instances are normal traffic, while only about 5–10% of the data represent attack traffic. For the supervised methods to work well, the database must be balanced, i.e., the ratio of attack to nonattack data instances should be roughly 50:50. Therefore, suitable balanced datasets are needed for supervised learning. Thus, normal and anomalous data instances from the training dataset were separated, and data instances containing only the DDoS attacks were extracted. From this point, the DDoS attack data were added to the normal data to prepare the training dataset that was used to train the supervised models. Similarly, to prepare the input datasets for the unsupervised models, we separated normal and anomalous data to generate new training datasets that contained 99% normal data, leaving just 1% of the data to represent the actual DDoS attack data.
For both the supervised and unsupervised experiments, we randomly selected 1000 data instances for verification purposes from the testing datasets. The remaining of the testing data were used for testing. For unsupervised training, we stripped off the target variable column. Table 1 shows the numbers of benign (normal) and DDoS (anomalous) data used for training, testing, and verification purposes for both the supervised and unsupervised methods.
6.4. Feature Selection
No feature selection was performed for the CICIDS2017 dataset, as DDoS detection with this dataset yielded close to 100% detection. A set of 12 experiments, each with a specific set of (reduced) features, was performed for the NSL-KDD dataset. Table 2 shows the list of 11 feature sets plus a set that contained all 41 features. These 11 sets of features were found as potential candidates by different researchers in the literature.For the UNSW-NB15 dataset, we experimented with seven feature selection algorithms [35], and the best-performing feature set was used in the main experiment. Among the seven algorithms, the chi-squared feature selection method yielded the most optimized feature set.
Table 2.
Reduced feature sets for NSL-KDD dataset that were used in experiments (adopted from [6]).
6.5. Model Selection
We experimented with a number of well-known classifiers using a grid-search algorithm to fine tune the hyperparameters for the models and then chose the top five supervised and top four unsupervised classifiers based on their performance in binary classification and anomaly detection. The hyperparameters used for these classifiers can be found in [8]. We used 10-fold cross-validation during model training to avoid overfitting and to generate robust models.
7. Results and Discussion
7.1. Evaluation Metrics
The metrics used for evaluating the machine learning models were derived from the confusion matrix [30]. As shown in Table 3, the confusion matrix contains the four categories of outputs from a binary classifier. For our case here, the categories were (1) true positive (TP), when the model correctly identifies a DDoS attack; (2) true negative (TN), when it correctly identifies benign data; (3) false positive (FP), when it incorrectly identifies benign data as a DDoS attack; and (4) false negative (FN), when the model incorrectly identifies a DDoS attack as benign.
Table 3.
The confusion matrix.
This study used the following standard evaluation metrics to measure the performance of the models [36]:
- Accuracy []: the percentage of true DDoS attack data detection over total data instances.
- Precision []: the measurement of how often the model correctly identifies a DDoS attack.
- False-positive rate (FPR) []: how often the model raises a false alarm by identifying a normal data instance as a DDoS attack.
- Recall []: the measurement of how many of the DDoS attacks the model does identify correctly. Recall is also known as the true-positive rate, sensitivity, or DDoS detection rate.
- F1 score []: the harmonic average of precision and recall.
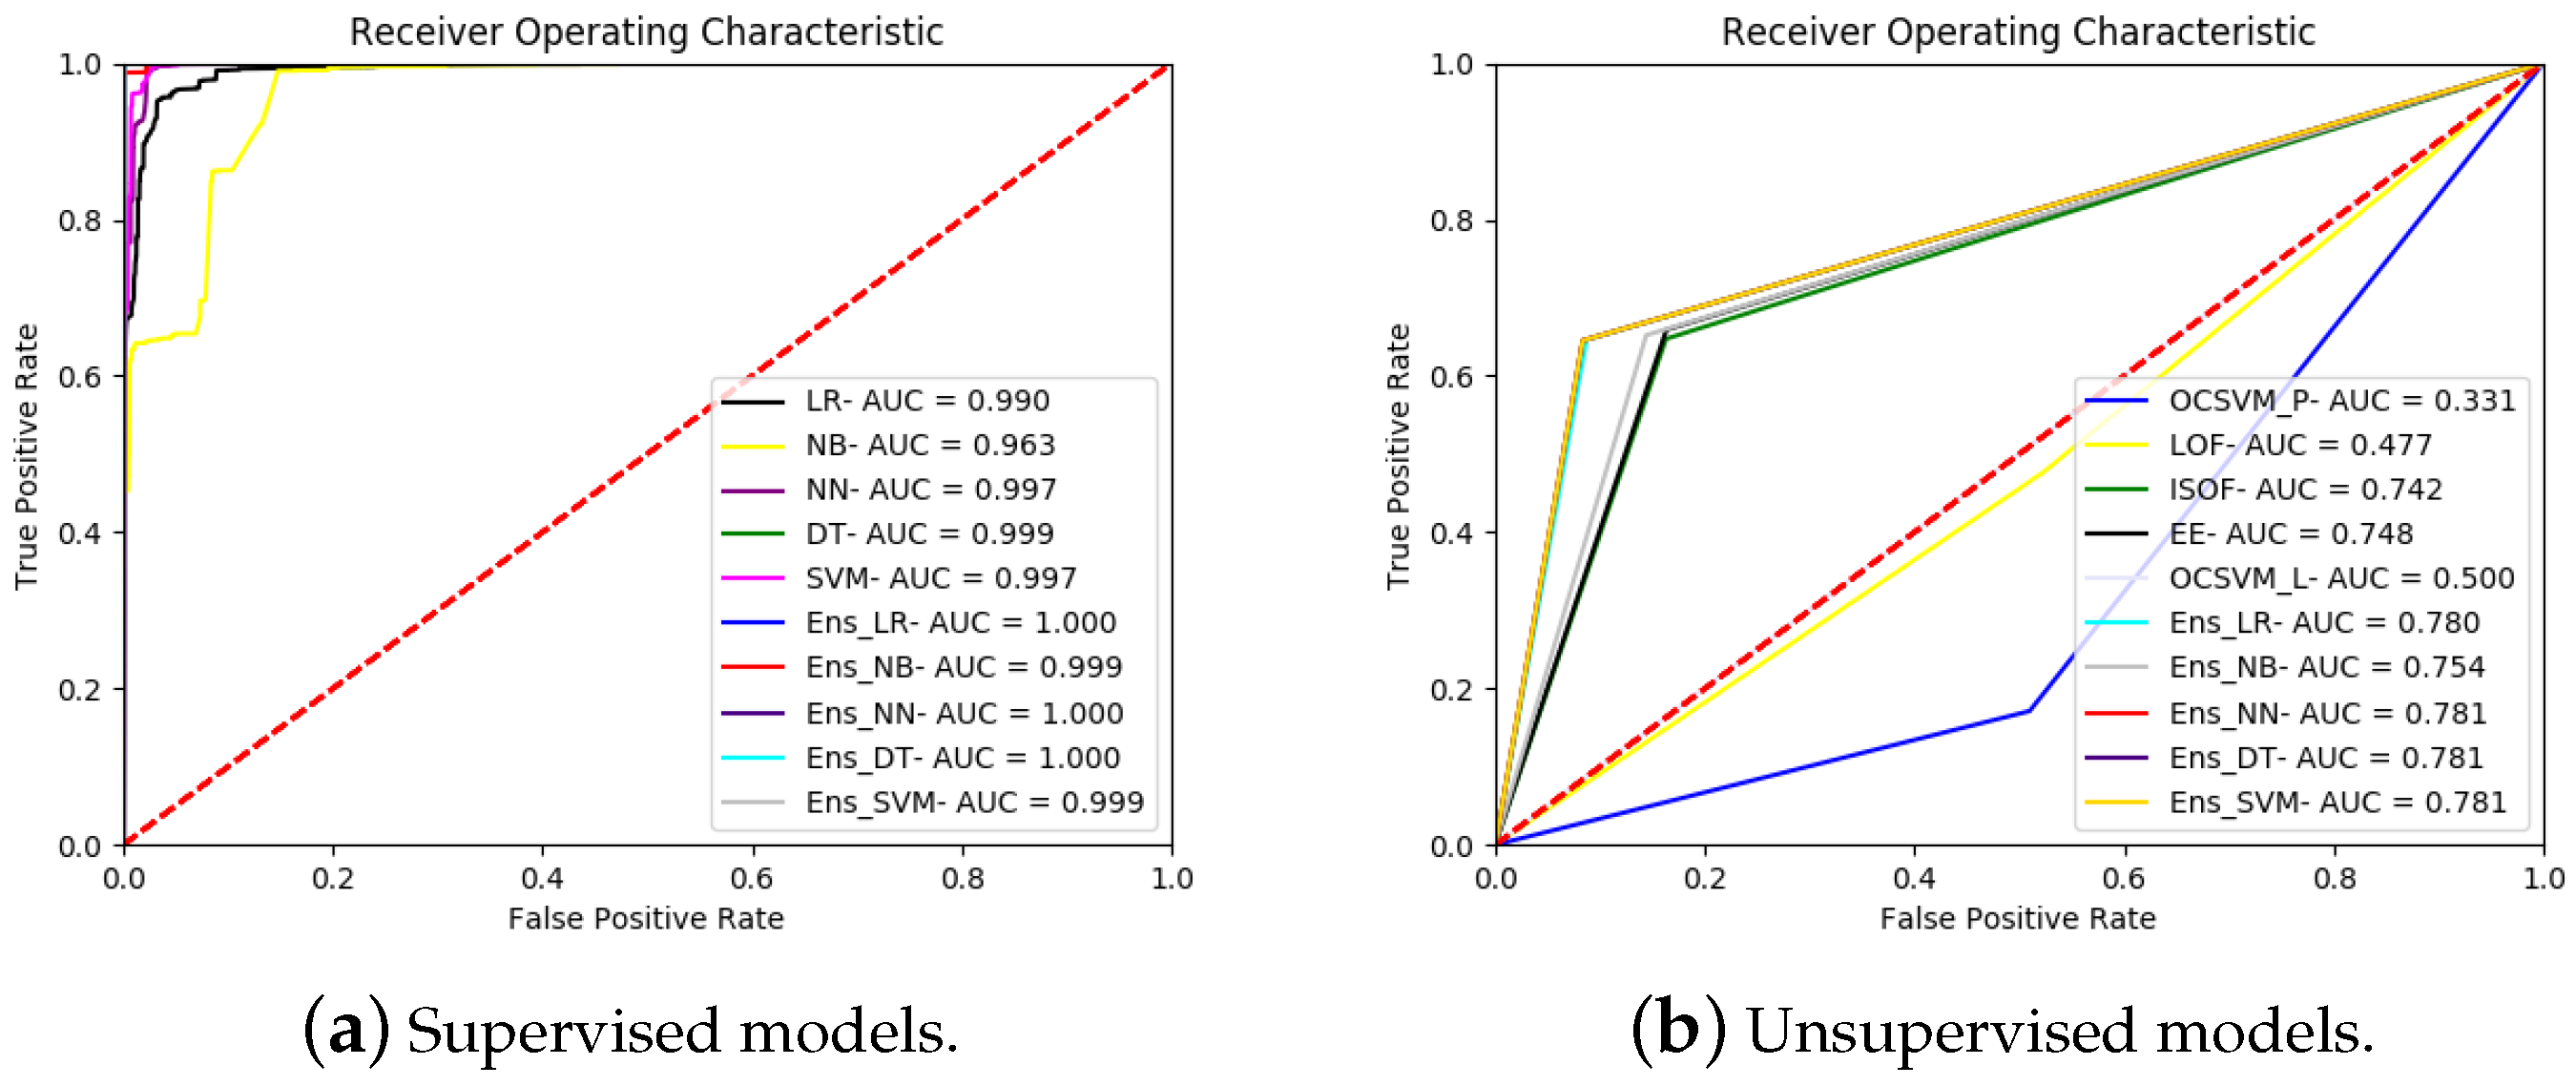
We also used the ROC AUC score, which provides the diagnostic ability of binary classifiers. The ROC curve is a plot of the true-positive rate (TPR) against the false-positive rate (FPR). In DDoS detection, the higher the ROC, the better the model at discriminating DDoS from benign traffic. We also measured the elapsed times for training and testing for each model.
7.2. Discussion of Results
In this section, we discuss the results of the experiments running the ensemble framework with the different datasets.
Initially, we performed classifications using individual supervised and unsupervised models. After performing 10-fold cross-validation for all models using these three datasets, the values for training accuracy were between 92.3 and 98.7%, which denote that our models were trained correctly. For NSL-KDD dataset, we experimented twelve times using the twelve different feature sets listed in Table 2. Since the supervised and unsupervised classification techniques are different in nature but black boxes to users, they produce different types of outcomes. With the NSL-KDD dataset, the dataset with the FS-7 feature set provided the best performance for supervised models, and FS-9 provided the best performance for the unsupervised models.
Owing to space constraints, we show the detailed results for the three datasets in the Appendix A. Here, we discuss only the best models.
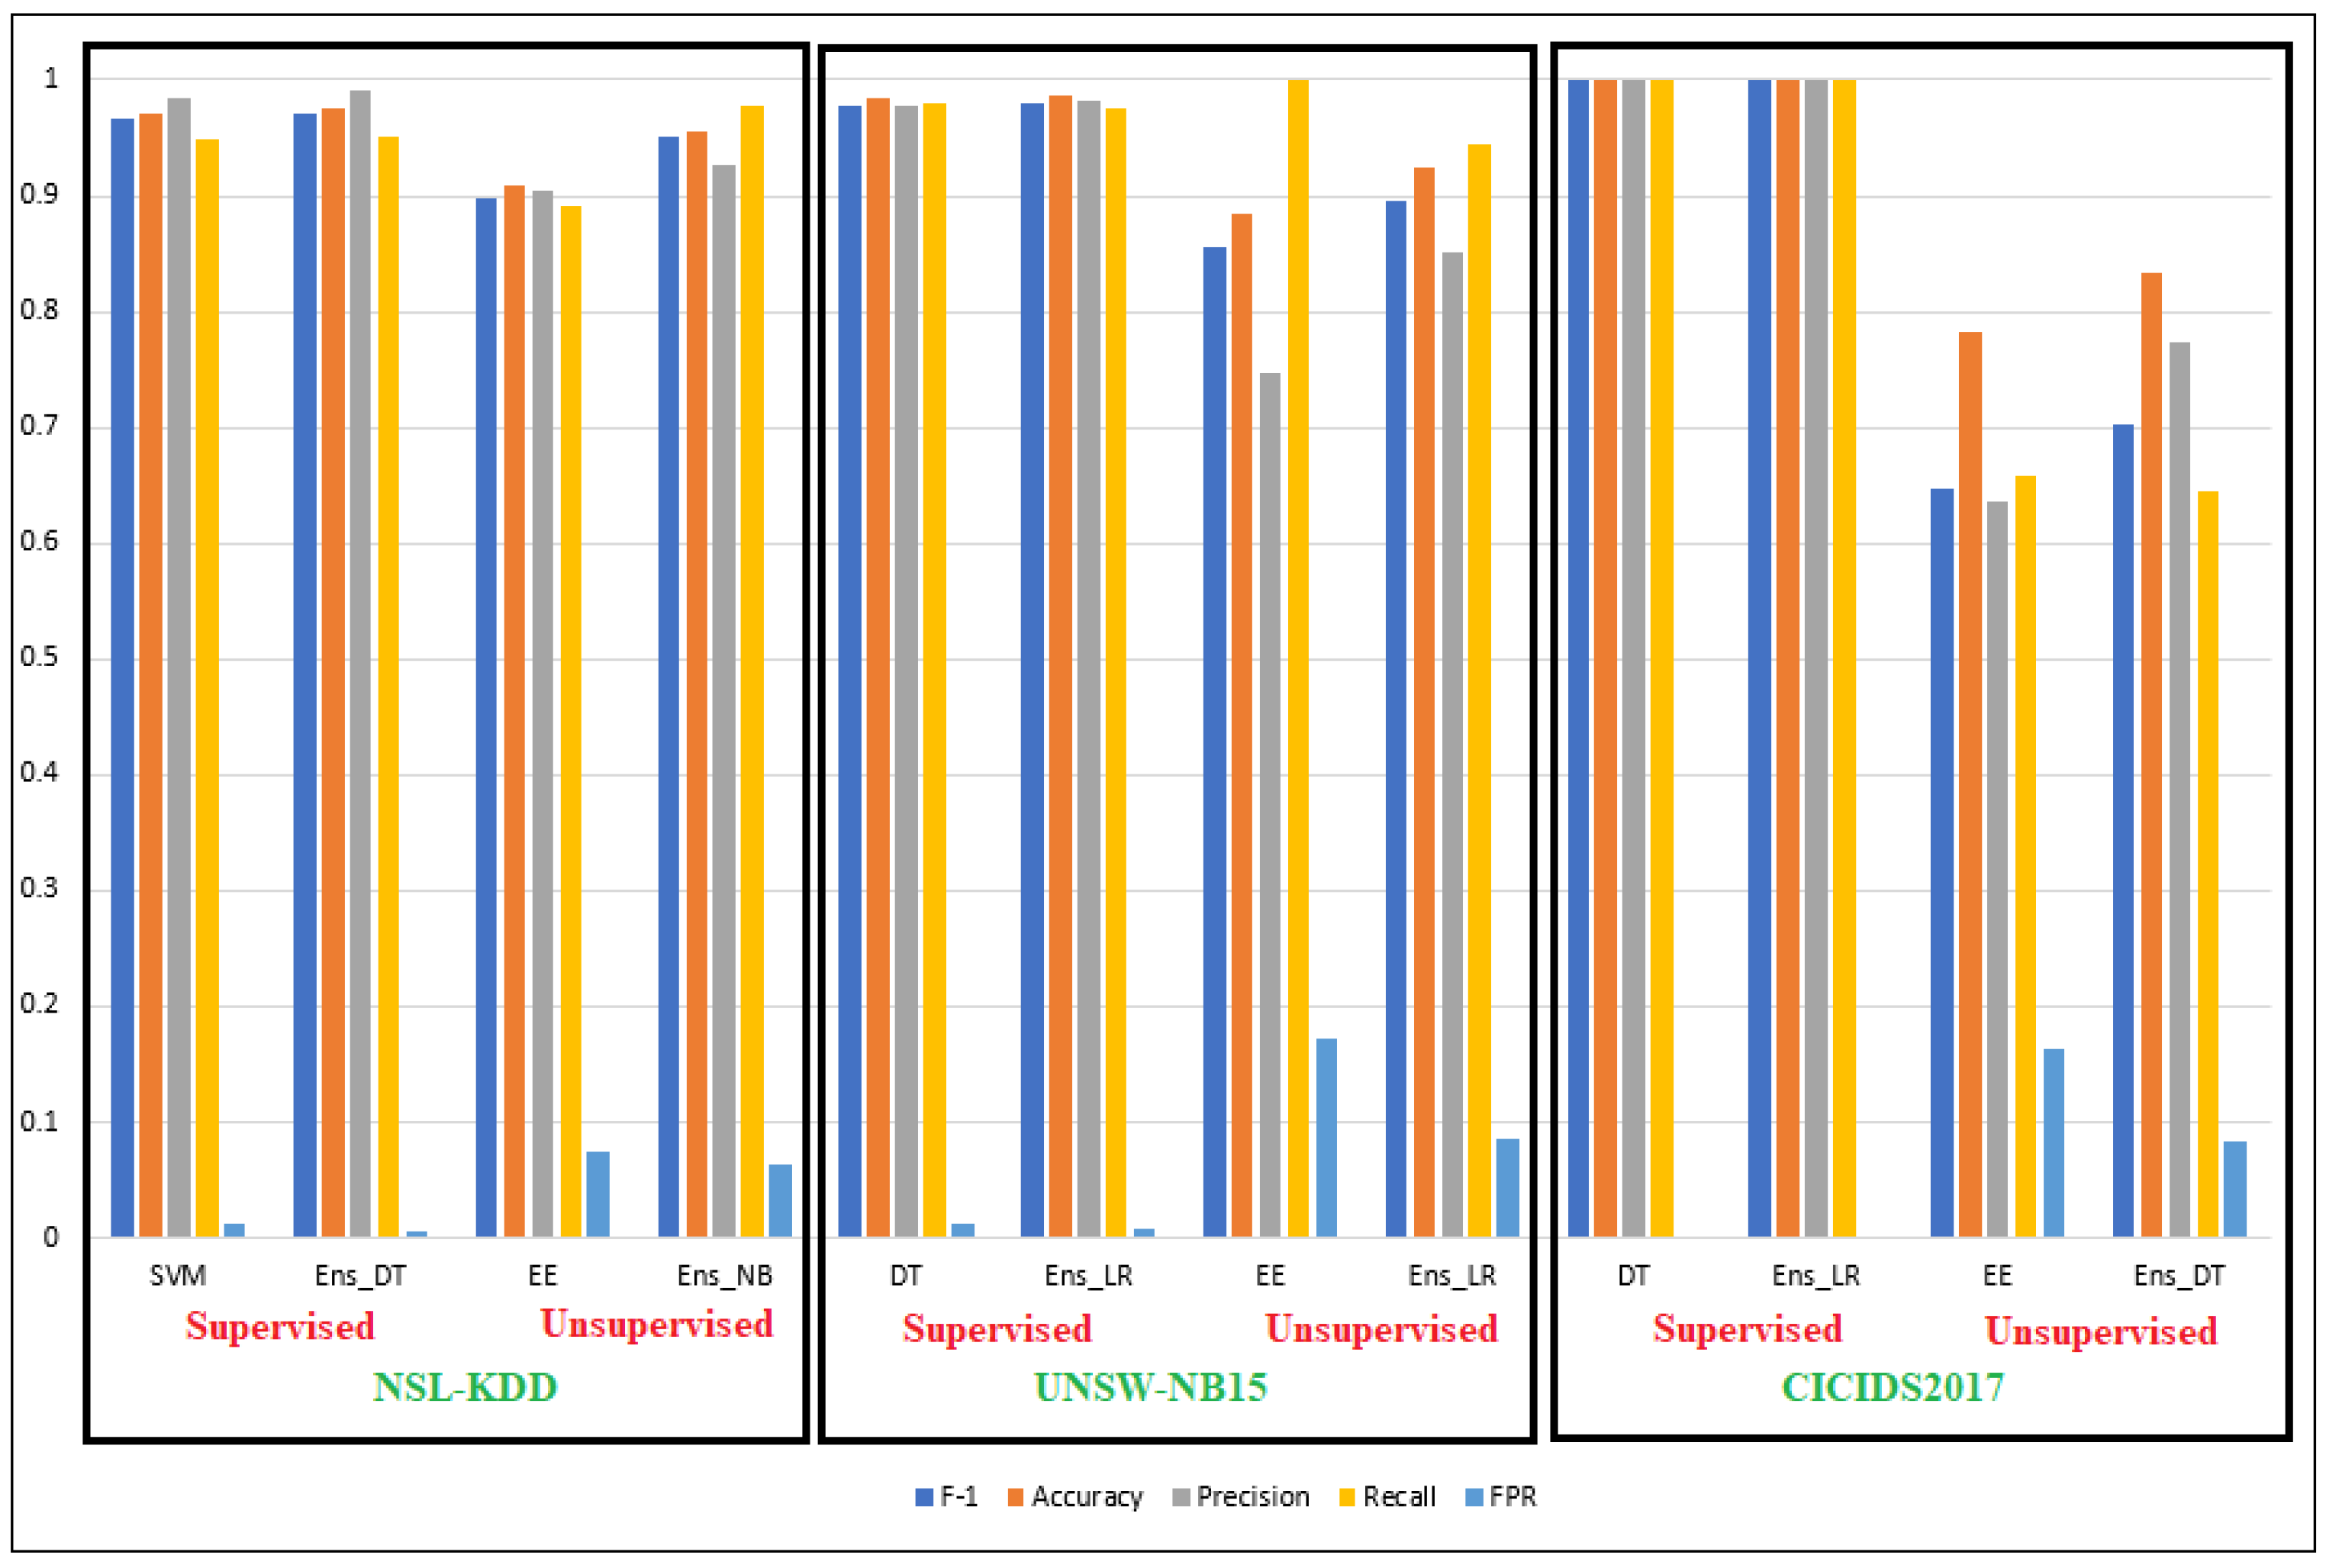
Table 4 and the corresponding bar graph in Figure 4 show the best-performing supervised and unsupervised, individual and ensemble models for the three datasets. In general, all the ensemble models performed better than the individual models for all categories. For the supervised models, the improvements from individual models to ensemble models are not that significant. However, for the unsupervised models, we observed substantial improvement using the corresponding ensemble models. For example, for the NSL-KDD dataset, the performance of the best unsupervised ensemble model was better than that of the corresponding best individual unsupervised model in F1 score (5.4%), accuracy (4.5%), precision (2.2%), and recall (8.7%). For the UNSW-NB15 dataset, the performance of the best-performing ensemble model was better by 4.1% for F1 score, 4.0% for accuracy, and 10.4% for precision. For the CICIDS2017 dataset, the improvements were 5.0% in F1 score, 5.1% in accuracy, and 13.6% in precision. However, the recall values of both the UNSW-NB15 and CICIDS2017 datasets decreased. Among the six best ensemble models for the six different ensemble or metaclassifiers, the ensemble with logistic regression (Ens_LR) performed the best on three occasions. Decision tree (DT) performed the best for two categories among the best individual models.
Table 4.
Best-performing results from all experiments.
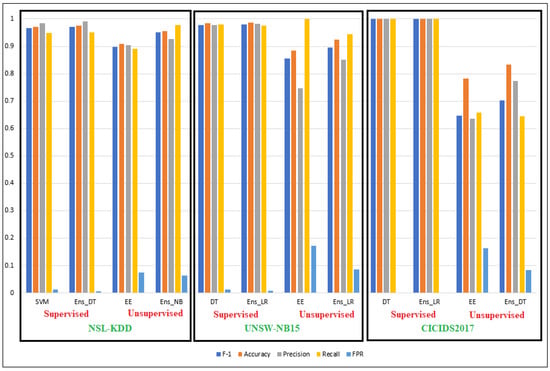
Figure 4.
Back-to-back performance comparison of the individual (LHS) vs. ensemble (RHS) models on all three datasets.
Table A1, Table A2, Table A3, Table A4, Table A5 and Table A6 in Appendix A show that most ensemble models performed better than the corresponding individual models. We also observed that the supervised models performed better than the unsupervised models. This was not unexpected, as supervised models are trained with labeled data and therefore can classify with consistent accuracy. On the other hand, if the DDoS attack data instance was not one of the learned patterns or an unseen attack, then unsupervised models performed better in detecting the attack than supervised models. Moreover, in practice, raw data are unlabeled, and additional data engineering is required to label these. For these reasons, we included both the supervised and unsupervised models in our framework.
The last columns in these tables, the elapsed time taken to train and test the models shows that the ensemble models required more time. This is because in an ensemble mechanism, all the constituent individual models run first, and then the ensemble classifier runs. Therefore, the elapsed time for ensemble models includes the time taken by the individual models, plus its own time. However, in a real-world machine learning application, model training is performed offline, and these pre-trained models are deployed for real-time testing, rendering the issue of comparatively higher elapsed time insignificant. High-performance computing platforms with graphical processing units (GPUs) can also be used to speed up offline training.
Table 5 shows the results of the experiment with the verification dataset (as described in Section 5.1) that was used to verify the DDoS detection ability of the framework. This experiment demonstrated the final detection performance of our approach. The detection results were compared with the ground truths associated with the verification dataset and that gave us the performance metric values. A comparison of the performance metric values in Table 5 with the corresponding values in Table 4 demonstrates that the metrics associated with the verification sets were similar to those of the test datasets, which indicated that the our ensemble approach correctly detected at most 99.1% of the DDoS attacks and incorrectly detected at least 0.01% of benign data instances as DDoS.
Table 5.
Test results with the verification datasets.
Table 6 compares the performance of our proposed method with that of existing ensemble-based works in the literature, demonstrating that our proposed method outperformed all of them.
Table 6.
A performance comparison of our method with that of existing ensemble methods.
8. Conclusions
Detecting and preventing DDoS attacks is a very active field of research. Machine-learning-based detection approaches are showing promise in detecting DDoS attacks, and this research is not yet mature. This paper described a machine-learning-based approach involving a unique kind of ensemble algorithm for detecting DDoS attacks. In this algorithm, the outputs of five different supervised classifiers are fed as input to six metaclassifiers. Separately, the outputs of five different unsupervised classifiers are fed as input to six metaclassifiers. Then, these two ensembles are combined to obtain the best results.
We experimented with the algorithm using three benchmark datasets. The results clearly showed the effectiveness of the algorithm on all three datasets in correctly detecting DDoS attacks without many false alarms.
Future Work
Considering this work as a baseline, we plan to extend our method for detecting DDoS attacks in the early stage based on identifying the crucial features using interpretable machine learning techniques. Since the benchmark datasets that we used in these experiments are offline, we plan to employ our comprehensive solution as a DDoS attack discriminator with real-time traffic.
Author Contributions
Conceptualization, S.D.; methodology, S.D. and M.A.; software, S.D. and M.A.; validation: S.D. and Mohammad Ashrafuzzaman; formal analysis: S.D., Mohammad Ashrafuzzaman, F.T.S. and S.S.; investigation: S.D., Mohammad Ashrafuzzaman, F.T.S. and S.S.; writing—original draft preparation, S.D. and M.A.; writing—review and editing, S.D., Mohammad Ashrafuzzaman, F.T.S. and S.S.; supervision, S.S. All authors have read and agreed to the published version of the manuscript.
Funding
This research received no external funding.
Data Availability Statement
We used the publicly-available datasets for our work which were cited in the paper.
Conflicts of Interest
The authors declare no conflicts of interest.
Appendix A. Detailed Results
This Appendix presents the detail results, i.e., evaluation metrics values, graphs, and ROC curves, for all the three datasets used in this study.
Table A1 and Table A2 show the detailed results for the supervised and unsupervised (both individual and ensemble) models for the NSL-KDD dataset. Figure A1a,b show the corresponding bar graphs, and the ROC curves are shown in Figure A2.
Table A3 and Table A4 show the detailed results for the supervised and unsupervised (both individual and ensemble) models for the UNSW-NB15 dataset. Figure A3a,b show the corresponding bar graphs, and the ROC curves are shown in Figure A4.
Table A5 and Table A6 show the detailed results for the supervised and unsupervised (both individual and ensemble) models for the CICIDS2017 dataset. Figure A5a,b show the corresponding bar graphs, and the ROC curves are shown in Figure A6.
Table A1.
Performance metrics for NSL-KDD dataset using supervised ensemble framework.
Table A1.
Performance metrics for NSL-KDD dataset using supervised ensemble framework.
| Models | F1 Score | Accuracy | Precision | Recall | FPR | ROC AUC | Elapsed Time (s) |
|---|---|---|---|---|---|---|---|
| LR | 0.885 | 0.905 | 0.933 | 0.842 | 0.046 | 0.950 | 4.489 |
| NB | 0.836 | 0.861 | 0.857 | 0.815 | 0.104 | 0.935 | 0.566 |
| NN | 0.830 | 0.866 | 0.923 | 0.754 | 0.048 | 0.909 | 7.317 |
| DT | 0.920 | 0.935 | 0.986 | 0.863 | 0.009 | 0.927 | 1.032 |
| SVM | 0.967 | 0.972 | 0.984 | 0.949 | 0.012 | 0.959 | 468.648 |
| Ens_MV | 0.888 | 0.907 | 0.938 | 0.843 | 0.043 | N/A | 470.748 |
| Ens_LR | 0.970 | 0.974 | 0.988 | 0.953 | 0.009 | 0.975 | 468.800 |
| Ens_NB | 0.946 | 0.952 | 0.942 | 0.950 | 0.046 | 0.969 | 468.683 |
| Ens_NN | 0.970 | 0.974 | 0.992 | 0.949 | 0.006 | 0.972 | 468.880 |
| Ens_DT | 0.971 | 0.975 | 0.991 | 0.952 | 0.006 | 0.977 | 468.684 |
| Ens_SVM | 0.970 | 0.974 | 0.989 | 0.952 | 0.009 | 0.974 | 470.438 |
Table A2.
Performance metrics for NSL-KDD test dataset using unsupervised ensemble framework.
Table A2.
Performance metrics for NSL-KDD test dataset using unsupervised ensemble framework.
| Models | F1 Score | Accuracy | Precision | Recall | FPR | ROC AUC | Elapsed Time (s) |
|---|---|---|---|---|---|---|---|
| OCSVM_P | 0.814 | 0.841 | 0.843 | 0.787 | 0.116 | 0.835 | 148.683 |
| OCSVM_L | 0.831 | 0.861 | 0.9 | 0.771 | 0.068 | 0.852 | 171.334 |
| LOF | 0.502 | 0.589 | 0.540 | 0.468 | 0.315 | 0.576 | 728.318 |
| ISOF | 0.885 | 0.894 | 0.853 | 0.919 | 0.125 | 0.897 | 24.529 |
| EE | 0.897 | 0.91 | 0.904 | 0.891 | 0.075 | 0.908 | 49.590 |
| Ens_MV | 0.87 | 0.882 | 0.846 | 0.896 | 0.129 | N/A | 1124.507 |
| Ens_LR | 0.896 | 0.91 | 0.923 | 0.871 | 0.059 | 0.906 | 1122.519 |
| Ens_NN | 0.902 | 0.907 | 0.859 | 0.95 | 0.127 | 0.912 | 1122.669 |
| Ens_NB | 0.902 | 0.955 | 0.926 | 0.978 | 0.063 | 0.957 | 1122.498 |
| Ens_DT | 0.949 | 0.953 | 0.921 | 0.978 | 0.068 | 0.955 | 1122.536 |
| Ens_SVM | 0.949 | 0.953 | 0.921 | 0.978 | 0.068 | 0.955 | 1122.518 |
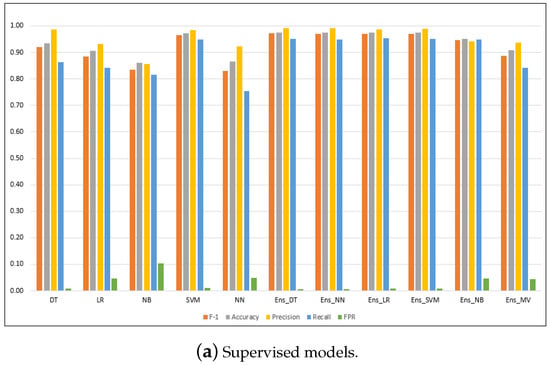
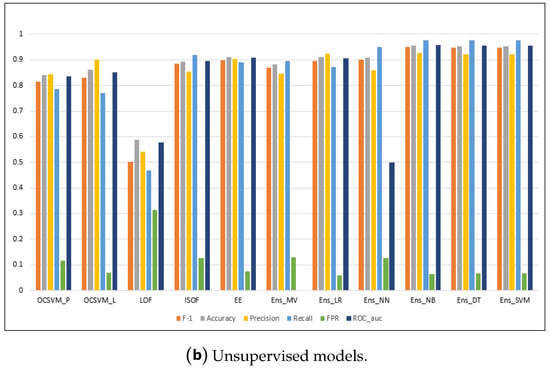
Figure A1.
Performance metrics for the models on the NSL-KDD dataset.
Figure A1.
Performance metrics for the models on the NSL-KDD dataset.

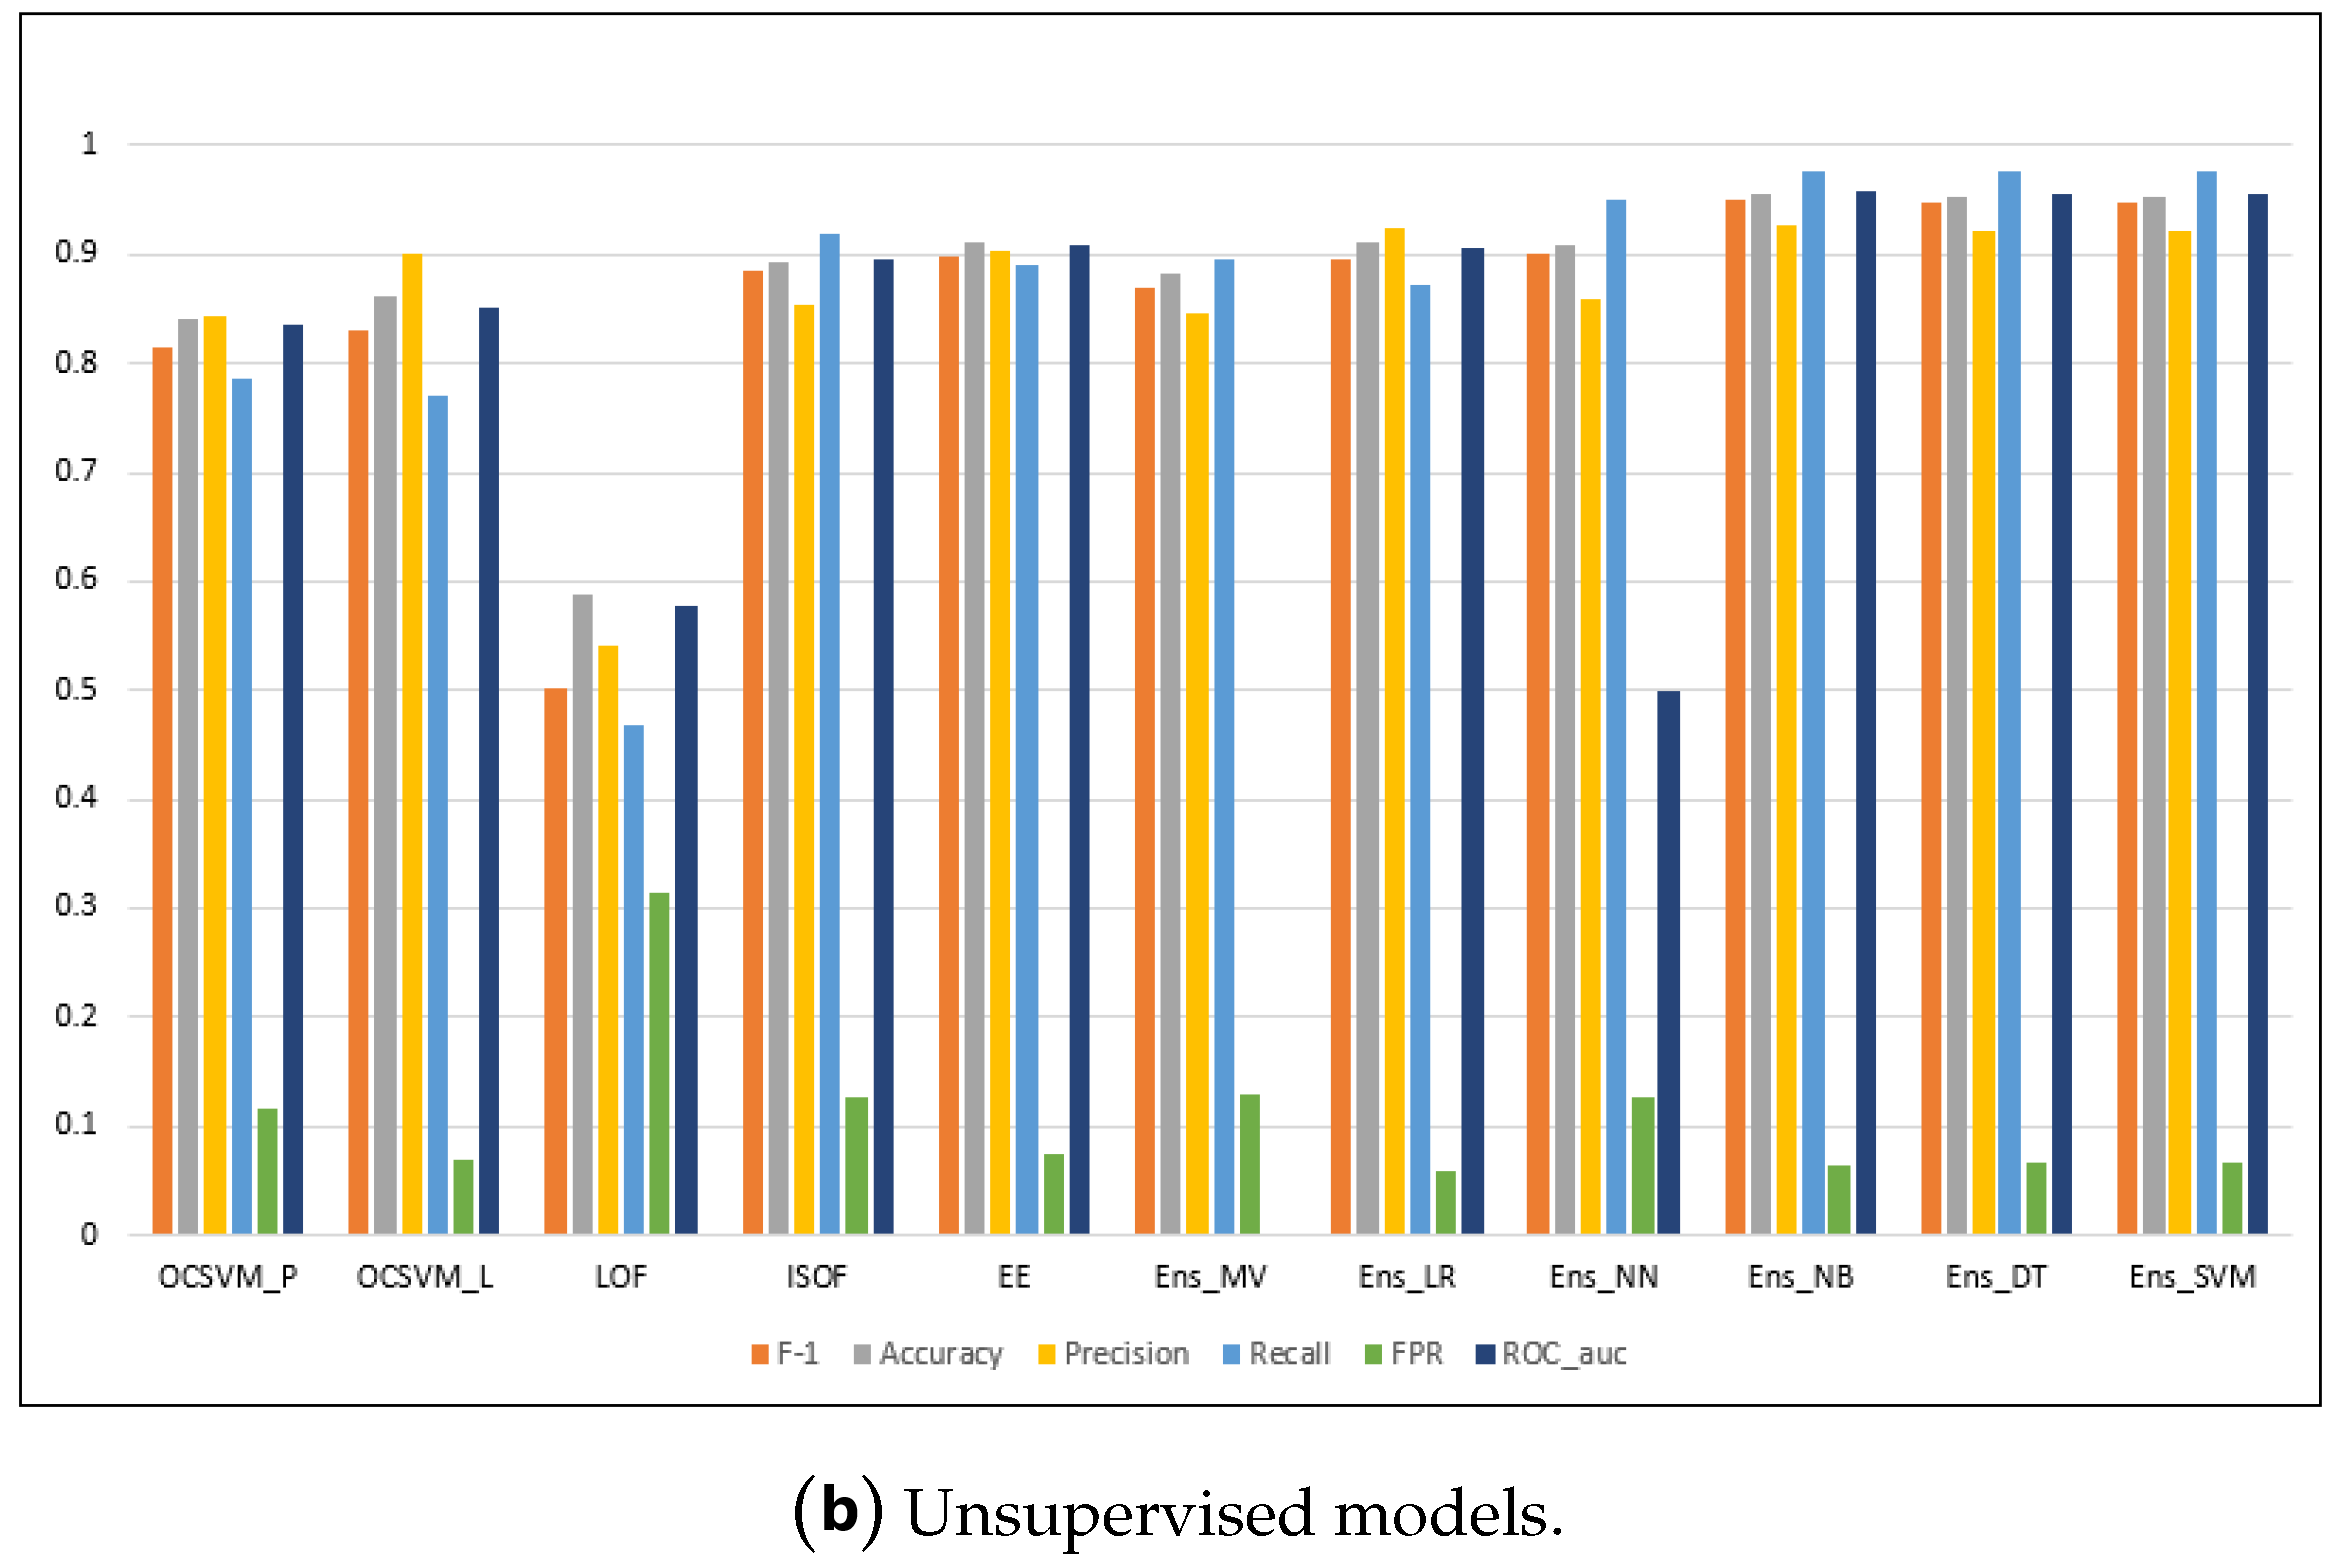
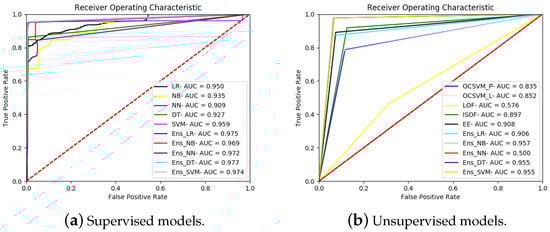
Figure A2.
ROC curves for all the models running on the NSL-KDD dataset.
Figure A2.
ROC curves for all the models running on the NSL-KDD dataset.
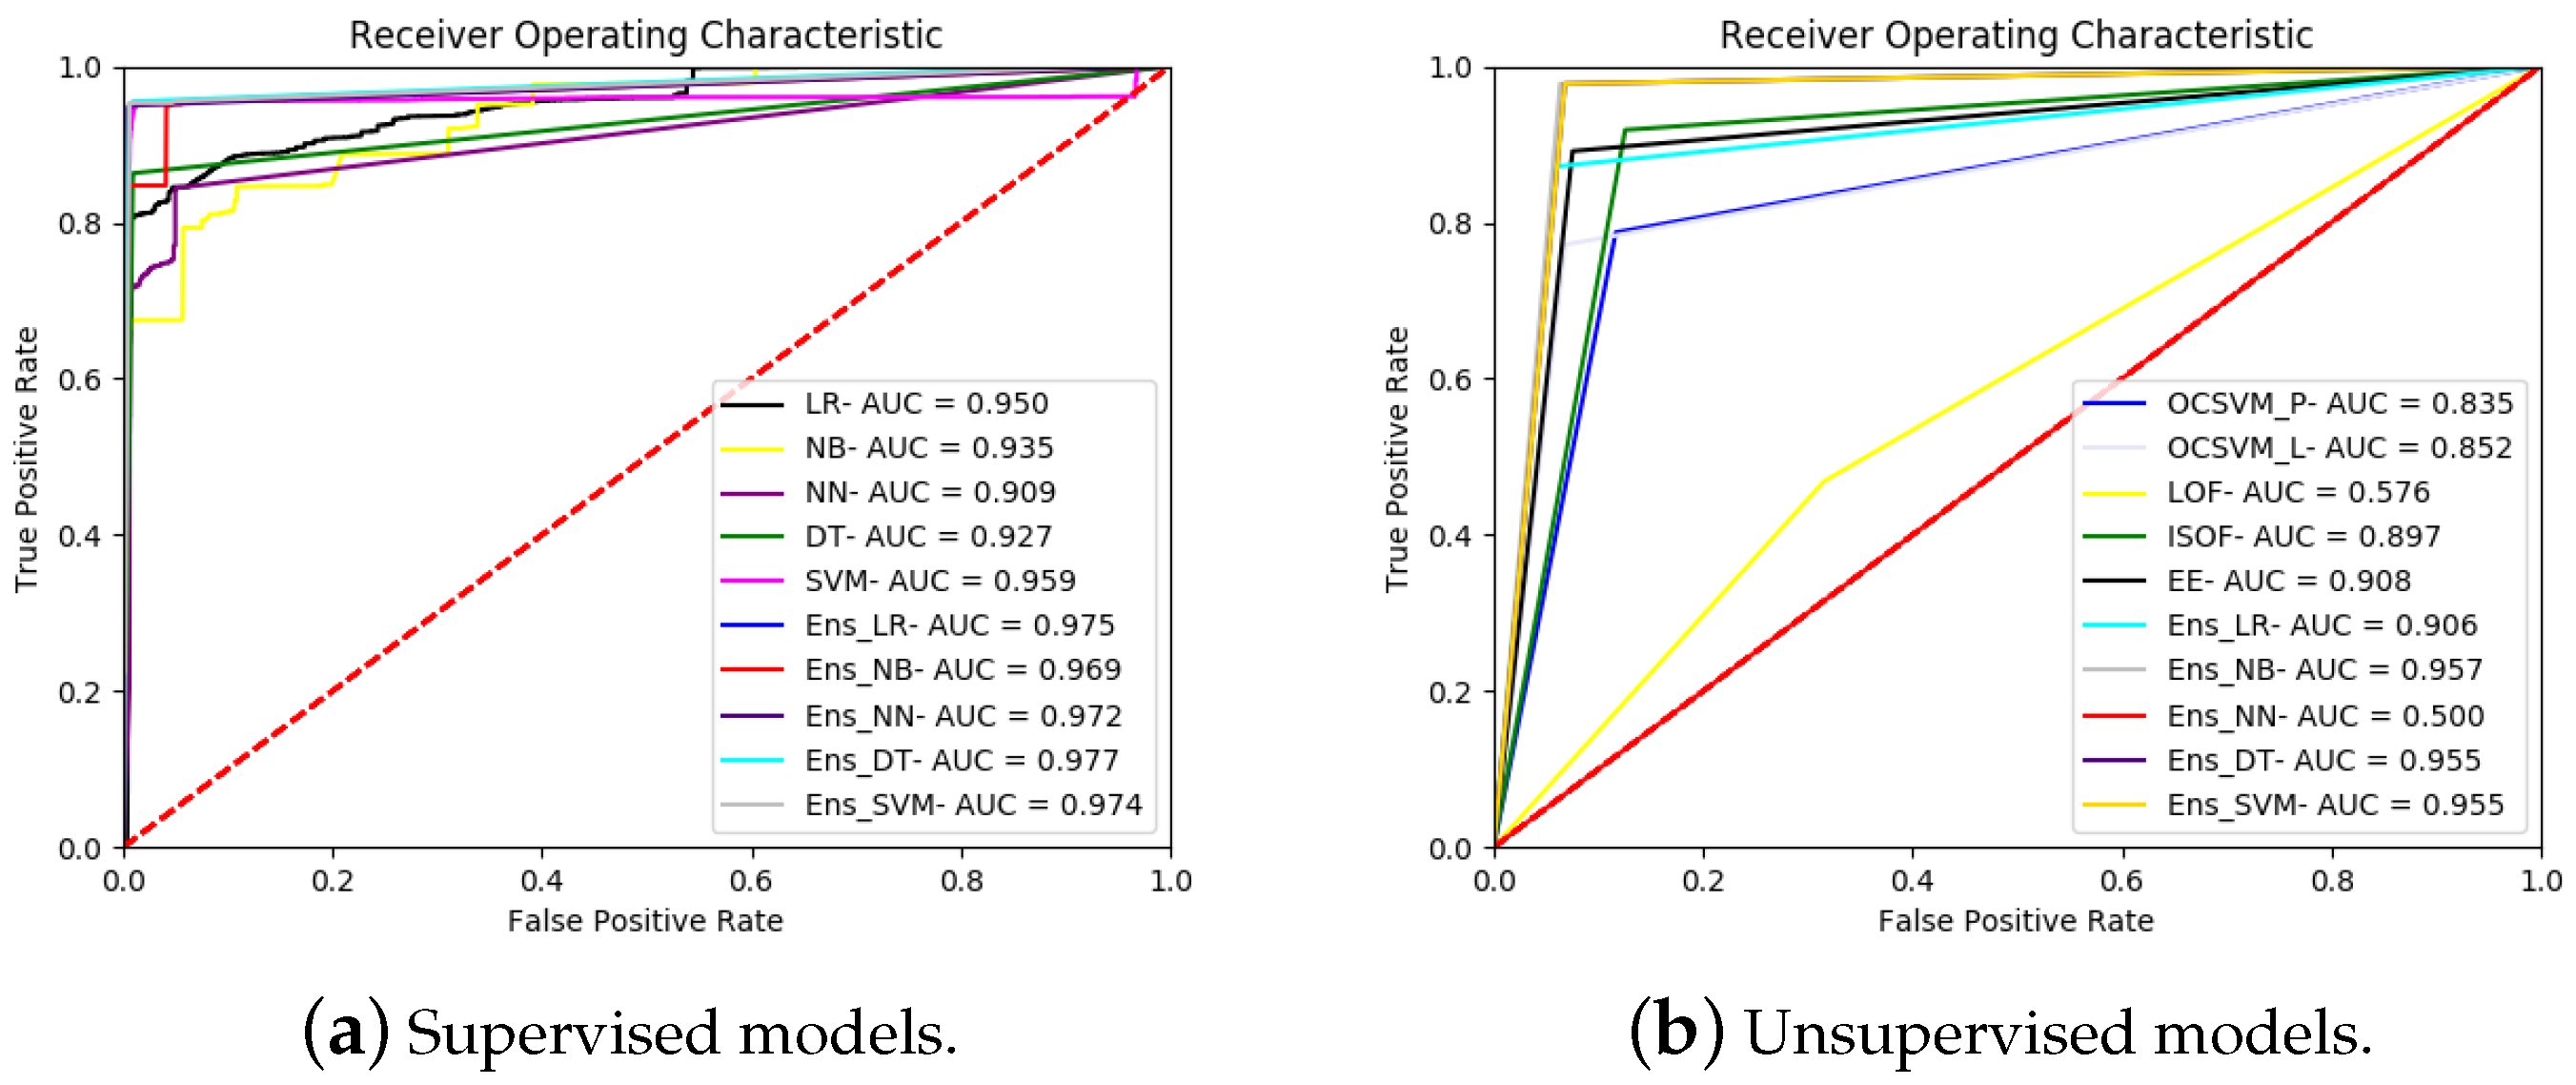
Table A3.
Performance metrics for UNSW-NB15 dataset using supervised ensemble framework.
Table A3.
Performance metrics for UNSW-NB15 dataset using supervised ensemble framework.
| Models | F1 Score | Accuracy | Precision | Recall | FPR | ROC AUC | Elapsed Time (s) |
|---|---|---|---|---|---|---|---|
| LR | 0.946 | 0.964 | 0.963 | 0.930 | 0.019 | 0.956 | 1.24 |
| NB | 0.800 | 0.837 | 0.684 | 0.964 | 0.227 | 0.868 | 0.19 |
| NN | 0.831 | 0.900 | 0.974 | 0.724 | 0.010 | 0.87 | 1.29 |
| DT | 0.978 | 0.985 | 0.977 | 0.979 | 0.012 | 0.984 | 0.28 |
| SVM | 0.969 | 0.979 | 0.958 | 0.981 | 0.022 | 0.980 | 23.04 |
| Ens_MV | 0.972 | 0.981 | 0.964 | 0.981 | 0.019 | N/A | 28.25 |
| Ens_LR | 0.979 | 0.986 | 0.982 | 0.976 | 0.009 | 0.983 | 26.29 |
| Ens_NB | 0.971 | 0.980 | 0.961 | 0.982 | 0.021 | 0.981 | 26.25 |
| Ens_NN | 0.978 | 0.985 | 0.964 | 0.993 | 0.019 | 0.987 | 26.66 |
| Ens_DT | 0.978 | 0.985 | 0.961 | 0.996 | 0.021 | 0.987 | 26.26 |
| Ens_SVM | 0.978 | 0.985 | 0.961 | 0.996 | 0.021 | 0.988 | 26.70 |
Table A4.
Performancemetrics for UNSW-NB15 test dataset using unsupervised ensemble framework.
Table A4.
Performancemetrics for UNSW-NB15 test dataset using unsupervised ensemble framework.
| Models | F1 Score | Accuracy | Precision | Recall | FPR | ROC AUC | Elapsed Time (s) |
|---|---|---|---|---|---|---|---|
| OCSVM_P | 0.561 | 0.608 | 0.451 | 0.742 | 0.461 | 0.641 | 35.58 |
| OCSVM_L | 0.565 | 0.741 | 0.654 | 0.498 | 0.135 | 0.682 | 15.69 |
| LOF | 0.499 | 0.514 | 0.383 | 0.716 | 0.590 | 0.563 | 11.83 |
| ISOF | 0.596 | 0.541 | 0.424 | 1.000 | 0.693 | 0.653 | 246.25 |
| EE | 0.855 | 0.885 | 0.747 | 1.000 | 0.173 | 0.913 | 3.890 |
| Ens_MV | 0.624 | 0.676 | 0.514 | 0.795 | 0.385 | N/A | 315.4 |
| Ens_LR | 0.896 | 0.925 | 0.851 | 0.945 | 0.085 | 0.930 | 313.6 |
| Ens_NB | 0.855 | 0.884 | 0.746 | 1.000 | 0.176 | 0.912 | 313.6 |
| Ens_NN | 0.841 | 0.875 | 0.744 | 0.967 | 0.172 | 0.897 | 313.5 |
| Ens_DT | 0.896 | 0.925 | 0.851 | 0.945 | 0.085 | 0.930 | 313.6 |
| Ens_SVM | 0.896 | 0.925 | 0.851 | 0.945 | 0.085 | 0.930 | 315.6 |
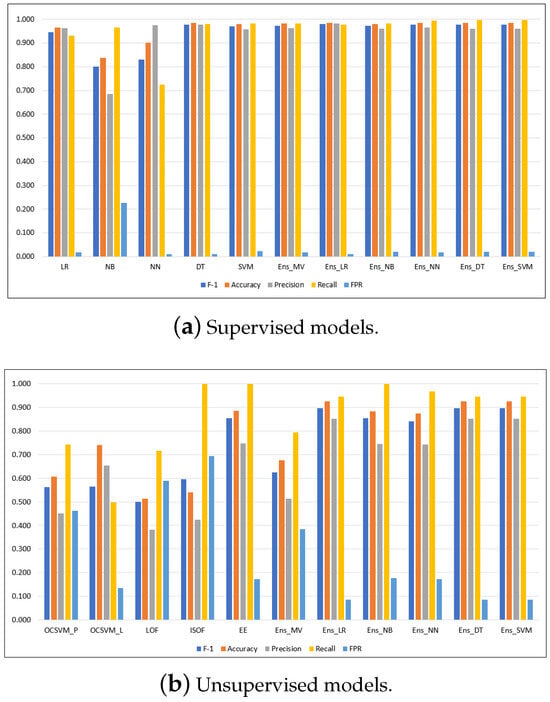
Figure A3.
Performance metrics for the models running on the UNSW-NB15 dataset.
Figure A3.
Performance metrics for the models running on the UNSW-NB15 dataset.
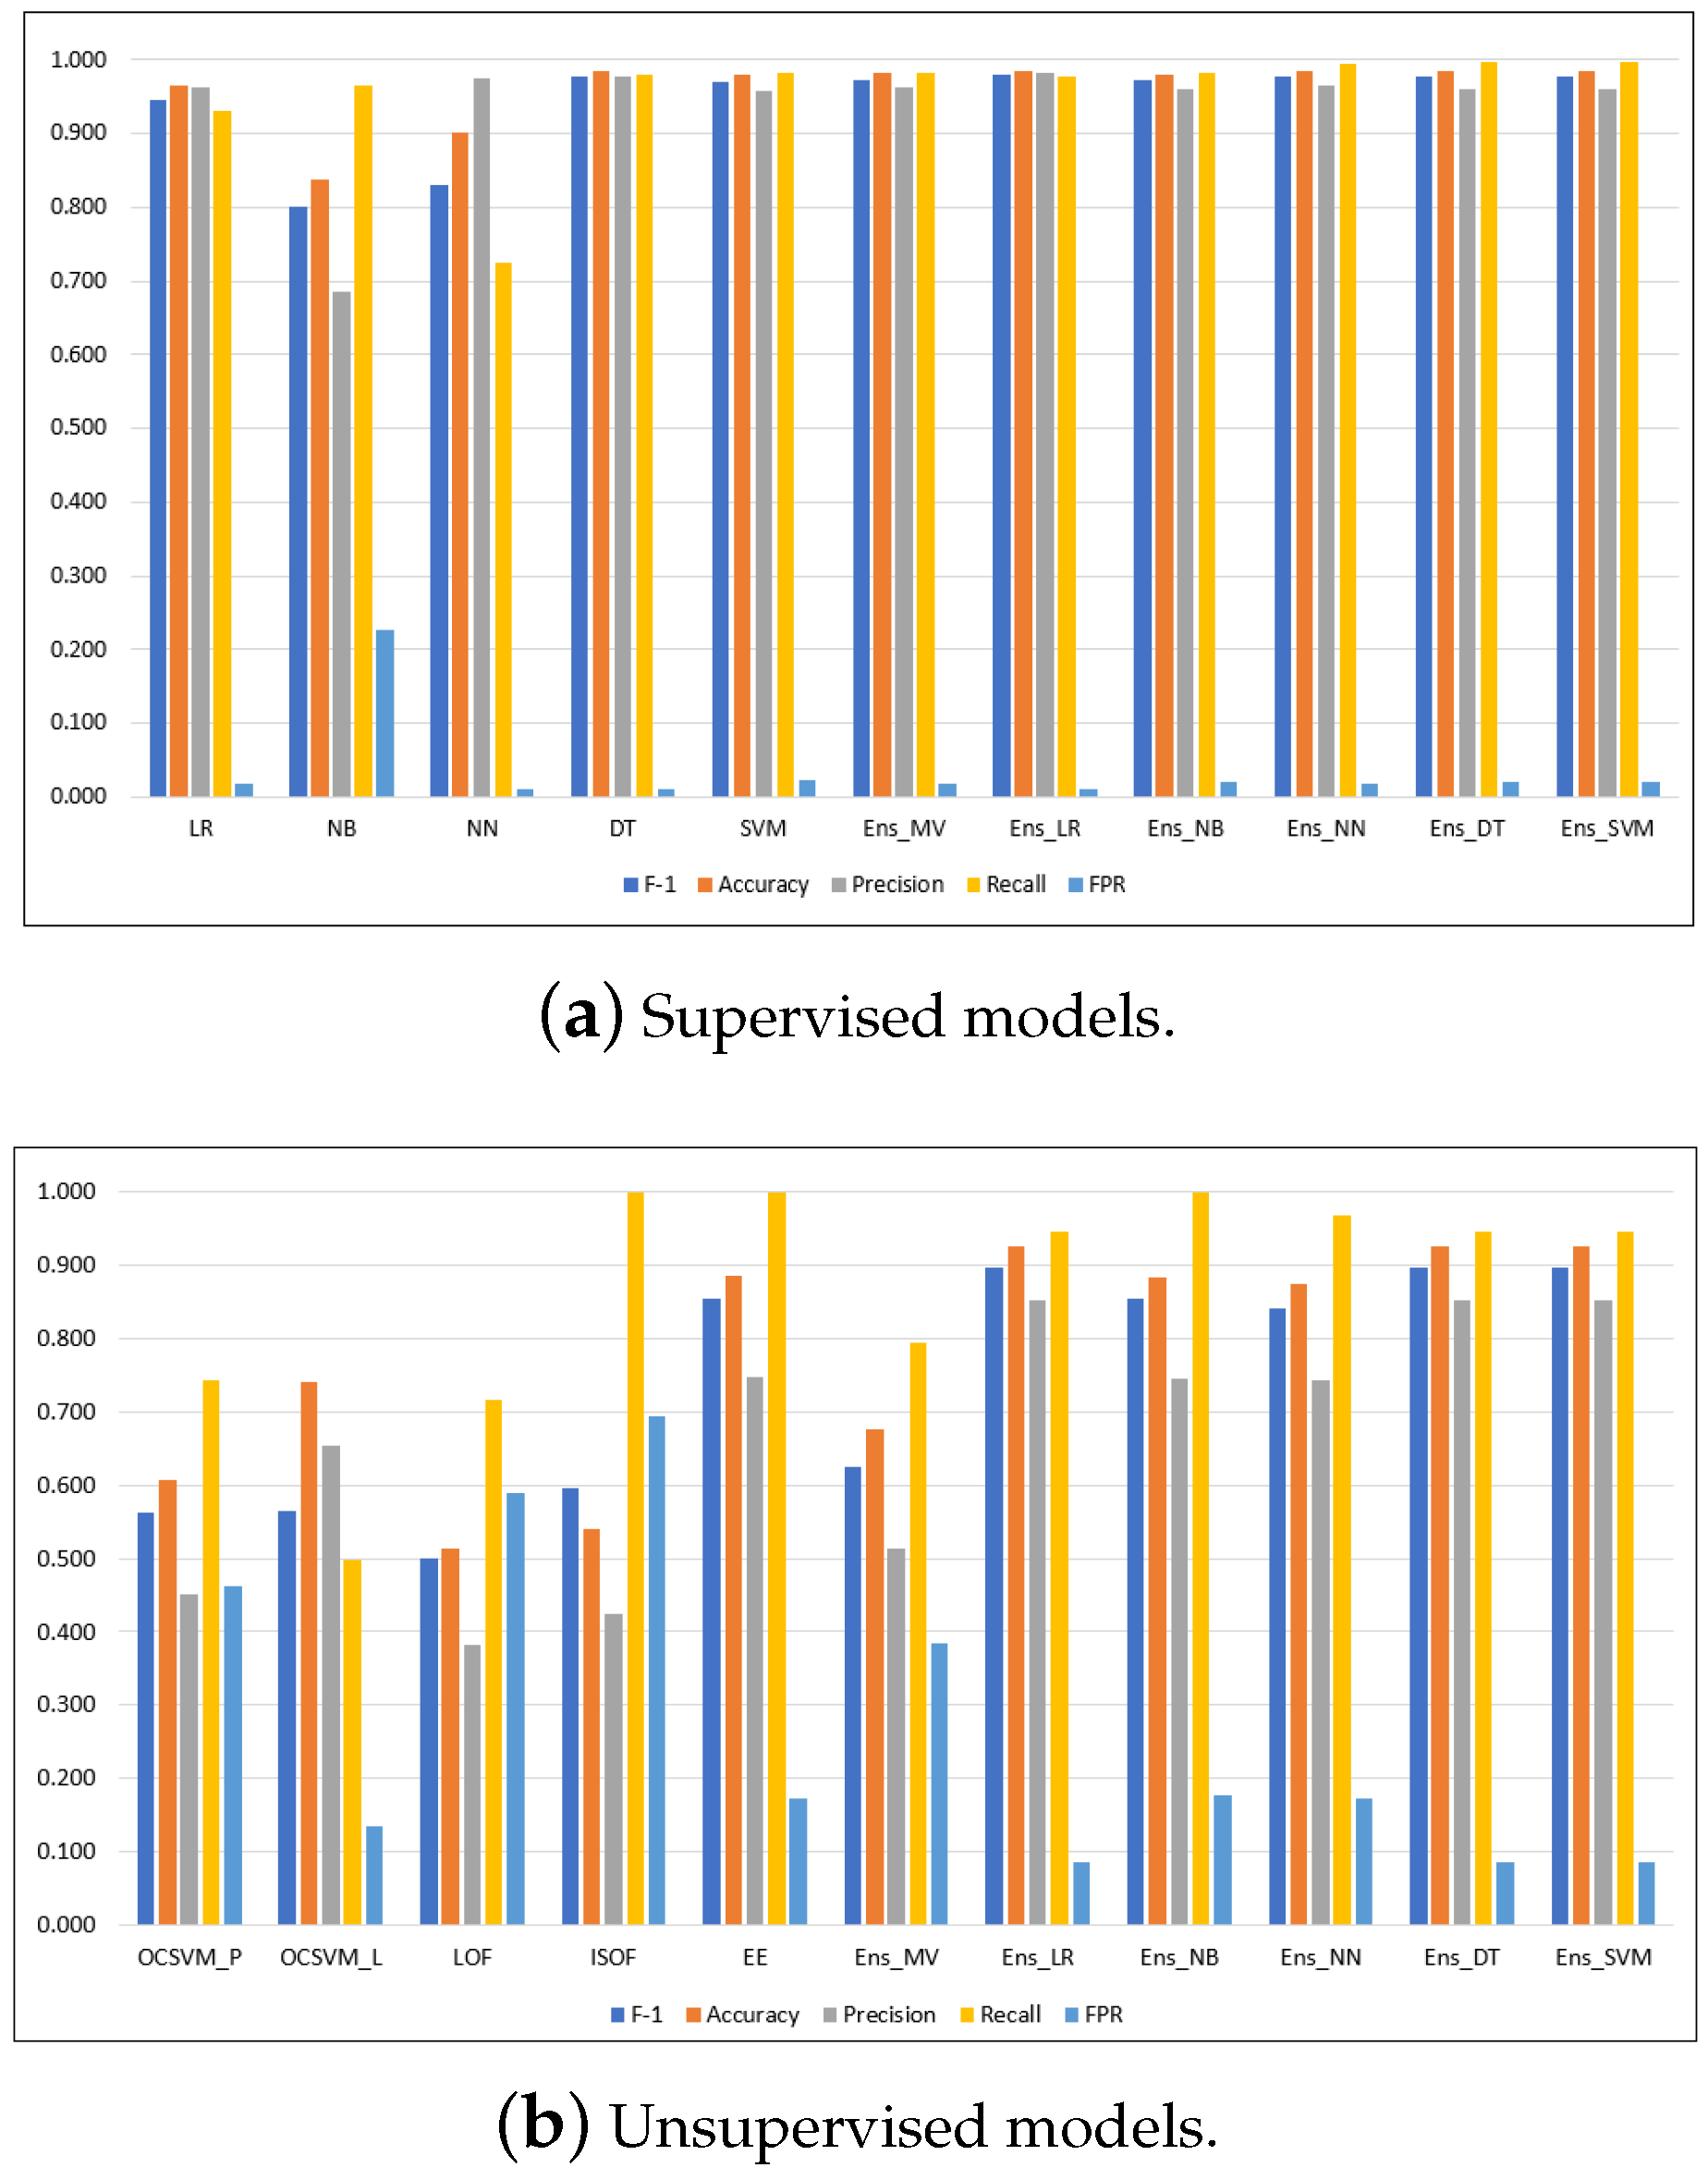
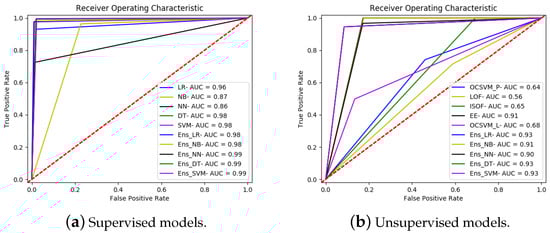
Figure A4.
ROC curves for all the models running on the UNSW-NB15 dataset.
Figure A4.
ROC curves for all the models running on the UNSW-NB15 dataset.
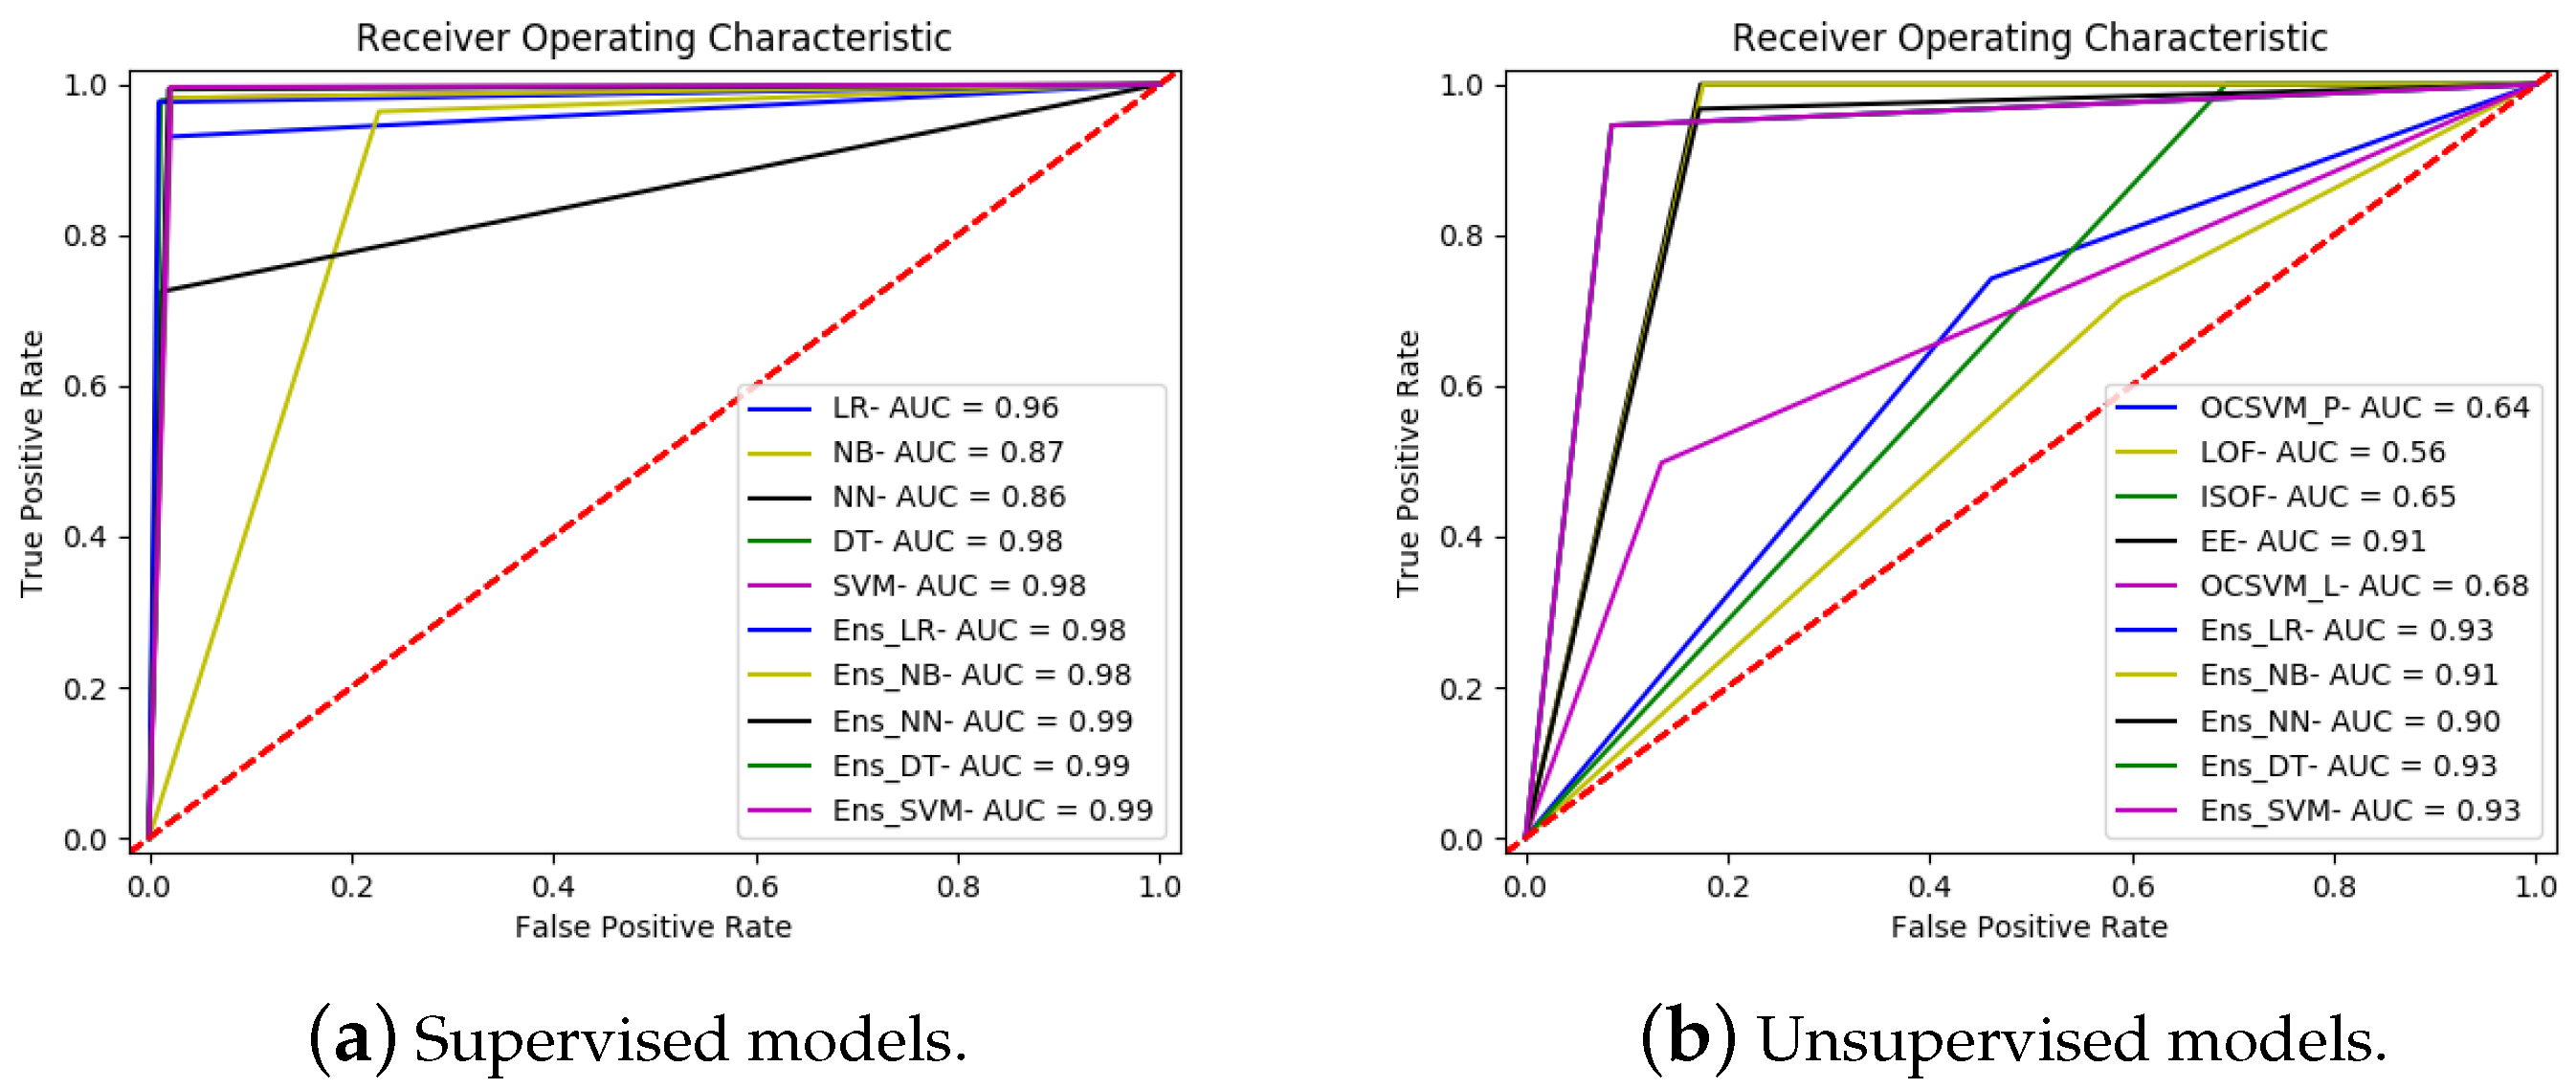
Table A5.
Performance metrics for CICIDS2017 dataset using supervised ensemble framework.
Table A5.
Performance metrics for CICIDS2017 dataset using supervised ensemble framework.
| Models | F1 Score | Accuracy | Precision | Recall | FPR | ROC AUC | Elapsed Time (s) |
|---|---|---|---|---|---|---|---|
| LR | 0.929 | 0.956 | 0.903 | 0.957 | 0.045 | 0.990 | 64.146 |
| NB | 0.753 | 0.872 | 0.903 | 0.646 | 0.030 | 0.963 | 15.689 |
| NN | 0.964 | 0.977 | 0.936 | 0.993 | 0.030 | 0.997 | 126.845 |
| DT | 0.999 | 0.999 | 0.999 | 0.999 | 0.001 | 0.999 | 60.469 |
| SVM | 0.966 | 0.979 | 0.947 | 0.987 | 0.024 | 0.997 | 112,330.711 |
| Ens_MV | 0.970 | 0.981 | 0.951 | 0.989 | 0.022 | N/A | 112,600.650 |
| Ens_LR | 0.999 | 0.999 | 0.999 | 0.999 | 0.001 | 1.000 | 112,599.961 |
| Ens_NB | 0.970 | 0.981 | 0.952 | 0.988 | 0.022 | 0.999 | 112,598.241 |
| Ens_NN | 0.999 | 0.999 | 0.999 | 0.999 | 0.001 | 1.000 | 112,601.044 |
| Ens_DT | 0.999 | 0.999 | 0.999 | 0.999 | 0.001 | 1.000 | 112,598.194 |
| Ens_SVM | 0.999 | 0.999 | 0.999 | 0.999 | 0.001 | 0.999 | 112,610.225 |
Table A6.
Performance metrics for CICIDS2017 test dataset using unsupervised ensemble framework.
Table A6.
Performance metrics for CICIDS2017 test dataset using unsupervised ensemble framework.
| Models | F1 Score | Accuracy | Precision | Recall | FPR | ROC AUC | Elapsed Time (s) |
|---|---|---|---|---|---|---|---|
| OCSVM_P | 0.145989 | 0.393467 | 0.127333 | 0.17105 | 0.509807 | 0.330621 | 27,085.11 |
| OCSVM_L | 0.242523 | 0.618004 | 0.303909 | 0.201769 | 0.200981 | 0.500394 | 15,592.11 |
| LOF | 0.355704 | 0.477056 | 0.283843 | 0.476289 | 0.52261 | 0.476839 | 1056.684 |
| ISOF | 0.640336 | 0.779639 | 0.633589 | 0.647229 | 0.162778 | 0.742225 | 114.8583 |
| EE | 0.647782 | 0.782862 | 0.637112 | 0.658815 | 0.163191 | 0.747812 | 179.6919 |
| Ens_MV | 0.466815 | 0.688627 | 0.485242 | 0.449736 | 0.207482 | N/A | 44,033.58 |
| Ens_LR | 0.701033 | 0.831363 | 0.765918 | 0.646284 | 0.087061 | 0.779612 | 44,029.45 |
| Ens_NB | 0.659011 | 0.793603 | 0.666235 | 0.651942 | 0.143957 | 0.753992 | 44,028.93 |
| Ens_NN | 0.703398 | 0.83355 | 0.773203 | 0.645153 | 0.08341 | 0.780871 | 44,039.26 |
| Ens_DT | 0.703398 | 0.83355 | 0.773203 | 0.645153 | 0.08341 | 0.780871 | 44,028.88 |
| Ens_SVM | 0.703398 | 0.83355 | 0.773203 | 0.645153 | 0.08341 | 0.780871 | 46,415.09 |
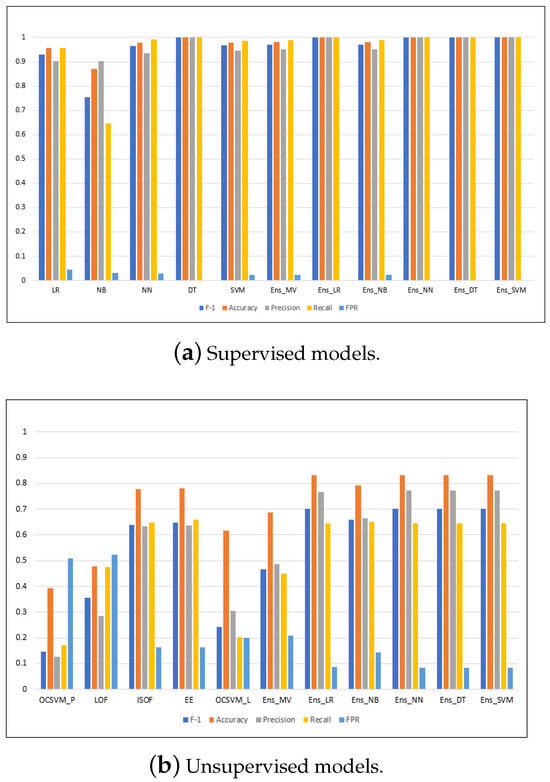
Figure A5.
Performance metrics for the models running on the CICIDS2017 dataset.
Figure A5.
Performance metrics for the models running on the CICIDS2017 dataset.
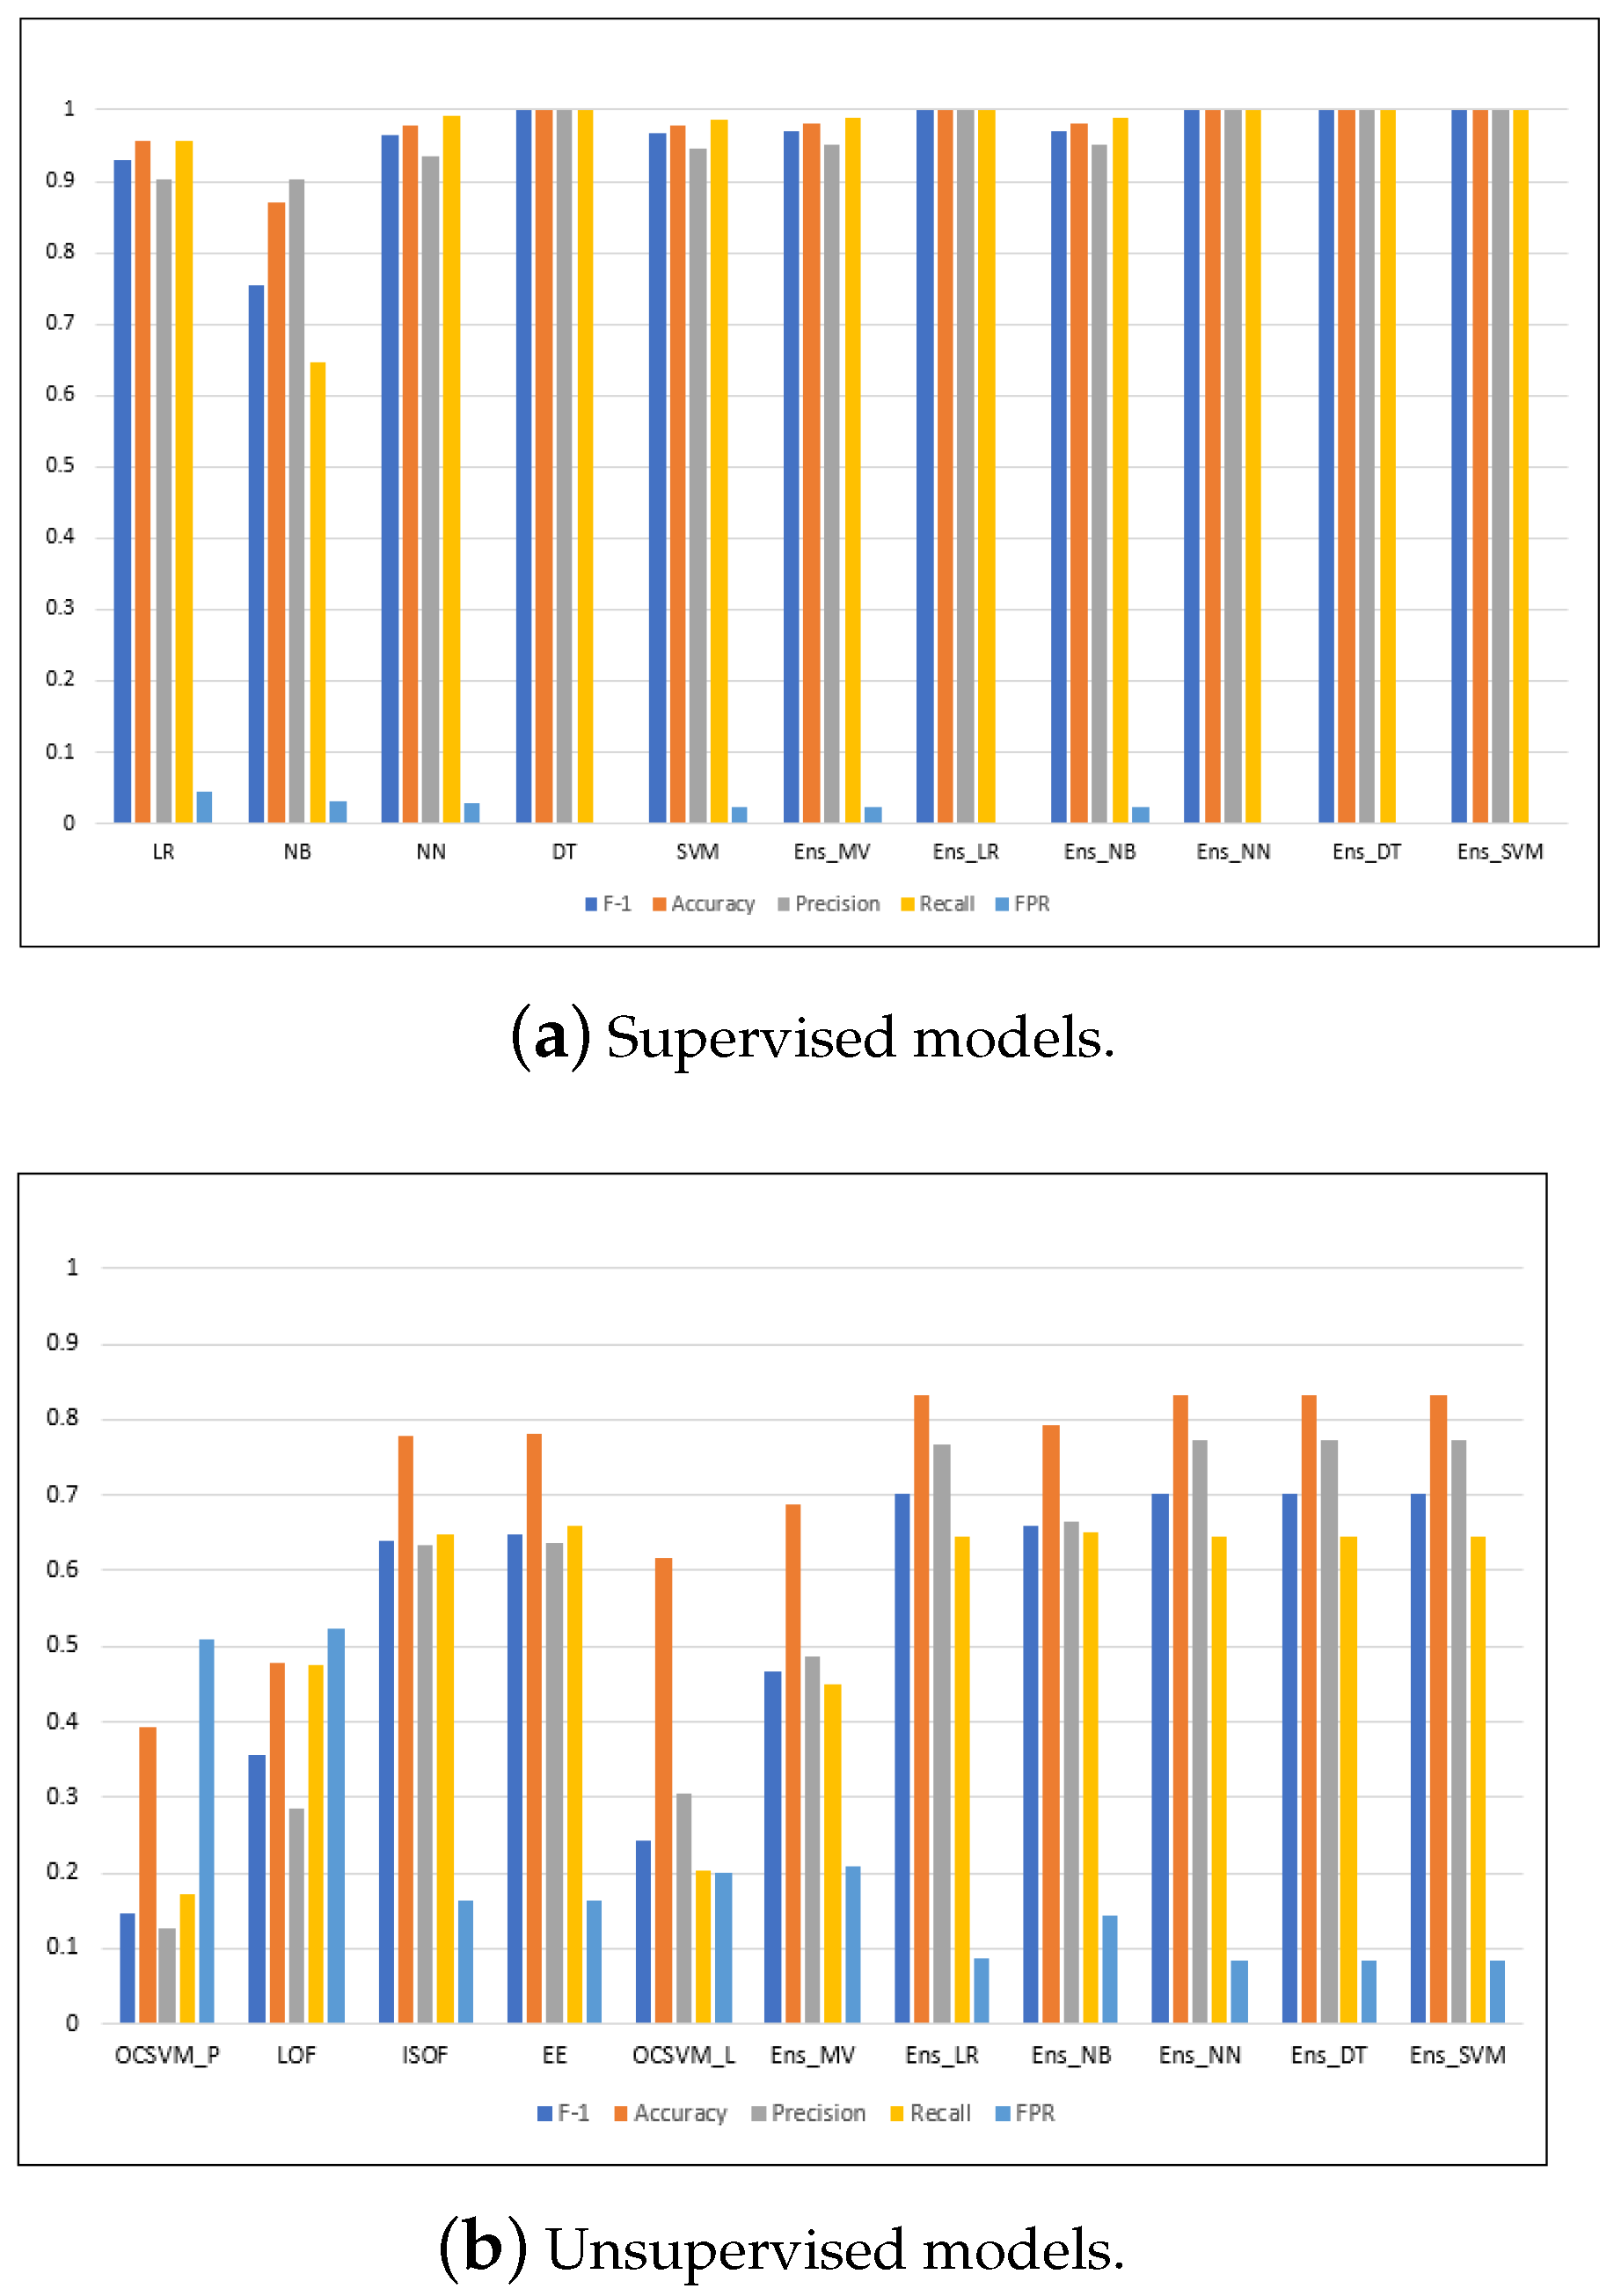
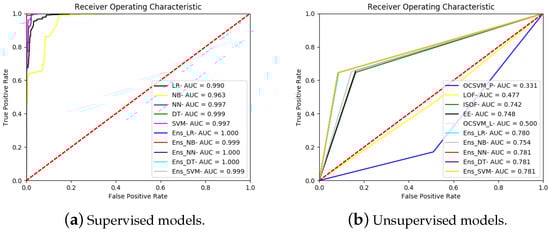
Figure A6.
ROC curves for all the models running on the CICIDS2017 dataset.
Figure A6.
ROC curves for all the models running on the CICIDS2017 dataset.
References
- Calem, R.E. New York’s Panix Service is Crippled by Hacker Attack. The New York Times, 14 September 1996; pp. 1–3. [Google Scholar]
- Famous DDoS Attacks: The Largest DDoS Attacks of All Time. Cloudflare 2020. Available online: https://www.cloudflare.com/learning/ddos/famous-ddos-attacks/ (accessed on 14 February 2024).
- Aburomman, A.A.; Reaz, M.B.I. A survey of intrusion detection systems based on ensemble and hybrid classifiers. Comput. Secur. 2017, 65, 135–152. [Google Scholar] [CrossRef]
- Gogoi, P.; Bhattacharyya, D.; Borah, B.; Kalita, J.K. A survey of outlier detection methods in network anomaly identification. Comput. J. 2011, 54, 570–588. [Google Scholar] [CrossRef]
- Dietterich, T.G. Ensemble methods in machine learning. In International Workshop on Multiple Classifier Systems; Springer: Berlin/Heidelberg, Germany, 2000; pp. 1–15. [Google Scholar]
- Das, S.; Venugopal, D.; Shiva, S. A Holistic Approach for Detecting DDoS Attacks by Using Ensemble Unsupervised Machine Learning. In Proceedings of the Future of Information and Communication Conference, San Francisco, CA, USA, 5–6 March 2020; pp. 721–738. [Google Scholar]
- Das, S.; Mahfouz, A.M.; Venugopal, D.; Shiva, S. DDoS Intrusion Detection Through Machine Learning Ensemble. In Proceedings of the 2019 IEEE 19th International Conference on Software Quality, Reliability and Security Companion (QRS-C), Sofia, Bulgaria, 22–26 July 2019; pp. 471–477. [Google Scholar]
- Ashrafuzzaman, M.; Das, S.; Chakhchoukh, Y.; Shiva, S.; Sheldon, F.T. Detecting stealthy false data injection attacks in the smart grid using ensemble-based machine learning. Comput. Secur. 2020, 97, 101994. [Google Scholar] [CrossRef]
- Belavagi, M.C.; Muniyal, B. Performance evaluation of supervised machine learning algorithms for intrusion detection. Procedia Comput. Sci. 2016, 89, 117–123. [Google Scholar] [CrossRef]
- Ashfaq, R.A.R.; Wang, X.Z.; Huang, J.Z.; Abbas, H.; He, Y.L. Fuzziness based semi-supervised learning approach for intrusion detection system. Inf. Sci. 2017, 378, 484–497. [Google Scholar] [CrossRef]
- MeeraGandhi, G. Machine learning approach for attack prediction and classification using supervised learning algorithms. Int. J. Comput. Sci. Commun. 2010, 1, 11465–11484. [Google Scholar]
- Lippmann, R.; Haines, J.W.; Fried, D.J.; Korba, J.; Das, K. The 1999 DARPA off-line intrusion detection evaluation. Comput. Netw. 2000, 34, 579–595. [Google Scholar] [CrossRef]
- Perez, D.; Astor, M.A.; Abreu, D.P.; Scalise, E. Intrusion detection in computer networks using hybrid machine learning techniques. In Proceedings of the 2017 XLIII Latin American Computer Conference (CLEI), Cordoba, Argentina, 4–8 September 2017; pp. 1–10. [Google Scholar]
- Villalobos, J.J.; Rodero, I.; Parashar, M. An unsupervised approach for online detection and mitigation of high-rate DDoS attacks based on an in-memory distributed graph using streaming data and analytics. In Proceedings of the Fourth IEEE/ACM International Conference on Big Data Computing, Applications and Technologies, Austin, TX, USA, 5–8 December 2017; pp. 103–112. [Google Scholar]
- Jabez, J.; Muthukumar, B. Intrusion detection system (IDS): Anomaly detection using outlier detection approach. Procedia Comput. Sci. 2015, 48, 338–346. [Google Scholar] [CrossRef]
- Bindra, N.; Sood, M. Detecting DDoS attacks using machine learning techniques and contemporary intrusion detection dataset. Autom. Control. Comput. Sci. 2019, 53, 419–428. [Google Scholar] [CrossRef]
- Lima Filho, F.S.d.; Silveira, F.A.; de Medeiros Brito Junior, A.; Vargas-Solar, G.; Silveira, L.F. Smart detection: An online approach for DoS/DDoS attack detection using machine learning. Secur. Commun. Netw. 2019, 2019. [Google Scholar] [CrossRef]
- Idhammad, M.; Afdel, K.; Belouch, M. Semi-supervised machine learning approach for DDoS detection. Appl. Intell. 2018, 48, 3193–3208. [Google Scholar] [CrossRef]
- Suresh, M.; Anitha, R. Evaluating machine learning algorithms for detecting DDoS attacks. In Proceedings of the International Conference on Network Security and Applications, Chennai, India, 15–17 July 2011; pp. 441–452. [Google Scholar]
- Usha, G.; Narang, M.; Kumar, A. Detection and Classification of Distributed DoS Attacks Using Machine Learning. In Computer Networks and Inventive Communication Technologies; Springer: Berlin/Heidelberg, Germany, 2021; pp. 985–1000. [Google Scholar]
- Zhang, N.; Jaafar, F.; Malik, Y. Low-rate DoS attack detection using PSD based entropy and machine learning. In Proceedings of the 2019 6th IEEE International Conference on Cyber Security and Cloud Computing (CSCloud)/2019 5th IEEE International Conference on Edge Computing and Scalable Cloud (EdgeCom), Paris, France, 21–23 June 2019; pp. 59–62. [Google Scholar]
- Yuan, X.; Li, C.; Li, X. DeepDefense: Identifying DDoS attack via deep learning. In Proceedings of the 2017 IEEE International Conference on Smart Computing (SMARTCOMP), Hong Kong, China, 29–31 May 2017; pp. 1–8. [Google Scholar]
- Hou, J.; Fu, P.; Cao, Z.; Xu, A. Machine learning based DDoS detection through netflow analysis. In Proceedings of the MILCOM 2018-2018 IEEE Military Communications Conference (MILCOM), Los Angeles, CA, USA, 29–31 October 2018; pp. 1–6. [Google Scholar]
- Wolpert, D.H. Stacked generalization. Neural Netw. 1992, 5, 241–259. [Google Scholar] [CrossRef]
- Smyth, P.; Wolpert, D. Stacked density estimation. In Proceedings of the Advances in neural information processing systems, Denver, CO, USA, 30 November–5 December 1998; pp. 668–674. [Google Scholar]
- Hosseini, S.; Azizi, M. The hybrid technique for DDoS detection with supervised learning algorithms. Comput. Netw. 2019, 158, 35–45. [Google Scholar] [CrossRef]
- Ao, X.; Luo, P.; Ma, X.; Zhuang, F.; He, Q.; Shi, Z.; Shen, Z. Combining supervised and unsupervised models via unconstrained probabilistic embedding. Inf. Sci. 2014, 257, 101–114. [Google Scholar] [CrossRef]
- Mittal, M.; Kumar, K.; Behal, S. Deep learning approaches for detecting DDoS attacks: A systematic review. Soft Comput. 2023, 27, 13039–13075. [Google Scholar] [CrossRef]
- Balaban, D. Are you Ready for These 26 Different Types of DDoS Attacks? Secur. Mag. 2020. Available online: https://www.securitymagazine.com/articles/92327-are-you-ready-for-these-26-different-types-of-ddos-attacks (accessed on 14 February 2024).
- Hastie, T.; Tibshirani, R.; Friedman, J. The Elements of Statistical Learning: Data Mining, Inference, and Prediction, 2nd ed.; Springer: New York, NY, USA, 2008. [Google Scholar]
- Pedregosa, F.; Varoquaux, G.; Gramfort, A.; Michel, V.; Thirion, B.; Grisel, O.; Blondel, M.; Prettenhofer, P.; Weiss, R.; Dubourg, V.; et al. Scikit-learn: Machine Learning in Python. J. Mach. Learn. Res. 2011, 12, 2825–2830. [Google Scholar]
- Tavallaee, M.; Bagheri, E.; Lu, W.; Ghorbani, A.A. A detailed analysis of the KDD CUP 99 data set. In Proceedings of the 2009 IEEE Symposium on Computational Intelligence for Security and Defense Applications, Ottawa, ON, Canada, 8–10 July 2009; pp. 1–6. [Google Scholar]
- Moustafa, N.; Slay, J. UNSW-NB15: A comprehensive data set for network intrusion detection systems. In Proceedings of the 2015 Military Communications and Information Systems Conference (MilCIS), Canberra, ACT, Australia, 10–12 November 2015; pp. 1–6. [Google Scholar]
- Sharafaldin, I.; Lashkari, A.H.; Ghorbani, A.A. Toward generating a new intrusion detection dataset and intrusion traffic characterization. In Proceedings of the 4th International Conference on Information Systems Security and Privacy (ICISSP 2018), Funchal, Madeira, Portugal, 22–24 January 2018; pp. 108–116. [Google Scholar] [CrossRef]
- Das, S.; Venugopal, D.; Shiva, S.; Sheldon, F.T. Empirical evaluation of the ensemble framework for feature selection in DDoS attack. In Proceedings of the 2020 7th IEEE International Conference on Cyber Security and Cloud Computing (CSCloud)/2020 6th IEEE International Conference on Edge Computing and Scalable Cloud (EdgeCom), New York, NY, USA, 1–3 August 2020; pp. 56–61. [Google Scholar]
- Sokolova, M.; Lapalme, G. A systematic analysis of performance measures for classification tasks. Inf. Process. Manag. 2009, 45, 427–437. [Google Scholar] [CrossRef]

Disclaimer/Publisher’s Note: The statements, opinions and data contained in all publications are solely those of the individual author(s) and contributor(s) and not of MDPI and/or the editor(s). MDPI and/or the editor(s) disclaim responsibility for any injury to people or property resulting from any ideas, methods, instructions or products referred to in the content. |
© 2024 by the authors. Licensee MDPI, Basel, Switzerland. This article is an open access article distributed under the terms and conditions of the Creative Commons Attribution (CC BY) license (https://creativecommons.org/licenses/by/4.0/).