1. Introduction
Urbanization over the past several centuries, combined with outdated design approaches, has led to overcrowded cities plagued by traffic and pollution, negatively affecting public health and well-being [
1]. To counter these issues, sustainable and resilient urban regeneration solutions, including nature-based approaches [
2], have emerged. However, urban regeneration remains complex, involving multiple stakeholders [
3] and requiring substantial time and resources [
4], which limits exploration of alternative solutions. Generative design tools have been introduced to address these constraints, leveraging artificial intelligence and machine learning to produce rapid architectural alternatives tailored to user input [
5]. These tools can support architects and urban planners in quickly generating a wide array of solutions [
6], yet they face challenges in consistency and alignment with user preferences, such as sustainability and cultural relevance.
The concept of generative design, introduced in the 1970s [
7], has advanced significantly. Recent studies, like those of Zhang et al. [
8] and Gradivsar et al. [
9], have applied generative design algorithms to architectural problems, such as floor planning and shading design, underscoring the need for further research. In particular, Artificial Intelligence-Generated Imagery (AIGI) has introduced new possibilities for generating diverse architectural interventions and is capable of enhancing traditional design [
10,
11] approaches. Despite its potential, examples of AIGI in generative design for architecture and urban design are limited. Studies by Junk et al. [
12] and Quan et al. [
13] explored AIGI’s applicability, with promising findings for urban regeneration, though challenges remain regarding sustainability and optimization.
The broader adoption of AIGI in architecture has led to promising applications in urban design and planning [
14]. Baduge et al. [
15] combined AIGI with building information models and big data for enhanced construction visualization, while Phillips et al. [
16] used tools like DALL-E and stable diffusion to generate urban design ideas, suggesting their value in early-stage brainstorming. Beyond architecture, much of the literature on AIGI focuses on art and creativity [
17], though intriguing applications in 3D image generation are emerging. For example, Gao et al. [
18] and Xian et al. [
19] have used GAN-based models to produce consistent high-resolution 3D images.
This study introduces a novel generative design framework leveraging AIGI- and machine learning-based ranking to accelerate urban regeneration planning. Using a pre-trained stable diffusion image-inpainting model [
20] to generate multiple alternative nature-based solutions, our approach ranks these solutions using a machine learning model trained on user preferences, prioritizing the most suitable options [
21]. This ranking system addresses the evaluation challenge, offering a systematic way to streamline design choices based on end-user needs, thus enhancing current Generative Design Systems (GDSs) and making AIGI more accessible to architectural and urban design applications.
This work does not focus on comparing state-of-the-art (SotA) methods for content generation, but rather introduces an innovative methodology aimed at enhancing current Generative Design Systems (GDSs). It expands the application of AIGI technology to the engineering domain, an area that has been under-explored, as much of the current literature is centered on medical and artistic applications. In addition, our approach accelerates the design process by quickly generating numerous alternative solutions, reducing costs and time. The methodology also addresses the challenge of irrelevant solutions by applying learning-to-rank algorithms, which efficiently sort solutions based on user preferences, streamlining the decision-making process.
The contribution of this work can be summarized as follows:
Introducing an innovative methodology to enhance current Generative Design Systems.
Extending the application of Artificial Intelligence Generated Images technology to the engineering domain.
Investigating the acceleration of the Design Process and the reduction of costs by quickly generating numerous alternative solutions.
Addressing the issue of irrelevant solutions by using learning-to-rank algorithms for efficient preference-based sorting.
The remainder of the document is organized as follows:
Section 2 presents in detail the proposed GDS;
Section 3 discusses the experimental setup and results;
Section 4 provides insight and analysis based on the findings; and
Section 5 concludes the work.
2. Proposed Methodology
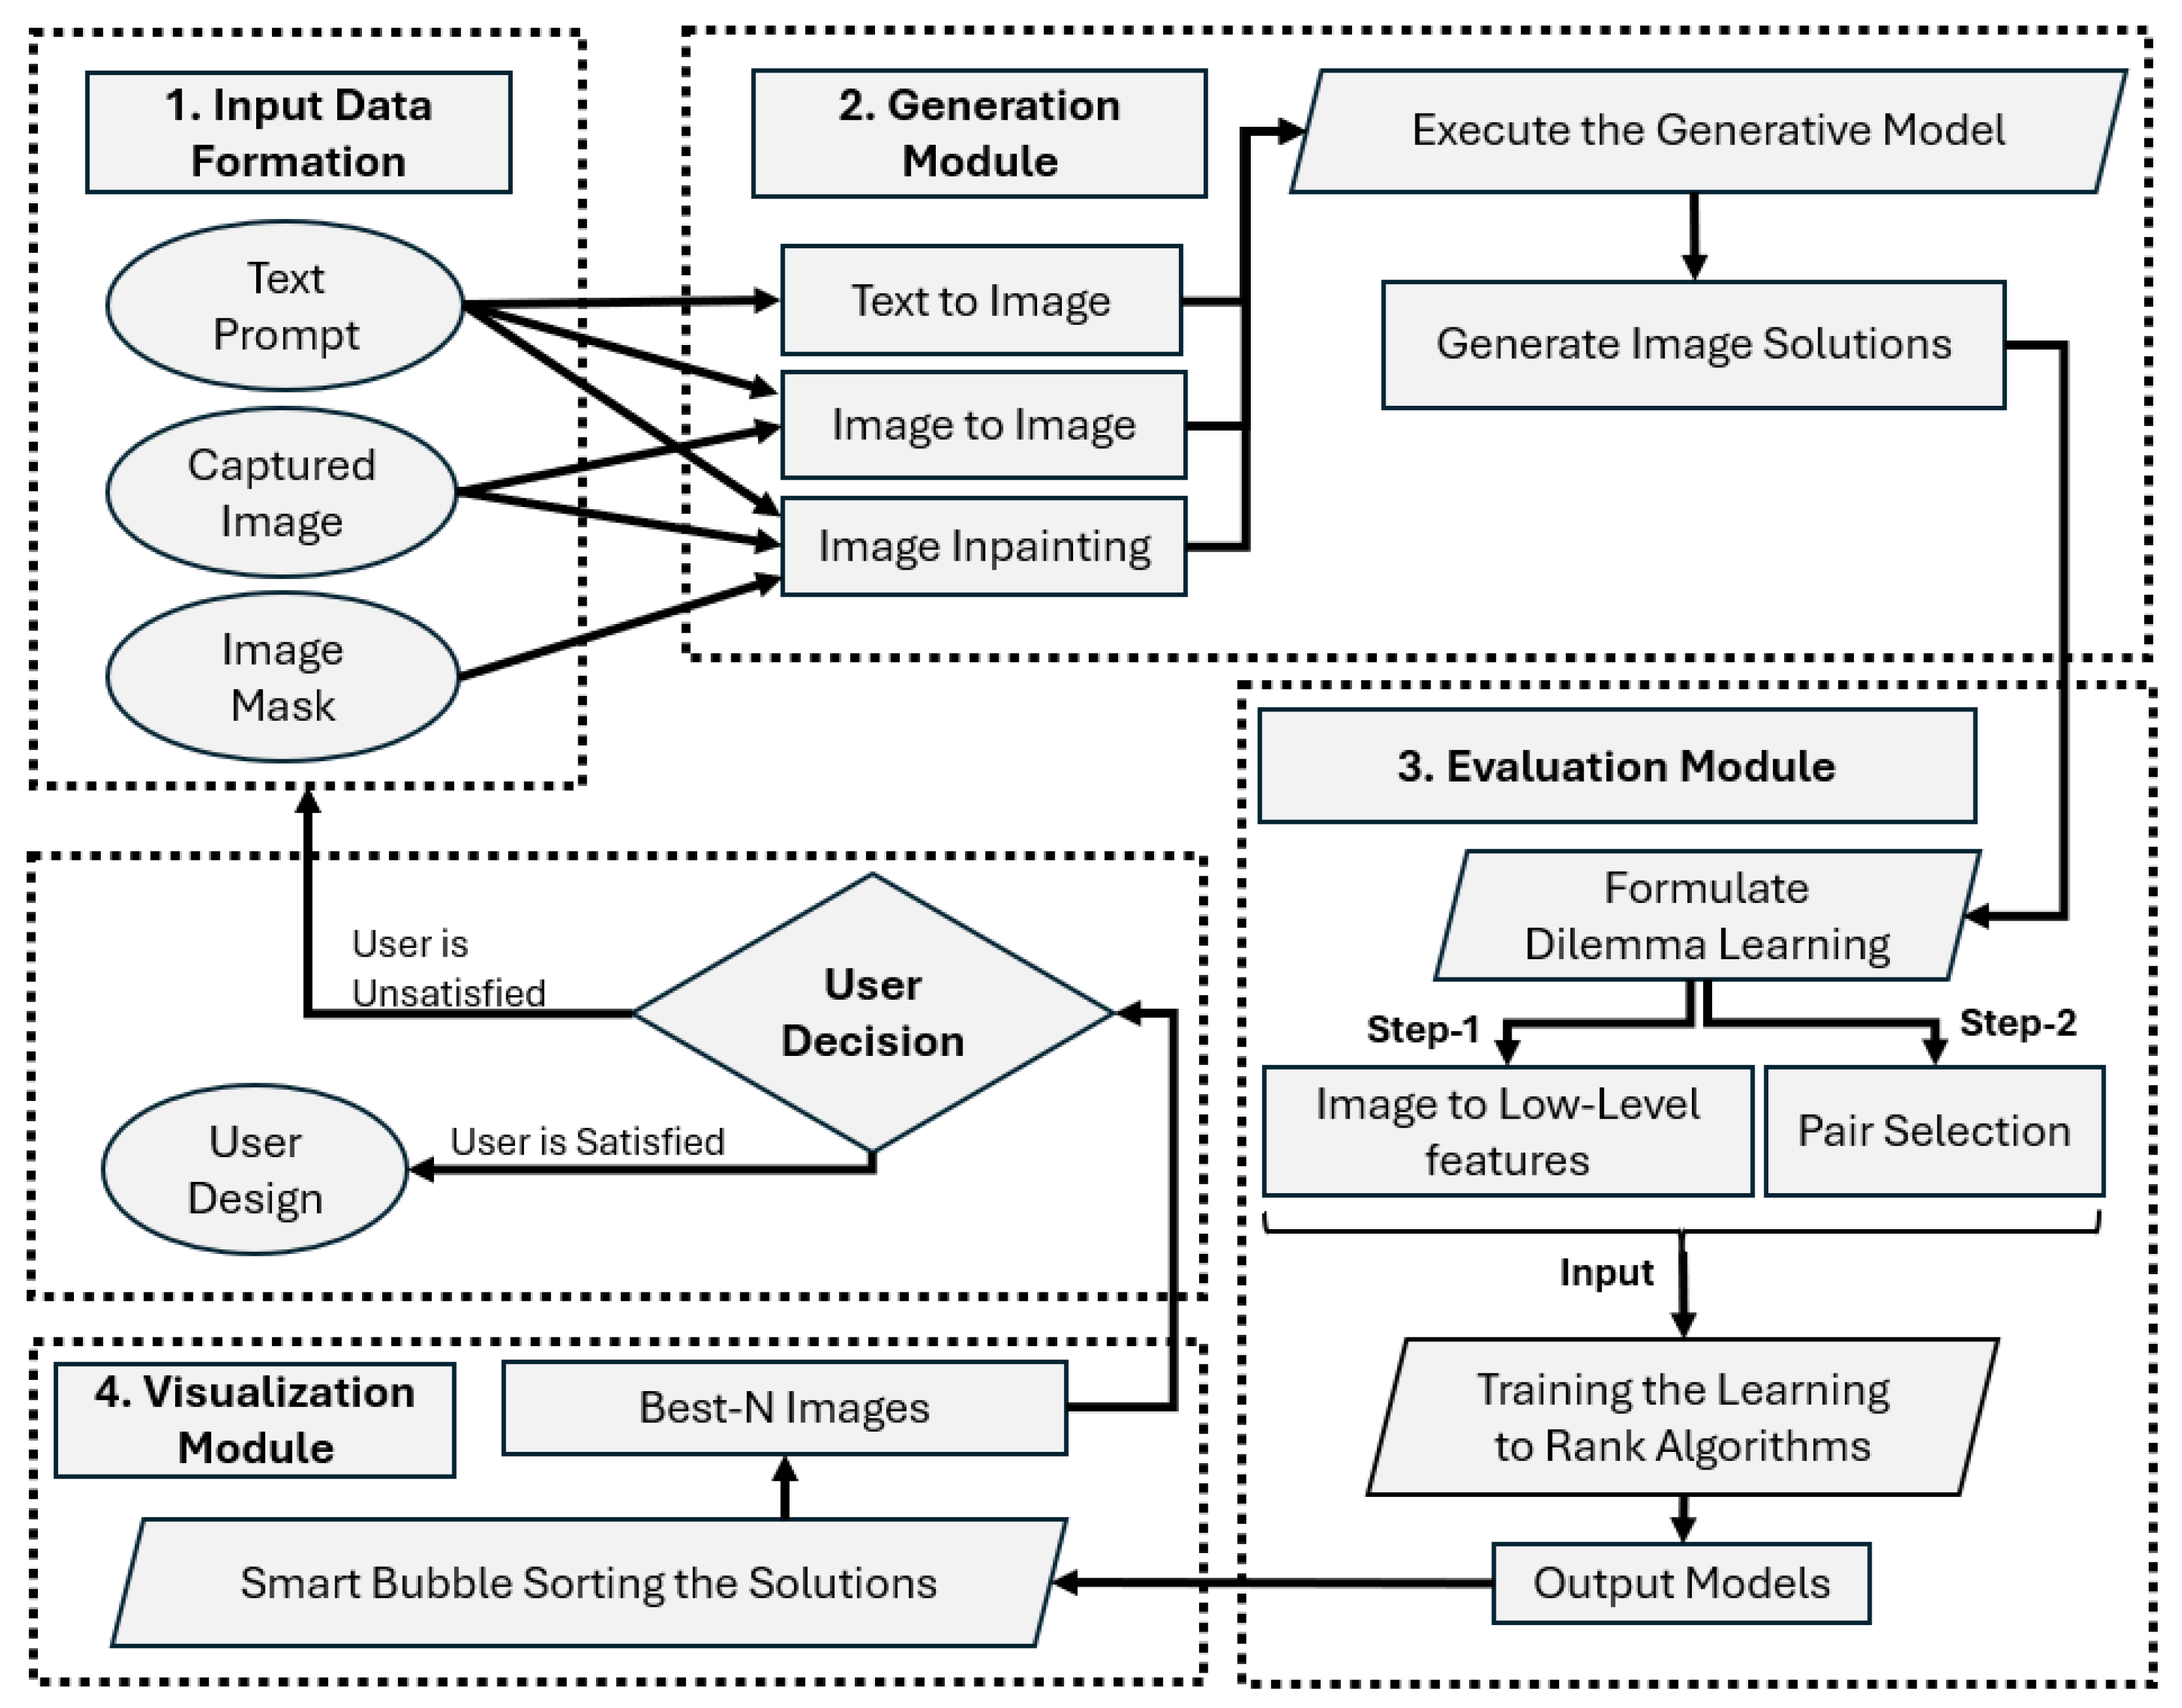
The problem at hand entails the handling of large amounts of generated content, according to the needs/preferences of the user. As such, the proposed methodology consists of four phases: (a) Input Data Formation, (b) the generation of multiple intervention alternatives using GenAI image-inpainting methods (Generation Module), (c) modeling the user’s preferences based pairwise image comparisons (Evaluation Module), and (d) ranking all images using the trained machine learning models, developed in the second phase (Visualization Module).
Figure 1 illustrates the proposed GDS framework.
The first module of the GDS framework is the Input Data Formation. In this module, the architect or urban planner collects the data (i.e., defines the text prompt, captures at least one image from the area of interest, and creates the 2-bit mask). Depending on the needs of the project and the data formation, the next module (Generation Module) provides the necessary algorithms for generating the image solutions, e.g., image-inpainting. At this point, it is necessary to clarify that the user decides the number of the generated images.
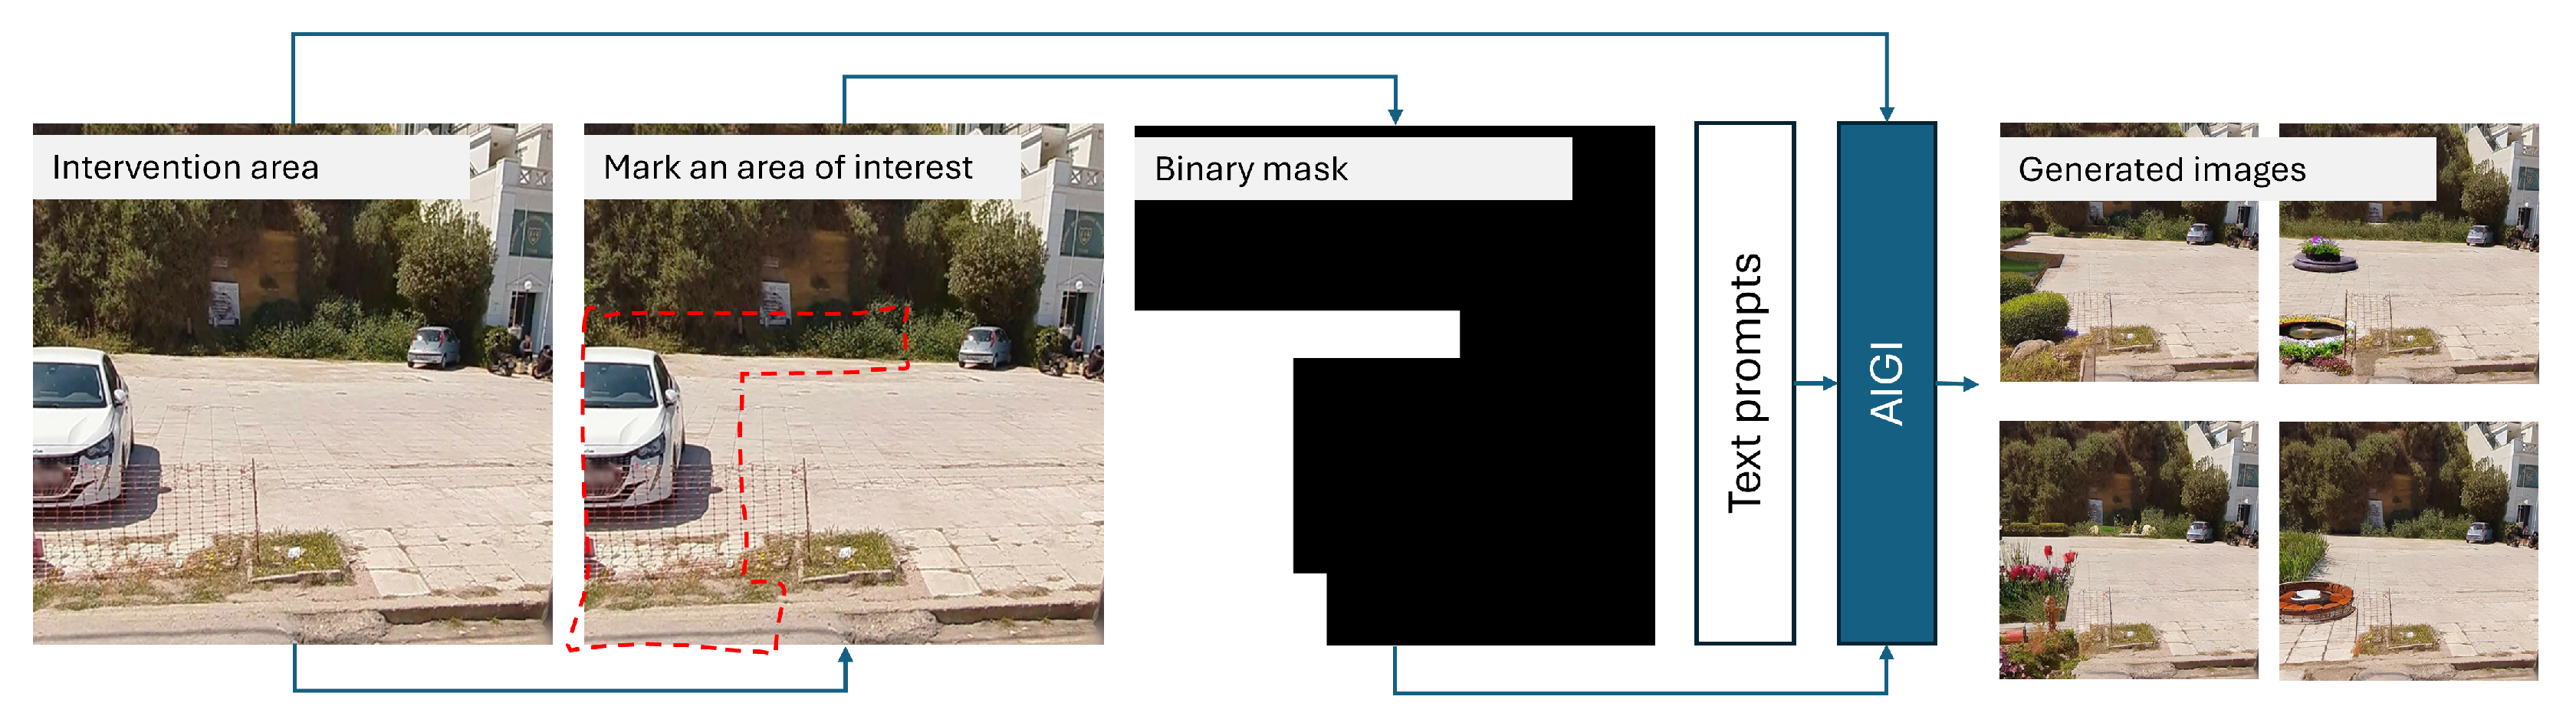
Figure 2 demonstrates this process. The user roughly indicates the regions of interest over an image, which is necessary for the creation of a corresponding binary mask. The original RGB image, the binary mask, and the text prompt are used as inputs to the image generator model. Such a set up allows for interventions over specific areas, which blend with the existing environment.
The Evaluation Module is responsible for the dilemma-based problem formulation, which is achieved in two steps. In the first step, the generated images are described through various feature values depending on the design necessities. These values can be either user-provided or automatically extracted, e.g., image processing techniques. During the second step, the user is asked to sequentially select the best of two images in a relatively small sub-sample of the generated output. These two steps create the necessary data for training the pairwise classification algorithms as follows: (a) training-input: the sub-sample’s labeled images; and (b) training-output: the selections of the users between all the pairs that can be formulated from the sub-sample.
The output of the Evaluation Module is a classification model, which can be used for image ranking through image pairwise comparisons and confidence score assessments. In the final module of the system (Visualization Module), the previously trained classification model sorts the generated images via the smart bubble sorting algorithm, from the best to preferred to the least preferred solutions. Then, the user can observe the N-Best solutions, where N is a user-defined number. If the results comply with the user’s requirements and align with his/her preferences, the process is finished. The user may proceed with the final designs based on the proposed solutions of the GDS. Otherwise, the user can re-execute the algorithm and generate more images.
2.1. Input Data Formation and Generation Module
Generative Adversarial Networks (GANs) [
22] and diffusion models [
23] can both be used for the generation of high-quality images. Diffusion models have been selected as the core of this approach, as in [
24], since they produce more realistic images. There are different approaches, i.e., text-to-image, image-to-image, and image-inpainting.
Each method can provide a variety of solutions in a large number that address the needs of the user. Although all methods can provide inspiring suggestions that encourage brainstorming, the image-inpainting method (see
Appendix A for more information) is slightly advantageous compared to the others, because the output visualization considers the area of interest. For this reason, the case study of this paper uses image-inpainting to better demonstrate the efficiency of the proposed GDS.
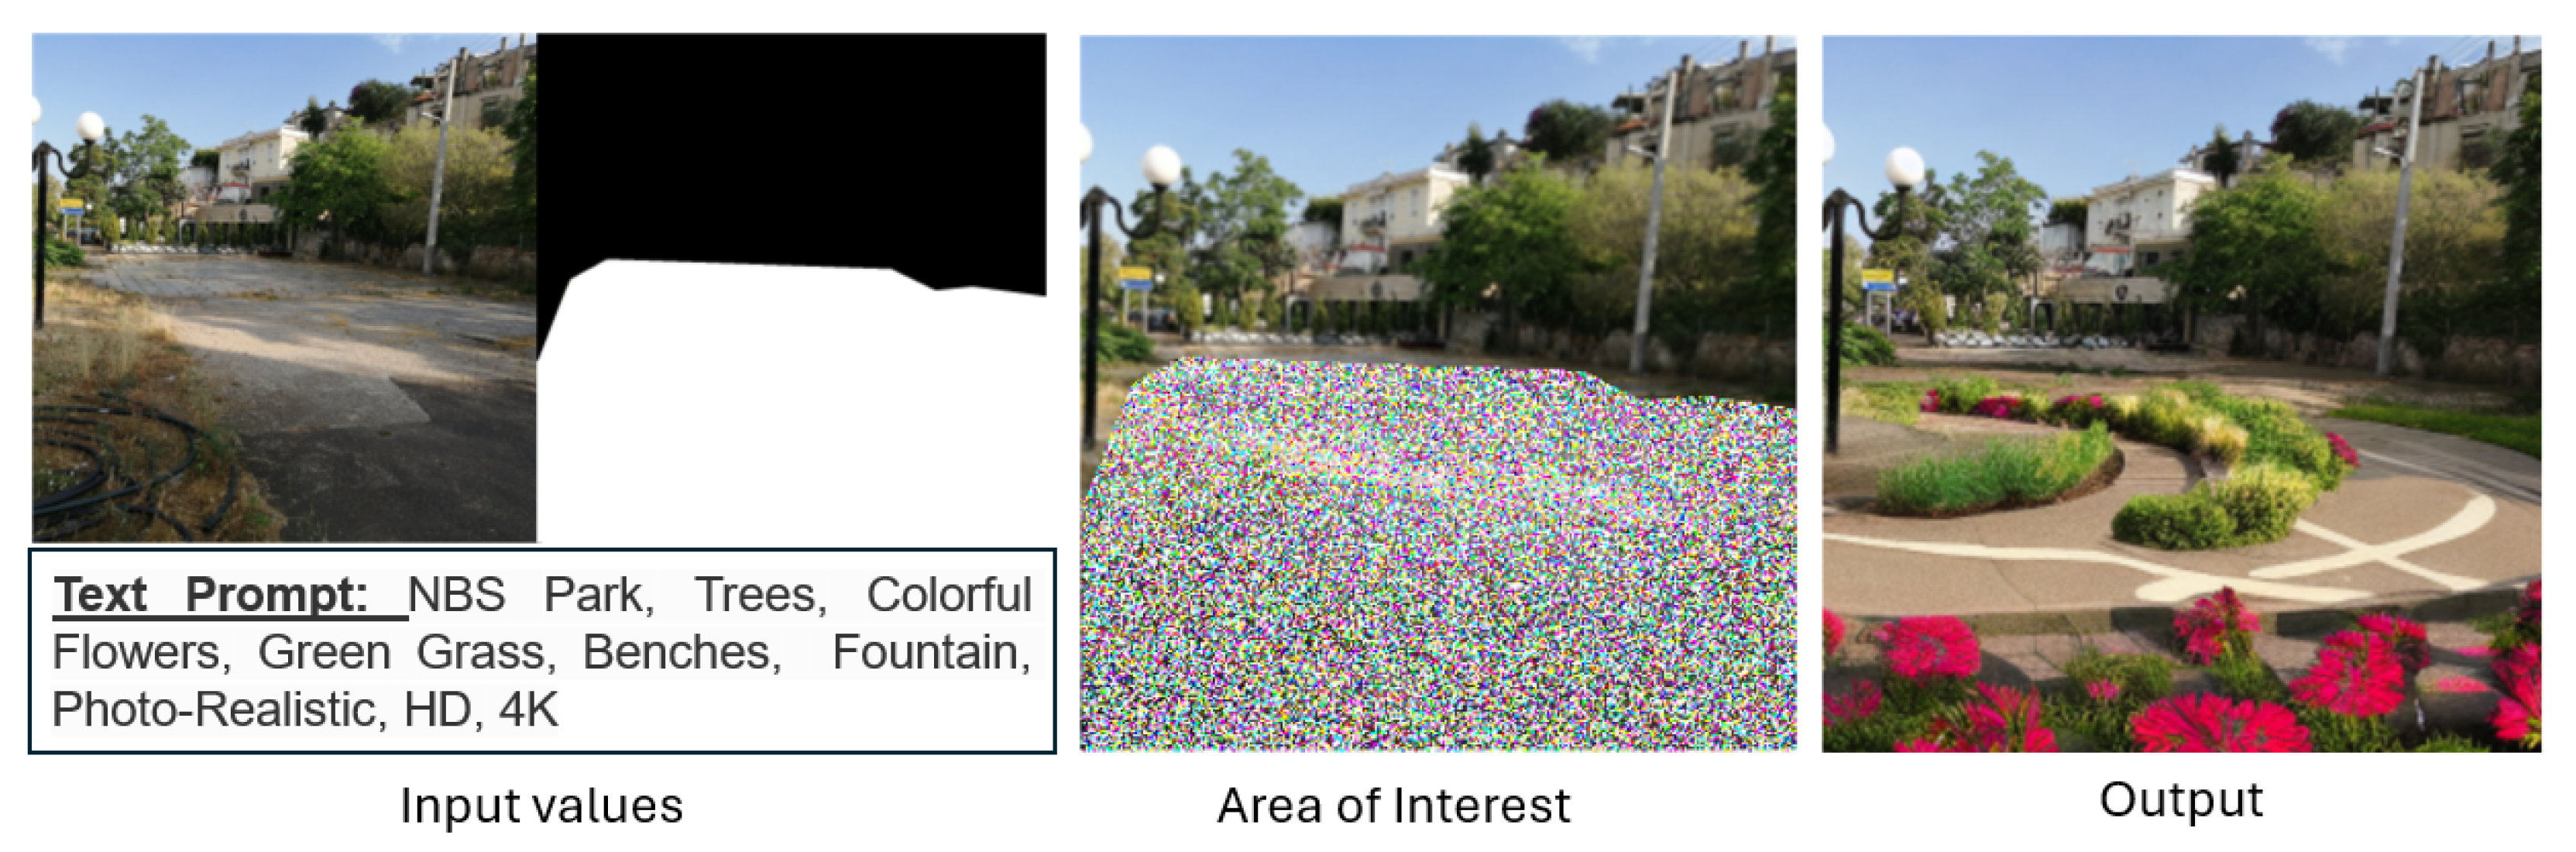
Figure 3 illustrates a visual example of a possible intervention that could be applied in the area of interest, using the image-inpainting method. Such an approach involves using a mask to indicate the area where the generation process will occur. Thus, the output image includes characteristics of the original image. The image-inpainting algorithm can be a powerful tool in the hands of architects and urban planners because it provides not only inspirational ideas that generate brainstorming, but also permits the visualization of these ideas in the area of interest.
2.2. Evaluation Module
The evaluation of the huge number of generated images, which the image-inpainting algorithm is capable of generating, presents multiple challenges. The volume of generated images makes it difficult to examine each one carefully, as reviewers (i.e., architects, urban planners, policy makers, etc.) cannot evaluate the images perfectly. Additionally, comparing image solutions that varies in scale, design style, and complexity requires a standardized set of criteria to ensure fair evaluation. The development of such criteria increases the complexity of the problem at hand and, even in the case of selecting the most critical criteria (i.e., social, economic, architecturally accurate solutions, safety, harmony, vast numbers of green spaces for improving human health and well-being, etc.), the reviewers can be emotionally affected by their own criterion analysis. For these reasons, the creation of machine learning models capable of “understanding” the preferences and opinions of both a single individual and a group can lead to quick and accurate results.
Such algorithms include learning-to-rank models that receives feedback from the user’s preferences by analyzing several selection examples. To achieve this, the Evaluation Module formulates the dilemma problem, which describes the simple question: “Which image is better in this specific pair of images?”. To answer this question, it is necessary to define some criteria by quantifying the image contents that will be used for both the training of the models and their appliance in the next steps. Furthermore, it is also necessary to have the reviewer (or group of reviewers) compare a representative number of image pairs and pick the best/most preferred of the two images. It is not strictly necessary to use all possible pairs, which can be a huge number, but only enough pairs to provide information for training the algorithms. Finally, these data will be used for training and evaluating the ranking models, which are used in the next steps for ordering the images.
2.2.1. Quantifying the Image Contents
This study employs a pre-trained stable diffusion image-inpainting model from the Hugging Face repository [
25], originally introduced by Rombach et al. [
20]. Known for generating realistic images, this model was utilized to create multiple alternative nature-based solutions (NBSs) for the area of interest. Although this particular model was used in our experiments, the proposed Generative Design System (GDS) framework is flexible and can integrate any pre-trained image-inpainting model.
To quantify the image content for further analysis, we focus on extracting low-level features, many of which are binary, from each image. These features capture key characteristics that are used as input for the classification model, which helps to determine user preferences. The image content is characterized by features such as the presence of greenery, water areas, additional park elements, and more. These features allow for a meaningful comparison of the generated solutions.
In the first step, an architect was asked to identify if any of the predetermined characteristic categories appear in an image.
Table 1 displays the proposed binary feature values for the first 10 images of the first intervention area. Even with a small dataset, multiple images shared the same binary code, which could hinder the performance of learning-to-rank algorithms. To mitigate this, we calculated additional color-based ratios—red, green, and blue—ranging from 0 to 1, to introduce more nuanced distinctions between similar samples.
An alternative approach could involve using a group of architects, where each member’s input would produce a binary-labeled series, and the average of these would represent the group’s opinion. This would shift training from individual binary classification to using collective data. Another simplified group approach could be to train one model per member, producing multiple sets of top images and determining the preferred solution by counting an image’s frequency across the group (e.g., using a weighted average). However, these methods would increase the complexity of the experiment and are beyond the scope of this research. This study focuses on a novel methodology to reduce time and cost in the early design phase using AI-generated images and learning-to-order algorithms. Thus, to keep the experiments simple, in this case study, we considered that each architect in a group could work as a distinct individual (the simplified alternative); thus, the opinion of one architect is more than enough to execute the experiment and test the algorithm. In addition, even in the group’s scenario, the team can vote for the best image between the pairs and use the outcome as the group’s selection, which would lead to the same data as those of using only an architect.
Thus, the low-level features used for the demonstration of the GDS framework consider the following cases:
Vegetation Coverage: Indicates the presence of trees, flowers, and other greenery.
Water Elements: Indicates the presence of water features, such us fountains, ponds, etc.
Park Amenities: Indicates the presence of features such as benches, paths, and structures.
Feasibility: Indicates the practicality and implementability of the solution.
Spatial Alignment: Indicates the correct positioning and harmonious arrangement of features.
Red Intensity: Measures the proportion of red in the image.
Green Intensity: Measures the proportion of green in the image.
Blue Intensity: Measures the proportion of blue in the image.
In the second step, the architect compared pairs of images from test sample 1 to select the most preferred option. For
images, with a pairwise comparison
, the maximum number of comparisons is given by Equation (
1), resulting in 1176 comparisons. This process was repeated, and the reverse order of images was also considered, doubling the training-validation set to 2352 samples (Equation (
2)). Importantly, the entire process, i.e., both steps, takes less than 30 min.
2.2.2. User-Based Ranking Mechanisms
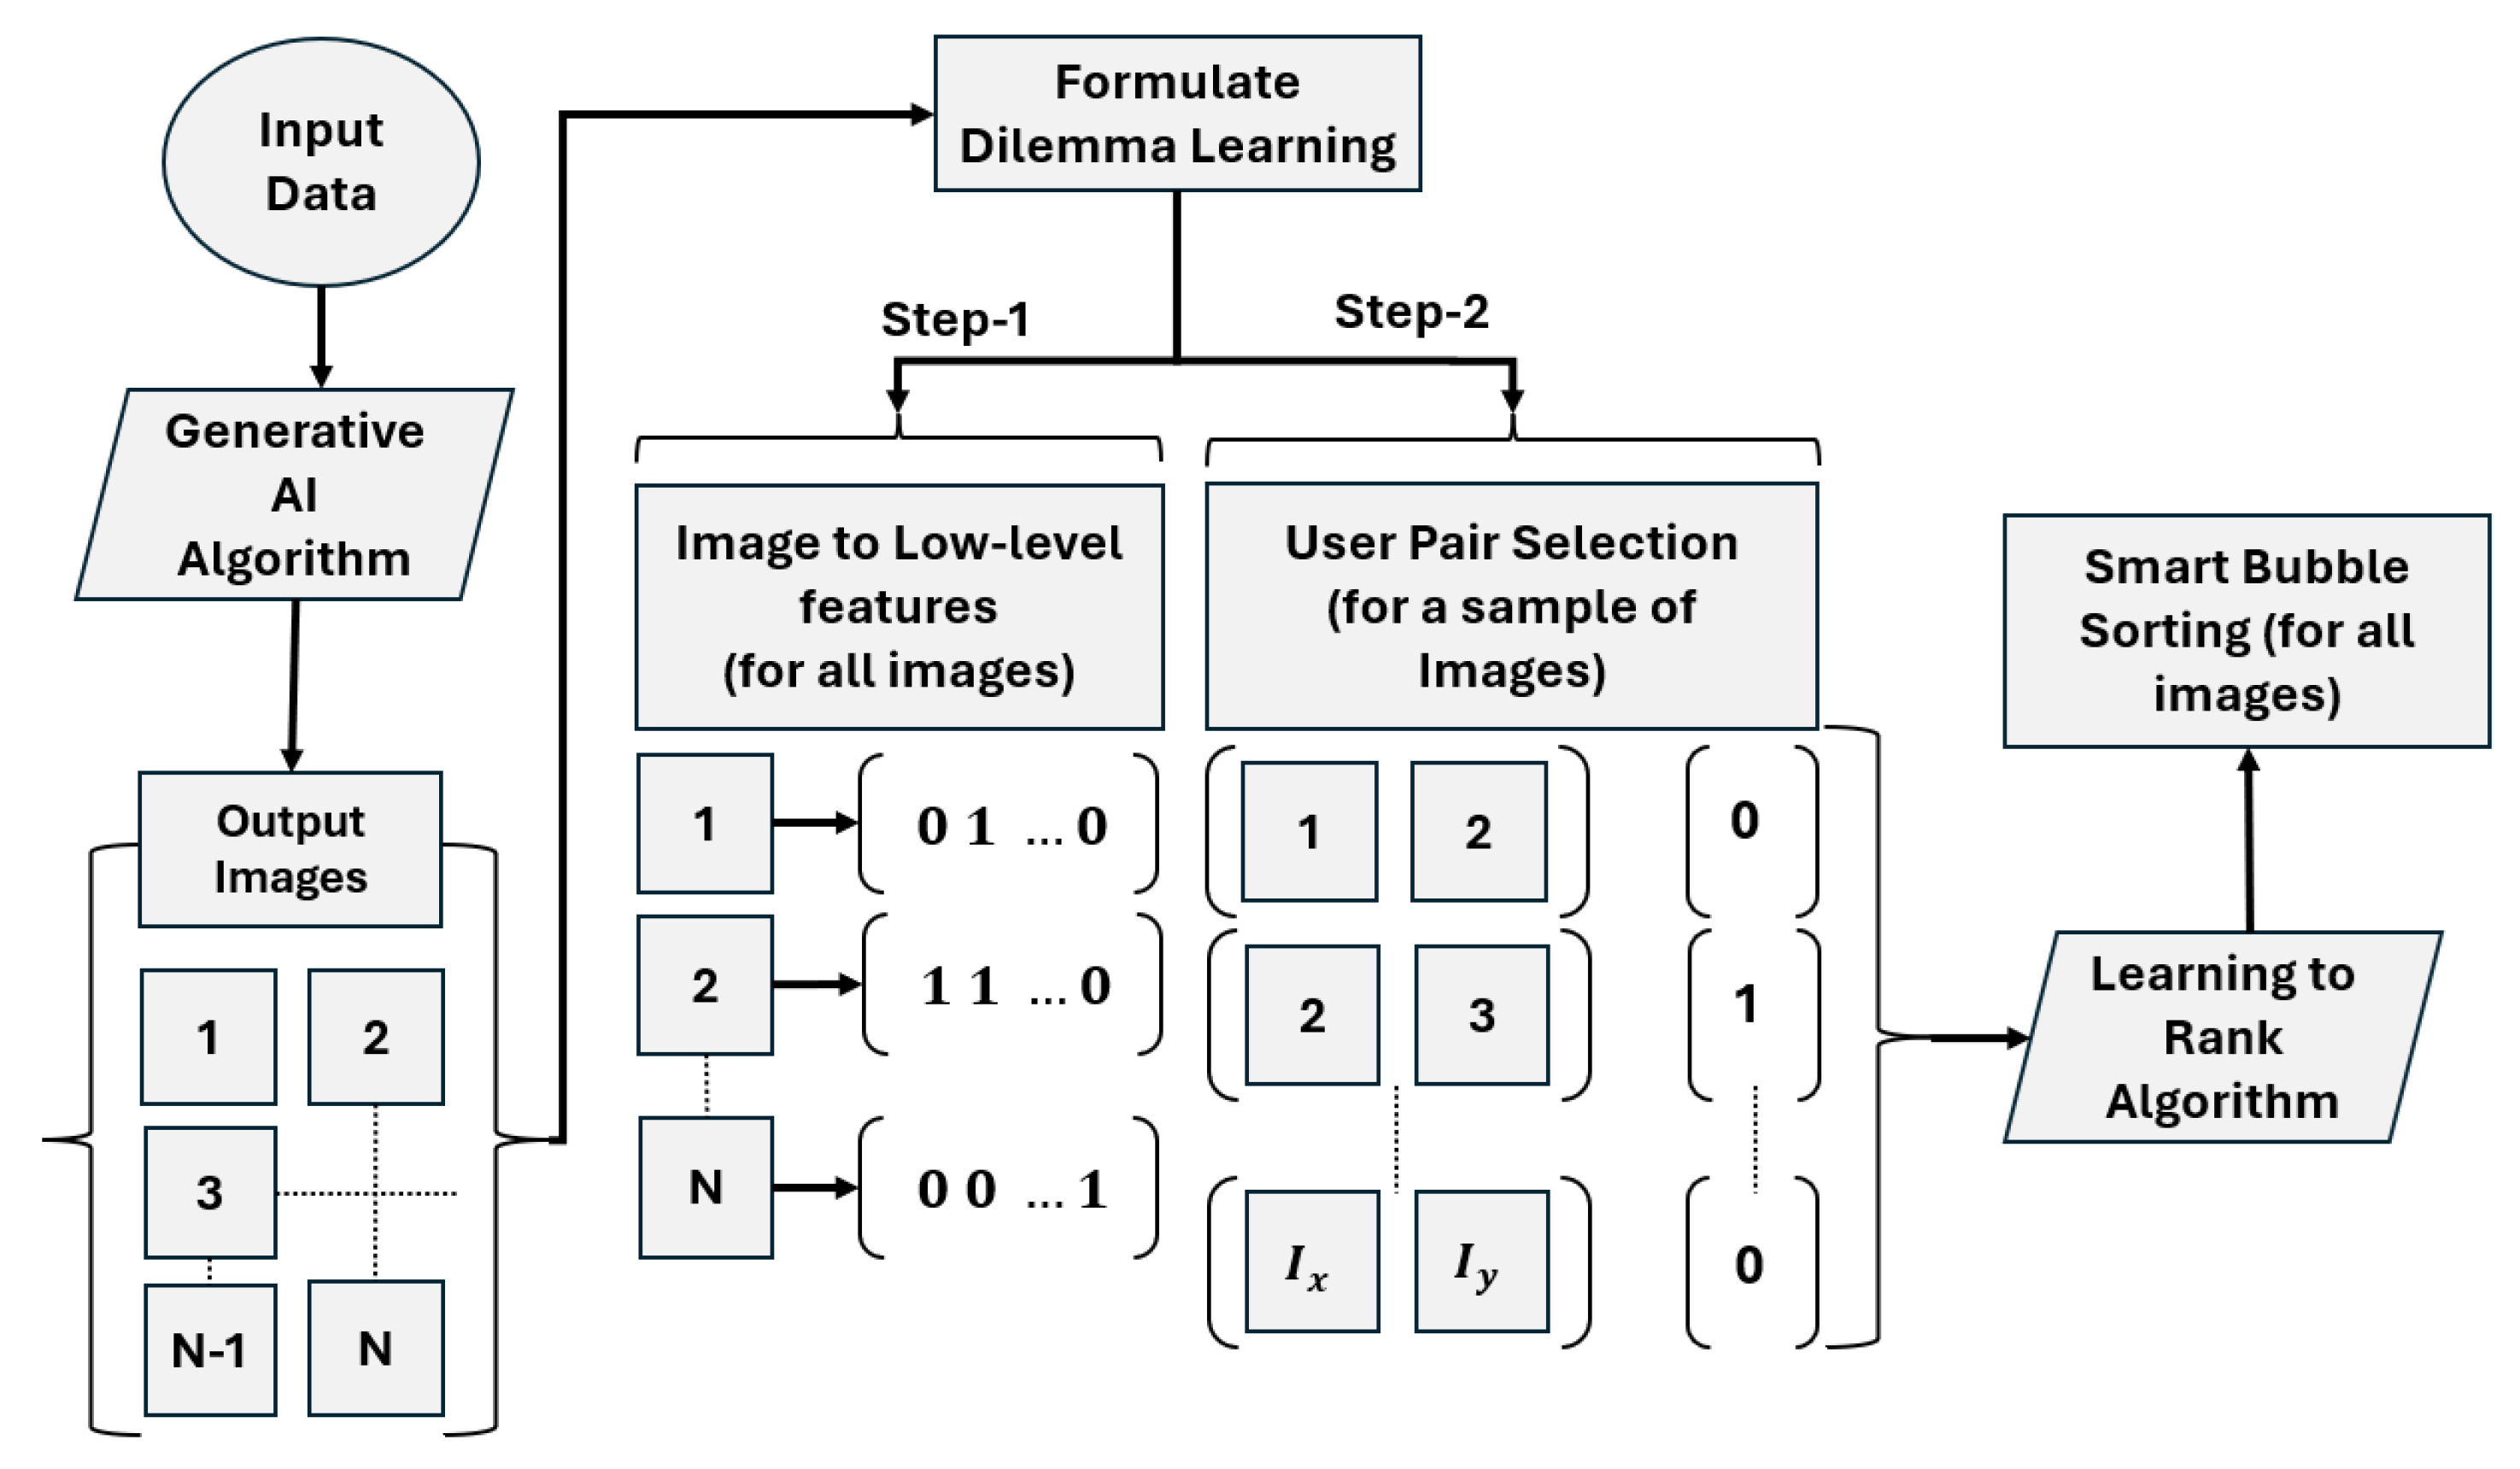
The AIGI technology enables the generation of a vast number of images with potential interventions, offering architects and urban planners inspirational ideas. However, the large volume of generated images poses a challenge for evaluation, as it is impractical for architects to manually assess every image. To tackle this, we introduce a dilemma-based learning approach, where the user selects the preferred image between pairs, helping to model their preferences effectively.
This approach involves two key steps. First, all generated images are transformed into feature vectors based on predefined parameters such as green spaces and realism, as outlined in
Section 2.2.1. Then, the user selects the best image from an indicative sub-sample of pairs. These selections provide data to train pairwise classification algorithms (learning-to-rank), which sort the entire dataset according to user preferences.
Figure 4 outlines the workflow for this process.
For the mathematical representation of the dilemma-based learning, let us define as
and
the two comparative images, and
the 2D-vector of images. In addition, the method for selecting the best of the two images is defined as
. Thus, the dilemma-based learning problem can be expressed in the form of Equation (
3). This formula is first introduced by Cohen et al. [
26] in 1997 as the problem of “Learning to Order Things” (i.e., rank ordering, sorting). The evolution in computation updated the initial definition by the introduction of several pairwise classification [
27] algorithms.
2.2.3. Performance Metrics
For evaluating the robustness of the learning-to-rank models, different metrics were used. Recall that the specific problem is based on a binary classification problem setup. Any two images, in the form of feature vectors, are fed to the classifier. The higher the output value, the more likely that the first image is more appropriate compared to the other, according to the user preferences. A short description of the evaluation metrics [
28] is provided in the next paragraph.
Following the model’s outcomes, we may have four possible scenarios:
True Positive (TP): An image was correctly denoted as preferable, compared to the alternative, during the pairwise comparison, when fed to the classification model.
False Positive (FP): An image was wrongly denoted as preferable, compared to the alternative, during the pairwise comparison, when fed to the classification model.
(c) True Negative (TN): An image was correctly denoted as non-preferable, compared to the alternative, during the pairwise comparison, when fed to the classification model.
(d) False Negative (FN): An image was wrongly denoted as non-preferable, compared to the alternative, during the pairwise comparison, when fed to the classification model.
Using these values, the following evaluation metrics are calculated:
Accuracy (ACC): Indicates the number of correctly classified samples over the total number of samples, defined as .
Precision (Pre): Refers to the proportion of true positives over the total predicted positives, given by .
Rec: Measures the model’s ability to predict all true positives, calculated as .
F1-score (F1): Combines precision and recall to evaluate overall model performance, where a score closer to 1 indicates better performance. The formula is .
2.3. Visualization Module
The Visualization Module is responsible for showing to the experts the final results. By leveraging the trained models, the experts can sort the images from the most preferred solution to the least. This is achieved by using the bubble sort method to order the generated images. Bubble sort is a straightforward algorithm that compares adjacent items and swaps them if they are out of order, making it easy to implement and understand. In this point, it is important to specify that it is not strictly necessary to use bubble sort for ordering; other methods like quicksort or mergesort can be equally used. However, in this case study, we deployed a smart bubble sorting algorithm as described below, mainly for keeping the experiment as simple as possible and to focus on the point, which is to examine the synergies between the modules and their capability of being applied in architectural design applications.
Smart Bubble Sorting Based on Pairwise Classification
Let us denote a training set that contains representative images (sub-sample) as
S and the method that selects the best image between of two as
:
where
are two selected images. In reality, the method
defines the rank order between the image pair
with respect to the user’s preferences. To be more precise, when
(or, respectively,
), this is interpreted as a strong recommendation of
being more preferred (or less preferred) than
. Moreover, a value of around 0.5 indicates an abstention of making any recommendations.
The low-level, mostly binary, features are considered as the input parameters for the pairwise classification algorithms, while the output targets are the user’s selections (preferences) on the sub-sample
S. By using this approach, it is possible to estimate the weights of the pairwise classification method
. For this point, it is worth mentioning that for the case of many users (i.e., groups of architects or urban planners), it is necessary to perform a weighted average policy based on all users’ selections before estimating the weights of the
[
29].
Finally, the
method can be used for ordering the images of the whole generated dataset. Due to the fact that the algorithms’ output will be near 0 or 1 in most cases, due to calculation accuracy, the bubble sort problem can be expressed by Equation (
5). Thus, if the output value is less than
, then the order remains the same (i.e., the
image is more preferred than the
), or else, the images are reversed (i.e., the
image is more preferred than the
). By applying this method on a loop, the whole generated dataset is sorted from the most to least preferred order, and thus, it becomes possible for the user to use the first N-Best solutions for inspiration and brainstorming.
3. Experimental Setup
In this section, we present the setup and methodology used to evaluate the proposed generative design framework. The experiments are structured around three main components: intervention areas, performance metrics, and experimental results. First, we selected real-world locations as intervention areas to demonstrate the practical application of the system. We then applied several performance metrics to measure the effectiveness of the learning-to-rank models used in evaluating the generated designs. Finally, we present the experimental results, showcasing both the generation of alternative design solutions and the accuracy of the ranking algorithms. This comprehensive approach aims to validate the framework’s feasibility while highlighting areas for potential improvement in future studies.
3.1. The Intervention Areas
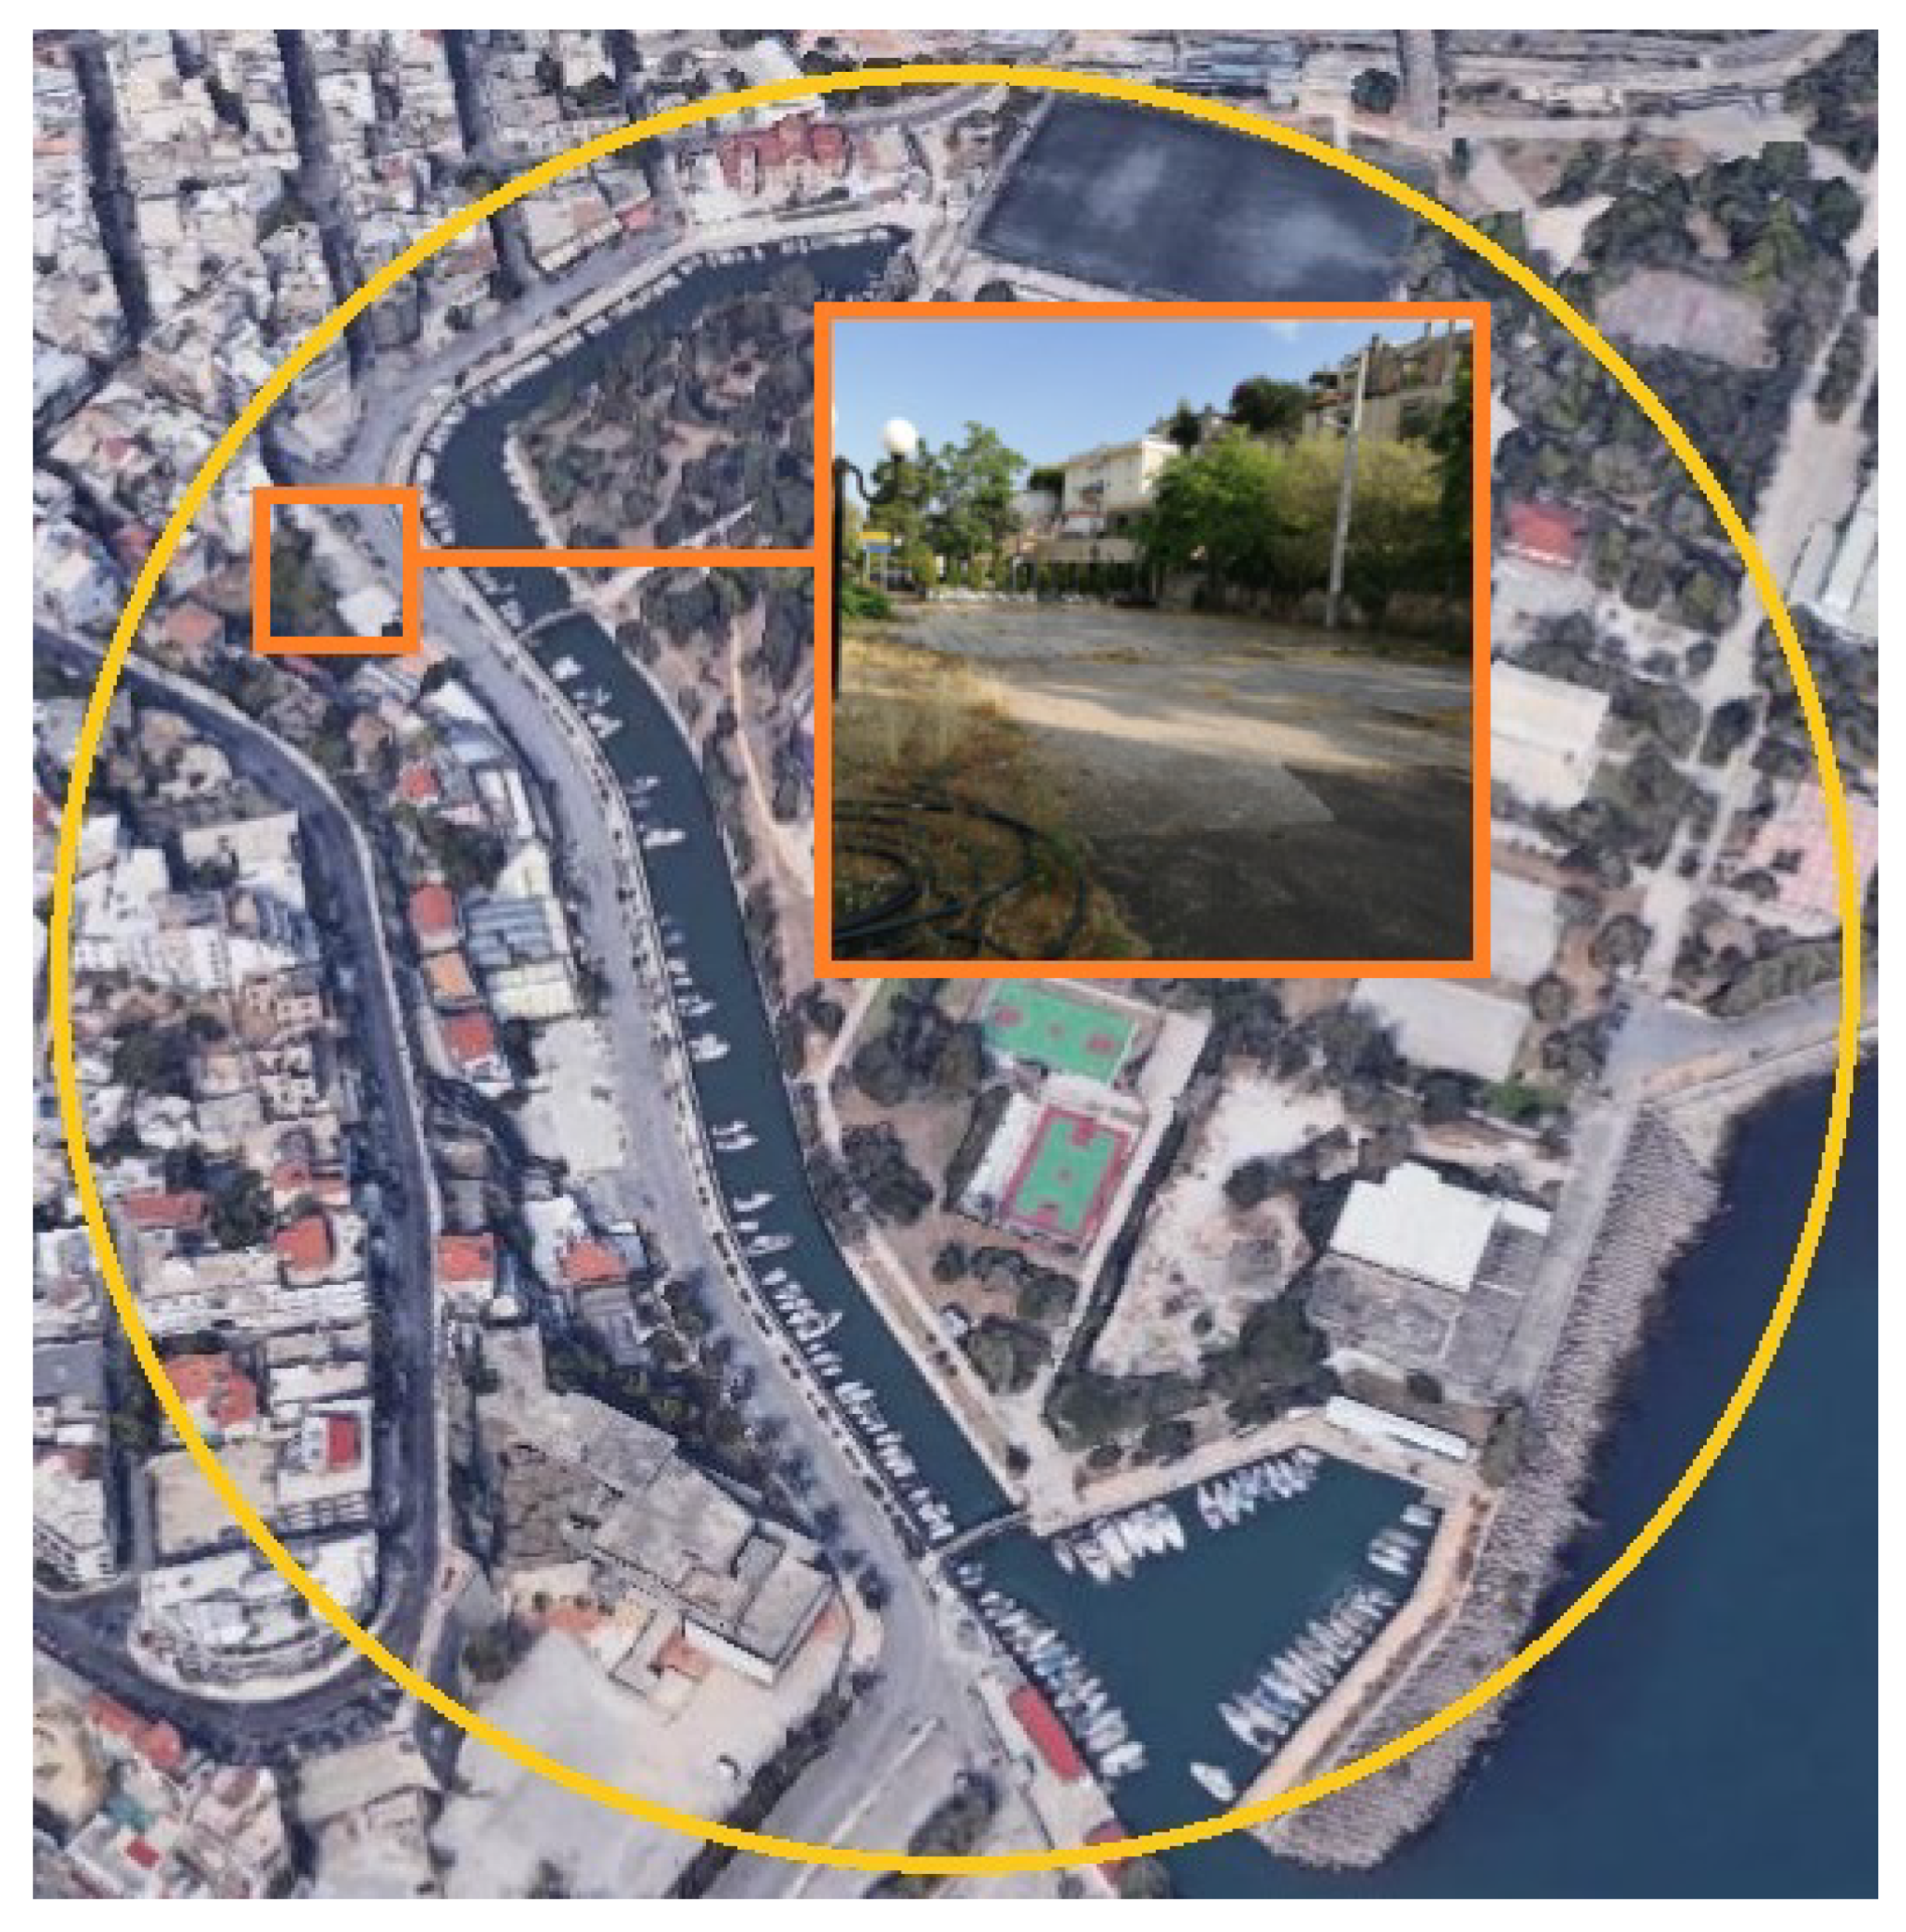
For the demonstration of the proposed GDS, an area at Dilaveri Coast, in Piraeus, Greece, was selected. Currently, the place is used as a parking space.
Figure 5 highlights this parking area, which is planned for renovation.
A defining feature of Dilaveri Coast is the presence of a water canal, with an adjacent area containing trees. However, this space is not considered a formal park due to the lack of amenities typically found in public green spaces. Beyond this area, the coastal zone lacks accessible green spaces with dense vegetation and recreational facilities, contributing to the overall urban design challenges. This real-world setting has been chosen as an ideal case study to demonstrate the effectiveness of the proposed GDS framework.
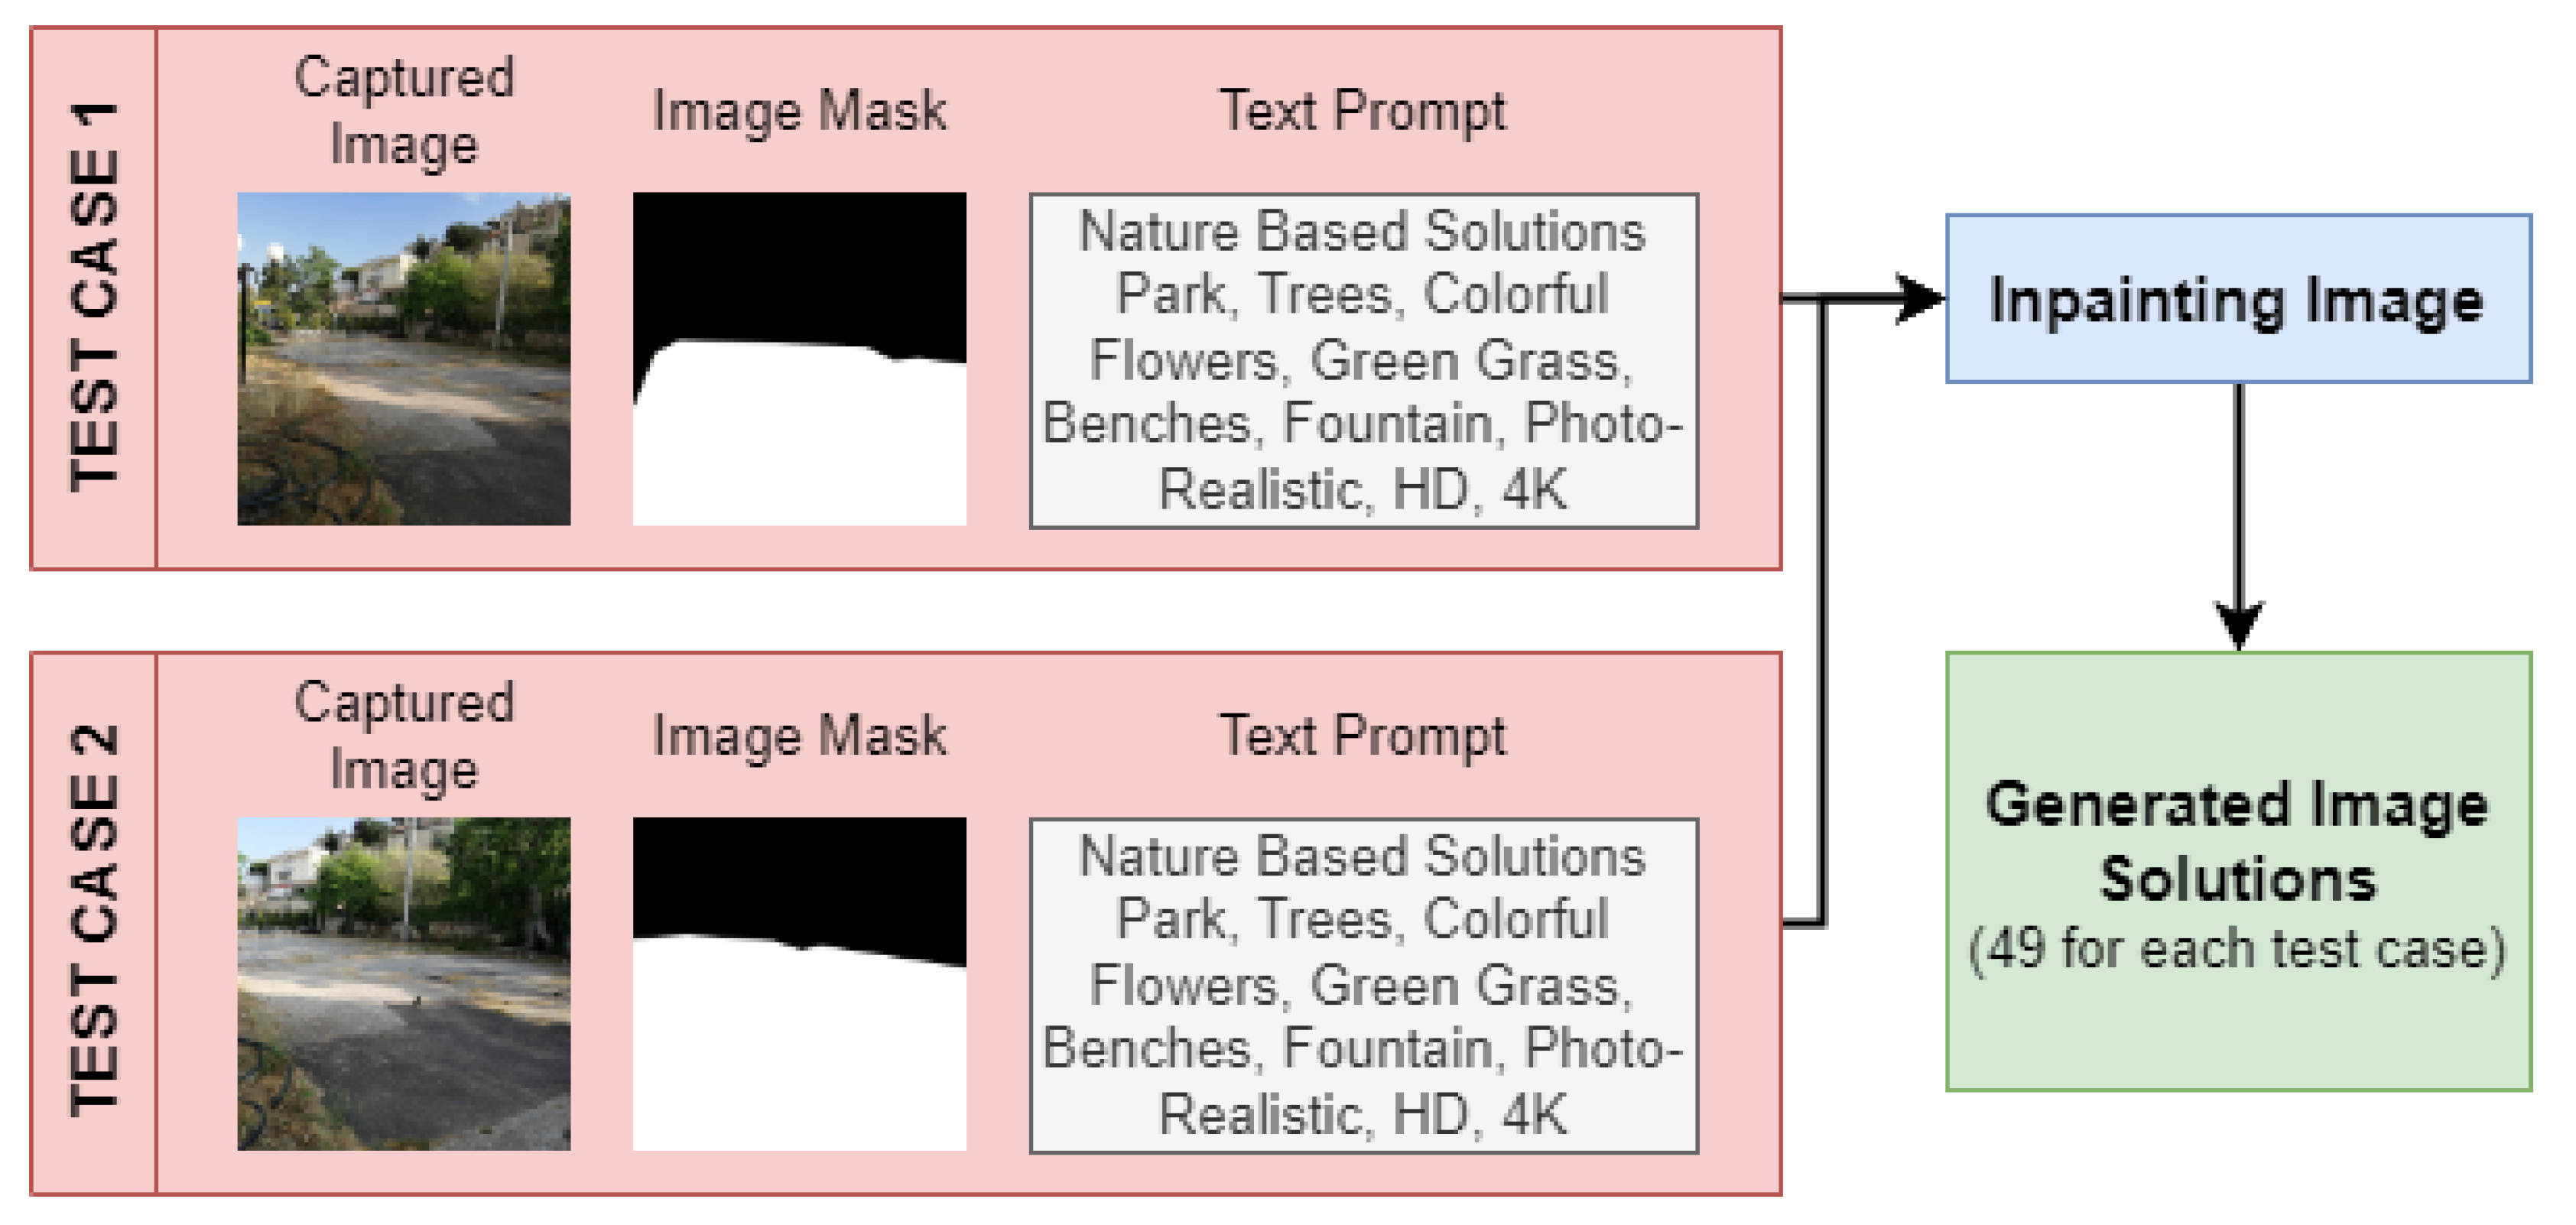
To be able to successfully execute the proposed GDS framework under real conditions, it is necessary to apply the image-inpainting generative algorithm. This necessity resulted from the fact that implementing and visualizing the solutions in the real area are needed. To achieve these results, we captured two images of the parking area from different angles and formulated two test case samples for generating several solutions and to visualize, evaluate, and compare the results. Thus, for implementing the image-inpainting algorithm, the following were used for both test case samples: (a) the captured image; (b) the masked image, indicating with black color the background and white the area that will be changed; and (c) the descriptive text prompt for applying nature-based solutions, with green spaces (i.e., trees, flowers, grass), and park features like benches and fountains.
Figure 6 illustrates the test case samples that are used for generating the solutions using the image-inpainting algorithm.
3.2. Experimental Results
One of the innovations of the proposed GDS is the utilization of a AIGI-based model for generating several solutions for urban design applications. The current literature review is lacking such works, due to the fact that this technology was recently introduced to the field of computer science and is mainly used for art and creative applications.
3.2.1. Generation Time Analysis
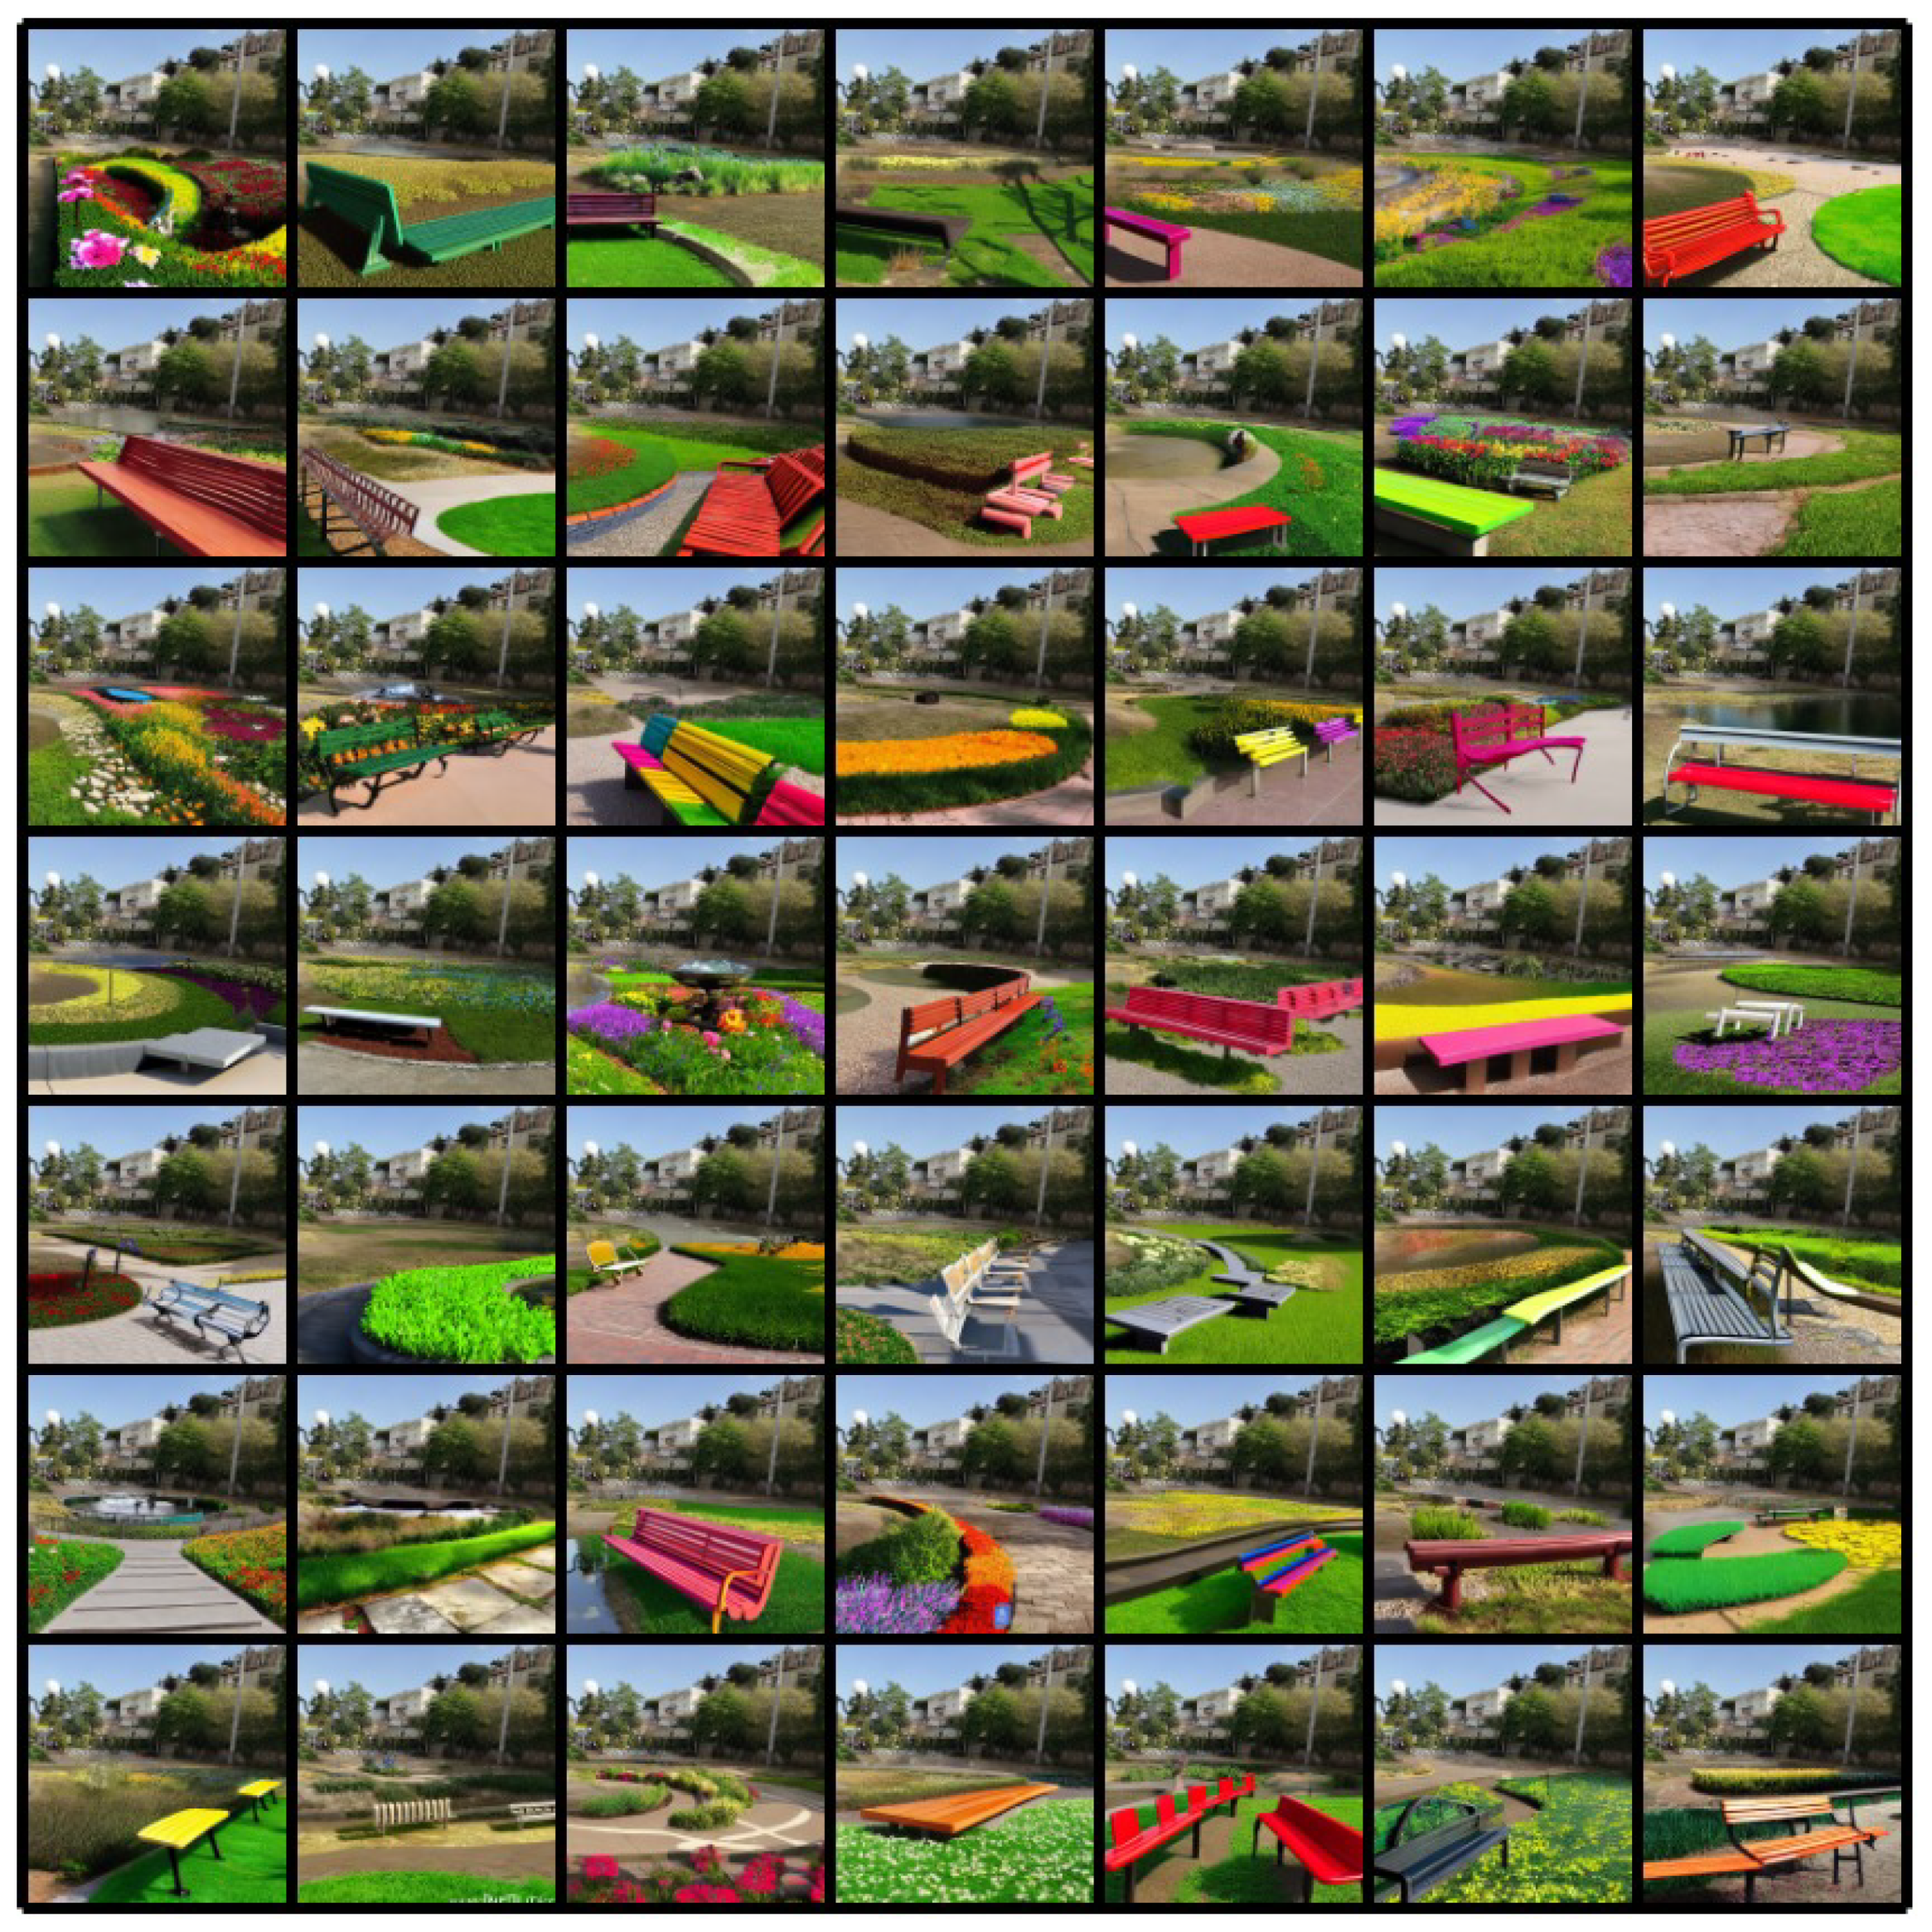
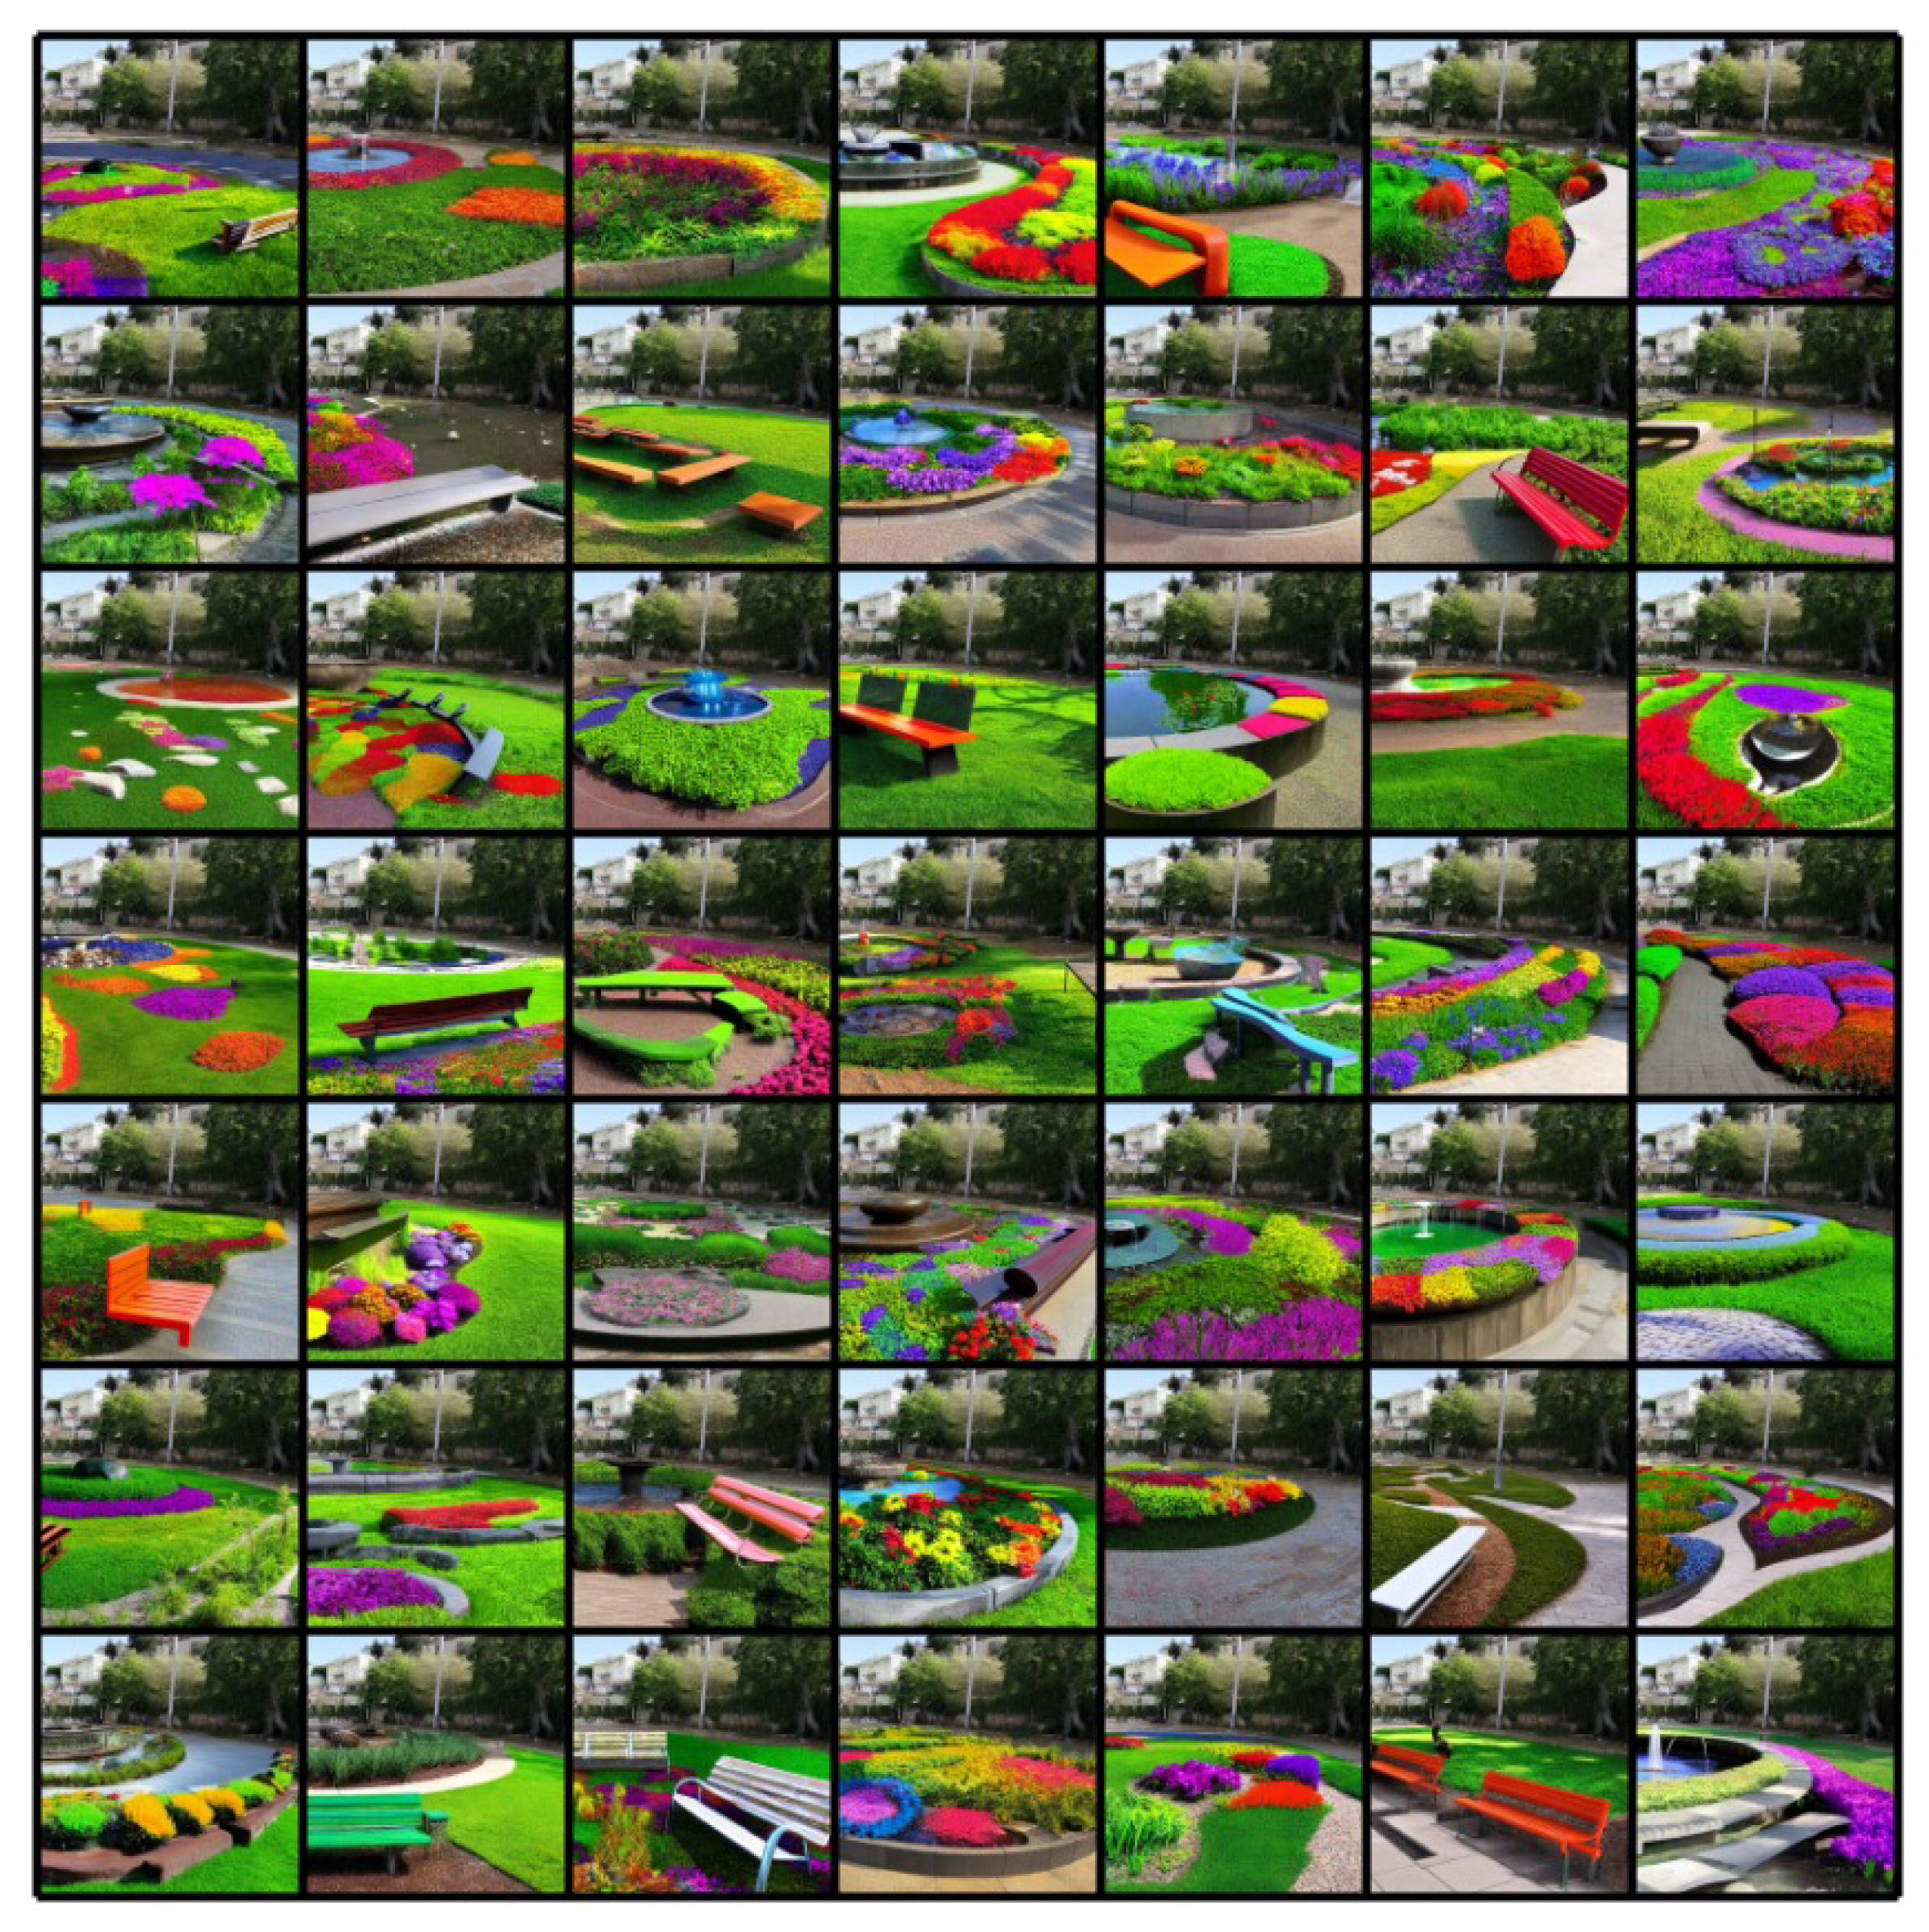
In this work, we used the image-inpainting method to generate a total of 98 possible intervention solutions (49 per each test case sample).
Figure 7 and
Figure 8 present the generated images of the test case samples 1 and 2, respectively. The generation process of the 98 image solutions did not exceed 2 h, indicating the capabilities of this approach to generate a huge amount of image solutions in a short time period (i.e., in some hours).
In order to better understand the time perspective during the image creation, three different devices were employed for running the generative models. The devices were as follows:
Device 1: NVIDIA GeForce GTX 1060 6 GB and 32 GB RAM.
Device 2: NVIDIA GeForce RTX 4060 8 GB and 16 GB RAM.
Device 3:NVIDIA GeForce RTX 3070 Ti 8 GB and 64 GB RAM
In addition, a discussion with experts, i.e., architects, was conducted to estimate how much time it takes to generate a similar image using traditional approaches, e.g., image editors.
Table 2 summarizes the time duration, which is needed for generating photo-realistic images of 256 × 256 resolution.
For the visual evaluation of the generated images, we used the five labels, which were applied by the architect to the generated images to address the dilemma-based learning problem.
3.2.2. Generated Content Analysis
Table 3 illustrates the statistical analysis based on the low-level features of the images per test case sample. Notice that the greenery label is applied to almost all the generated images, indicating that the generative image-inpainting algorithm “understands” the main characteristic of the nature-based solution (i.e., need for vegetation). In terms of the water elements (i.e., fountains, ponds), the generative design provided a small number of solutions (less than one-third per test case). For the park amenities (i.e., benches, park features), the generative design proposed the addition of some benches in a significant number of images (a little more than half of the images). Finally, in terms of the feasibility and spatial alignment criteria, the architect’s opinion is close enough, which means that for most cases, the solution provided either both characteristics or none.
Comparing the results of the case study’s samples, it is also observed that the second test case sample achieved close and higher scores than the first case sample in most of the labels. This indicates that the architect liked the solutions of the second test case sample more. Moreover, by visually comparing the images in
Figure 7 and
Figure 8, the generated solution of the second image is closer to the description of the text prompt than the generated images of the first case study. This observation indicates that the angle of the captured image can affect the generated results. However, one case study cannot be enough to completely prove this observation; thus, the experimentation of this hypothesis can be tested in future works.
3.2.3. Image Ranking Analysis
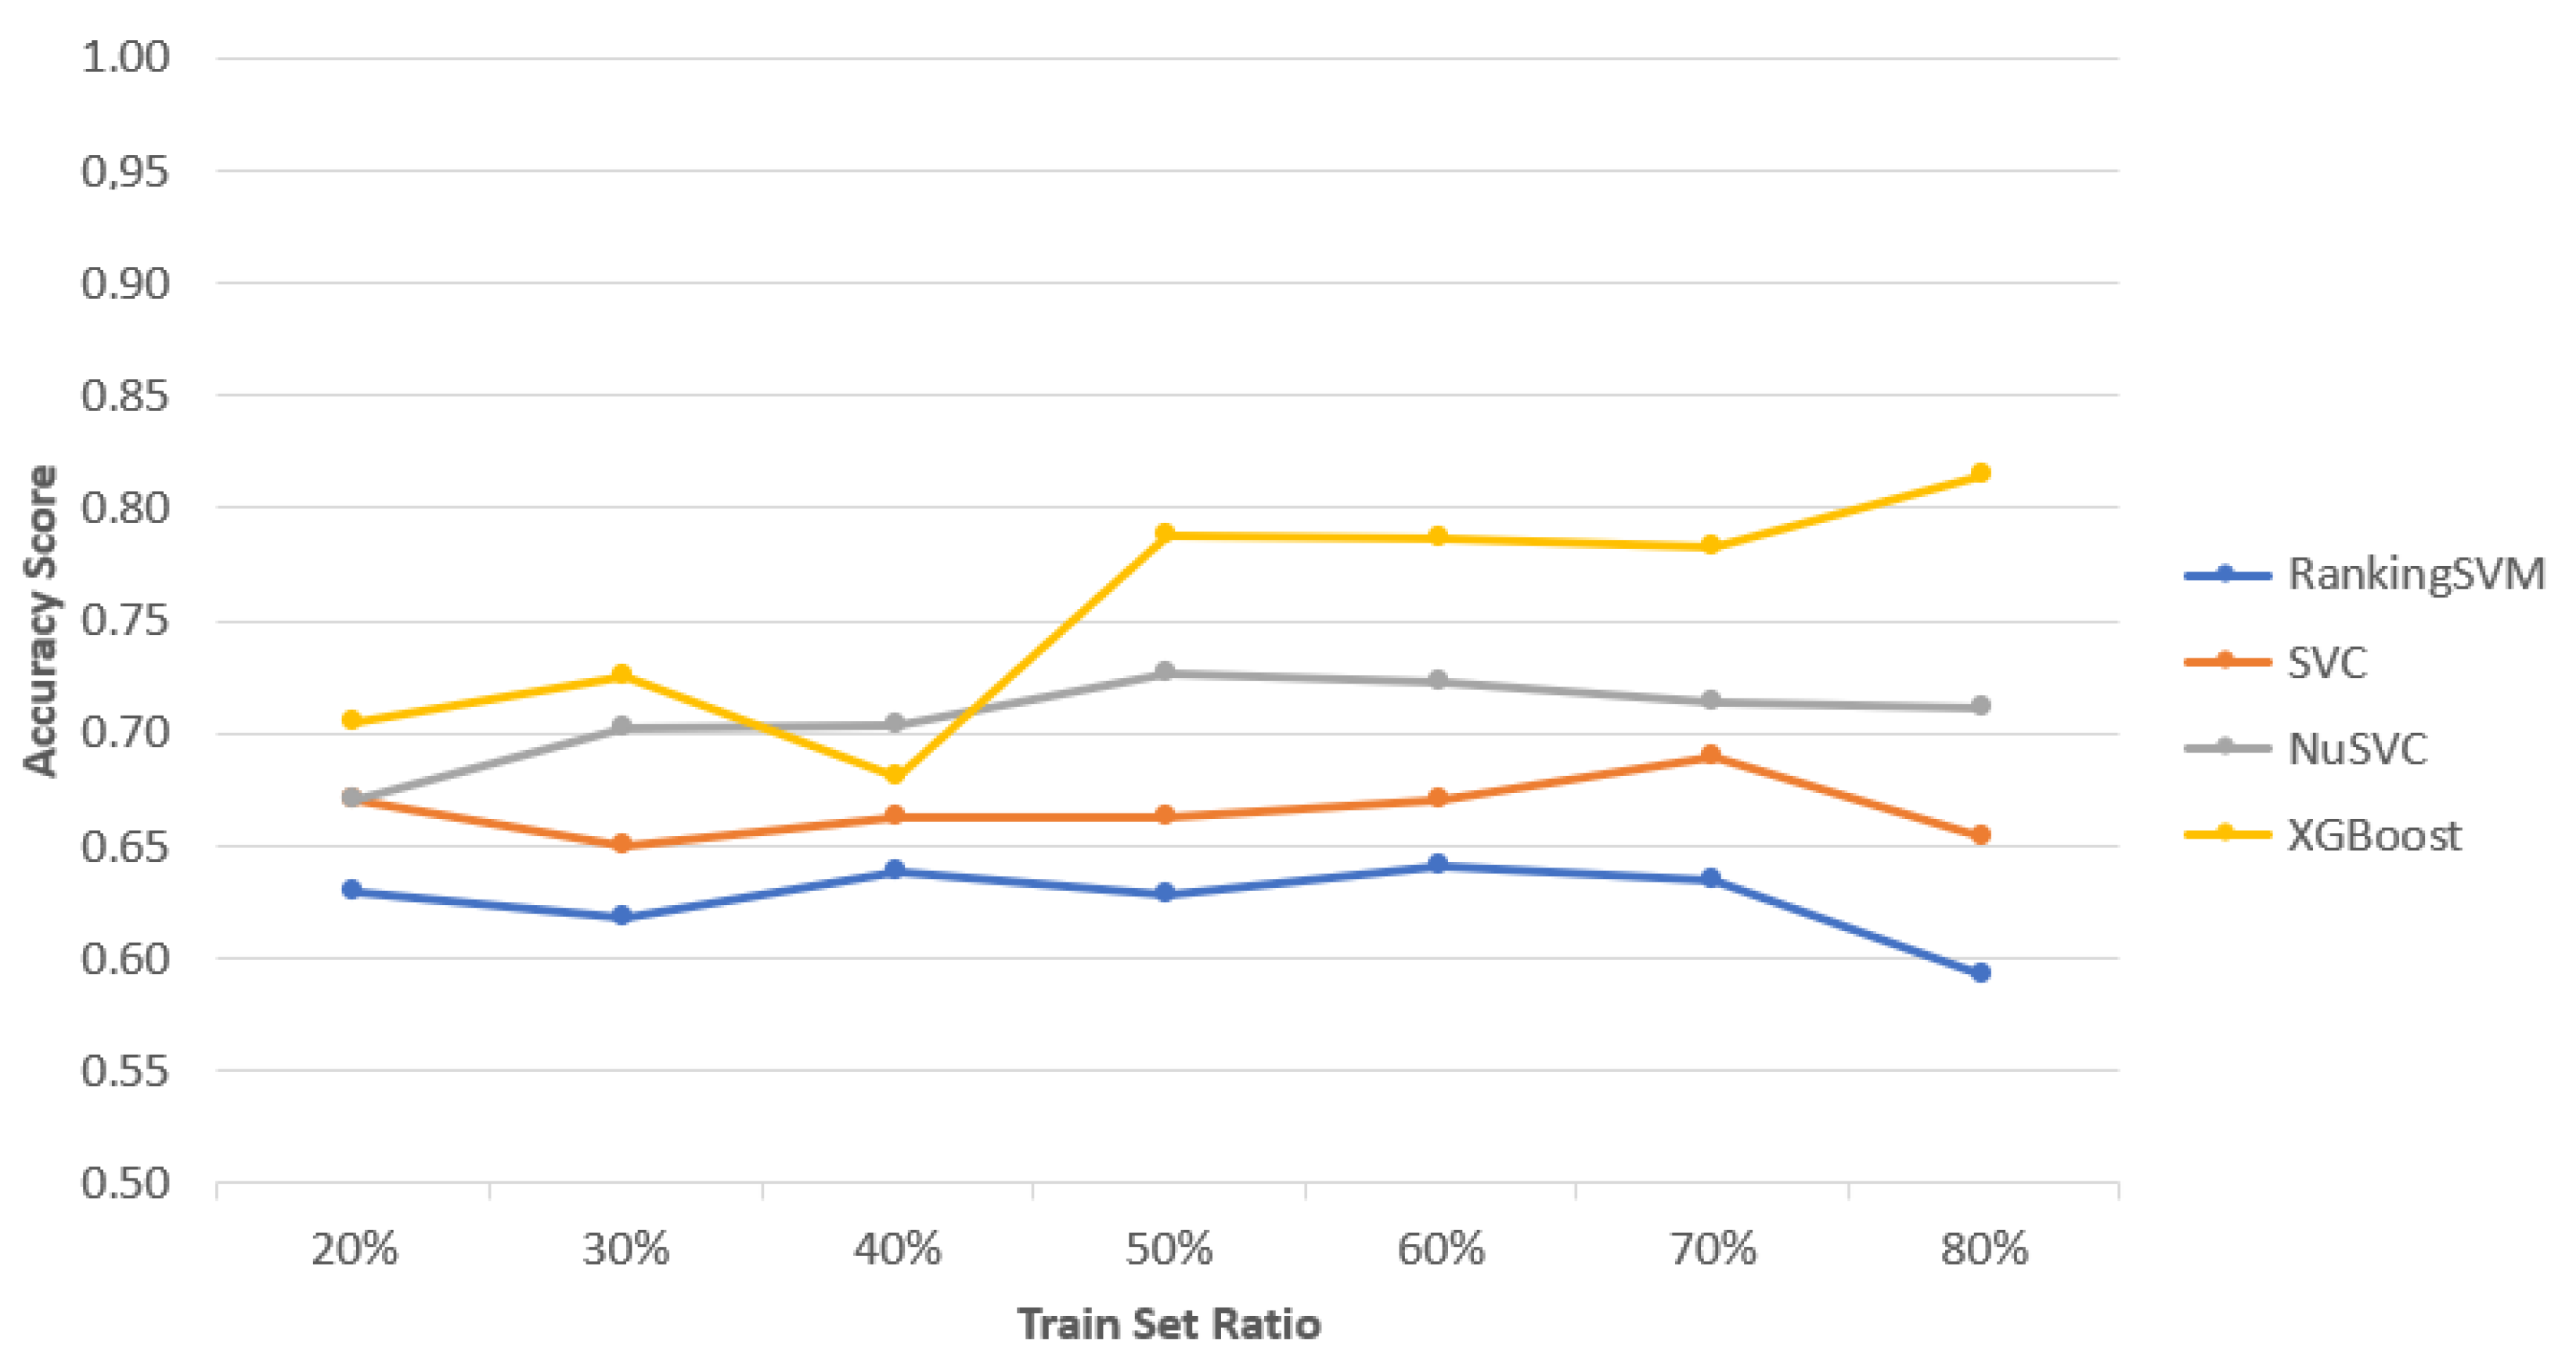
The learning-to-rank algorithm was applied to evaluate the AIGI-generated images by solving the dilemma-based learning problem. For this case study, we used RankingSVM, SVC, NuSVC, and XGBoost models to assess performance. The dataset for training and validation was created by asking an architect to choose the best image from all possible pairwise combinations of the generated images from the first test case. By considering the selection in reverse order as identical, the final dataset for training the semi-supervised learning-to-rank algorithms consisted of 2352 image pairs.
The test accuracy scores for each model at different training set ratios are shown in
Figure 9. RankingSVM had the lowest performance, with an average accuracy of
, achieving its maximum accuracy at a 60% train set ratio. The SVC model performed slightly better with an average accuracy of
, with its highest accuracy at a 70% train set ratio. NuSVC outperformed the other SVM-based models with an average accuracy of
, peaking at a 50% train set ratio. XGBoost achieved the best results, with an average accuracy of
, reaching its highest accuracy at an 80% train set ratio.
Table 4 presents the precision scores for each method across different training set ratios for the test sample. Comparing the average scores, RankingSVM showed the weakest performance, while XGBoost achieved the best results. Specifically, RankingSVM recorded its highest precision at the 60% training set ratio, and SVC performed best at the 70% ratio. Both NuSVC and XGBoost attained their highest precision scores at the 80% training set ratio.
The recall scores are shown in
Table 5. Consistent with accuracy and precision, RankingSVM yielded the lowest average recall score of 0.65, with its highest recall reaching 0.70 at the 60% training set ratio. Both SVC and NuSVC achieved similar average recall scores of 0.72. However, SVC performed better at lower training set ratios, with its highest score occurring at the 20% ratio, while NuSVC excelled at higher training set ratios, reaching its peak recall at 80%. XGBoost achieved the best performance overall, with an average recall score of 0.78, and its highest score at the 80% training set ratio.
Finally, the F1-scores are summarized in
Table 6. RankingSVM had an average F1-score of 0.63, with its highest score at the 6% training set ratio. SVC achieved an average F1-score of 0.69, peaking at the 70% training set ratio. Both NuSVC and XGBoost recorded their highest F1-scores at the 80% training set ratio, with averages of 0.71 and 0.77, respectively.
Given the nature of the data and the task of applying these algorithms to rank the dataset, the evaluation metrics demonstrate that all the selected learning-to-rank algorithms can be effectively used for sorting the image solutions. It is also important to note that achieving a perfect ranking is not necessarily critical. The evaluation of the best image solution is subjective, with multiple images potentially being rated as equally optimal for different reasons. The proposed ranking system aimed to assist the architect by accelerating the manual evaluation process, highlighting the N-Best images based on their selections during the dilemma-based learning phase.
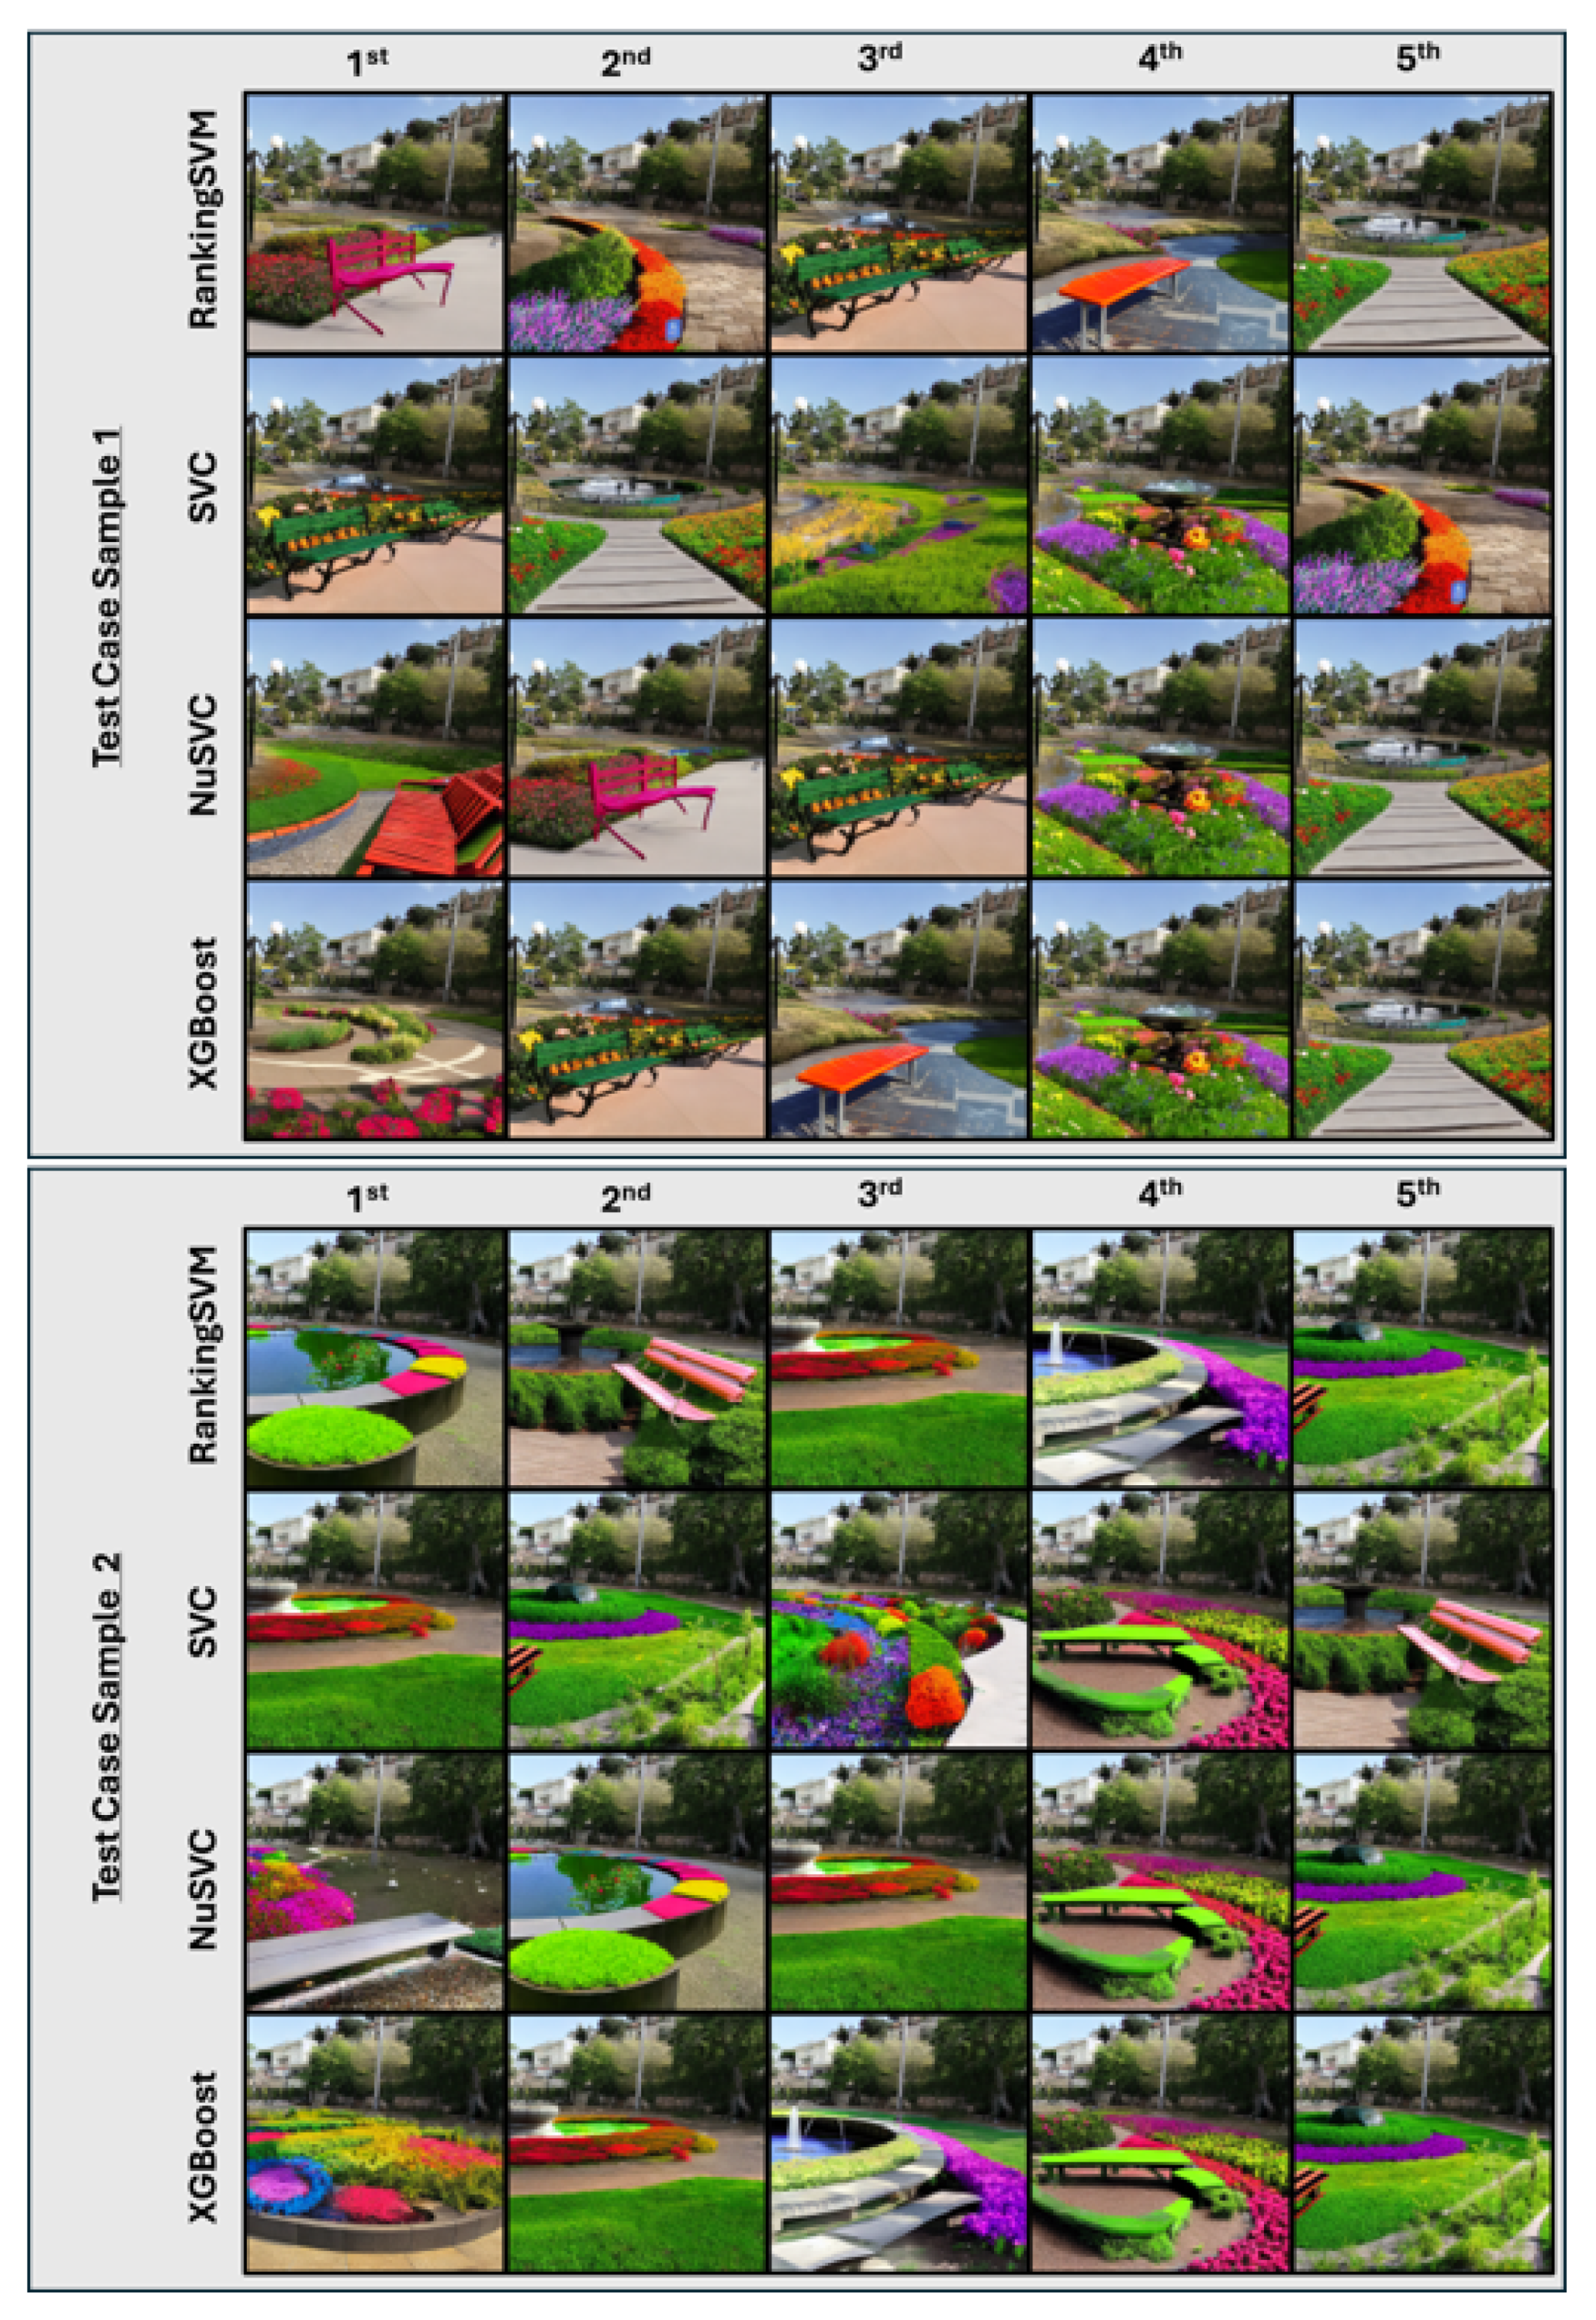
Figure 10 illustrates the five best images per method for each data sample. It is worth noting that most of the five best images appear in all algorithms either in the same or different ordering positions. Other images appear only on some algorithms, like the first image in the XGBoost method for both samples. In terms of efficiency, the smart bubble sorting algorithm is a quick and easy way to order the images. For each method, it took less than 5 s to order the images. However, the whole framework is far from perfect, and more investigation is needed to improve the final results. For instance, the first image of NuSVC for the test case sample 2 is not preferred by the architect.
4. Discussion
The proposed Generative Design System (GDS) framework streamlines the urban regeneration design process by leveraging AI-generated images and ranking algorithms. This approach enables the rapid exploration of diverse nature-based solutions, which can reduce both time and costs in the early design stages. Additionally, the framework is user-friendly, making it accessible to design professionals without extensive expertise in machine learning. The flexibility of our system allows for the potential future integration of advanced deep learning methods to further enhance feature extraction and improve solution quality.
While this work provides a novel methodology to enhance current GDSs, it does not seek to benchmark against existing state-of-the-art generative models, as the application of AIGI in architectural and urban design is still in an emerging phase, particularly concerning nature-based solutions. Instead, the study aims to extend AIGI’s application to the urban design domain, which remains underrepresented in current research focused on medical and artistic uses. The framework’s ability to generate numerous alternative solutions quickly and address irrelevant outputs through learning-to-rank algorithms makes it a valuable tool for preference-based sorting in design.
Despite these advantages, several limitations of the proposed approach should be addressed in future research. First, while the framework demonstrated feasibility with a small group of professionals, its scalability and adaptability to larger, more diverse user groups remain to be evaluated. Furthermore, although the current implementation effectively utilizes basic features and ranking mechanisms, incorporating deep learning techniques for richer feature extraction [
30] and more sophisticated user preference modeling could enhance performance. However, such enhancements were beyond the scope of this study.
Finally, the limited sample size and the basic feature set underscore the need for more extensive, large-scale validation. Future studies should focus on more comprehensive evaluations across various case studies to fully assess the system’s effectiveness and potential for real-world application in urban regeneration.
5. Conclusions
This work introduces a novel Generative Design System (GDS) framework that integrates AI-generated images and learning-to-rank algorithms to accelerate the urban and architectural design process. By enabling the rapid generation of multiple design alternatives, the framework effectively supports architects and urban planners in the early stages of their projects, significantly reducing both time and cost. The successful application of traditional machine learning methods for ranking user preferences highlights the system’s adaptability and usability in real-world scenarios.
One of the key strengths of this approach is its ability to handle large volumes of generated images, which are prioritized based on user input, thus facilitating a more efficient decision-making process. The integration of learning-to-rank algorithms not only enhances the system’s performance but also allows for personalized, user-driven evaluation, ensuring that the most relevant design solutions are identified. The case study presented demonstrates the framework’s robustness and practicality, confirming its potential to transform early-stage urban regeneration projects.
Overall, the framework showcases a powerful, adaptable solution for generative design, offering a valuable tool for practitioners seeking to explore a wide array of design options while maintaining user-centric evaluation criteria.
Author Contributions
Conceptualization, I.K., I.R., D.Z., E.S., E.P., A.D. and N.D.; Methodology, I.K. and N.D.; Software, I.K.; Validation, D.Z.; Formal analysis, I.K.; Resources, A.D. and N.D.; Writing, I.K., E.S. and E.P.; Visualization, I.K.; Supervision, I.K.; Project administration, A.D. and N.D.; Funding acquisition, A.D. and N.D. All authors have read and agreed to the published version of the manuscript.
Funding
This work is supported by the European Union-funded project euPOLIS “Integrated NBS-based Urban Planning Methodology for Enhancing the Health and Well-being of Citizens: the euPOLIS Approach”, under the Horizon 2020 program H2020-EU.3.5.2, grant agreement No. 869448.
Data Availability Statement
The original contributions presented in this study are included in the article. Further inquiries can be directed to the corresponding authors.
Conflicts of Interest
The authors declare no conflicts of interest.
Appendix A. The Image-Inpainting Algorithm
Let us denote as
the image at a given moment
t, where
is the initial image, without any noise applied in it. Then, the forward trajectory can be mathematically represented as an equation that takes an image
at a given moment
as an input and return an image
with additional noise at moment
t; thus,
. Moreover, the noise addition is based on a statistical distribution, for simplicity, we will use the Normal Distribution represented as
N, which needs two parameters: the mean (
) and variance (
). Equation (
A1) presents this equation.
The parameters
(Equation (
A2)) and
(Equation (
A3)) are defined as
These two terms can be used for simplifying Equation (
A1) by replacing the related notations with Equation (
A2). This derives the following equation (Equation (
A4)):
Equation (
A4) can be used sequentially in a defined number of
t steps, increasing the noise in the masked area each time. Usually, noise addition follows a statistical distribution method, like Linear Distribution [
31] or Cosine Distribution [
32]. Considering the repetition of this process, the forward trajectory can be applied in one step for increasing the efficiency of the algorithm in terms of time processing. This is achieved by replacing the parameter of
in Equation (
A4) by the total amount of noise addition
, as defined in Equation (
A3). As a result, the forward trajectory is applied in one step using Equation (
A5).
The reverse trajectory process cannot be simplified like forward trajectory; instead, the execution of this process is applied step by step until the process is terminated after a total of
t steps’ execution [
33]. Equation (
A6) mathematically describes the reverse trajectory. The input parameter
corresponds to the last noisy image, which is calculated in the previous step (for the first iteration, the
is the output of the forward trajectory). The parameter
corresponds to the output of the reverse trajectory (in the final step, this output corresponds to the generated solution). The quantity
is a fixed parameter, which can be calculated at the start of this process. Finally, the parameter
needs to be estimated using a neural network model. As a general practice, this neural network is a U-Net [
31]; however, other methods have also been investigated [
34], indicating acceptable results.
References
- Wu, H.; Gai, Z.; Guo, Y.; Li, Y.; Hao, Y.; Lu, Z.N. Does environmental pollution inhibit urbanization in China? A new perspective through residents’ medical and health costs. Environ. Res. 2020, 182, 109128. [Google Scholar] [CrossRef]
- Sdino, L.; Rosasco, P.; Lombardini, G. The evaluation of urban regeneration processes. In Regeneration of the Built Environment from a Circular Economy Perspective; Springer: Cham, Switzerland, 2020; pp. 47–57. [Google Scholar]
- Jung, T.H.; Lee, J.; Yap, M.H.; Ineson, E.M. The role of stakeholder collaboration in culture-led urban regeneration: A case study of the Gwangju project, Korea. Cities 2015, 44, 29–39. [Google Scholar] [CrossRef]
- Rizzo, E.; Pesce, M.; Pizzol, L.; Alexandrescu, F.M.; Giubilato, E.; Critto, A.; Marcomini, A.; Bartke, S. Brownfield regeneration in Europe: Identifying stakeholder perceptions, concerns, attitudes and information needs. Land Use Policy 2015, 48, 437–453. [Google Scholar] [CrossRef]
- Gradišar, L.; Dolenc, M.; Klinc, R. Towards machine learned generative design. Autom. Constr. 2024, 159, 105284. [Google Scholar] [CrossRef]
- Mukkavaara, J.; Sandberg, M. Architectural Design Exploration Using Generative Design: Framework Development and Case Study of a Residential Block. Buildings 2020, 10, 201. [Google Scholar] [CrossRef]
- Frazer, J. Creative design and the generative evolutionary paradigm. In Creative Evolutionary Systems; Elsevier: Amsterdam, The Netherlands, 2002; pp. 253–274. [Google Scholar]
- Zhang, J.; Liu, N.; Wang, S. Generative design and performance optimization of residential buildings based on parametric algorithm. Energy Build. 2021, 244, 111033. [Google Scholar] [CrossRef]
- Gradišar, L.; Klinc, R.; Turk, Ž.; Dolenc, M. Generative design methodology and framework exploiting designer-algorithm synergies. Buildings 2022, 12, 2194. [Google Scholar] [CrossRef]
- Kavouras, I.; Sardis, E.; Protopapadakis, E.; Doulamis, A. Effectiveness of Open-Source Solutions for Limited Scale Interventions Planning. In Proceedings of the Novel & Intelligent Digital Systems Conference, Athens, Greece, 29–30 September 2022; pp. 104–112. [Google Scholar]
- Kavouras, I.; Sardis, E.; Protopapadakis, E.; Rallis, I.; Doulamis, A.; Doulamis, N. A low-cost gamified urban planning methodology enhanced with co-creation and participatory approaches. Sustainability 2023, 15, 2297. [Google Scholar] [CrossRef]
- Junk, S.; Burkart, L. Comparison of CAD systems for generative design for use with additive manufacturing. Procedia CIRP 2021, 100, 577–582. [Google Scholar] [CrossRef]
- Quan, S.J.; Park, J.; Economou, A.; Lee, S. Artificial intelligence-aided design: Smart design for sustainable city development. Environ. Plan. B Urban Anal. City Sci. 2019, 46, 1581–1599. [Google Scholar] [CrossRef]
- Kavouras, I.; Rallis, I.; Sardis, E.; Protopapadakis, E.; Doulamis, A.; Doulamis, N. Multi-scale Intervention Planning Based on Generative Design. In Proceedings of the International Conference on Intelligent Tutoring Systems, Thessaloniki, Greece, 10–13 June 2024; pp. 225–233. [Google Scholar]
- Baduge, S.K.; Thilakarathna, S.; Perera, J.S.; Arashpour, M.; Sharafi, P.; Teodosio, B.; Shringi, A.; Mendis, P. Artificial intelligence and smart vision for building and construction 4.0: Machine and deep learning methods and applications. Autom. Constr. 2022, 141, 104440. [Google Scholar] [CrossRef]
- Phillips, C.; Jiao, J.; Clubb, E. Testing the Capability of AI Art Tools for Urban Design. IEEE Comput. Graph. Appl. 2024, 44, 37–45. [Google Scholar] [CrossRef] [PubMed]
- Mazzone, M.; Elgammal, A. Art, creativity, and the potential of artificial intelligence. Arts 2019, 8, 26. [Google Scholar] [CrossRef]
- Gao, J.; Shen, T.; Wang, Z.; Chen, W.; Yin, K.; Li, D.; Litany, O.; Gojcic, Z.; Fidler, S. Get3d: A generative model of high quality 3d textured shapes learned from images. Adv. Neural Inf. Process. Syst. 2022, 35, 31841–31854. [Google Scholar]
- Xiang, J.; Yang, J.; Deng, Y.; Tong, X. Gram-hd: 3d-consistent image generation at high resolution with generative radiance manifolds. In Proceedings of the IEEE/CVF International Conference on Computer Vision, Paris, France, 2–3 October 2023; pp. 2195–2205. [Google Scholar]
- Rombach, R.; Blattmann, A.; Lorenz, D.; Esser, P.; Ommer, B. High-Resolution Image Synthesis With Latent Diffusion Models. In Proceedings of the IEEE/CVF Conference on Computer Vision and Pattern Recognition (CVPR), New Orleans, LA, USA, 18–24 June 2022; pp. 10684–10695. [Google Scholar]
- Liang, L.; Grauman, K. Beyond comparing image pairs: Setwise active learning for relative attributes. In Proceedings of the IEEE Conference on Computer Vision and Pattern Recognition, Columbus, OH, USA, 23–28 June 2014; pp. 208–215. [Google Scholar]
- Liao, W.; Hu, K.; Yang, M.Y.; Rosenhahn, B. Text to image generation with semantic-spatial aware gan. In Proceedings of the IEEE/CVF Conference on Computer Vision and Pattern Recognition, New Orleans, LA, USA, 18–24 June 2022; pp. 18187–18196. [Google Scholar]
- Zhu, Y.; Li, Z.; Wang, T.; He, M.; Yao, C. Conditional Text Image Generation With Diffusion Models. In Proceedings of the IEEE/CVF Conference on Computer Vision and Pattern Recognition (CVPR), Vancouver, BC, Canada, 17–24 June 2023; pp. 14235–14245. [Google Scholar]
- Dhariwal, P.; Nichol, A. Diffusion models beat gans on image synthesis. Adv. Neural Inf. Process. Syst. 2021, 34, 8780–8794. [Google Scholar]
- Hugging Face Model Repository. 2023. Available online: https://huggingface.co/models (accessed on 5 October 2024).
- Cohen, W.W.; Schapire, R.E.; Singer, Y. Learning to order things. Adv. Neural Inf. Process. Syst. 1997, 10, 451–457. [Google Scholar] [CrossRef]
- Liu, N.; Zhang, M.; Li, H.; Sun, Z.; Tan, T. DeepIris: Learning pairwise filter bank for heterogeneous iris verification. Pattern Recognit. Lett. 2016, 82, 154–161. [Google Scholar] [CrossRef]
- Markoulidakis, I.; Kopsiaftis, G.; Rallis, I.; Georgoulas, I. Multi-Class Confusion Matrix Reduction Method and Its Application on Net Promoter Score Classification Problem. In Proceedings of the 14th PErvasive Technologies Related to Assistive Environments Conference, PETRA ’21, New York, NY, USA, 29 June–2 July 2021; pp. 412–419. [Google Scholar] [CrossRef]
- Freund, Y.; Schapire, R.E. A decision-theoretic generalization of on-line learning and an application to boosting. J. Comput. Syst. Sci. 1997, 55, 119–139. [Google Scholar] [CrossRef]
- Zhuang, Y.; Kang, Y.; Fei, T.; Bian, M.; Du, Y. From hearing to seeing: Linking auditory and visual place perceptions with soundscape-to-image generative artificial intelligence. Comput. Environ. Urban Syst. 2024, 110, 102122. [Google Scholar] [CrossRef]
- Ho, J.; Jain, A.; Abbeel, P. Denoising diffusion probabilistic models. Adv. Neural Inf. Process. Syst. 2020, 33, 6840–6851. [Google Scholar]
- Nichol, A.Q.; Dhariwal, P. Improved denoising diffusion probabilistic models. In Proceedings of the International Conference on Machine Learning, Virtual Event, 18–24 July 2021; pp. 8162–8171. [Google Scholar]
- Sohl-Dickstein, J.; Weiss, E.; Maheswaranathan, N.; Ganguli, S. Deep unsupervised learning using nonequilibrium thermodynamics. In Proceedings of the International Conference on Machine Learning, Lille, France, 6–11 July 2015; pp. 2256–2265. [Google Scholar]
- Schaefer, K.; Weickert, J. Diffusion–Shock Inpainting. In Proceedings of the International Conference on Scale Space and Variational Methods in Computer Vision, Santa Margherita di Pula, Italy, 21–25 May 2023; pp. 588–600. [Google Scholar]
| Disclaimer/Publisher’s Note: The statements, opinions and data contained in all publications are solely those of the individual author(s) and contributor(s) and not of MDPI and/or the editor(s). MDPI and/or the editor(s) disclaim responsibility for any injury to people or property resulting from any ideas, methods, instructions or products referred to in the content. |
© 2024 by the authors. Licensee MDPI, Basel, Switzerland. This article is an open access article distributed under the terms and conditions of the Creative Commons Attribution (CC BY) license (https://creativecommons.org/licenses/by/4.0/).


 ,
, 


