

Pedestrian Detection Based on Feature Enhancement in Complex Scenes


Abstract
1. Introduction
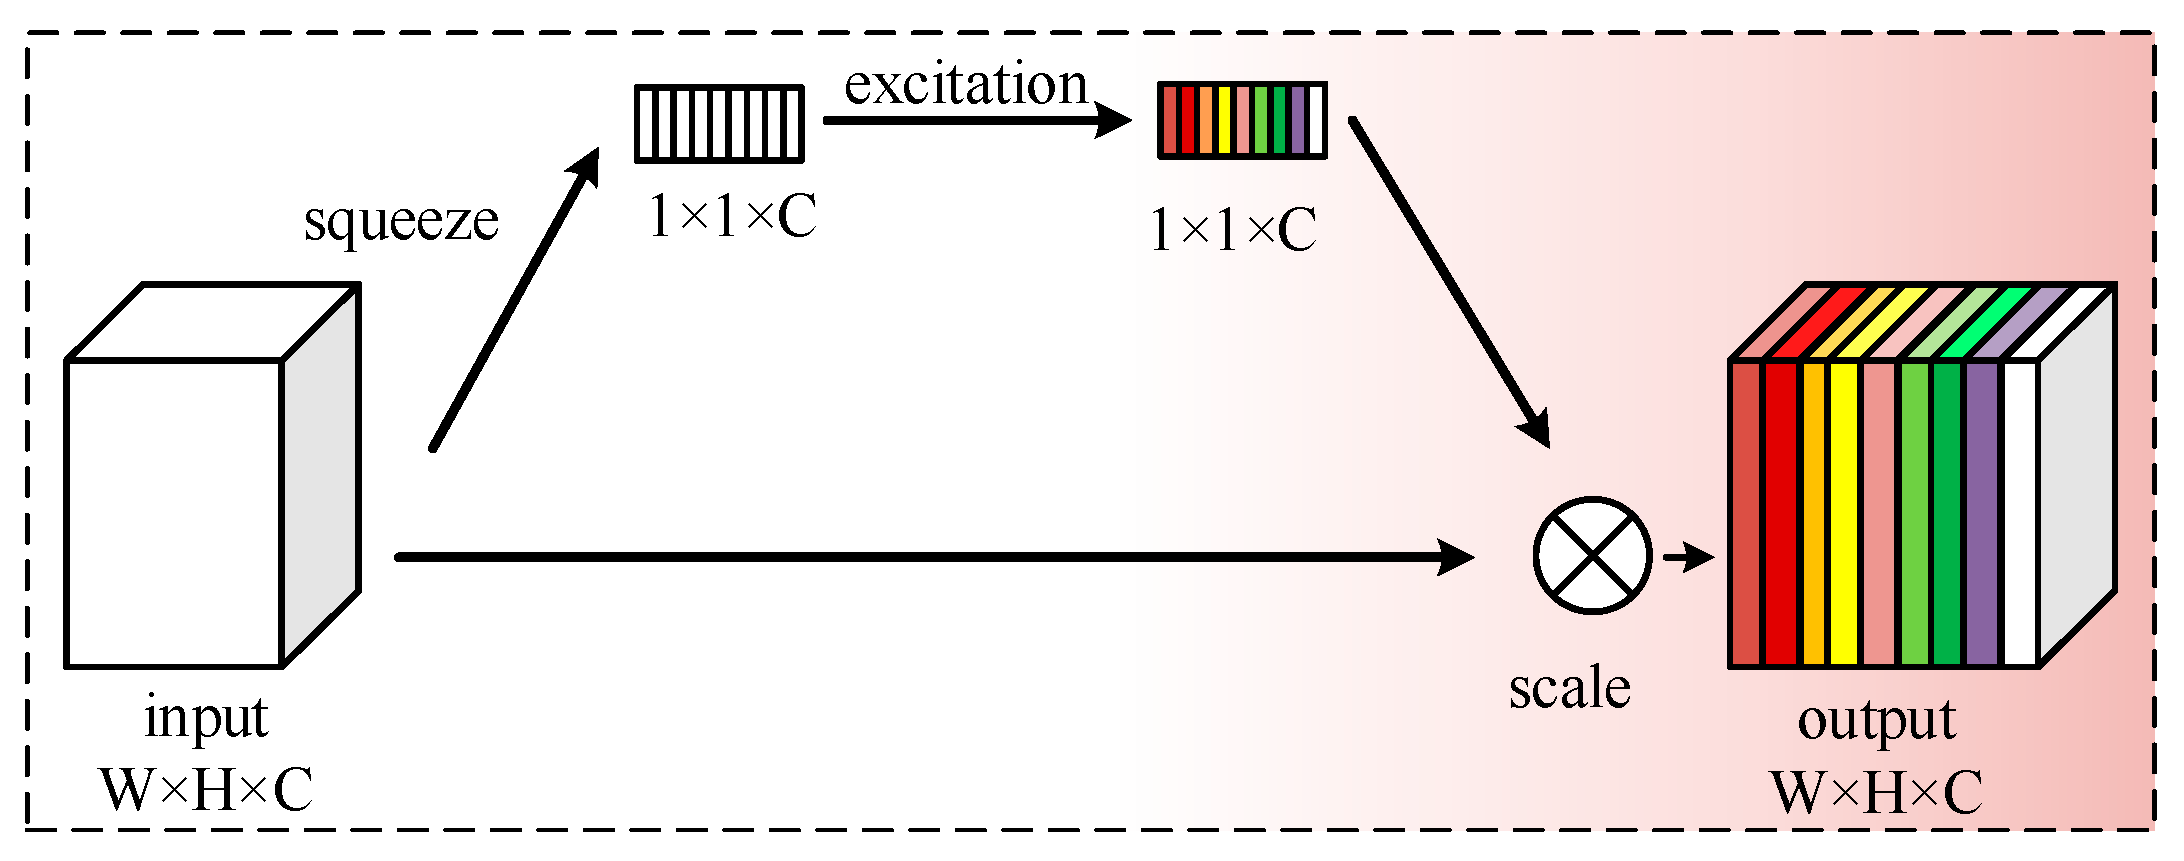
- To solve the problem of missing pedestrians caused by occlusion, we add the SE module to the backbone of the pedestrian detection network PT-YOLO so that the network can learn the key feature information of pedestrians and reduce the missed detection rate.
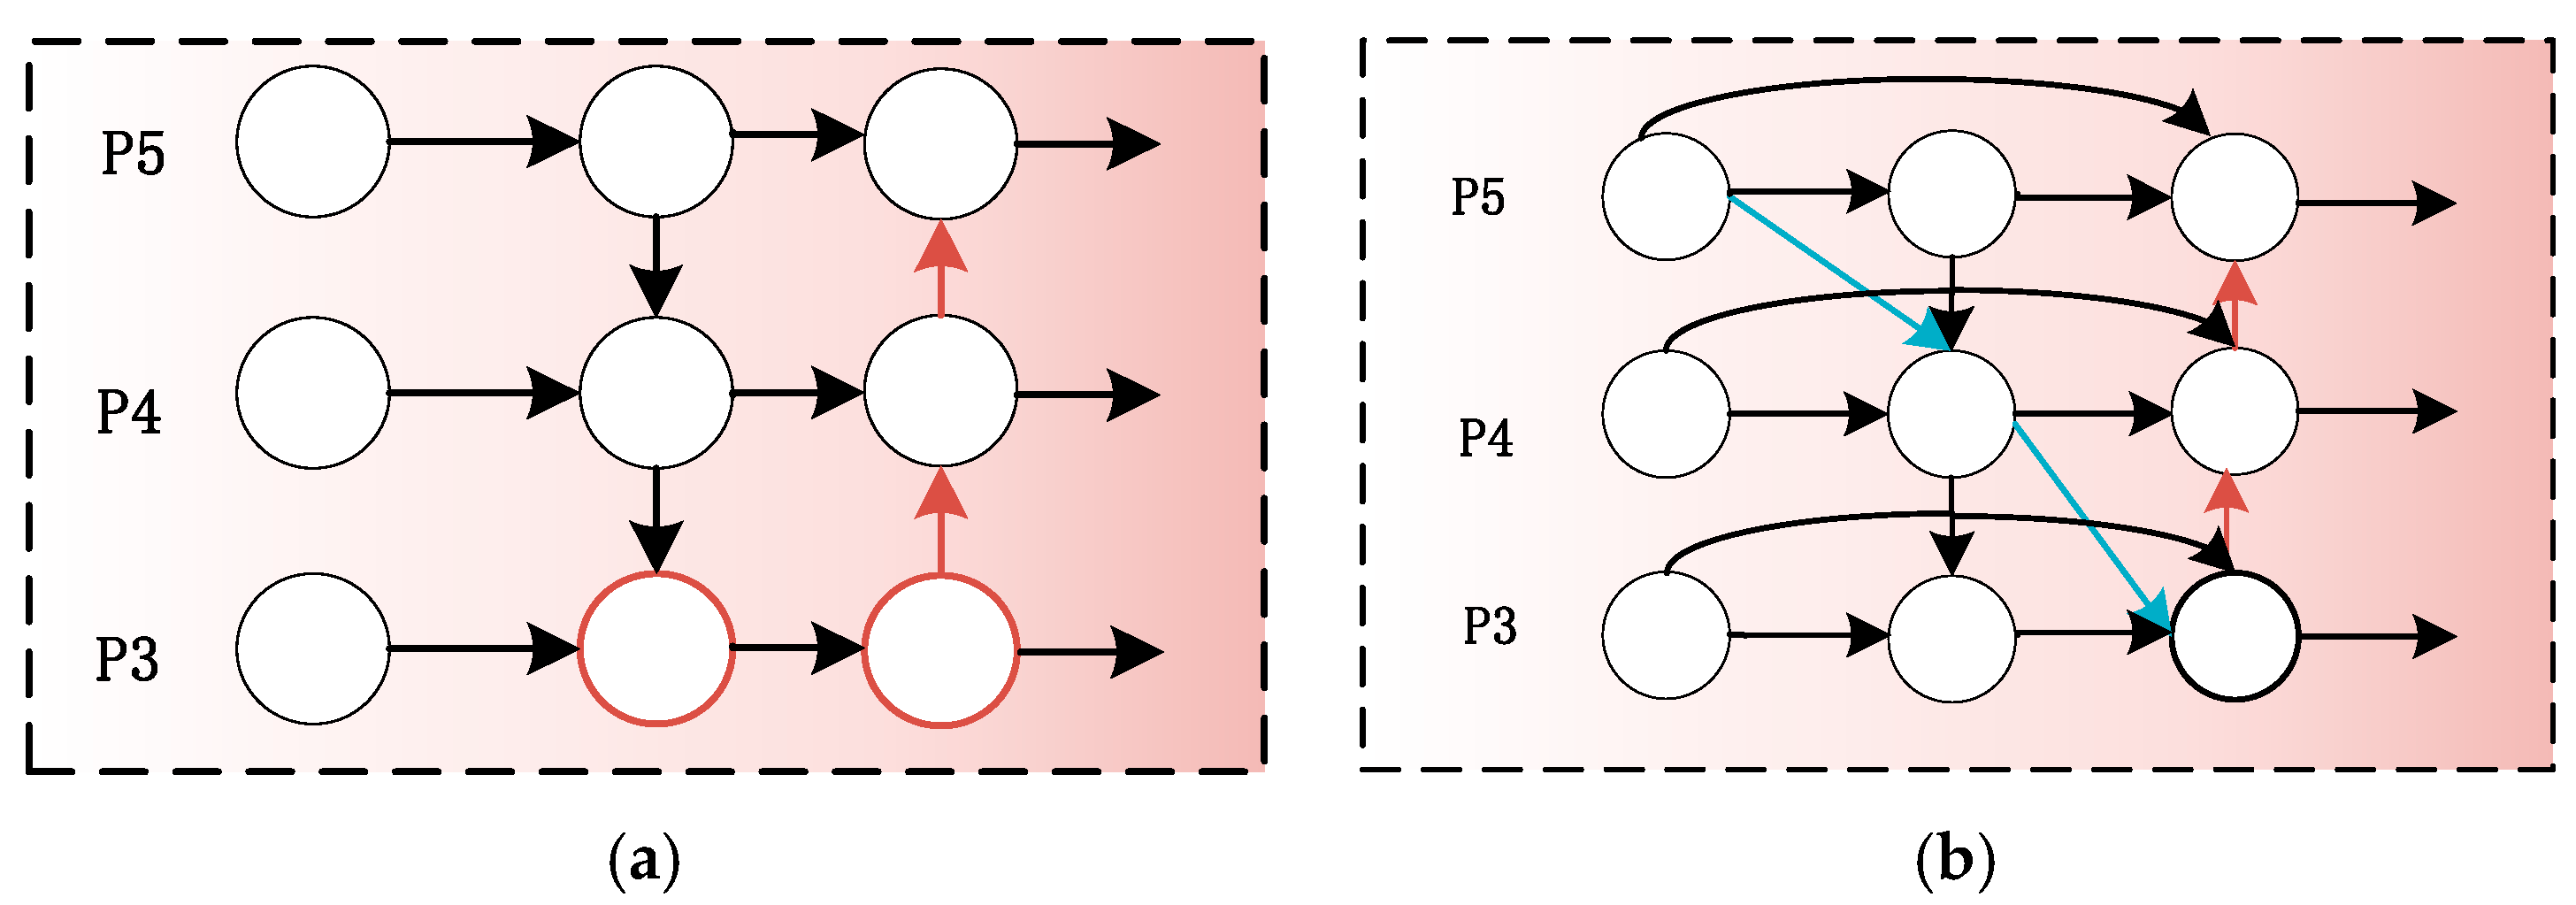
- To solve the problem of low accuracy in pedestrian detection caused by scale changes in the environment, we use the BiFPN module in the neck to realize the information exchange and fusion between different feature layers, which improves the accuracy of pedestrian detection.
- To reduce the loss of the network, we use the WIoU loss function in the head to reduce the regression loss of the boundary box.
- To highlight the detailed information of pedestrians and reduce the feature loss, the coordconv module is introduced into the pedestrian detection network PT-YOLO to enhance the spatial information of the network and ensure the accuracy of pedestrian detection.
2. Related Work
2.1. Traditional Target Detection Method
2.2. Deep Learning Target Detection Method
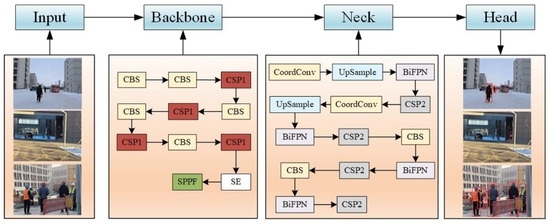
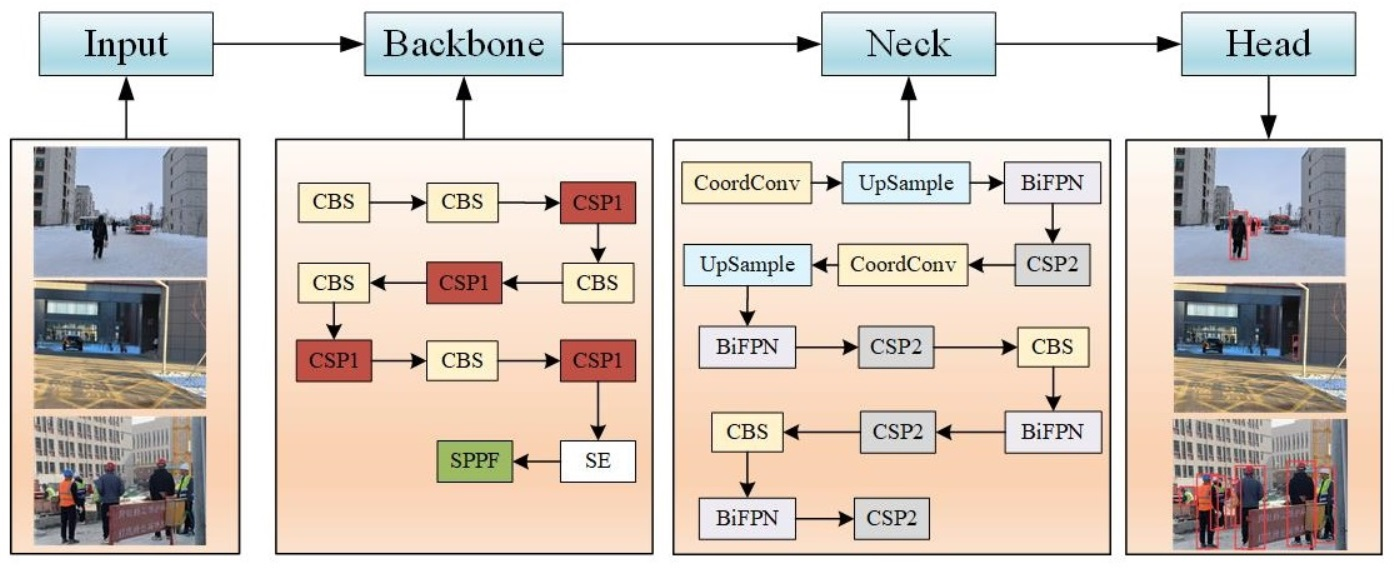
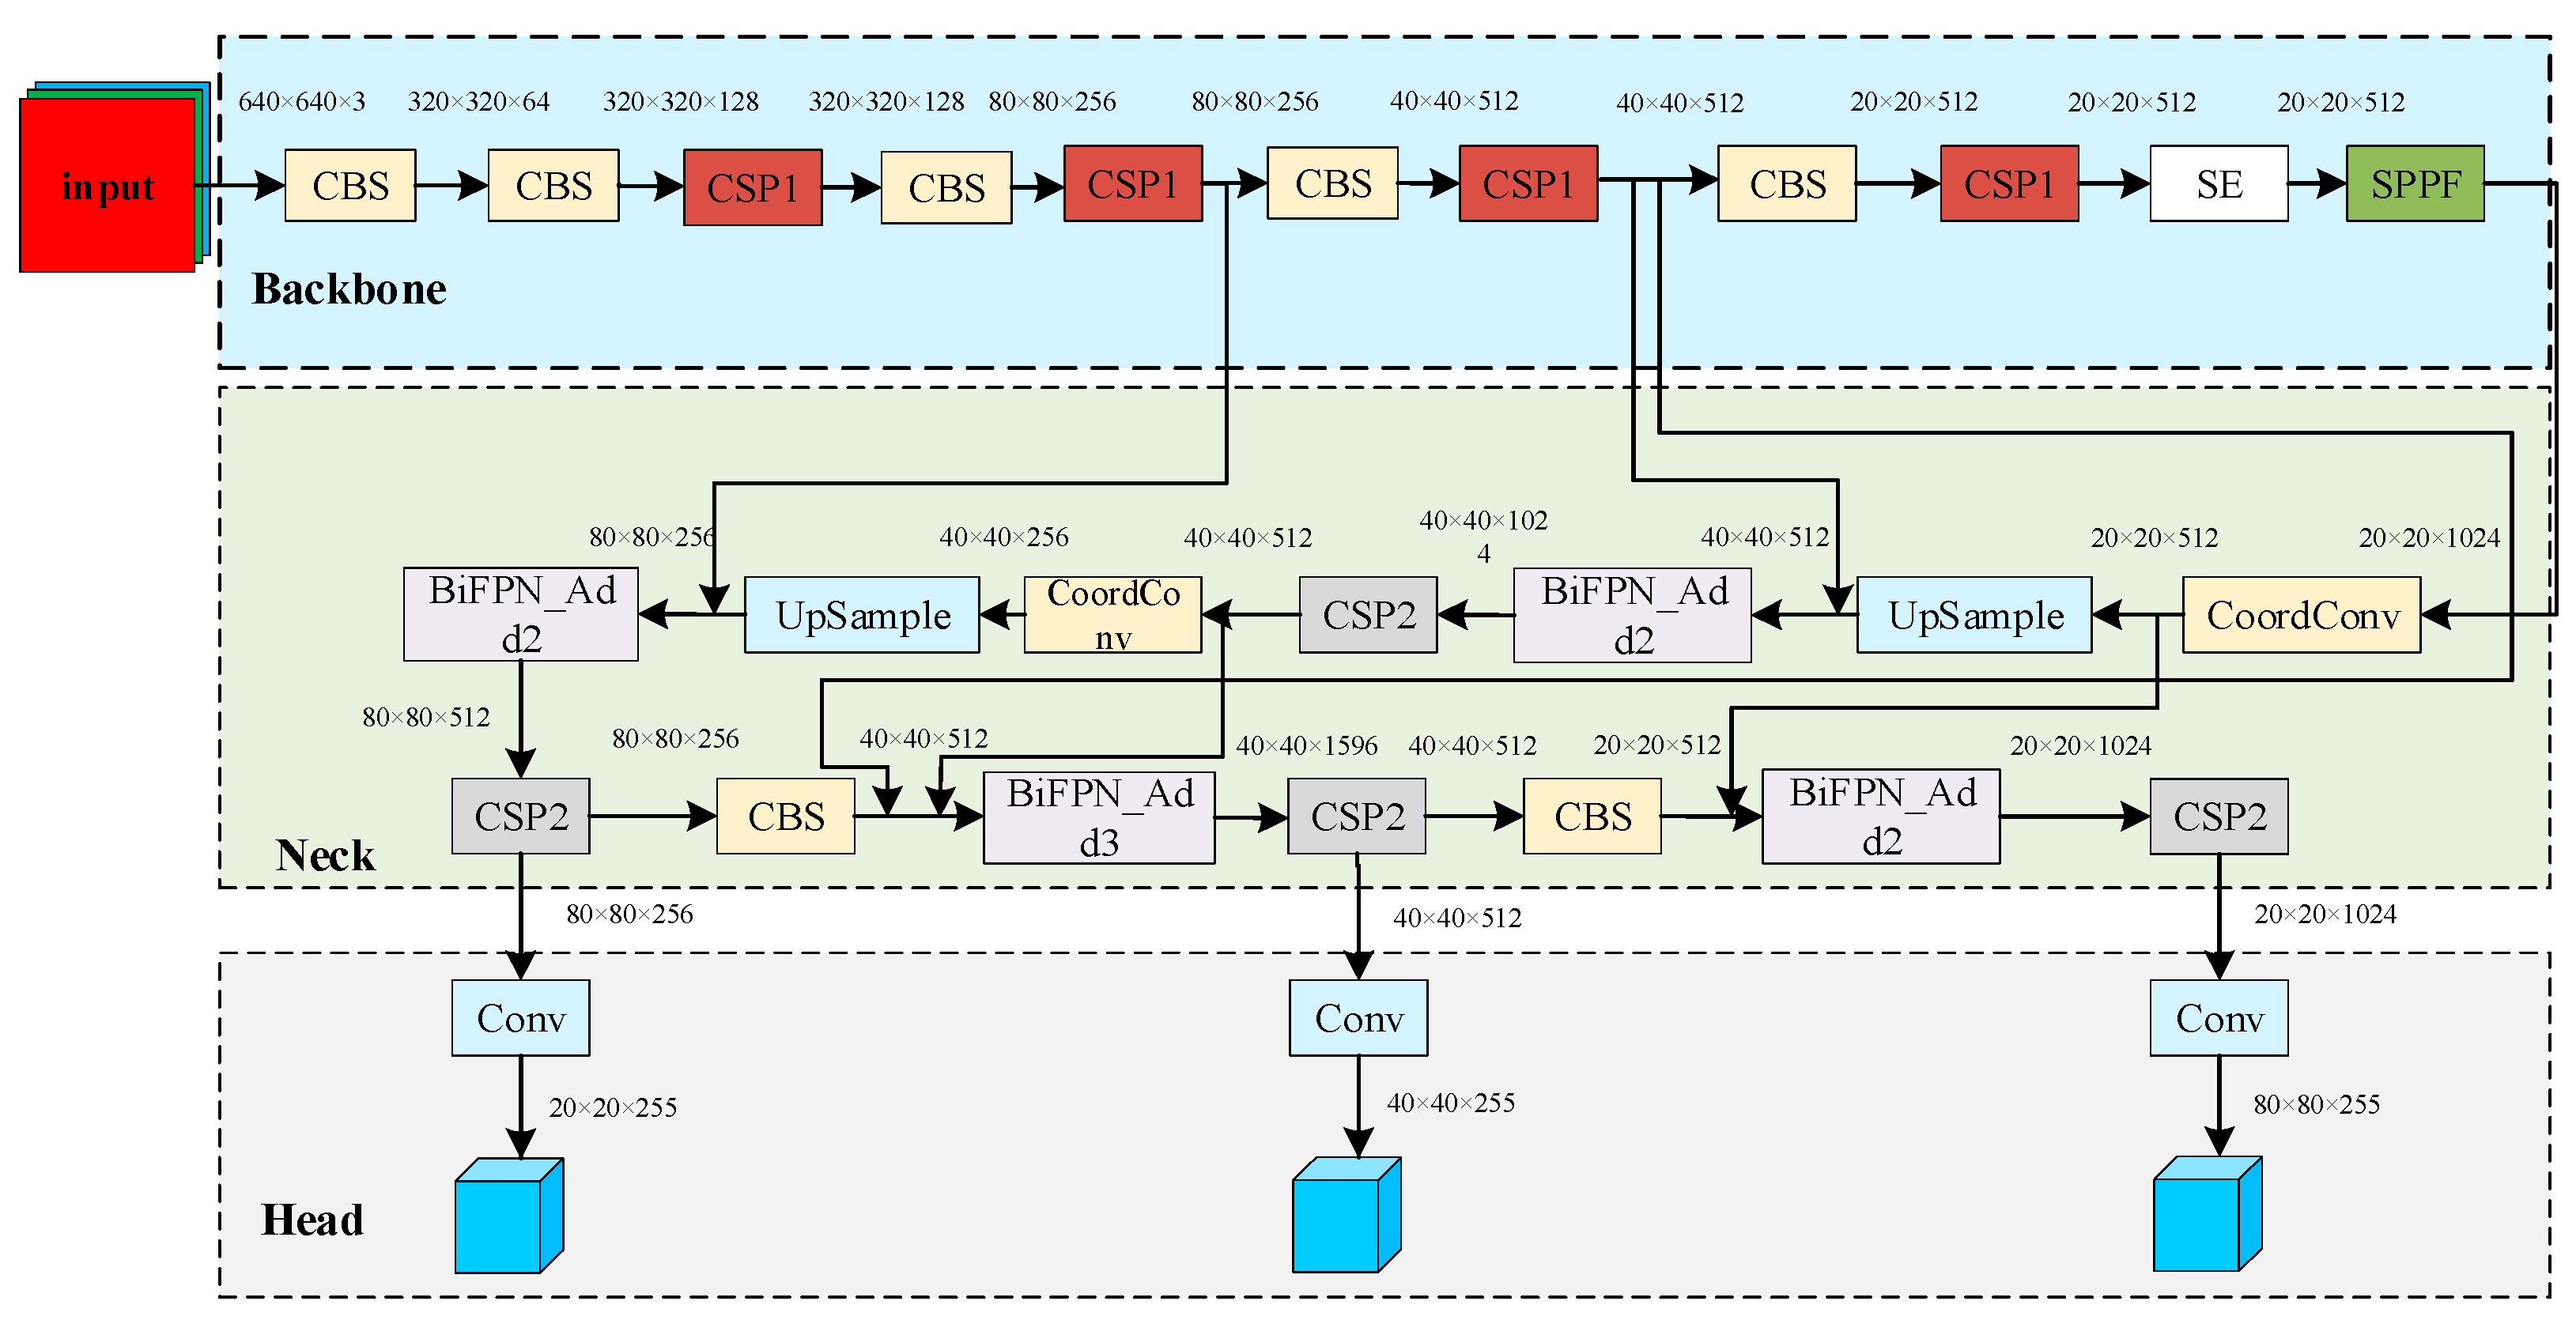
3. PT-YOLO Pedestrian Detection Network
3.1. Framework
3.2. Backbone: Feature Extraction
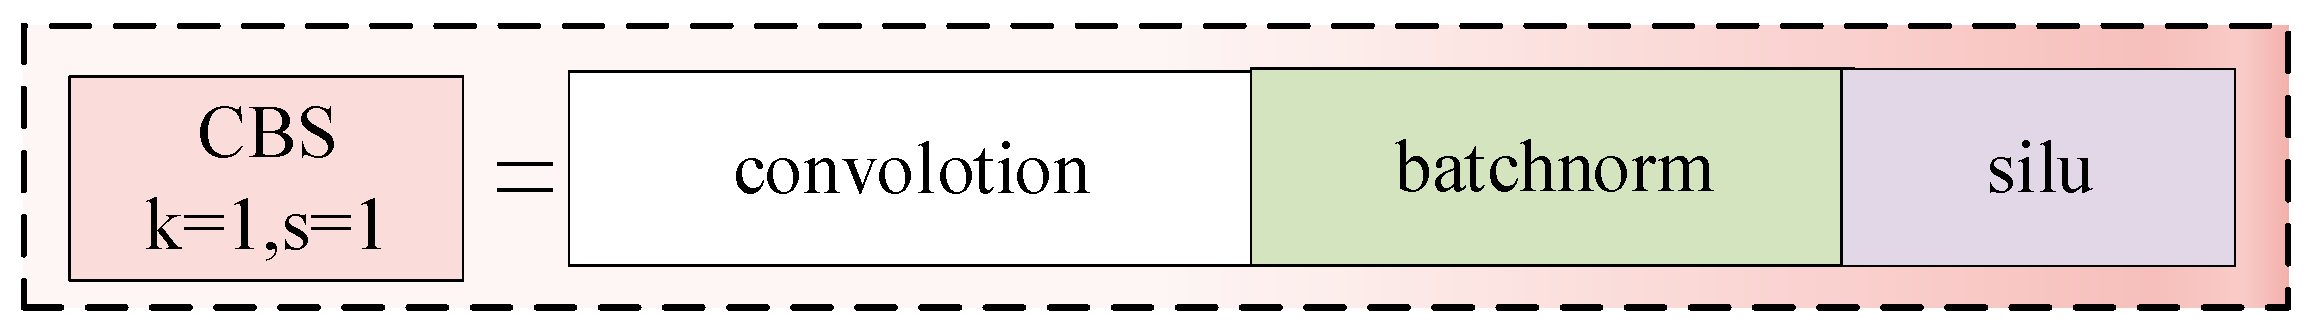
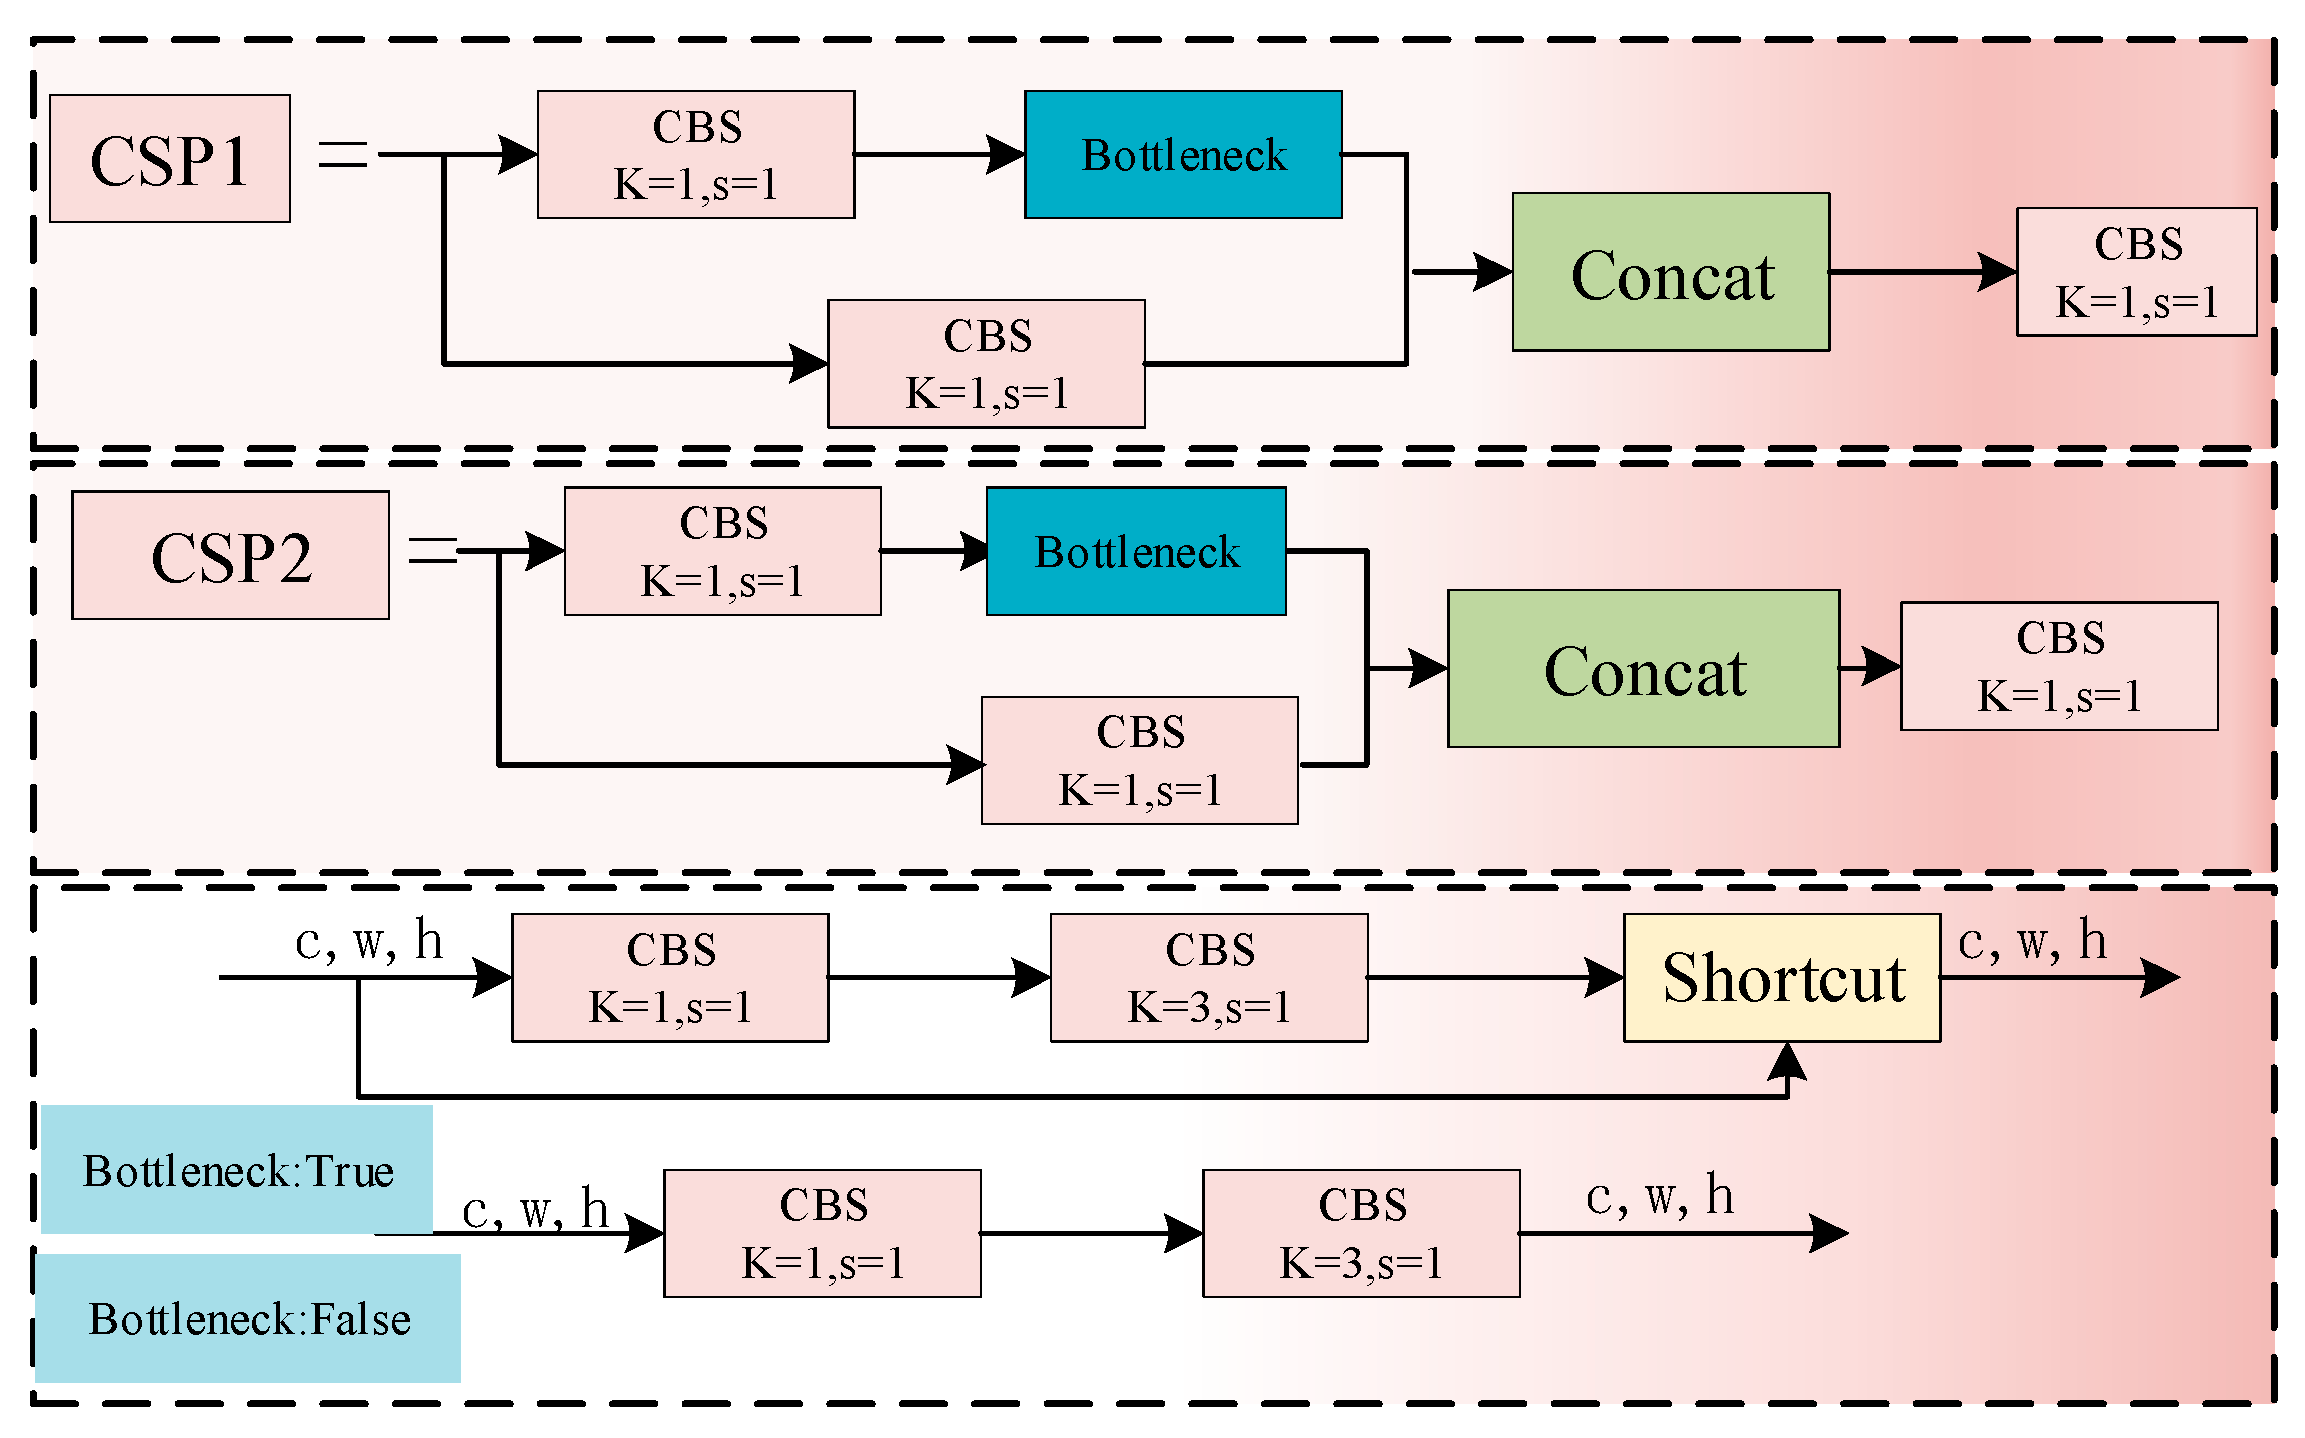
3.2.1. CBS Module and CSP Module
3.2.2. SE Module
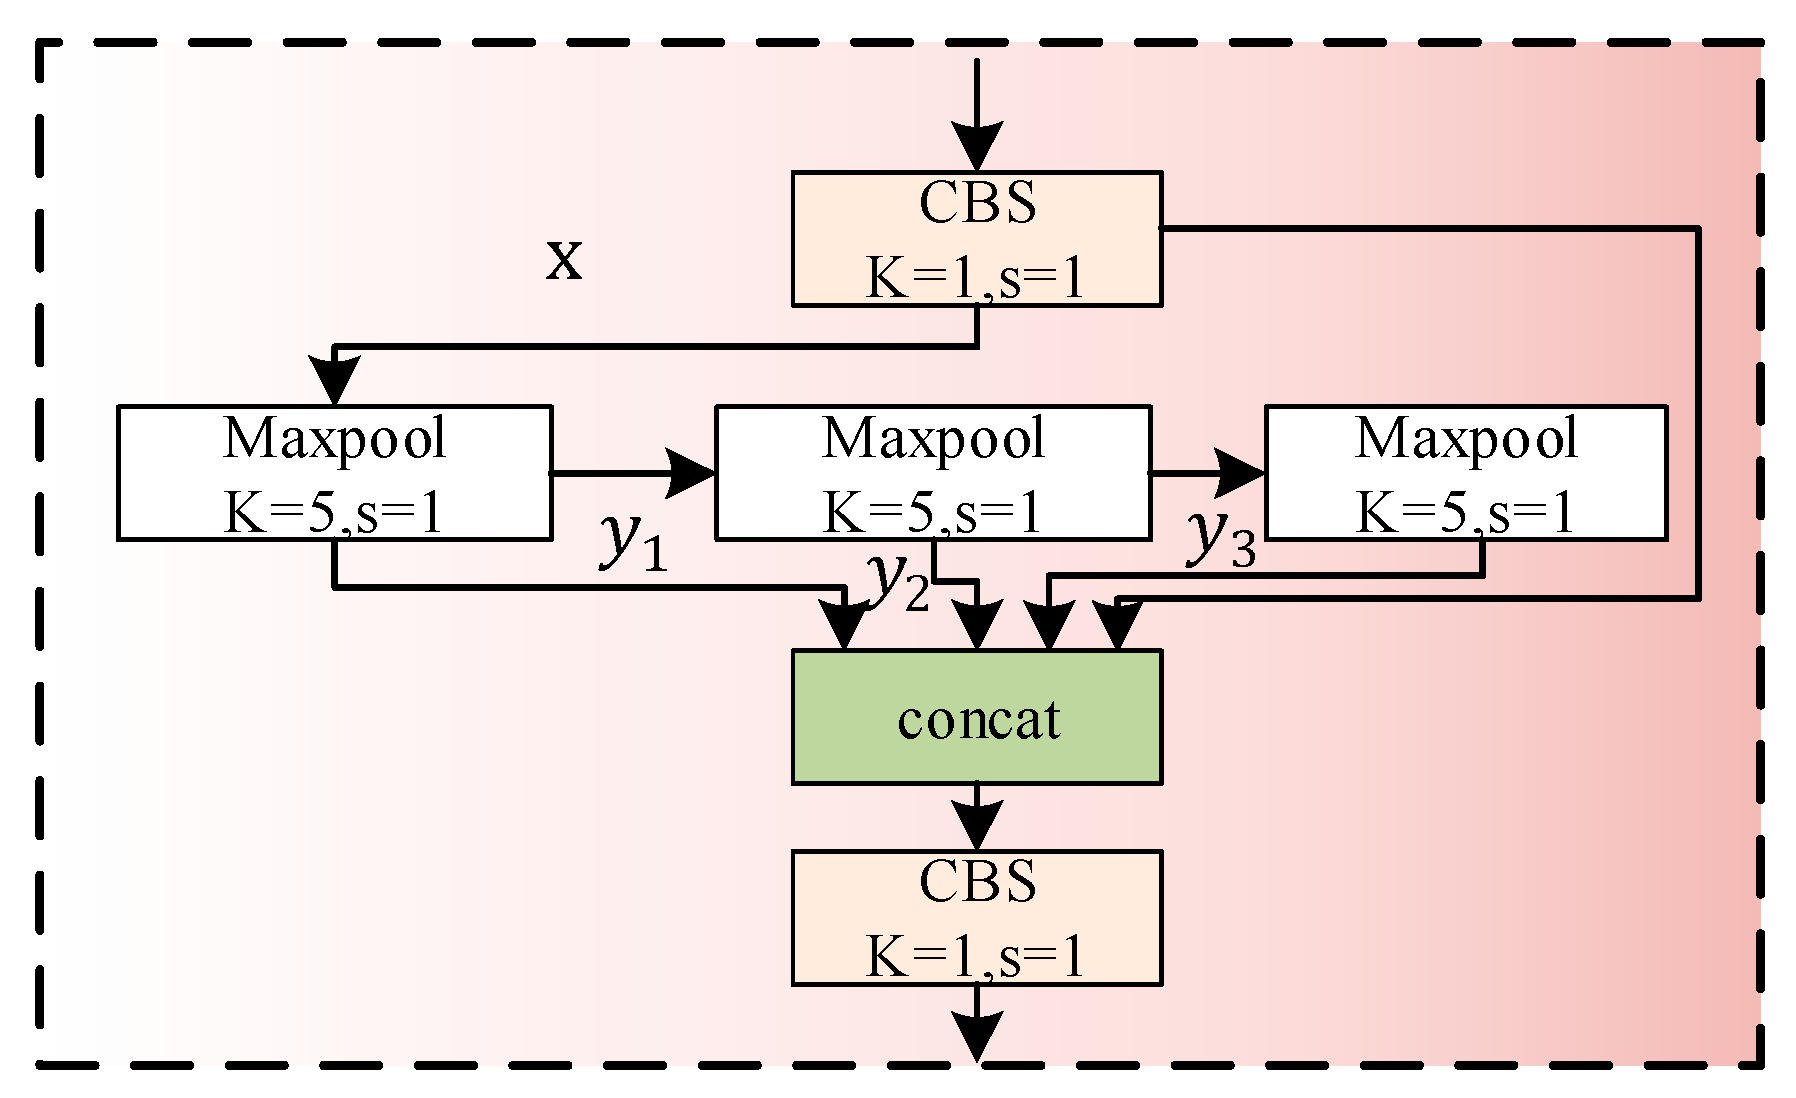
3.2.3. SPPF Module
3.3. Neck: Feature Pyramid
3.3.1. BiFPN Module
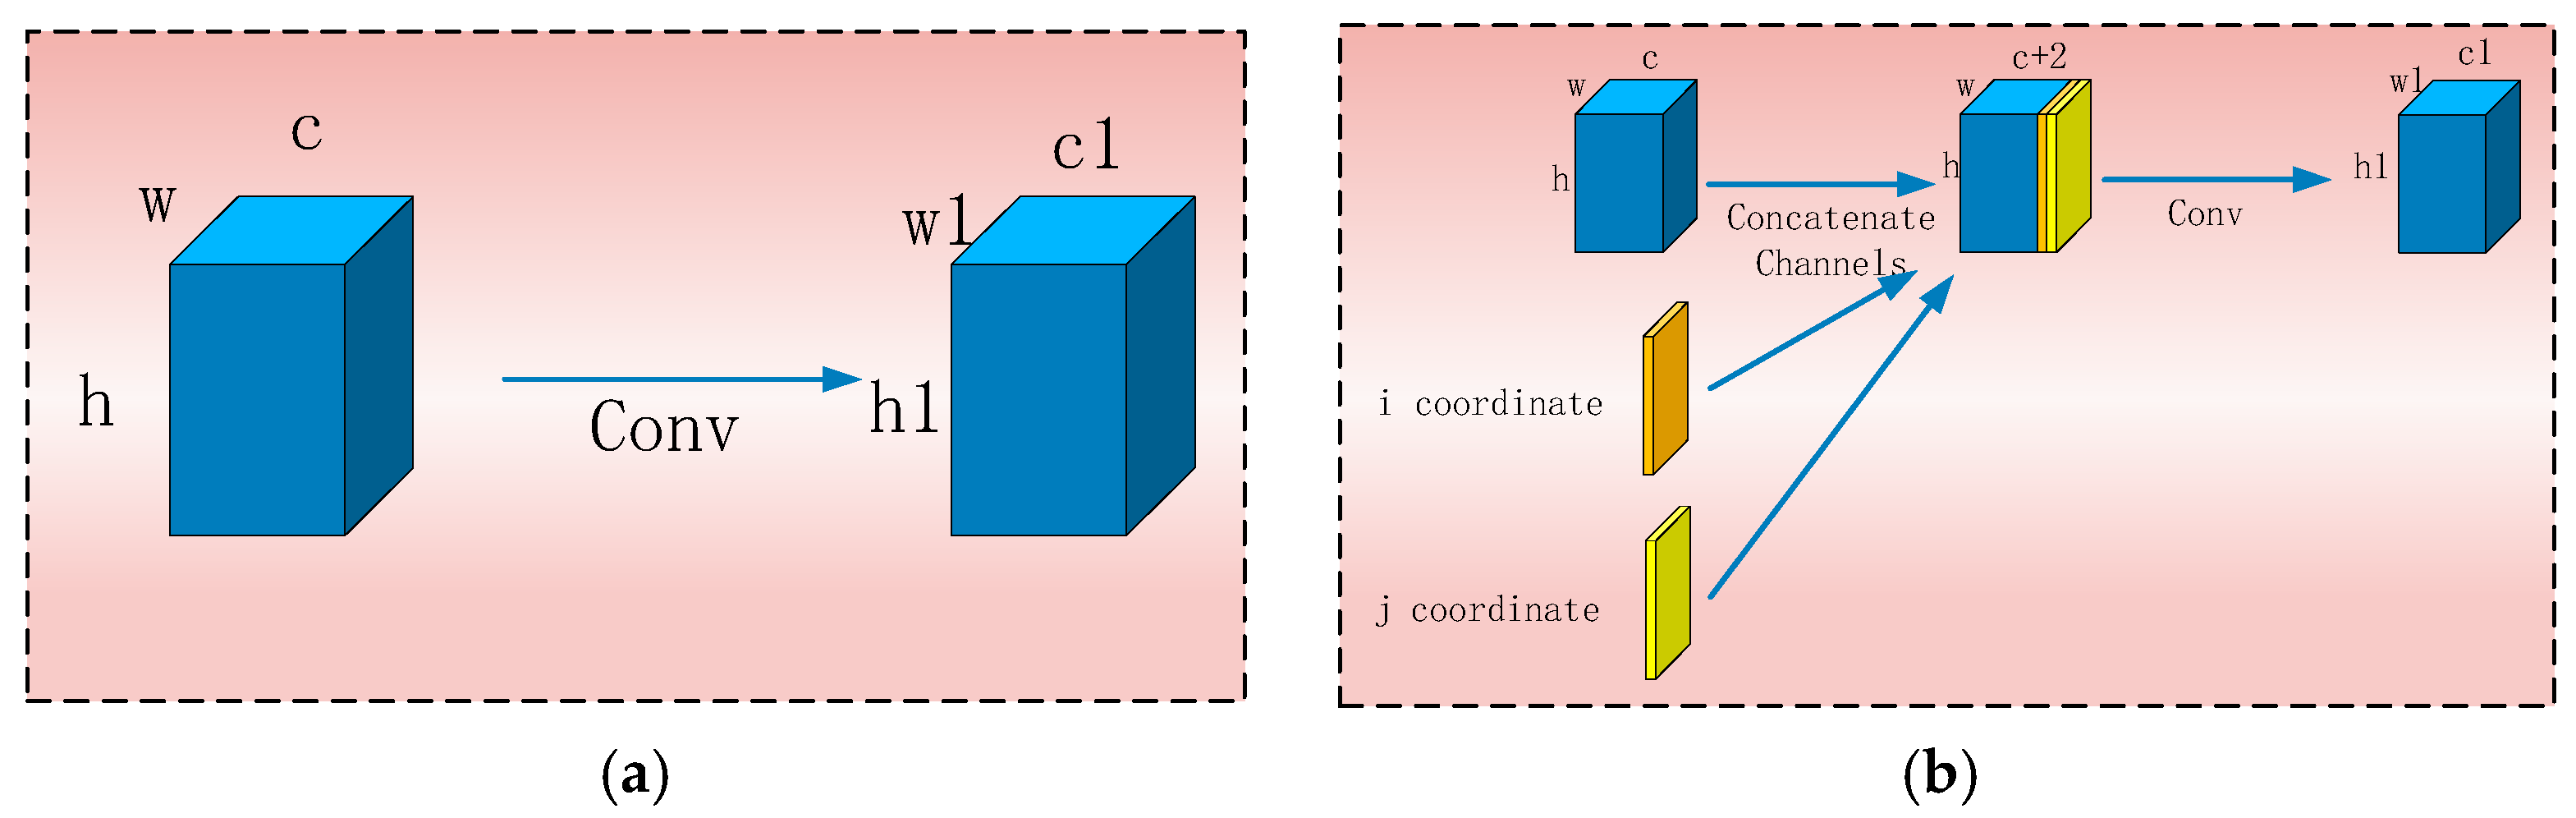
3.3.2. Coordconv Module
3.4. Head: Detection
4. Experiments and Analysis
4.1. Experimental Detail
4.2. Evaluation Metrics
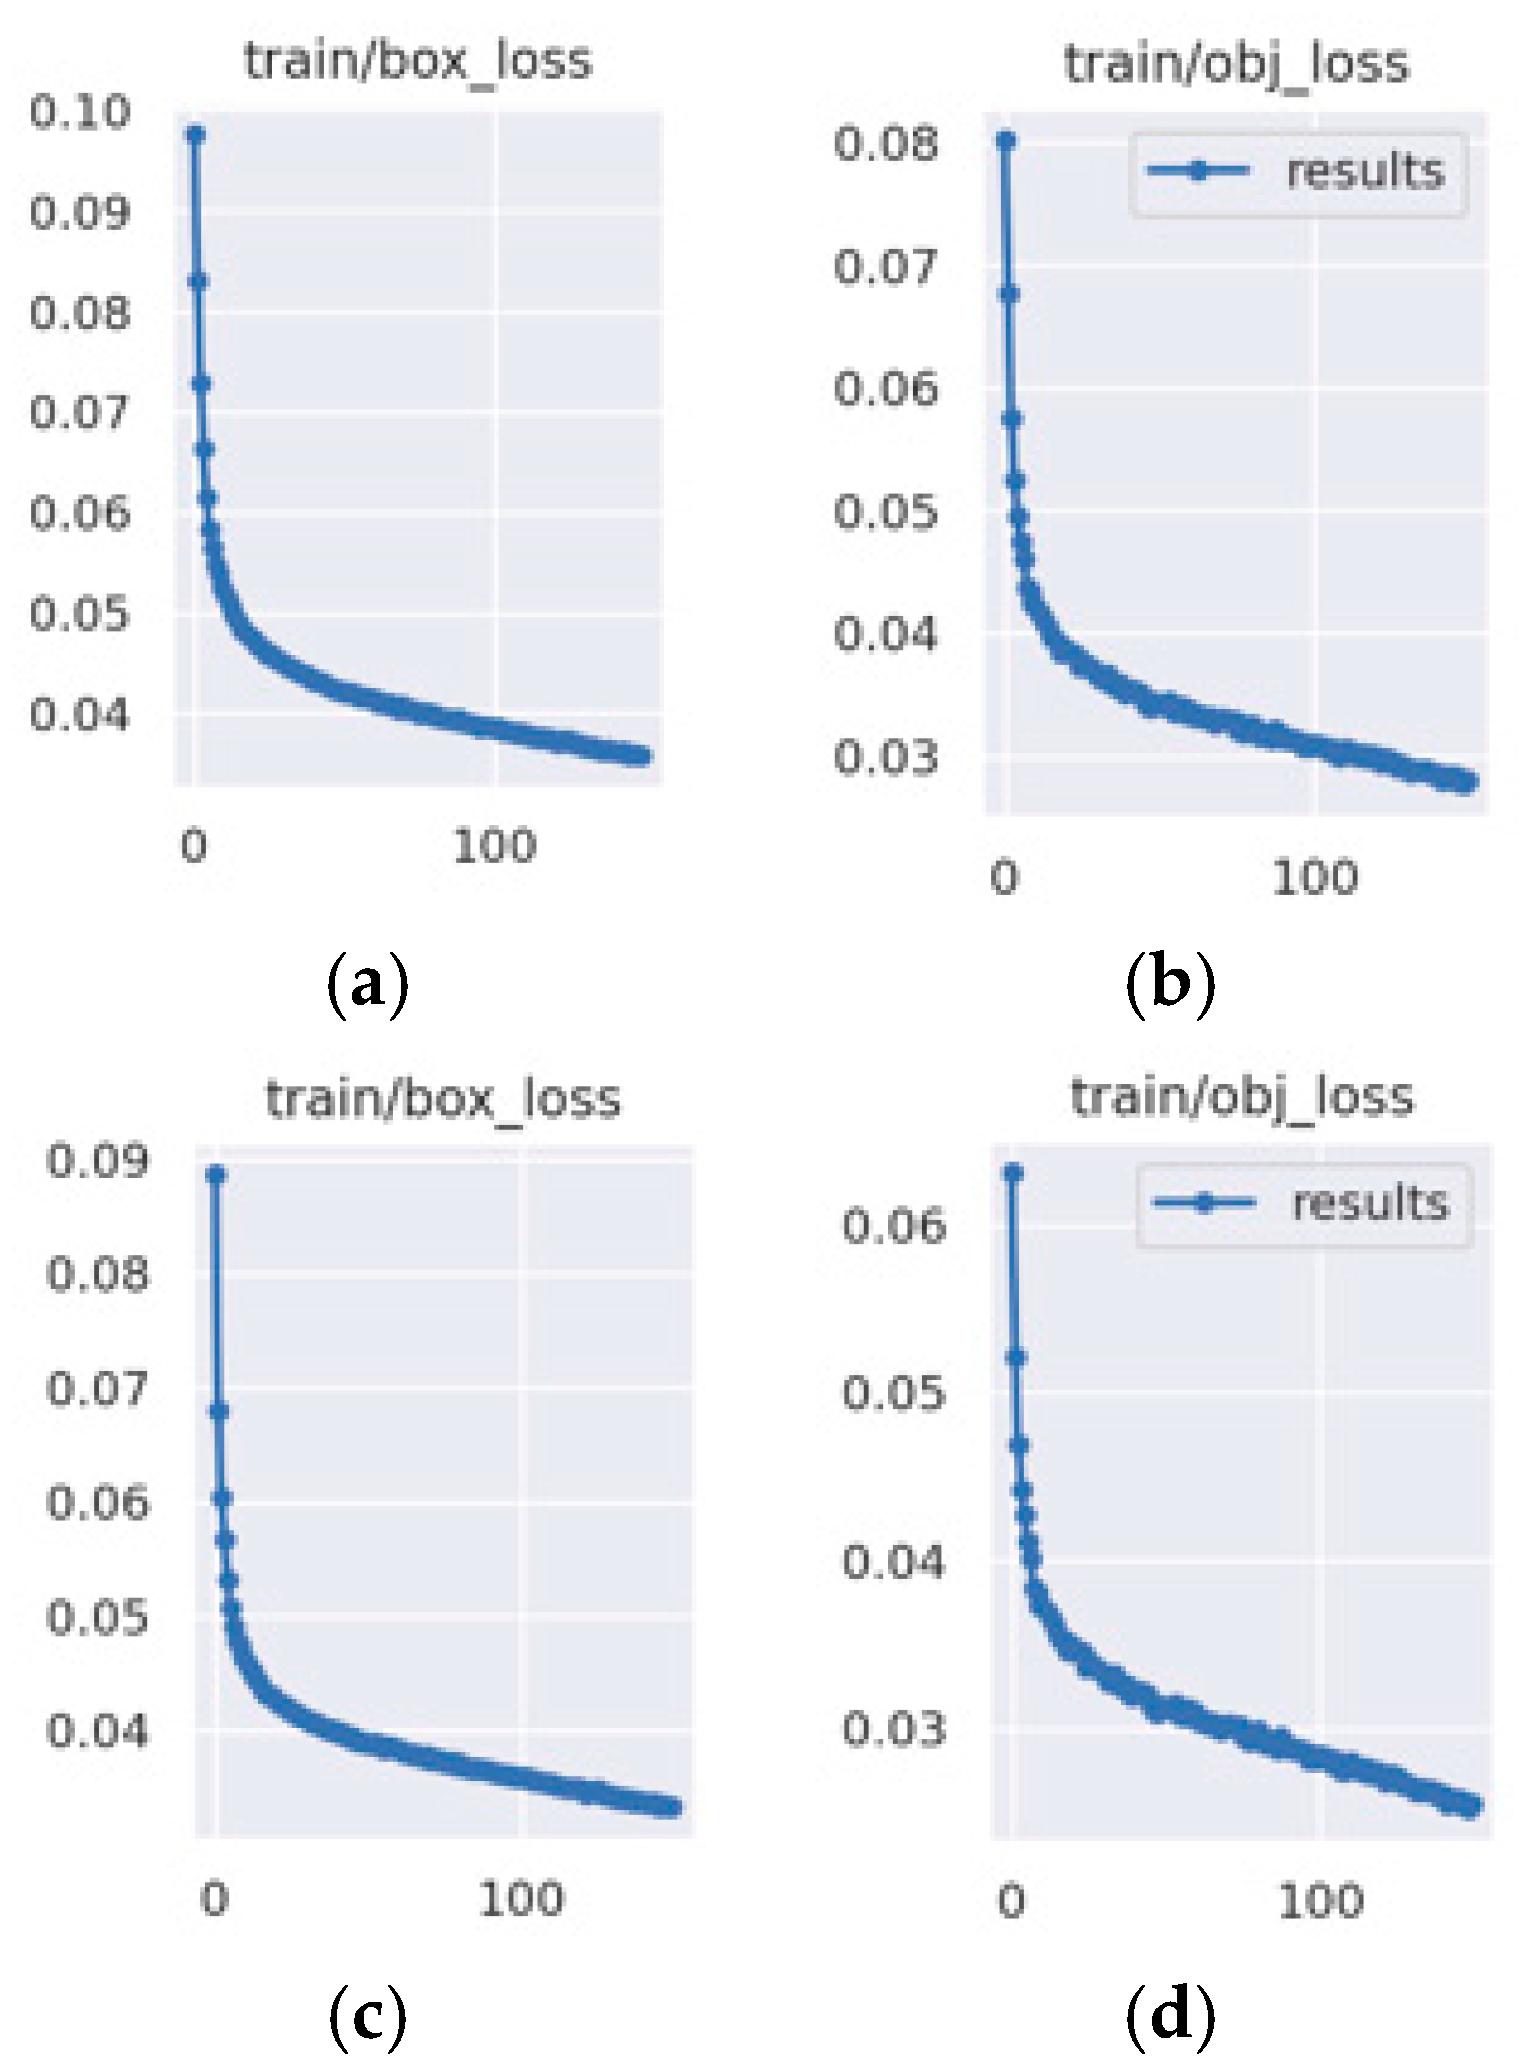
4.3. Data Training
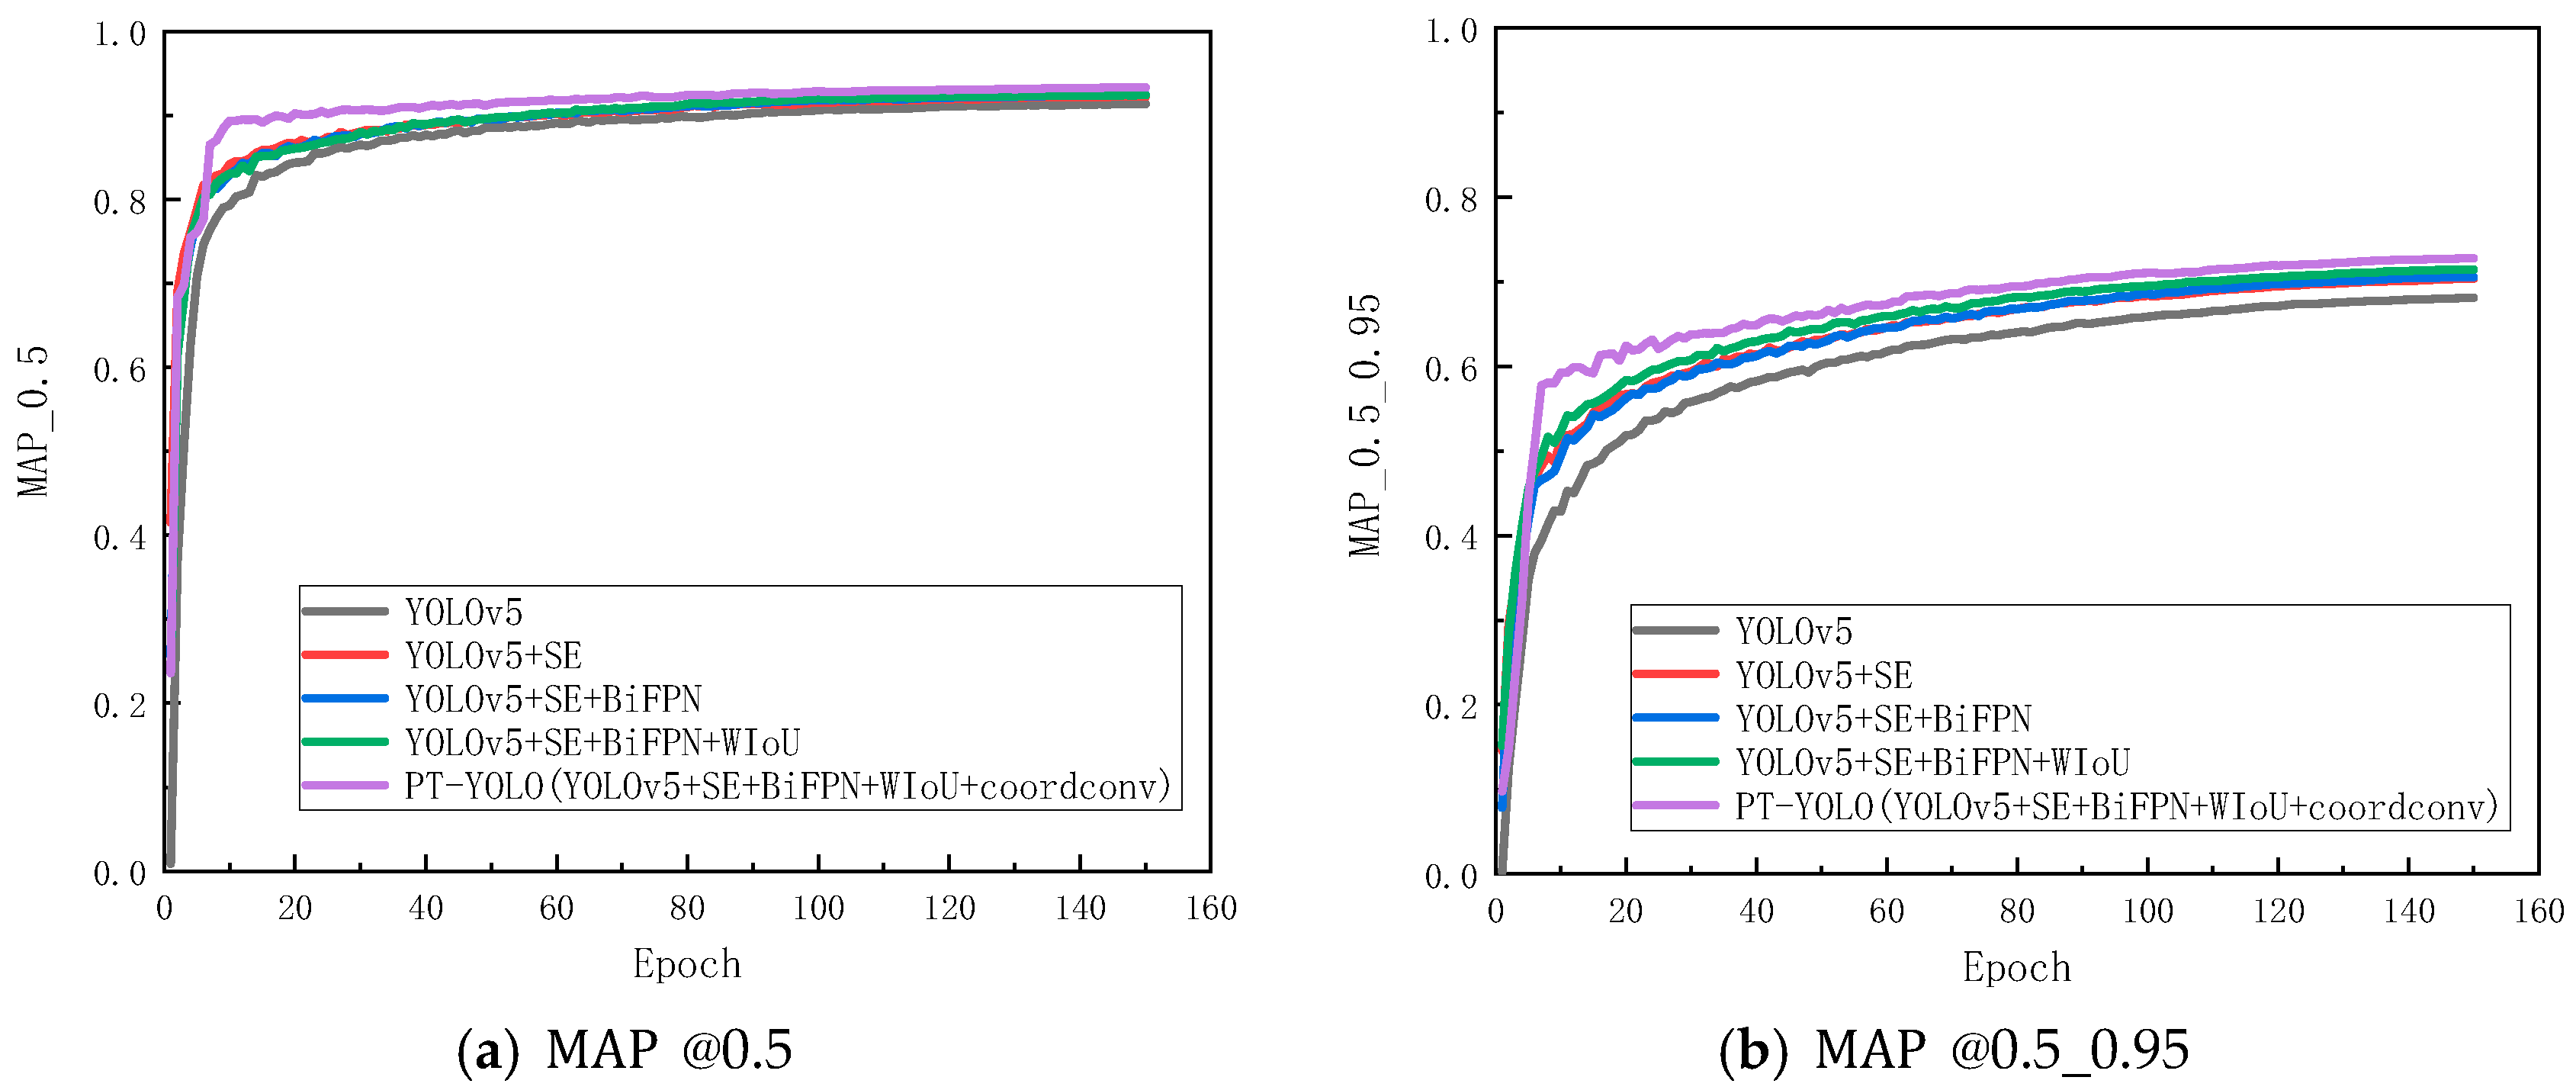
4.4. Ablation Experiments
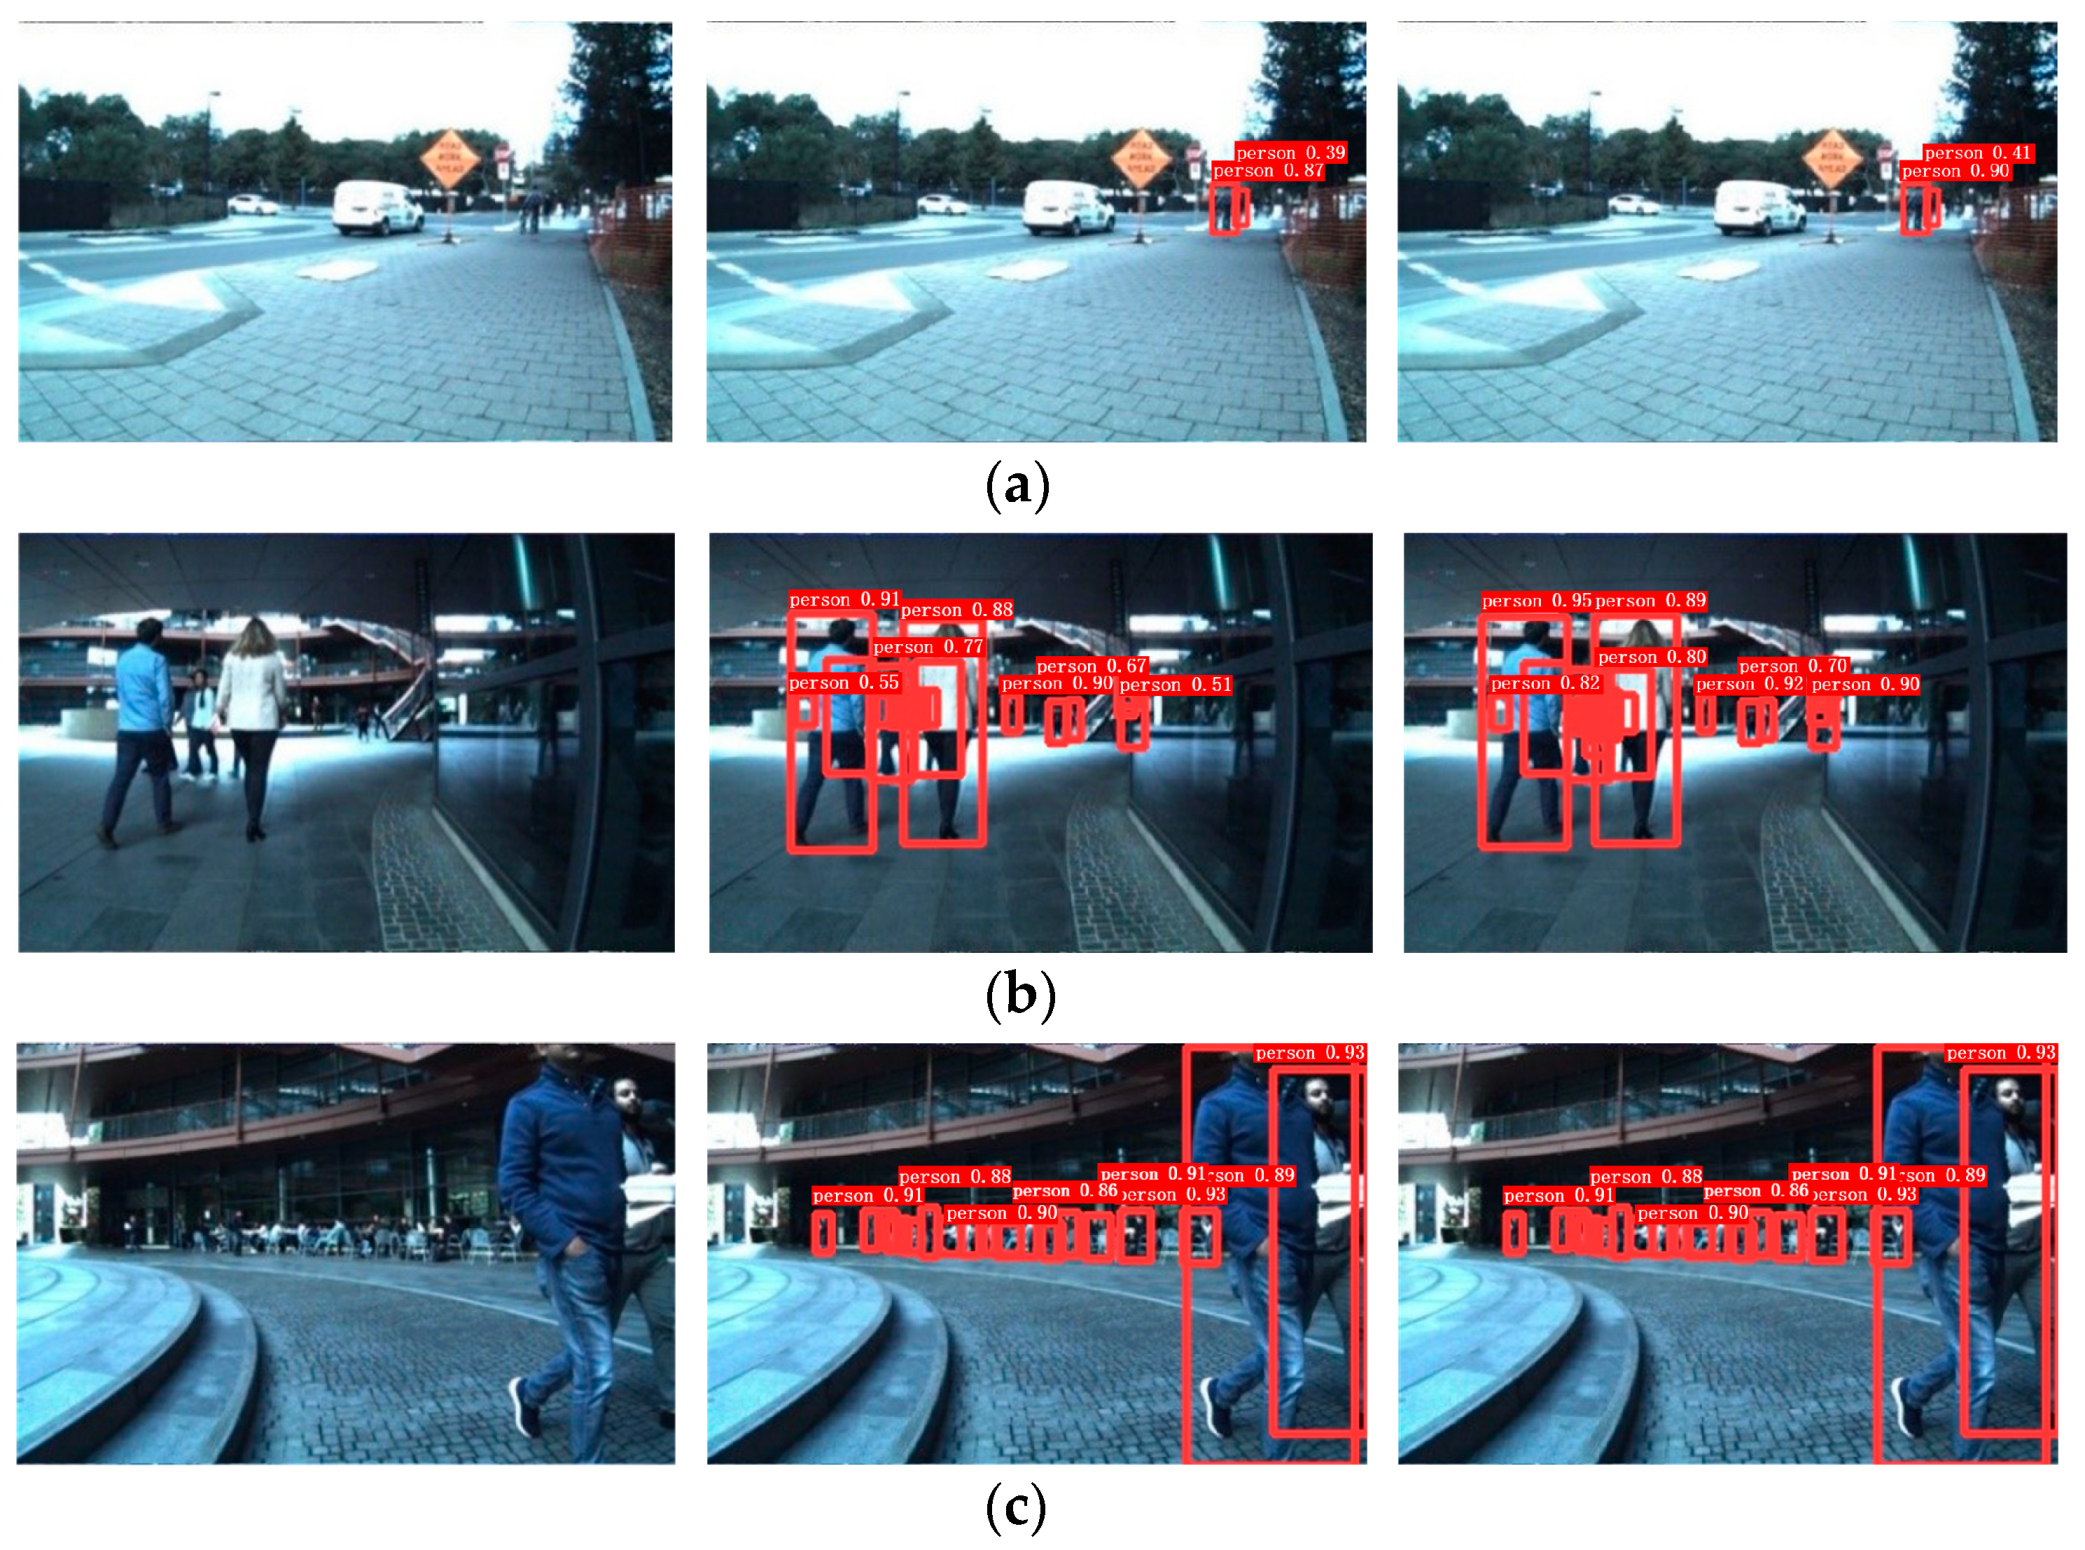
4.5. Comparison Experiments
5. Conclusions
Author Contributions
Funding
Data Availability Statement
Acknowledgments
Conflicts of Interest
References
- Ji, Q.; Yu, H.; Wu, X. Hierarchical-Matching-Based Online and Real-Time Multi-Object Tracking with Deep Appearance Features. Algorithms 2020, 13, 80. [Google Scholar] [CrossRef]
- Hu, W.; Xiao, X.; Xie, D.; Tan, T. Traffic accident prediction using 3-D model-based vehicle tracking. IEEE Trans. Veh. Technol. 2004, 53, 677–694. [Google Scholar] [CrossRef]
- Yang, H.; Shao, L.; Zheng, F.; Wang, L. Recent advances and trends in visual tracking: A review. Neurocomputing 2011, 74, 3823–3831. [Google Scholar] [CrossRef]
- Zotov, M.; Anzhiganov, D.; Kryazhenkov, A.; Barghini, D.; Battisti, M.; Belov, A.; Bertaina, M.; Bianciotto, M.; Bisconti, F.; Blaksley, C.; et al. Neural Network Based Approach to Recognition of Meteor Tracks in the Mini-EUSO Telescope Data. Algorithms 2023, 16, 448. [Google Scholar] [CrossRef]
- Zhang, L.; Xiong, N.; Pan, X.; Yue, X.; Wu, P.; Guo, C. Improved Object Detection Method Utilizing YOLOv7-Tiny for Unmanned Aerial Vehicle Photographic Imagery. Algorithms 2023, 16, 520. [Google Scholar] [CrossRef]
- Qu, H.; Wang, M.; Zhang, C.; Wei, Y. A Study on Faster R-CNN-Based Subway Pedestrian Detection with ACE Enhance-ment. Algorithms 2018, 11, 192. [Google Scholar] [CrossRef]
- Ghari, B.; Tourani, A.; Shahbahrami, A. A Robust Pedestrian Detection Approach for Autonomous Vehicles. In Proceedings of the 2022 8th Iranian Conference on Signal Processing and Intelligent Systems (ICSPIS), Mazandaran, Iran, 28–29 December 2022; pp. 1–5. [Google Scholar]
- Liu, L.; Ke, C.; Lin, H.; Xu, H. Research on pedestrian detection algorithm based on MobileNet-YoLo. Comput. Intell. Neurosci. 2022, 2022, 1–12. [Google Scholar] [CrossRef] [PubMed]
- Esfandiari, N.; Bastanfard, A. Improving accuracy of pedestrian detection using convolutional neural networks. In Proceedings of the 2020 6th Iranian Conference on Signal Processing and Intelligent Systems (ICSPIS), Mashhad, Iran, 23–24 December 2020; pp. 1–6. [Google Scholar]
- Zhang, Y.; Zhu, Q. Neural Network-Enhanced Fault Diagnosis of Robot Joints. Algorithms 2023, 16, 489. [Google Scholar] [CrossRef]
- Dalal, N.; Triggs, B. Histograms of oriented gradients for human detection. In Proceedings of the 2005 IEEE Computer Society Conference on Computer Vision and Pattern Recognition, San Diego, CA, USA, 20–25 June 2005; Volume 1, pp. 886–893. [Google Scholar]
- Chen, W.; Zhu, Y.; Tian, Z.; Zhang, F.; Yao, M. Occlusion and multi-scale pedestrian detection A review. Array 2023, 19, 100318. [Google Scholar]
- Ren, S.; He, K.; Girshick, R.; Sun, J. Faster r-cnn: Towards real-time object detection with region proposal networks. In Proceedings of the Advances in Neural Information Processing Systems 28 (NIPS 2015), Montreal, QC, Canada, 7–12 December 2015. [Google Scholar]
- Redmon, J.; Divvala, S.; Girshick, R.; Farhadi, A. You Only Look Once: Unified, Real-Time Object Detection. In Proceedings of the Conference on Computer Vision and Pattern Recognition, Las Vegas, NV, USA, 27–30 June 2016; pp. 779–788. [Google Scholar]
- Mita, T.; Kaneko, T.; Hori, O. Joint haar-like features for face detection. In Proceedings of the Tenth IEEE International Conference on Computer Vision, Beijing, China, 17–21 October 2005; Volume 2, pp. 1619–1626. [Google Scholar]
- Felzenszwalb, P.F.; Girshick, R.B.; McAllester, D.; Ramanan, D. Object detection with discriminatively trained part-based models. IEEE Trans. Pattern Anal. Aachine Intell. 2009, 32, 1627–1645. [Google Scholar] [CrossRef] [PubMed]
- Wang, X.; Han, T.X.; Yan, S. An HOG-LBP human detector with partial occlusion handling. In Proceedings of the International Conference on Computer Vision, Kyoto, Japan, 29 September–2 October 2009; pp. 32–39. [Google Scholar]
- Chen, P.H.; Lin, C.J.; Schölkopf, B. A tutorial on ν-support vector machines. Appl. Stoch. Models Bus. Ind. 2005, 21, 111–136. [Google Scholar]
- Freund, Y.; Schapire, R.E. A decision-theoretic generalization of on-line learning and an application to boosting. J. Comput. Syst. Sciences 1997, 55, 119–139. [Google Scholar]
- Uijlings, J.R.; Van De Sande, K.E.; Gevers, T. Selective search for object recognition. Int. J. Comput. Vis. 2013, 104, 154–171. [Google Scholar]
- Vedaldi, A.; Gulshan, V.; Varma, M.; Zisserman, A. Multiple kernels for object detection. In Proceedings of the International Conference on Computer Vision, Kyoto, Japan, 29 September–2 October 2009; pp. 606–613. [Google Scholar]
- Yu, Y.; Zhang, J.; Huang, Y.; Zheng, S.; Ren, W.; Wang, C. Object Detection by Context and Boosted HOG-LBP. In Proceedings of the ECCV Workshop on PASCAL VOC, Crete, Greece, 11 September 2010. [Google Scholar]
- Liu, T.; Cheng, J.; Yang, M.; Du, X.; Luo, X.; Zhang, L. Pedestrian detection method based on self-learning. In Proceedings of the 2019 IEEE 4th Advanced Information Technology, Electronic and Automation Control Conference (IAEAC), Chengdu China, 20–22 December 2019; Volume 1, pp. 2161–2165. [Google Scholar]
- Girshick, R. Fast r-cnn. In Proceedings of the IEEE International Conference on Computer Vision, Santiago, Chile, 7–13 December 2015; pp. 1440–1448. [Google Scholar]
- Gong, H.; Li, H.; Xu, K.; Zhang, Y. Object detection based on improved YOLOv3-tiny. In Proceedings of the 2019 Chinese Automation Congress (CAC), Hangzhou, China, 22–24 November 2019; pp. 3240–3245. [Google Scholar] [CrossRef]
- Woo, S.; Park, J.; Lee, J.Y.; Kweon, I.S. Cbam: Convolutional block attention module. In Proceedings of the European Conference on Computer Vision, Munich, Germany, 8–14 September 2018; pp. 3–19. [Google Scholar]
- Hu, J.; Shen, L.; Sun, G. Squeeze-and-excitation networks. In Proceedings of the IEEE Conference on Computer Vision and Pattern Recognition, Salt Lake City, UT, USA, 18–23 June 2018; pp. 7132–7141. [Google Scholar]
- Liu, Z.; Hu, H.; Lin, Y. Swin transformer v2: Scaling up capacity and resolution. In Proceedings of the Conference on Computer Vision and Pattern Recognition, New Orleans, LA, USA, 18–24 June 2022; pp. 12009–12019. [Google Scholar]
- Chen, Y.; Lin, W.; Yuan, X. CA-YOLOv5 for crowded pedestrian detection. Comput. Eng. Appl. 2022, 58, 238–245. [Google Scholar]
- Xu, Z.; Pan, S.; Ma, X. A Pedestrian Detection Method Based on Small Sample Data Set. In Proceedings of the 2023 IEEE International Conference on Image Processing and Computer Applications (ICIPCA), Kuala, Lumpur, 8–11 October 2023; pp. 669–674. [Google Scholar]
- Chen, H.; Guo, X. Multi-scale feature fusion pedestrian detection algorithm based on Transformer. In Proceedings of the 2023 4th International Conference on Computer Vision, Image and Deep Learning (CVIDL), Zhuhai, China, 12–14 May 2023; pp. 536–540. [Google Scholar]
- Murthy, J.S.; Siddesh, G.M.; Lai, W.C.; Hemalatha, K.L. Object detect: A real-time object detection framework for advanced driver assistant systems using yolov5. Wirel. Commun. Mob. Comput. 2022, 2022, 1–10. [Google Scholar] [CrossRef]
- Chen, J.; Mai, H.; Luo, L.; Chen, X.; Wu, K. Effective feature fusion network in BIFPN for small object detection. In Proceedings of the 2021 IEEE International Conference on Image Processing, Anchorage, AK, USA, 19–22 September 2021; pp. 699–703. [Google Scholar]
- Lin, M.; Wang, Z.; Huang, L. Analysis and Research on YOLOv5s Vehicle Detection with CA and BiFPN Fusion. In Proceedings of the 2022 IEEE 4th Eurasia Conference on IOT, Communication and Engineering, Yunlin, Taiwan, 28-30 October 2022; pp. 201–205. [Google Scholar]
- Zheng, Z.; Wang, P.; Ren, D. Enhancing geometric factors in model learning and inference for object detection and instance segmentation. IEEE Trans. Cybern. 2021, 52, 8574–8586. [Google Scholar] [CrossRef] [PubMed]
- Tong, Z.; Chen, Y.; Xu, Z.; Yu, R. Wise-IoU: Bounding Box Regression Loss with Dynamic Focusing Mechanism. arXiv 2023, arXiv:2301.10051. [Google Scholar]
- Martín-Martín, R.; Patel, M.; Rezatofighi, H.; Shenoi, A.; Gwak, J.; Frankel, E.; Sadeghian, A.; Savarese, S. Jrdb: A dataset and benchmark of egocentric robot visual perception of humans in built environments. IEEE Trans. Pattern Anal. Mach. Intell. 2021, 45, 6748–6765. [Google Scholar] [CrossRef] [PubMed]


| Parameter Name | Parameter Value |
|---|---|
| Batchsize | 40 |
| Epochs | 150 |
| Momentum | 0.9370 |
| Learning_rate | 0.0100 |
| Weight_decay | 0.0005 |
| Models | Loss Function Types | Results | ||
|---|---|---|---|---|
| MAP0.5% | MAP0.5–0.95% | Precision% | ||
| YOLOv5 | CIoU | 90.9 | 67.4 | 93.8 |
| YOLOv5 | WIoU | 91.6 | 67.7 | 94.4 |
| PT-YOLO | WIoU | 93.4 | 72.8 | 95.2 |
| Models | Precision% | Recall% | MAP@0.5% | MAP@0.5–0.95% |
|---|---|---|---|---|
| YOLOv5 | 93.8 | 81.2 | 90.9 | 67.4 |
| YOLOv5 + Swin_Transformer | 93.8 | 81.1 | 91.4 | 68.1 |
| YOLOv5 + CBAM | 94.2 | 81.9 | 91.4 | 69.0 |
| YOLOv5 + CA | 94.4 | 80.7 | 90.9 | 67.6 |
| YOLOv5 + SE | 94.4 | 81.2 | 91.4 | 70.4 |
| Models | Precision% | Recall% | Loss | MAP@0.5% | MAP@0.5–0.95% |
|---|---|---|---|---|---|
| YOLOv5 | 93.8 | 81.2 | 0.064 | 90.9 | 67.4 |
| YOLOv5 + SE | 94.4 | 81.2 | 0.064 | 91.4 | 70.4 |
| YOLOv5 + SE + BiFPN | 94.4 | 83.1 | 0.060 | 92.2 | 70.0 |
| YOLOv5 + SE + BiFPN + WIoU | 95.2 | 83.1 | 0.055 | 93.0 | 72.2 |
| PT-YOLO (YOLOv5 + SE + BiFPN + WIoU + coordconv) | 95.2 | 85.2 | 0.054 | 93.4 | 72.8 |
| Models | Precision% | Recall% | MAP@ MAP 0.5 | Loss | Parameters | Flops |
|---|---|---|---|---|---|---|
| Faster R-CNN | 39.94 | 72.93 | 65.14 | 0.626 | 9,988,756 | 26.7 |
| SSD | 95.61 | 43.63 | 68.14 | 1.648 | 7,987,021 | 16.2 |
| YOLOv3 | 93.80 | 82.20 | 92.00 | 0.061 | 9,308,902 | 23.4 |
| YOLOv5 | 93.80 | 82.00 | 90.93 | 0.063 | 7,022,326 | 15.9 |
| YOLOv7 | 94.20 | 85.10 | 92.10 | 0.077 | 37,196,556 | 105.1 |
| YOLOv8 | 94.90 | 85.10 | 92.30 | 0.067 | 11,097,853 | 28.7 |
| PT-YOLO | 95.20 | 85.20 | 93.40 | 0.054 | 10,810,495 | 22.7 |
Disclaimer/Publisher’s Note: The statements, opinions and data contained in all publications are solely those of the individual author(s) and contributor(s) and not of MDPI and/or the editor(s). MDPI and/or the editor(s) disclaim responsibility for any injury to people or property resulting from any ideas, methods, instructions or products referred to in the content. |
© 2024 by the authors. Licensee MDPI, Basel, Switzerland. This article is an open access article distributed under the terms and conditions of the Creative Commons Attribution (CC BY) license (https://creativecommons.org/licenses/by/4.0/).
Share and Cite
Su, J.; An, Y.; Wu, J.; Zhang, K. Pedestrian Detection Based on Feature Enhancement in Complex Scenes. Algorithms 2024, 17, 39. https://doi.org/10.3390/a17010039
Su J, An Y, Wu J, Zhang K. Pedestrian Detection Based on Feature Enhancement in Complex Scenes. Algorithms. 2024; 17(1):39. https://doi.org/10.3390/a17010039
Chicago/Turabian StyleSu, Jiao, Yi An, Jialin Wu, and Kai Zhang. 2024. "Pedestrian Detection Based on Feature Enhancement in Complex Scenes" Algorithms 17, no. 1: 39. https://doi.org/10.3390/a17010039
APA StyleSu, J., An, Y., Wu, J., & Zhang, K. (2024). Pedestrian Detection Based on Feature Enhancement in Complex Scenes. Algorithms, 17(1), 39. https://doi.org/10.3390/a17010039