1. Introduction
In the cultivation of root crops such as radish and carrots, it is difficult to control the production environment while checking the condition of roots. Therefore, production environment control for root crops requires the estimation of subsurface information from aboveground information. It has been proven that chlorophyll content in leaves is related to nitrogen content in crops and can be used as an indicator to control the production environment during crop cultivation [
1,
2,
3]. Conventional chemical analysis of chlorophyll content is labor-intensive, destructive, and limited to the small measurement area. In contrast, the chlorophyll value (SPAD value) measured by a chlorophyll meter (SPAD-502Plus, Konica Minolta, Inc., Tokyo, Japan) can accurately evaluate the chlorophyll content in plant leaves in a nondestructive manner. SPAD values can not only indirectly measure the nitrogen content in crops but are also related to plant growth indices and yield [
3,
4,
5], and it has been reported that water stress during crop cultivation causes SPAD values to increase [
6]. However, the measurement area for SPAD values using existing SPAD meters is still limited, and only one leaf can be measured at a time. Therefore, a method to predict leaf SPAD values on a large scale and in a short time would greatly contribute to the optimization of production environment control and cultivation management.
With the development of color image acquisition technology, color information obtained from digital cameras is now widely used to predict the physiological characteristics of crops, such as the vegetation index (VI) [
7,
8,
9], shape analysis [
10], and leaf nitrogen and chlorophyll content estimation [
11]. For example, VI based on the RGB color system has been integrated with crop height information and used for yield prediction [
9]. HSV and HSL color systems, which are obtained by converting from the RGB color system, are also used for semantic segmentation [
12], such as georeferencing and crop quality monitoring [
13]. There are also studies using multispectral cameras [
14,
15] and hyperspectral cameras [
16,
17], but these methods require high equipment costs.
In previous studies, algorithms such as Linear Regression [
7], convolutional neural networks (CNN) [
18], Support Vector Machines [
3], Random Forests [
3,
19], XGBoost [
19], and Generalized Linear Models (GLMs) [
20] have been applied to predict SPAD values using color values measured by images and color chromatometers. Although leaf colors vary from crop to crop and direct comparisons of model performances are not possible, some algorithms have achieved high model performance in predicting SPAD values. Therefore, if we can appropriately link leaf color to SPAD values using machine learning algorithms, we can accurately estimate SPAD values from leaf color in real time. To achieve this, it is important to select appropriate input variables for each algorithm.
Images acquired with a digital camera are easily affected by light sources such as brightness and color temperature [
8]. Therefore, it is desirable to acquire images using digital cameras under stable light conditions. However, because the intensity of sunlight, for example, changes from moment to moment, the pixel values of an image may change spatiotemporally, even for the same subject. In response to this problem, machine learning was applied to predict SPAD values from pixel values using a photographic device that creates a stable light environment [
18]. However, similar to conventional SPAD meters, this device can only measure the SPAD values of individual leaves. In agriculture, there is a need to efficiently acquire a large amount of information about crops in the fields or greenhouses. Therefore, new technologies are needed to measure SPAD values on many leaves at once. However, when measuring crops using images using UAVs for instance, it is often affected by the light environment. Therefore, by quantifying and clarifying the influence of the light environment on images during crop measurement, novel methods to measure the SPAD value of many leaves at once can contribute to the development of efficient and productive crop production.
In this study, we constructed a SPAD value prediction model using Random Forests [
21], XGBoost [
22], and LightGBM [
23] based on RGB values obtained from images of radish leaves, as well as HSV and HSL values obtained by conversion from RGB values, and color temperature and illuminance as input variables. We focus on the effect of the light environment at the time of photography on the pixel values of digital images and model the relationship between leaf color and SPAD values under varying photographic conditions with respect to the color temperature and illuminance of the light source. Furthermore, based on information such as the variable importance calculated by Random Forests, we examined the influence of photographic conditions on the prediction of SPAD values for agriculture where domain knowledge remains qualitative.
2. Materials and Methods
2.1. Plant Material
The material tested was leaves cut at 1.5 cm in diameter (leaf patches) from a radish produced by the JA Toyohashi Omura gardening club purchased at a supermarket in Tsuzuki Ward, Yokohama City, Kanagawa Prefecture, Japan, on 1 April 2023.
2.2. Photographic Environment and Data Acquisition Methods
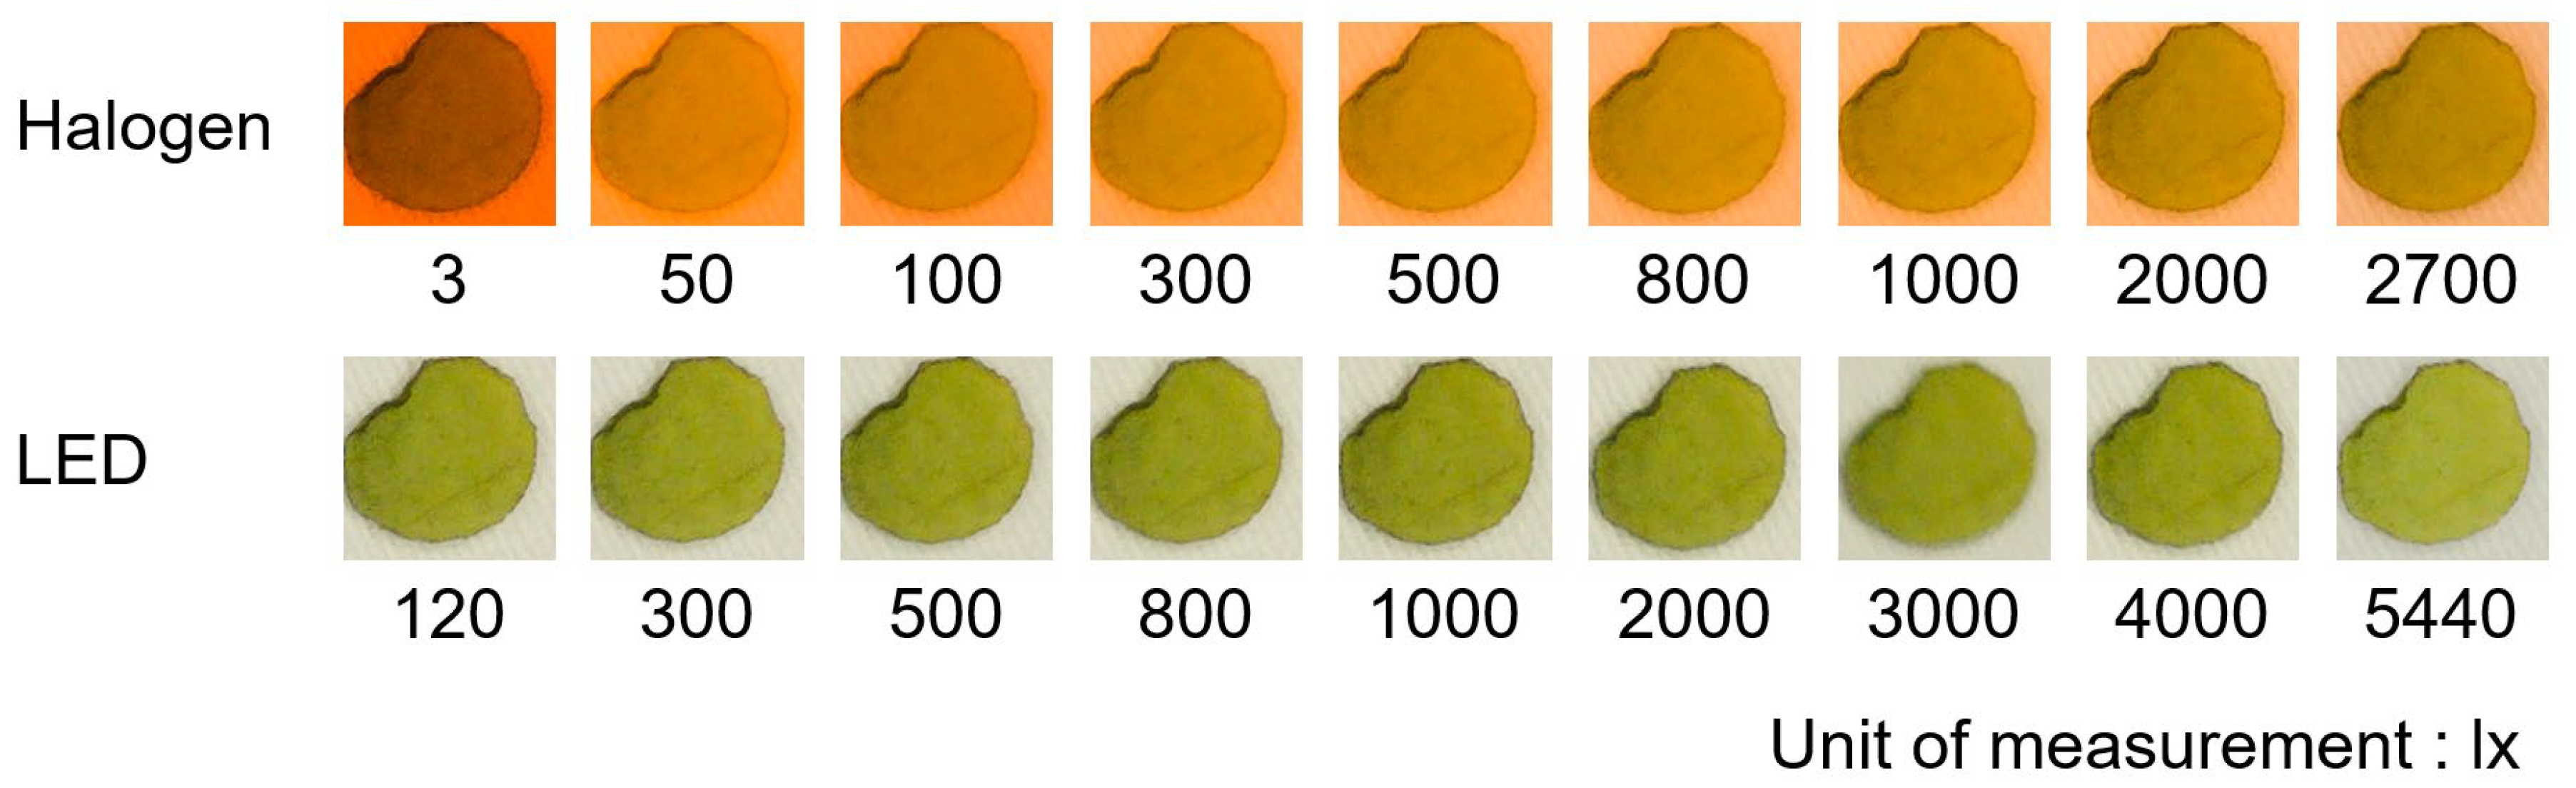
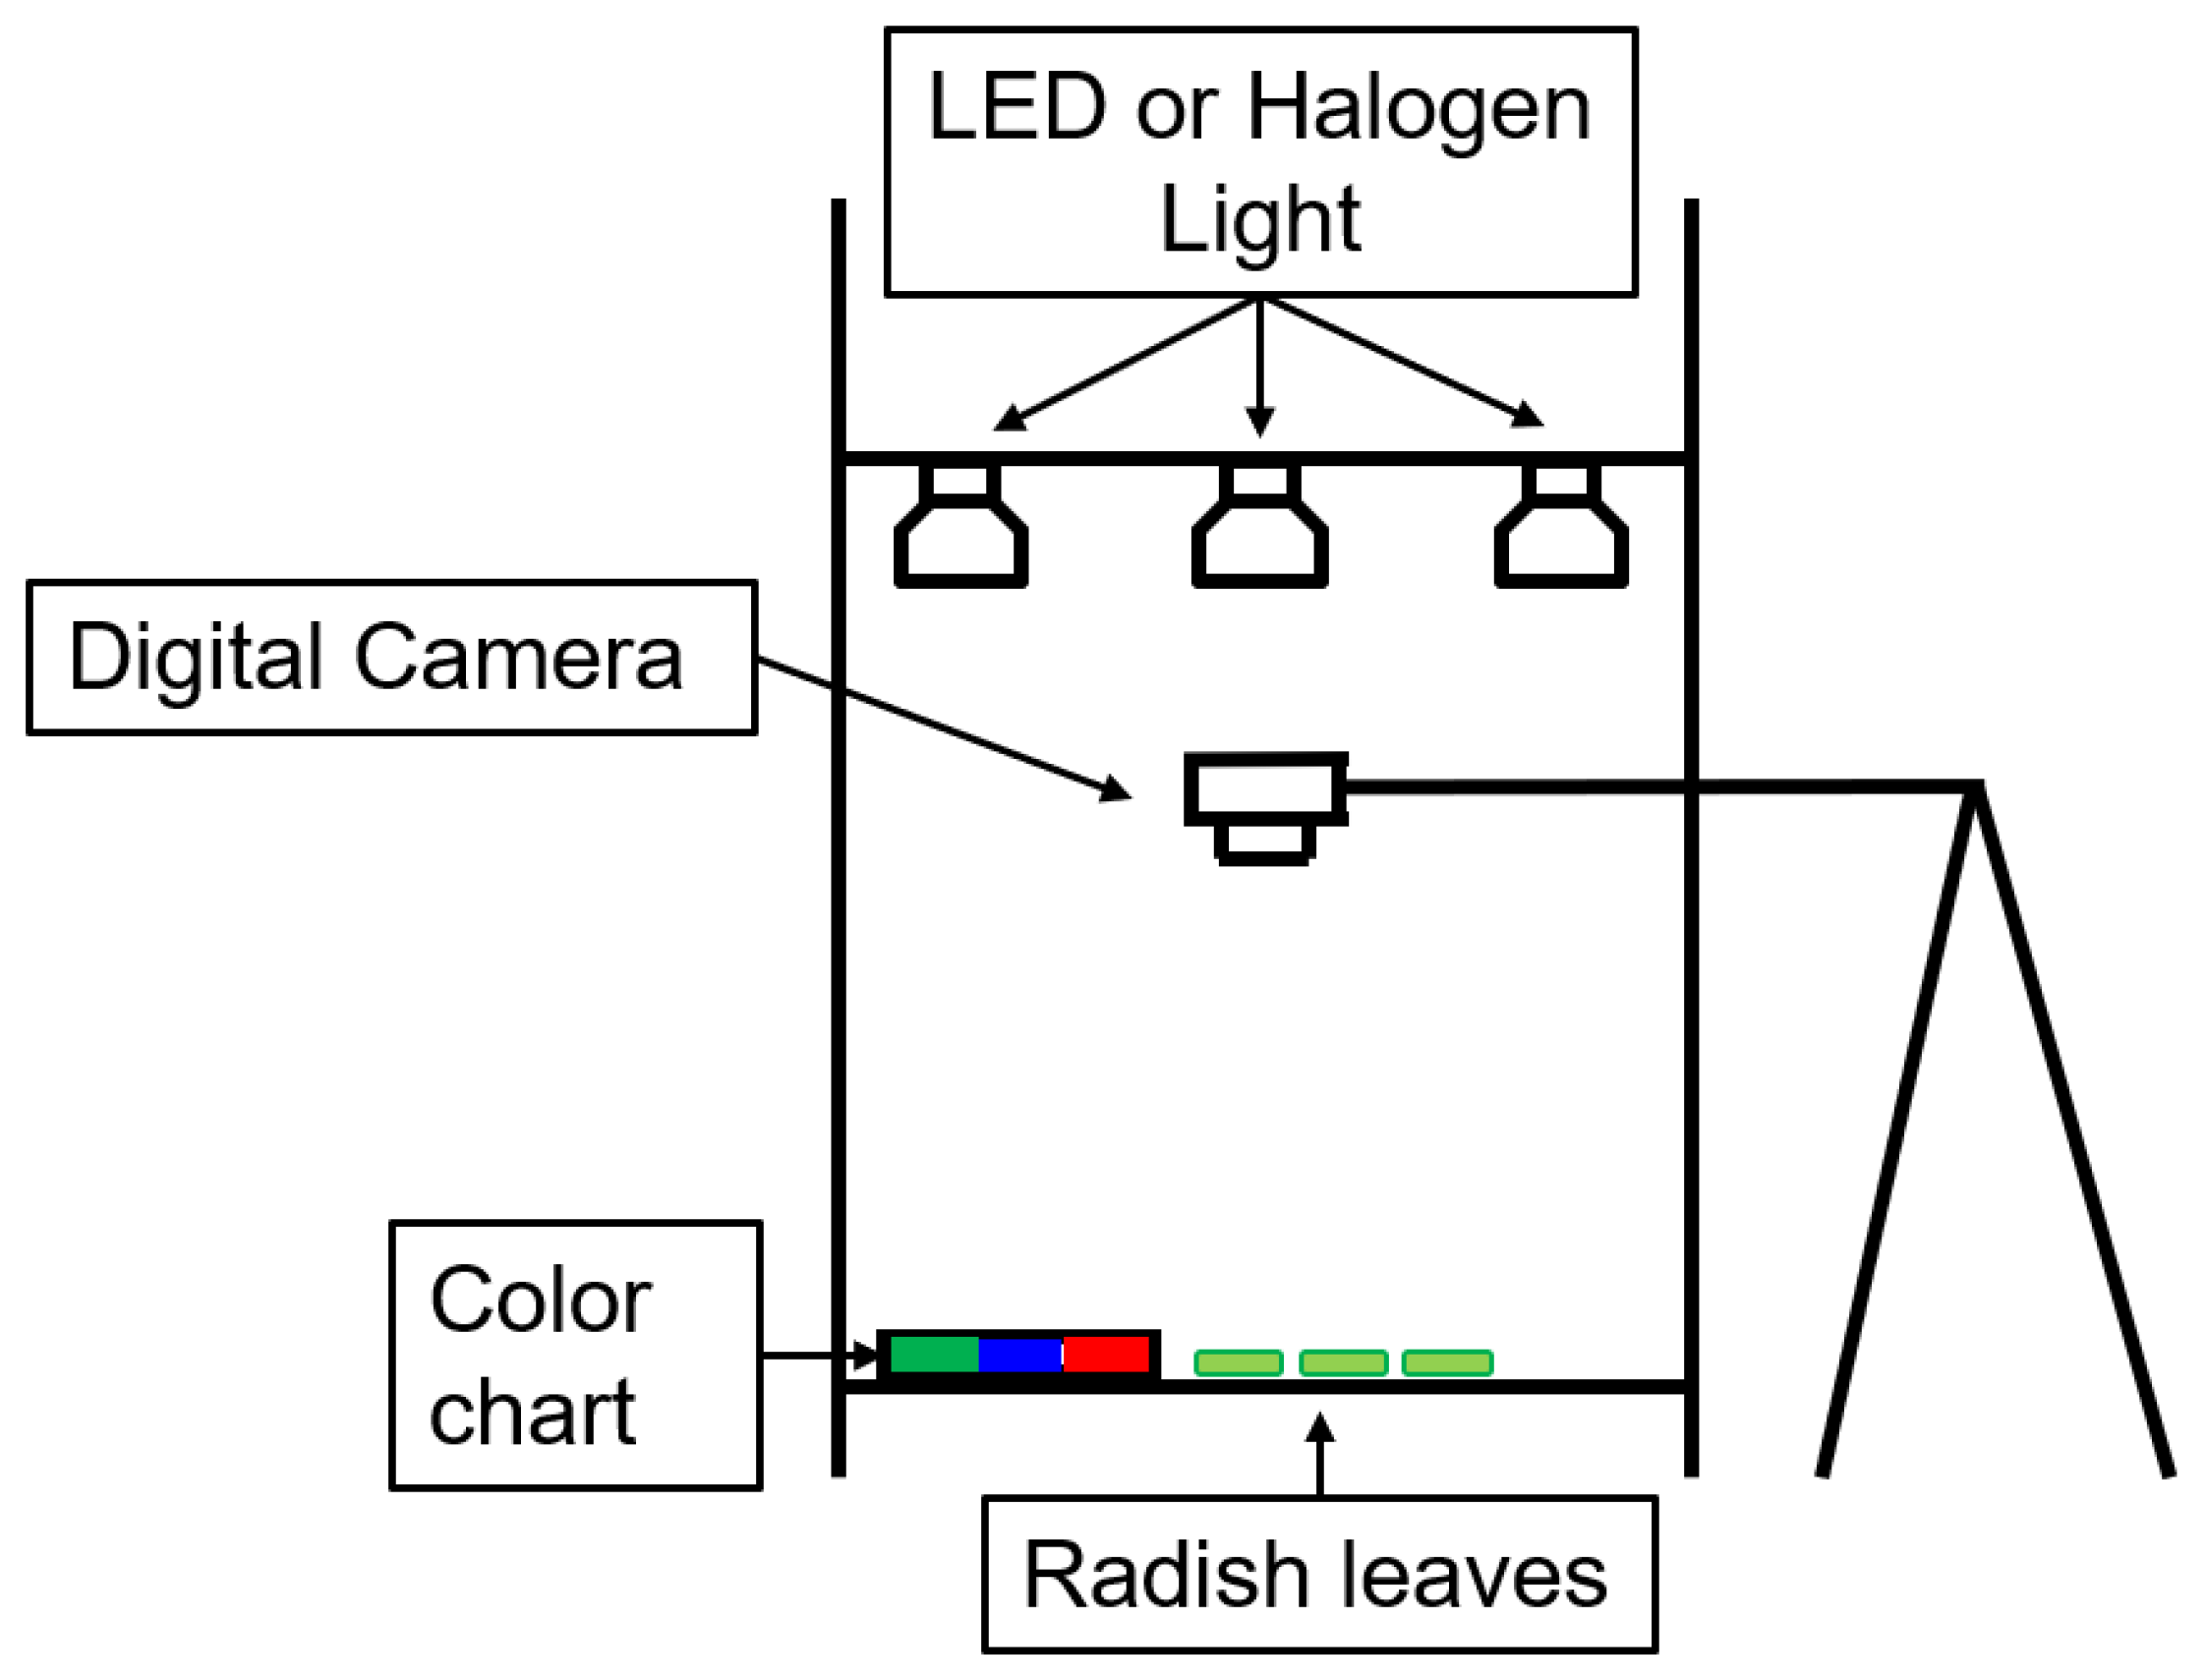
The images were taken using a box-type device with a height of 900 mm, width of 460 mm, and depth of 460 mm, constructed on a flat room floor. A digital camera (DC-GX7MK3, Panasonic Corp., Tokyo, Japan) was fixed on a tripod so that the camera could capture images of leaves from above for expected applications in image-based SPAD value predictions in an open field using a UAV or the use of a fixed-point camera for the greenhouse. The camera parameters were F-value 7.1, ISO 200, and focal length 12 mm. In this photographic environment, the color temperature and light intensity can be controlled by switching the lighting using a dimmer. In this study, halogen bulbs (color temperature: 3000 K) and LED bulbs (color temperature: 5000 K) were used, with nine levels of illuminance for the halogen bulbs (3, 50, 100, 300, 500, 800, 1000, 2000, and 2700 lx) and nine levels of illuminance for the LED bulbs (120, 300, 500, 800, 1000, 2000, 3000, 4000, and 5440 lx).
Figure 1 shows a schematic diagram of the experimental device to capture images of radish leaves.
In this study, leaf patches of radishes were prepared, and the color information was obtained for an image of a leaf patch with a circularity greater than 0.85 (
Figure A1). The minimum, mean, median, and maximum values of the RGB, HSL, and HSV color systems (see
Section 2.3 for detail) were calculated for each leaf patch. The RGB, HSL, and HSV values of the center of gravity of the leaf patches were calculated for each leaf patch and used as input variables in the Random Forests analysis (described in
Section 2.4), together with the color temperature and illuminance of the photographic environment, to predict the SPAD values.
2.3. Color Information Collection Methods
Color information (RGB values, as well as HSL and HSV values calculated based on RGB values) was obtained from the images captured from the leaf patches. HSL values are values in the HSL color system, where H, S, and L represent hue, saturation, and lightness, respectively. The values of H and S in the HSL color system are reported to be indices that are theoretically unaffected by the intensity of illuminance, because illuminance information is concentrated only in L [
13]. Therefore, it is possible to reduce the influence of the light source on the photographic environment.
The HSL color system can be converted from the RGB color system in a cubic space through the icosahedral hue, saturation, and intensity (HSI) color system, which is similar to the HSL color system and the HSV color system. The difference between the HSL and HSV color systems lies in the color when S (saturation) is reduced. The HSL color system ranges from 0 to 360 for H, 0 to 100 for S, and 0 to 100 for L. The HSV color system ranges from 0 to 360 for H, 0 to 100 for S, and 0 to 100 for V. In this study, HSL and HSV values were calculated from each RGB value using a colormap in a Python library and normalized to the range of 0 to 1 in each value range.
2.4. Modeling with Random Forests, XGBoost, and LightGBM
Random Forests [
21] is an ensemble learning algorithm that integrates and analyzes multiple classification and regression trees. First, the algorithm extracts a large number of bootstrap samples. Then, it generates a decision tree for each bootstrap sample. These decision trees only use a small number of randomly selected variables as features. The final output is the mean value for regression and the majority vote for classification, as the results are obtained from multiple decision trees. Decision trees have the problem that, the deeper the tree, the more complex the structure becomes, and the more prone to overfitting. Random Forests, however, have better generalization ability than decision trees because of bagging, which alleviates the problem of overfitting. XGBoost [
22] and LightGBM [
23] are both algorithms based on gradient boosting trees. First, a decision tree is created, and the error between the predicted and observed values is calculated from the initial prediction. Subsequently, a new decision tree is created so that the loss is reduced using the gradient descent method. The final output is the sum of the weights of the leaves to which the predicted data belong to each decision tree. XGBoost uses a level-wise search, whereas LightGBM uses a leaf-wise search. XGBoost is computationally slow, whereas LightGBM has the disadvantage of overfitting. Importantly, Random Forests, XGBoost, and LightGBM allow an evaluation of the importance of each input variable for model interpretation (see [
24] for Random Forests).
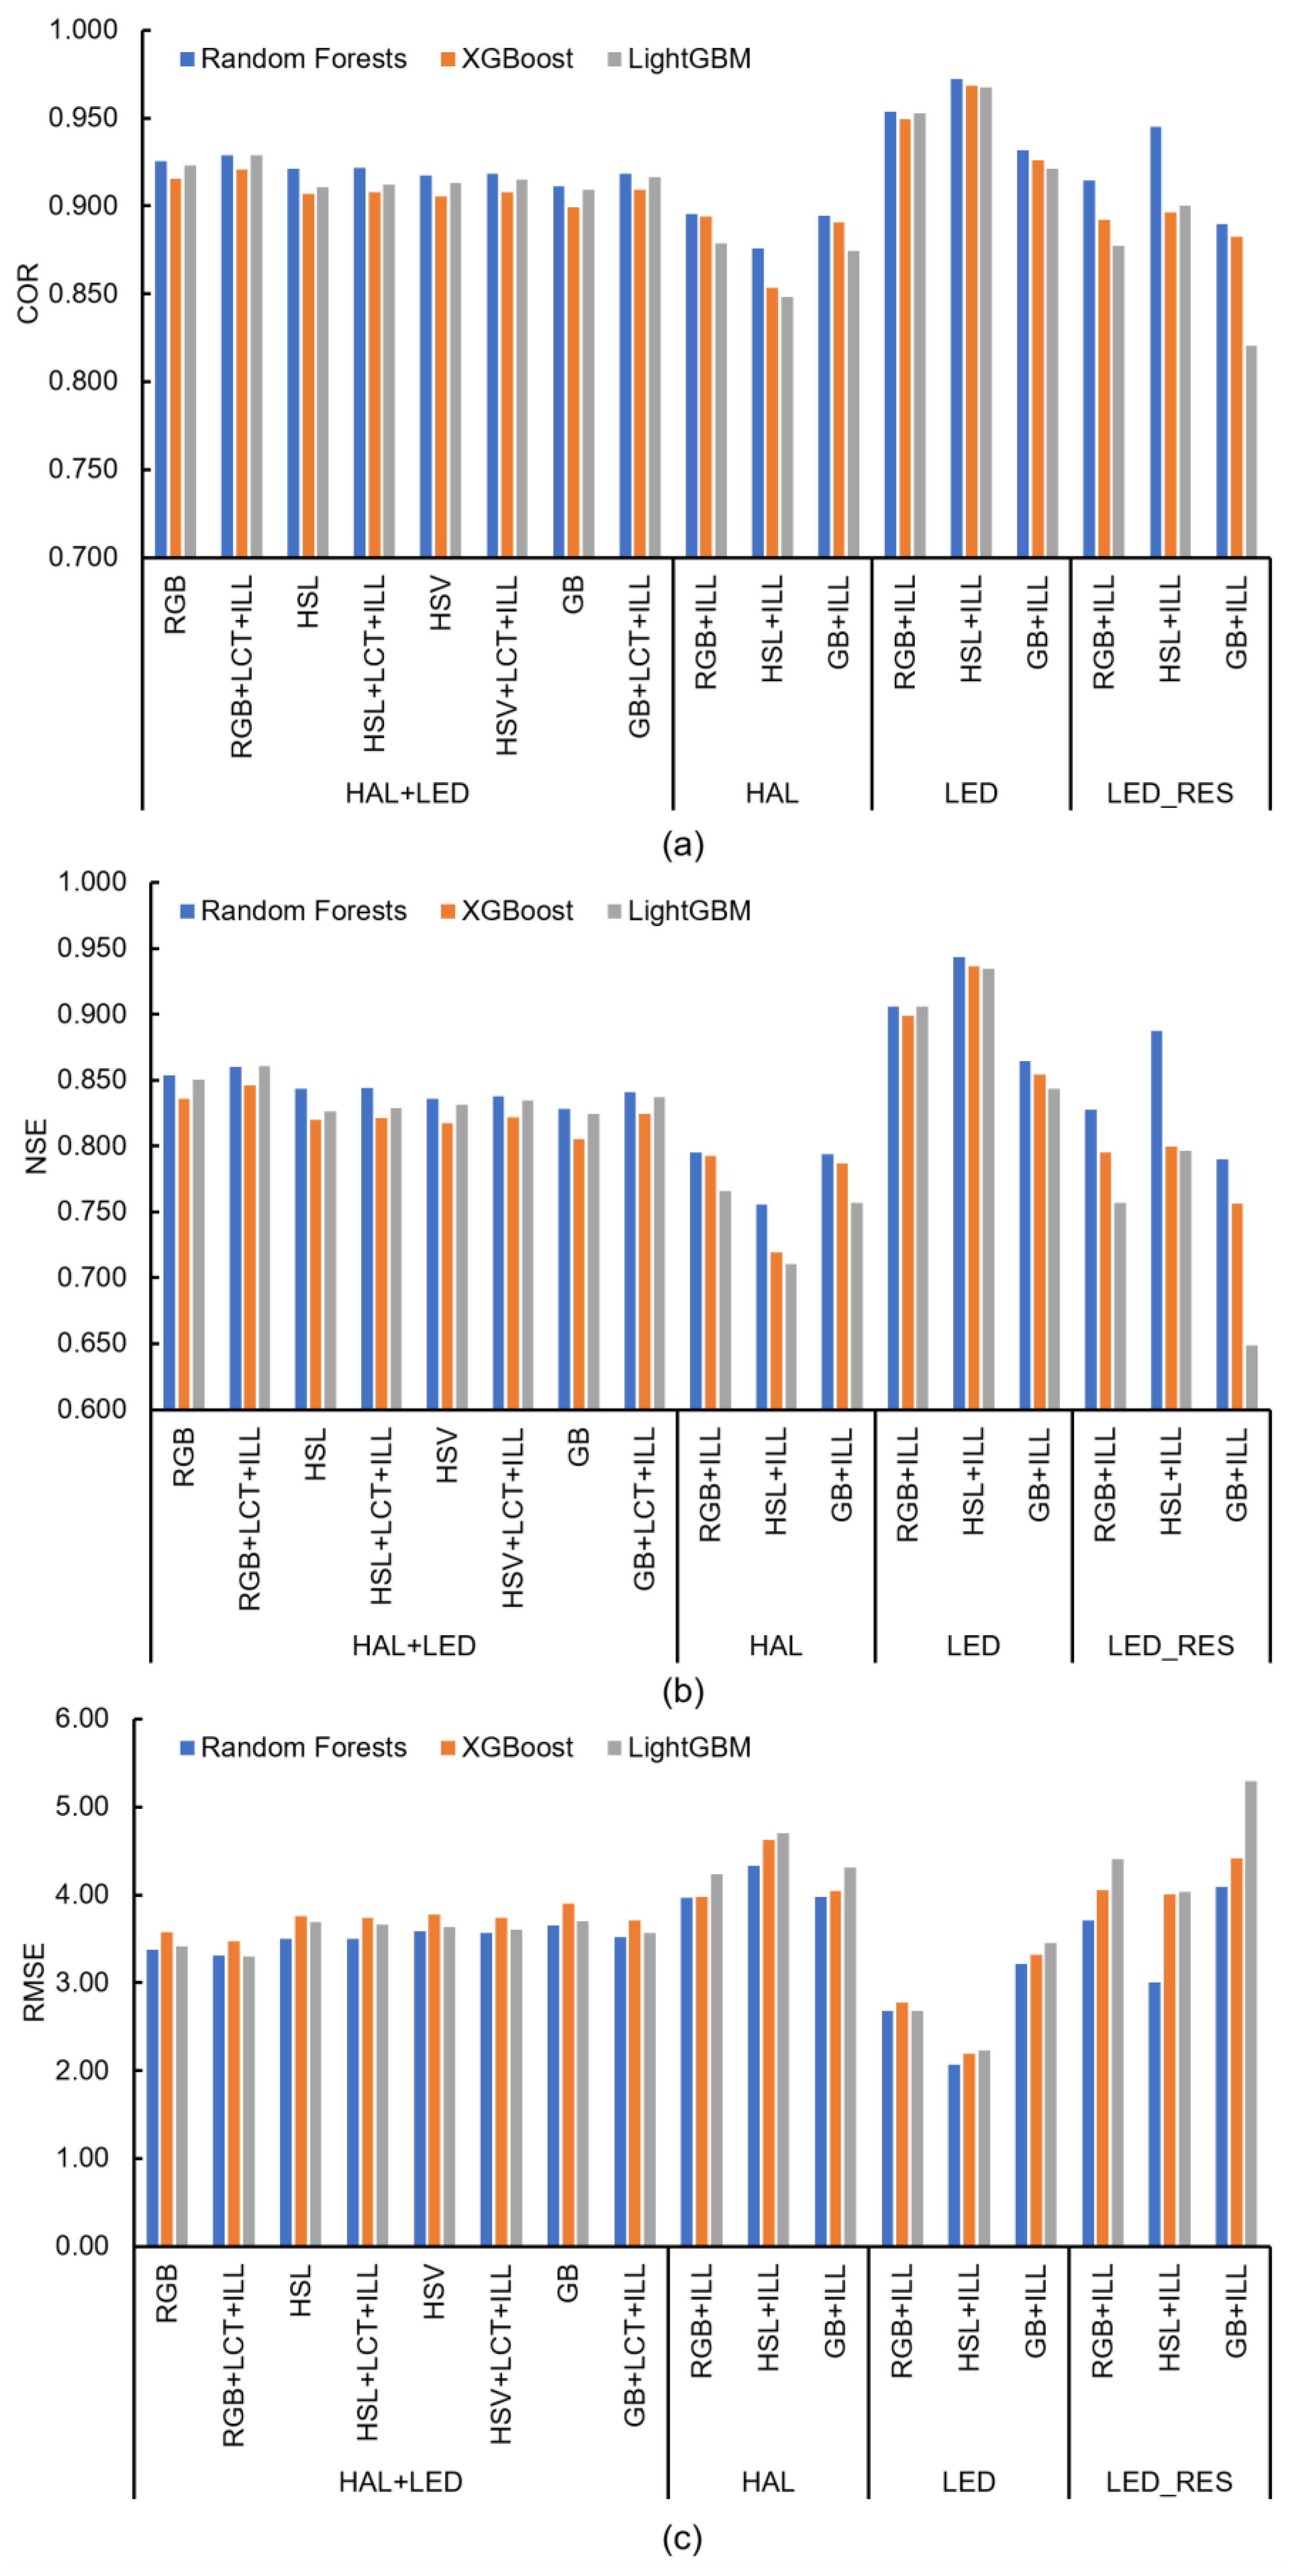
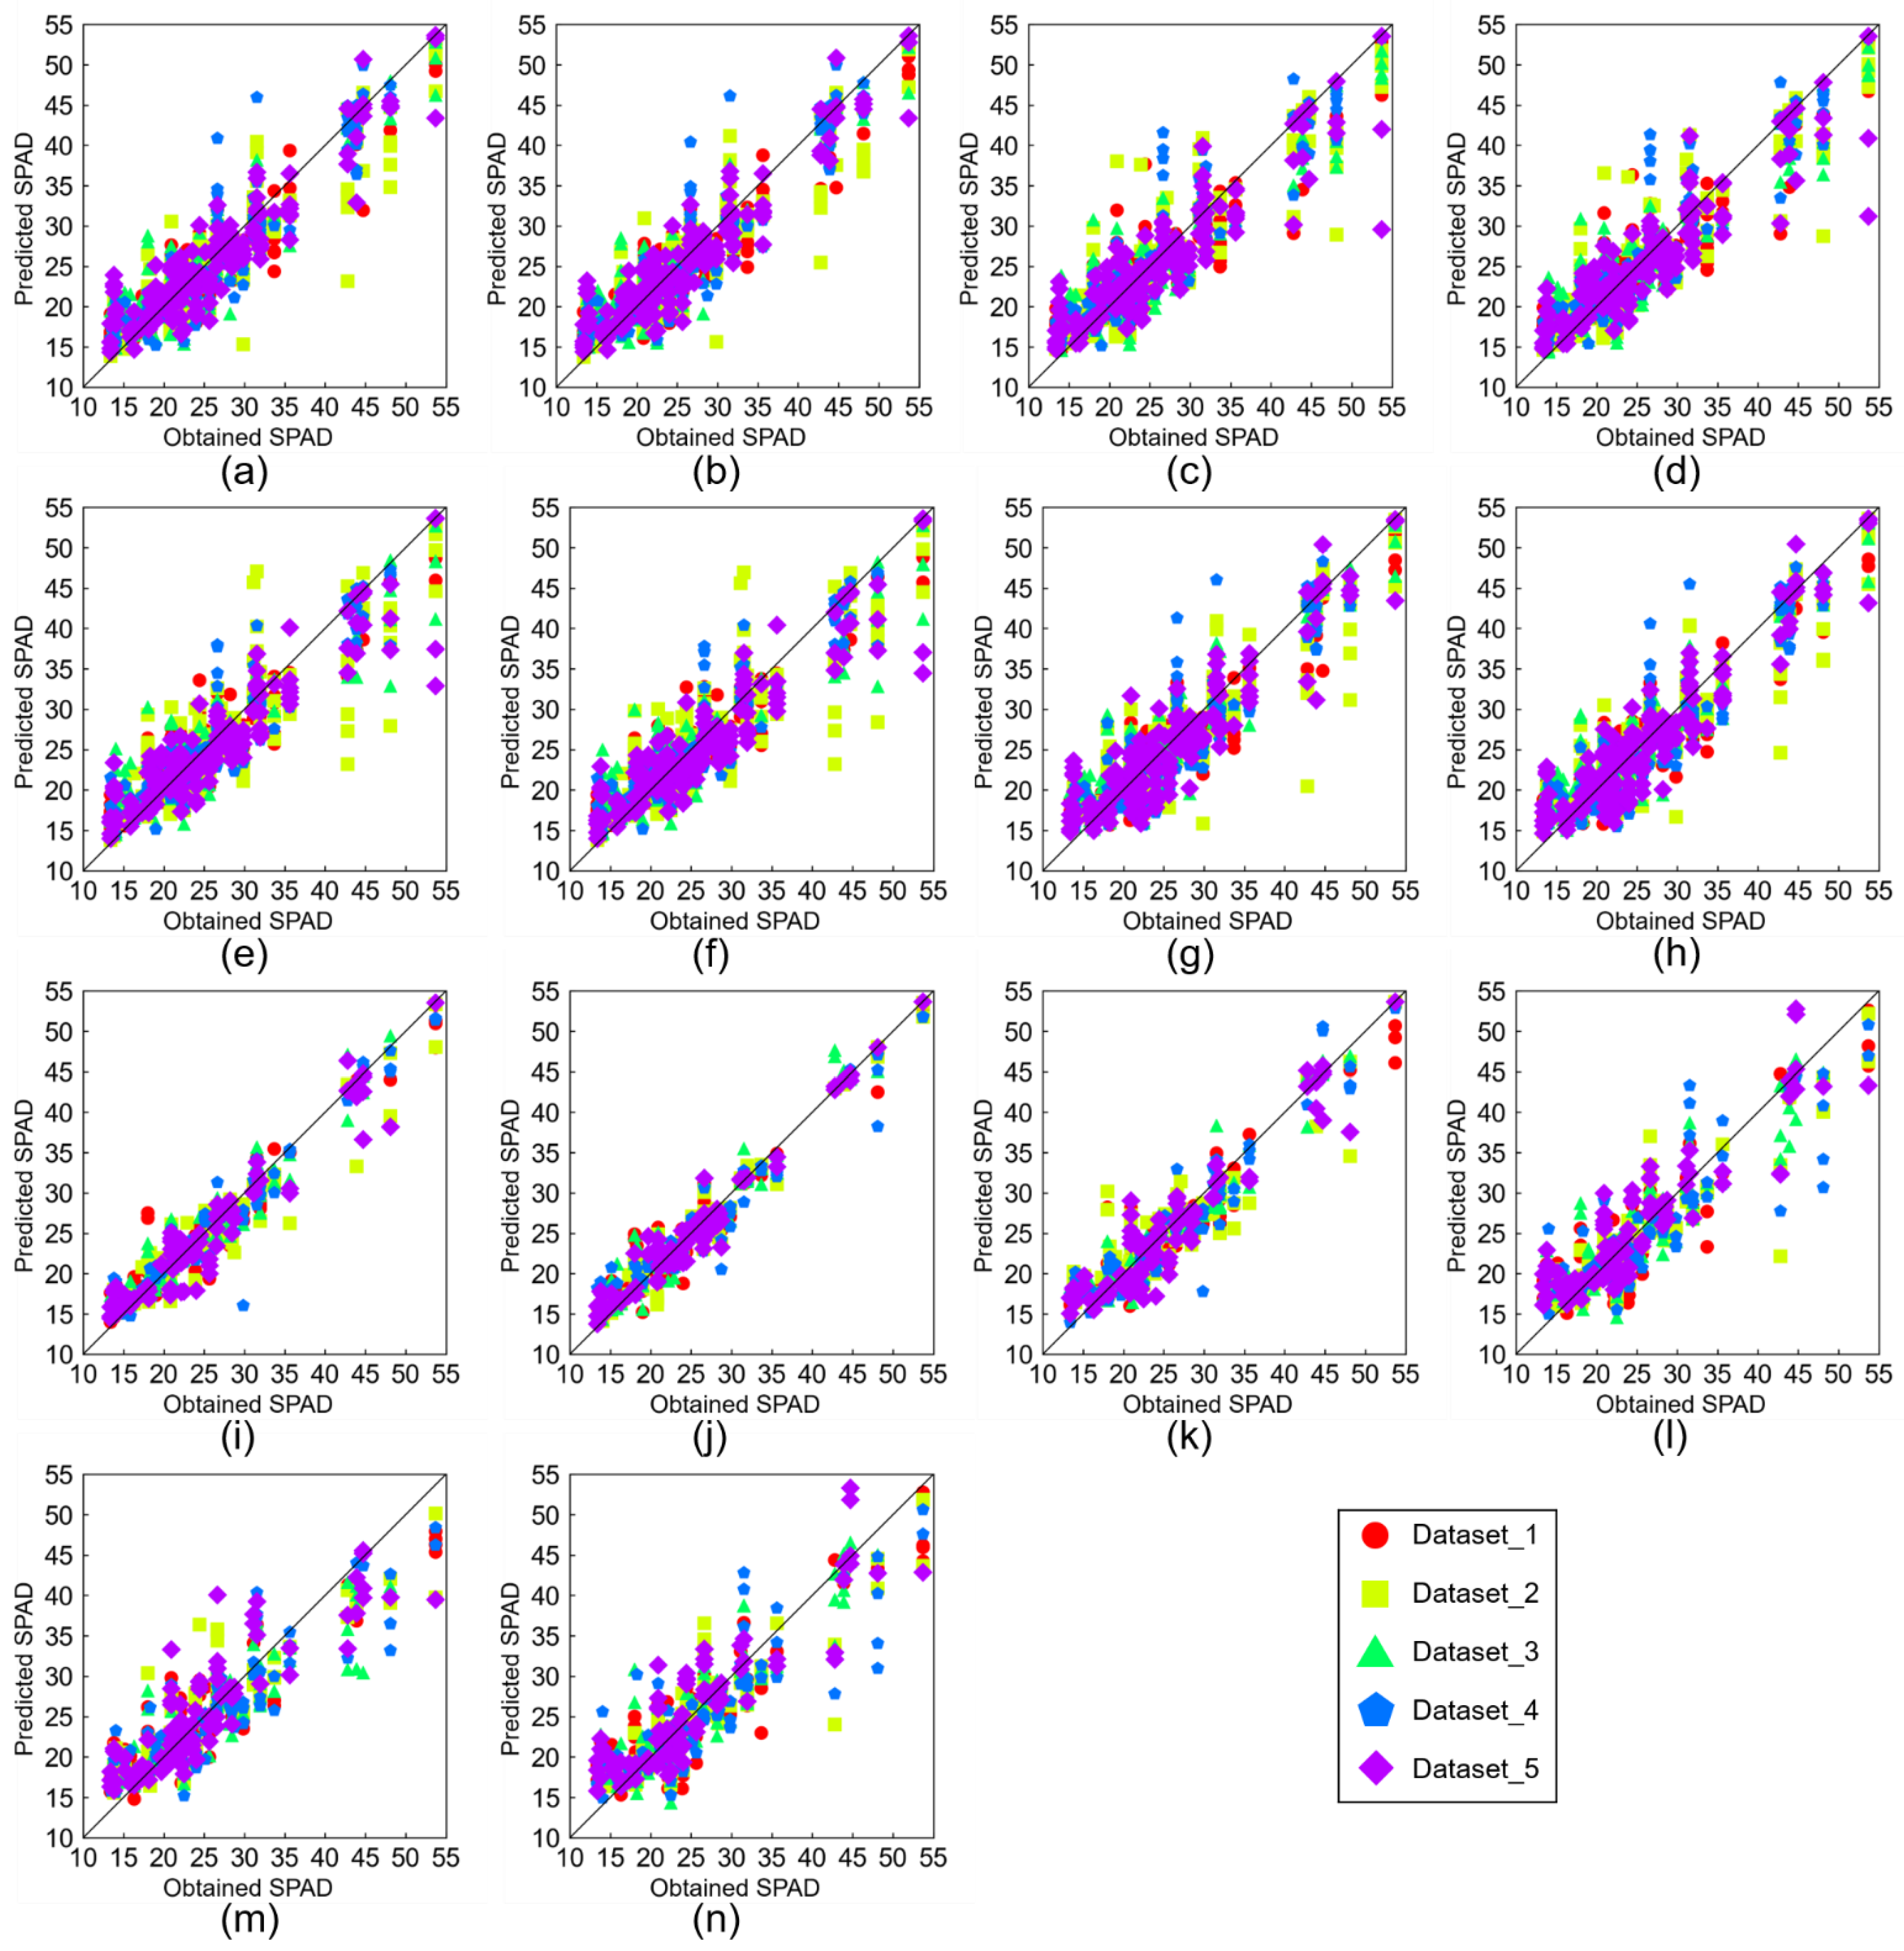
In this study, we employed Random Forests, XGBoost, and LightGBM algorithms to build data-driven models with 17 different sets of input variables to predict SPAD values based on environmental information (color temperature and illuminance) (
Figure 2). The 17 models consisted of eight models that used data collected under halogen and LED light sources (HAL+LED), three models that used data collected under a halogen light source only (HAL), three models that used data collected under a LED light source only (LED), and three models that used data collected under a LED light source based on illuminance information (LED_RES). The LED_RES condition is a condition where the indoor lighting environment has low light intensity compared to sunlight, and thus, it was set up to verify the applicability of the prediction models for the extrapolated conditions.
The input variables to Random Forests, XGBoost, and LightGBM were the color information and the light environment in which the image was captured. The color information is the minimum, mean, median, and maximum values of each color component in the RGB, HSL, and HSV color systems, and the values at the center of gravity of the leaf patch. Color information GB is a model that uses the minimum, mean, median, and maximum values of the G and B values in the RGB color system and the values at the center of gravity of the leaf patch. The reason for constructing a model that uses only GB values as input variables for color information is to exclude the R values for red light that can be absorbed by water molecules. The input variables for the lighting environment were the color temperature of the light source (LCT) and illuminance of the light source (ILL).
In this study, we implemented Random Forests computation using “Scikit-learn” [
25], XGBoost computation using “xgboost”, and LightGBM computation using “lightgbm” in Python. We used the default hyper-parameters of Random Forests, XGBoost, and LightGBM, except for random_state. In this study, a five-fold cross-validation was conducted by changing the random seed (i.e., random_state) 50 times to evaluate the variability of the model structure originating from the randomization process in the computation. Note that a five-fold cross-validation was not performed for LED_RES, because the training and validation data were divided according to the explicit objectives. The model performance was evaluated based on the Pearson’s correlation coefficient (COR), Nash–Sutcliffe coefficient (NSE) [
26], and root mean squared error (RMSE) between the observed SPAD values and model output values. COR evaluates the correlation between the observed and predicted SPAD values of the model (Equation (1)). NSE considers the balance between the sum of the squared errors and the variance of observed data (Equation (2)). RMSE evaluates the error between the predicted and observed SPAD values at the dimension of the observed SPAD value (Equation (3)).
where
and
are the observed and predicted SPAD values for the data point
,
is the mean observed SPAD value, and
N is the size of the dataset. Specifically, the NSE takes a value in the range
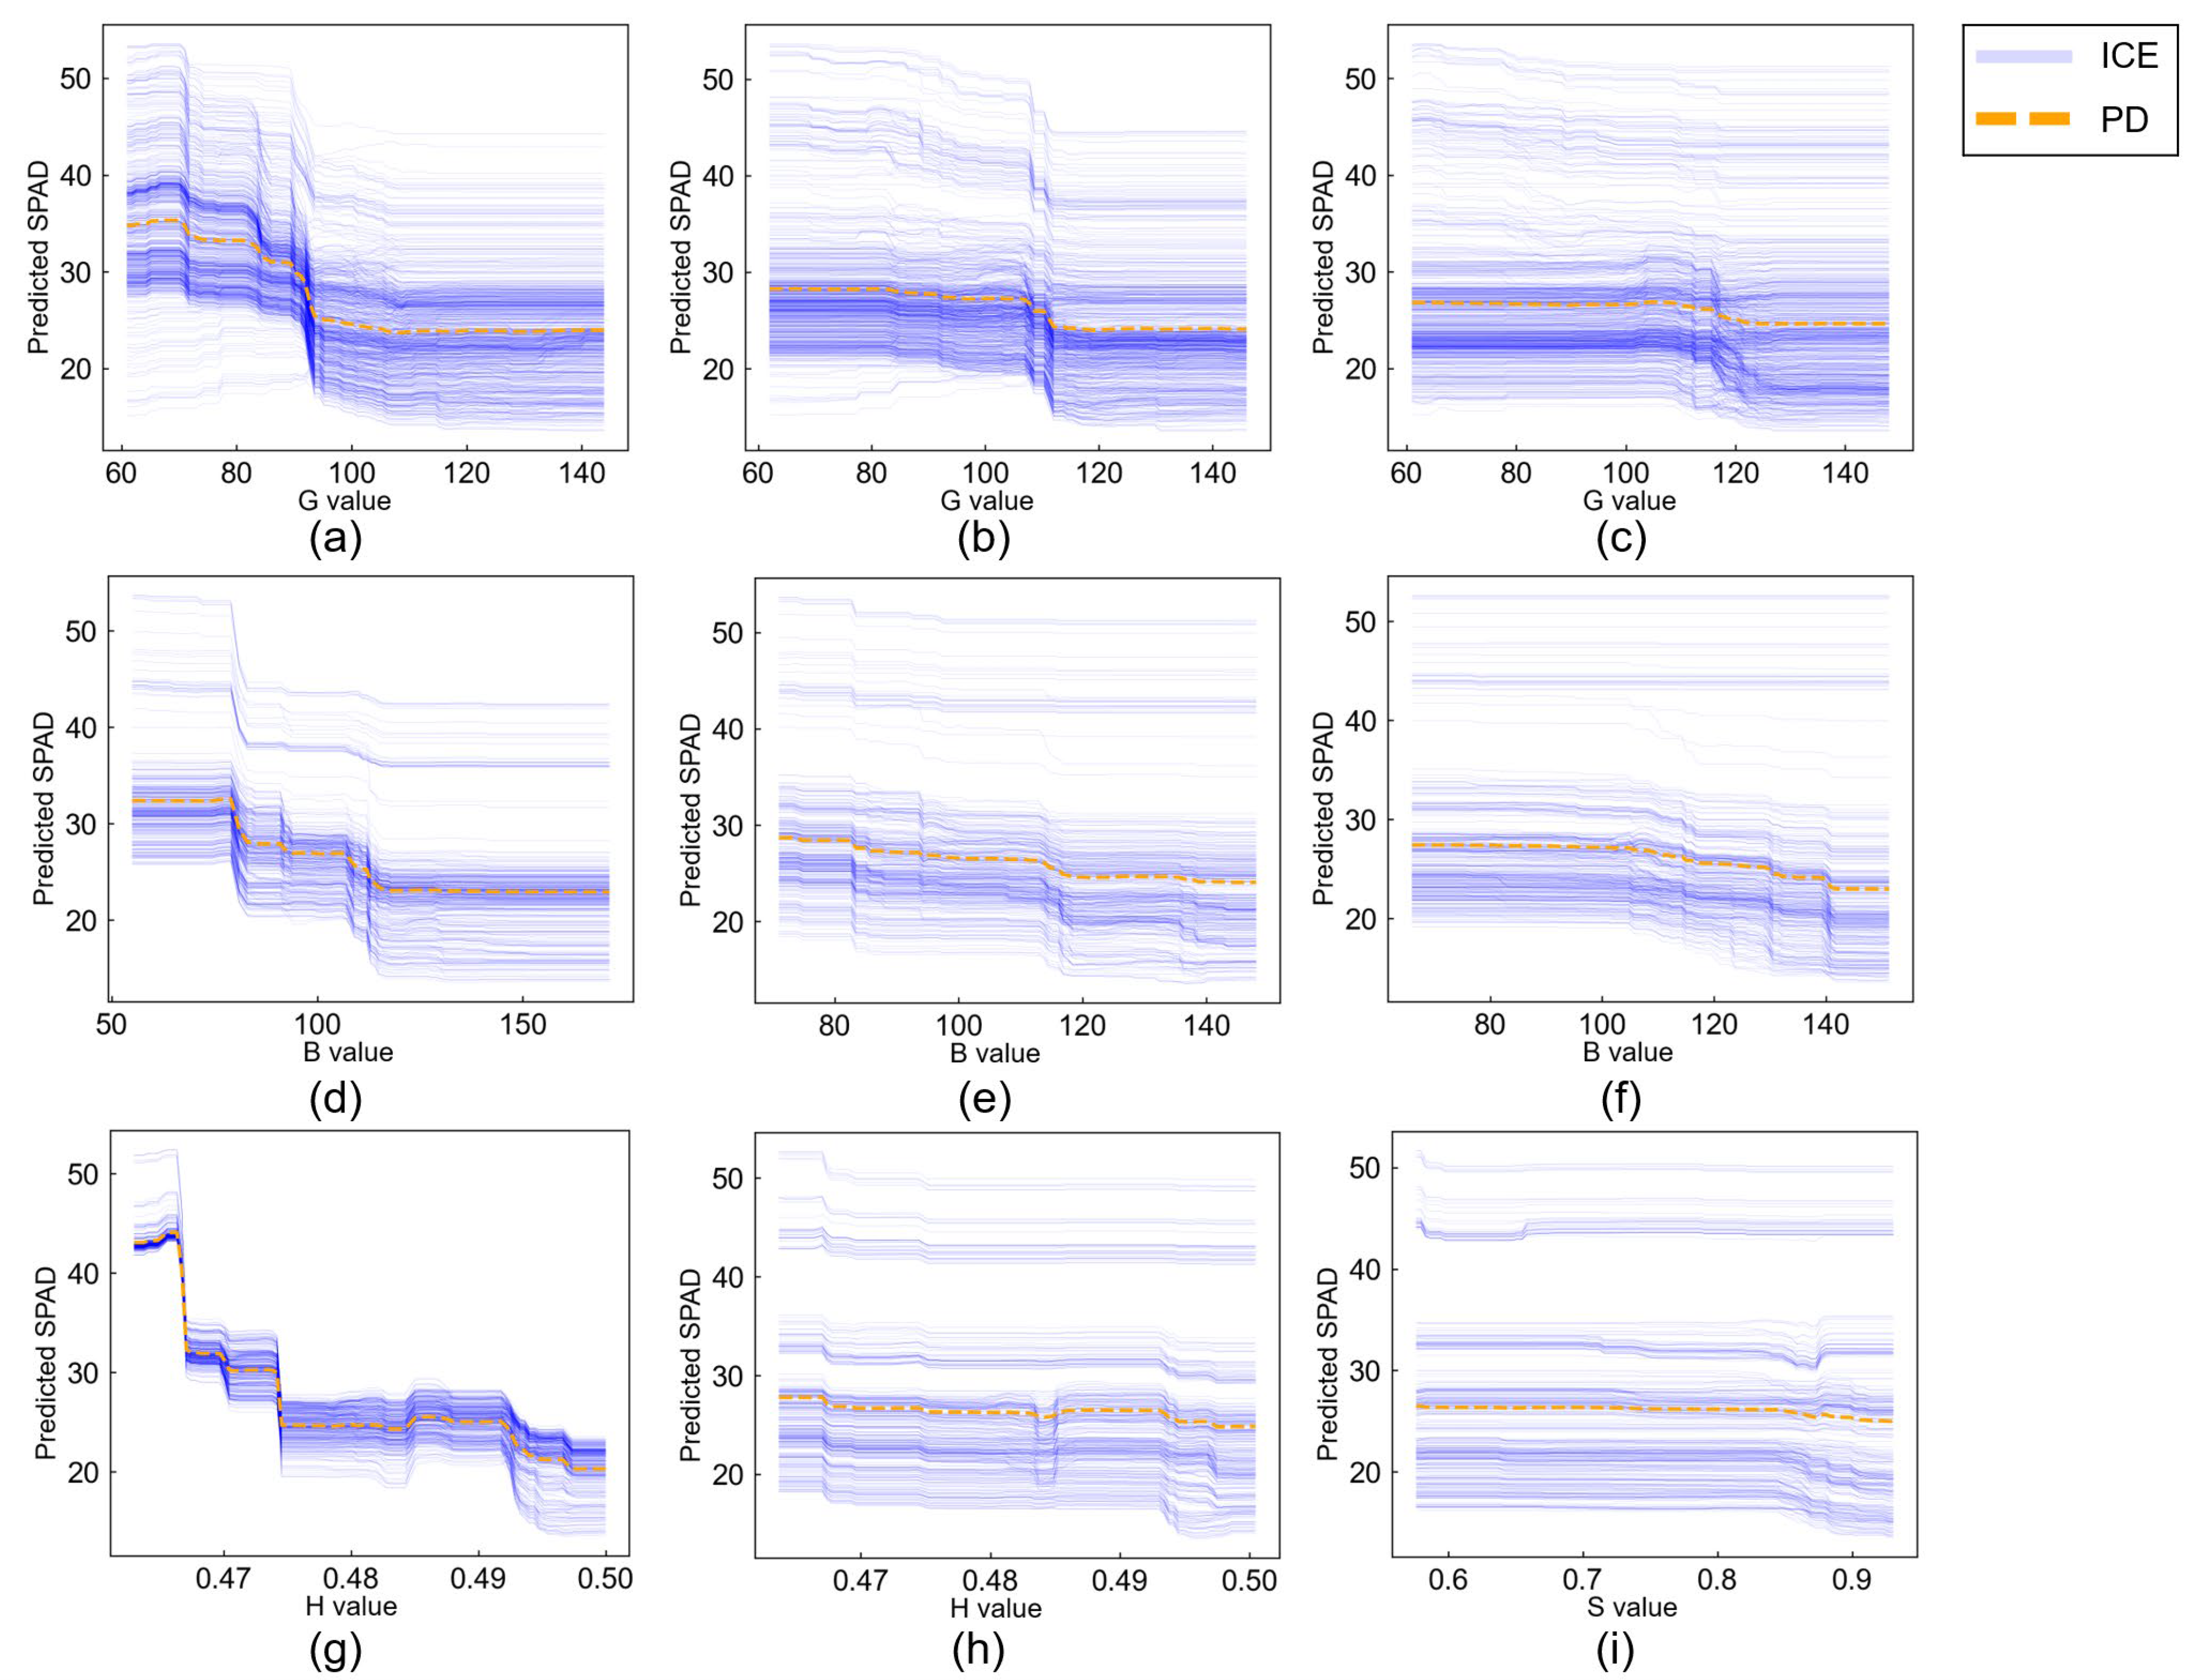
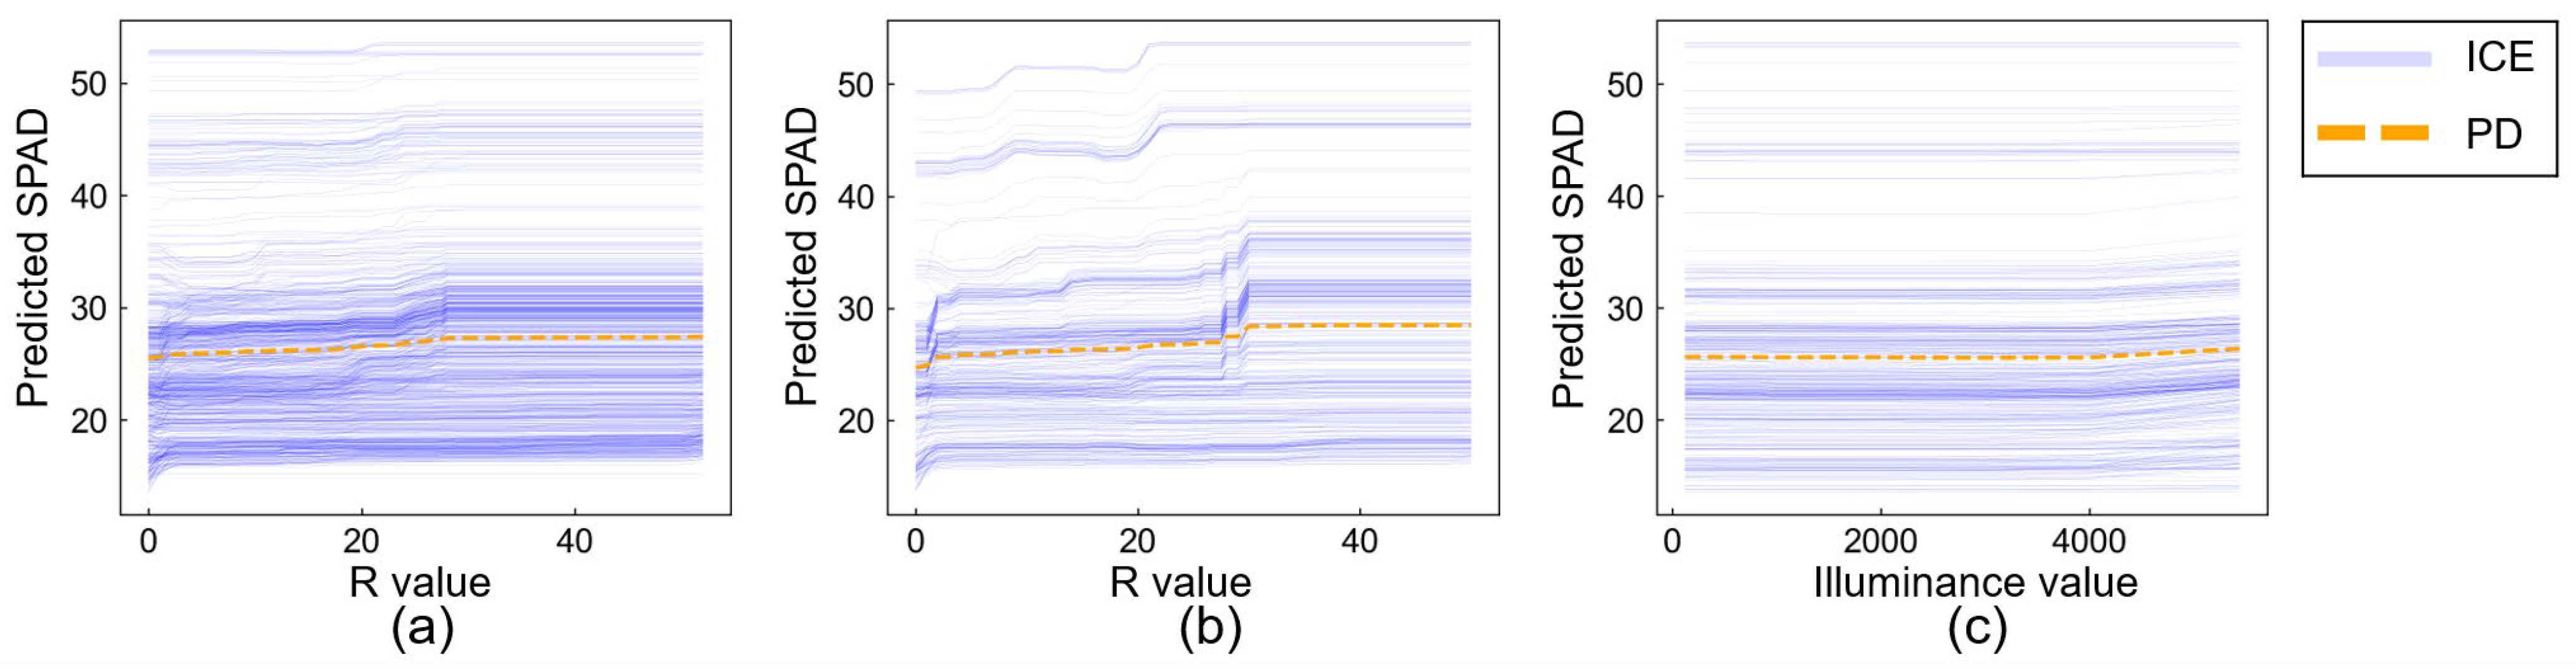
, of which a NSE value of 1 means a perfect fit. For interpreting the model of the best score in all three algorithms, SHapley Additive exPlanations (SHAP) [
27], Partial Dependence (PD), and Individual Conditional Expectation (ICE) were employed to visualize the model structures in this study. SHAP decomposes the difference between the predictions for a particular instance and the mean prediction into the contribution of each feature based on the Shapley value concept of cooperative game theory. However, it cannot explain “how the predictions react to changes in feature values”, and thus, PD and ICE were used together to compensate this part of the interpretability. While SHAP evaluates the importance of the input variables in SPAD value prediction, PD and ICE can be used to interpret how the data-driven SPAD value prediction model responds to a different light environment.
4. Discussion
In this study, it was found that the accuracy of SPAD value prediction was enhanced by using color information (e.g., RGB, HSL, and HSV) obtained from digital images and photographic environment information (color temperature and illuminance) as the model input. Previous studies have proposed methods to stabilize the light environment during photographic [
18] and color-corrected images using color charts as color standards [
28]. However, a method to stabilize the light environment at the time of photography can only predict SPAD values on an individual leaf basis, although it can provide a highly accurate SPAD value prediction. In addition, the color correction of an image is often difficult under certain conditions. In contrast, our method presented the potential of the sensor fusion of a color meter or an illuminance sensor for image-based SPAD value prediction that can be applied for a UAV [
7,
8,
29] or fixed camera [
30,
31] without limiting the photographic conditions.
No significant decrease in prediction accuracy was observed when the data obtained under both halogen and LED light sources were combined for training. However, the SPAD value prediction by the HAL model was less accurate than the LED model. This suggests that the color temperature affects the image-based SPAD value prediction using Random Forests. The result also suggests that SPAD values can be predicted even under non-white conditions, such as dusk, by collecting and learning data under different illuminance conditions in various light source environments. The high accuracy of the SPAD value prediction for the LED model suggests that the LED light source is a more suitable as a light source for image-based SPAD value prediction. However, if the object is in shadow, the SPAD value prediction may be difficult, or the error in the SPAD value prediction may be large. Therefore, it is necessary to consider a method that uses the ratio of shadows as a model input or a color correction method for acquired images when shadows exist on an object [
31,
32]. The SPAD value is used as an index for environmental control and as a guideline for harvests when producing crops. Although this study focused on radishes, the proposed experimental method can be applied to other crops as well. However, it is unclear whether the model performance can be higher for different varieties or crops other than radishes, as the leaf colors and SPAD values are different among cultivars. Therefore, a direct comparison cannot be examined, because the radish cultivar used in this study is unknown, as it was purchased at a supermarket. Thus, the application of this study to other cultivars and crops is a future challenge.
Following a previous study where [
8] reported the results of a similar analysis excluding the R value, which is a wavelength absorbed by water molecules, we conducted modeling using only GB values, excluding the R values in this study. As a result, the GB-based model also showed high accuracy, with a COR of 0.85 or higher. However, the GB-based model showed a lower model performance than the RGB-based models. This suggests that the GB-based models can exclude the effect of water molecules, but the R values may contain important factors for the SPAD value prediction.
The HSL value obtained under the LED light source, which produced models with the highest model performance in this study, is converted using RGB values. Therefore, the color component may be affected by water molecules in the leaves and may not be an appropriate color space when considering the effect of water molecules in the leaves. However, because the HSL color space and HSV color space can theoretically aggregate illuminance information into L [
13] or V, the HSL color system and the HSV color system are considered useful in environments with continuously changing lighting conditions. In contrast, in halogen lighting conditions, the color becomes closer to orange, and thus, it may be difficult to separate color and illumination information in the HSL color space or HSV color space, resulting in lower accuracy of the SPAD value prediction.
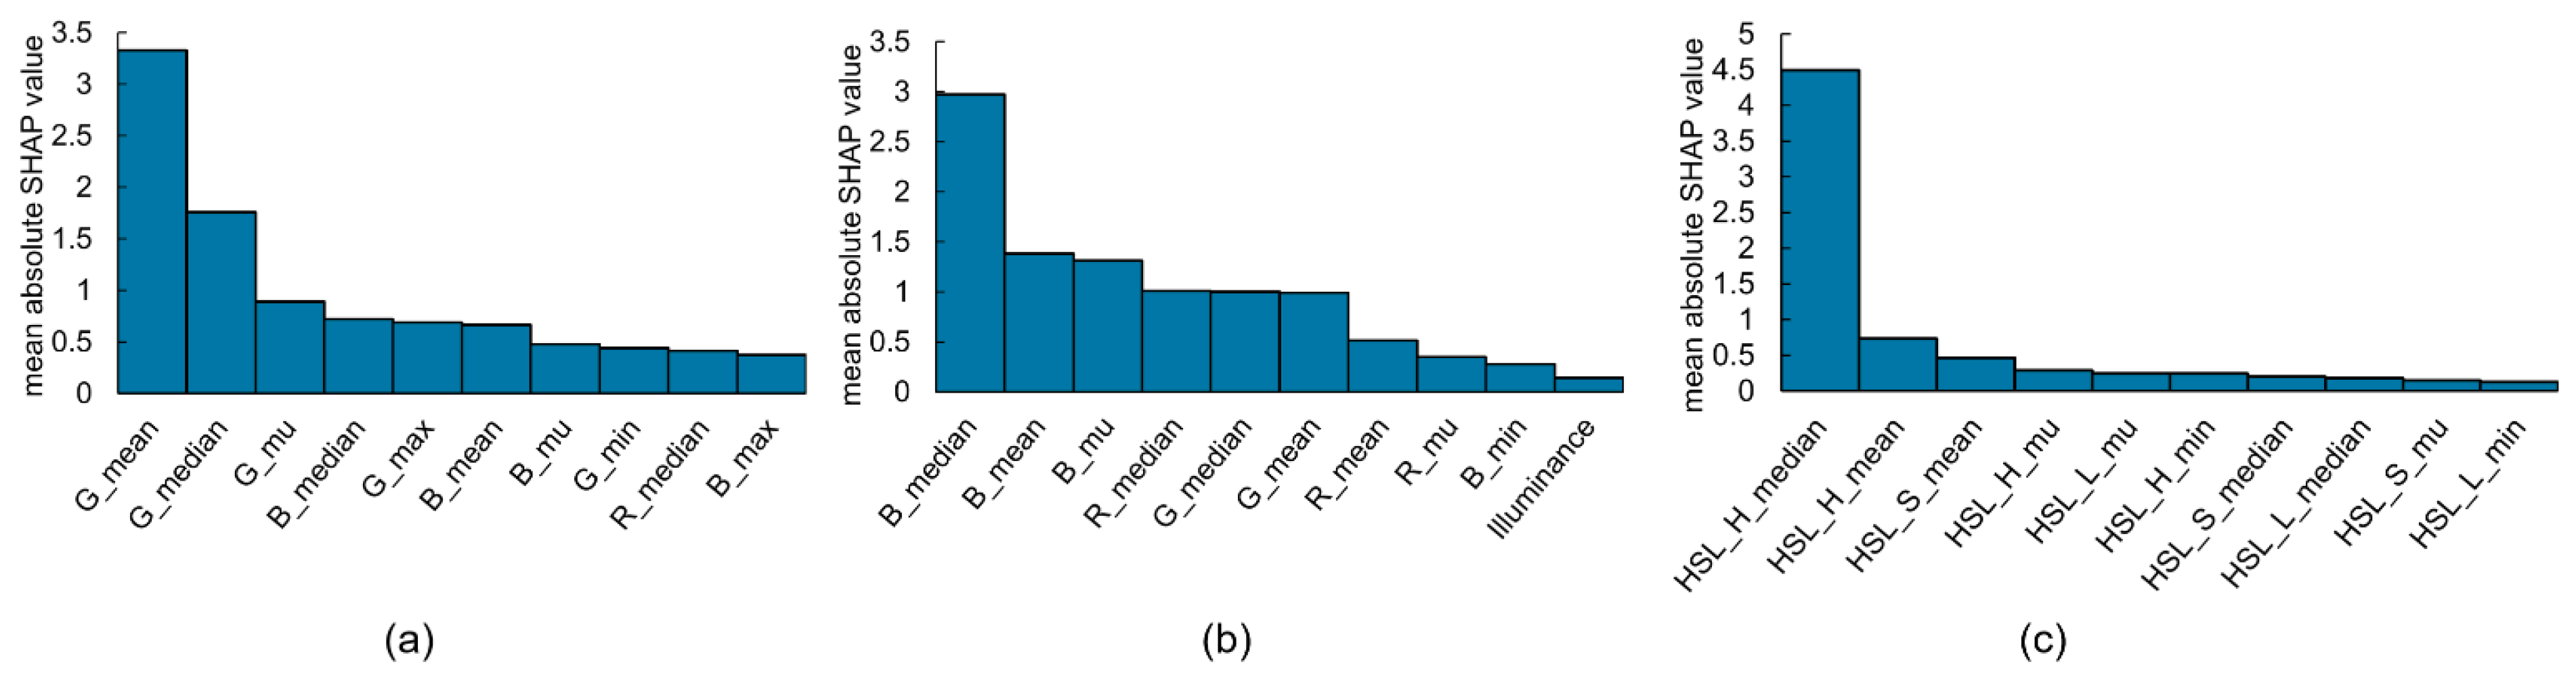
In the HAL+LED model (
Figure 5a), which was constructed from data under halogen and LED light sources, the G values were important, whereas the B values were important in the LED model (
Figure 5b). Previous studies have reported that the blue and green bands contribute significantly to SPAD value prediction [
19]. The importance of these variables in this study differed depending on the light source, implying that the important variables for SPAD value prediction vary depending on the light environment. Therefore, it is important to incorporate light environment information, such as the color temperature and illuminance of the light source, for image-based SPAD prediction.
Although this study was conducted in a closed indoor environment, there exists a wide range of fields where image-based SPAD value prediction can be conducted, ranging from fields [
28] to greenhouses [
30]. The results of this study can be used in environments where the leaf color can be obtained under a stable light source, as in previous studies [
18]. However, when images are acquired under unstable light environments, such as in the fields or in greenhouses, the accuracy of the SPAD value prediction becomes an issue. In addition, the maximum illuminance in this study was 5000 lx, whereas the outdoor environment was highly illuminant, ranging from 10,000 to 100,000 lx. Further study is therefore needed to collect observation data for building data-driven models specifically in outdoor environments for the proposed method to be applied to a variety of lighting conditions. Furthermore, although this study predicted the SPAD value using Random Forests, XGBoost, and LightGBM, the accuracy of SPAD value prediction may be improved by applying other algorithms, such as Deep Neural Networks. Furthermore, the accuracy changes depending on the compatibility between the input data and the algorithm. In this study, unlike the results of previous studies [
19], the Random Forests algorithm achieved the highest accuracy. Further studies on SPAD value prediction using novel algorithms on other datasets may illustrate how different algorithms perform well on datasets with different features and descriptive statistics.
5. Conclusions
This study was conducted to clarify the influence of the light environment on SPAD value prediction using Random Forests, XGBoost, and LightGBM under different light source environments. Leaf patches with a diameter of 1.5 cm were prepared using Japanese radishes (Raphanus sativus L. var. sativus) photographed under an established stable light environment and used for extracting variables for image-based SPAD value prediction. The variables obtained by the image analysis were the RGB values, which were pixel values, and the HSL and HSV values obtained by color space conversion from the RGB values. In addition, color temperature and illuminance, which were measured separately, were used as input variables. The results showed that, under a stable LED light source, the SPAD values could be predicted using Random Forests with high accuracy (COR 0.929 for RGB, color temperature, and illuminance as input variables; COR 0.922 for HSL, color temperature, and illuminance as input variables). It was also found that image-based SPAD value prediction was possible with relatively high accuracy, even under a halogen light source with a color temperature close to that of dusk (COR 0.895 for RGB and illuminance as the model input, and COR 0.876 for HSL and illuminance as the model input). The results suggest that SPAD values can be predicted under a wide range of lighting conditions, such as dusk, by training a data-driven model using data collected under different illuminance conditions in various light sources. Under LED light sources, the use of HSL values resulted in accurate SPAD value prediction by separating the illumination information into L (COR = 0.972, NSE = 0.944, and RMSE = 2.07). In addition, focusing on the H value, the H value tended to change from blue to green as the SPAD value increased. In this study, the SPAD value prediction was performed in a stable light environment in a closed indoor environment; therefore, the development of a method for outdoor conditions, where the light environment is spatiotemporally dynamic, is a future challenge.


