Abstract
Recognizing human actions can help in numerous ways, such as health monitoring, intelligent surveillance, virtual reality and human–computer interaction. A quick and accurate detection algorithm is required for daily real-time detection. This paper first proposes to generate a lightweight graph neural network by self-distillation for human action recognition tasks. The lightweight graph neural network was evaluated on the NTU-RGB+D dataset. The results demonstrate that, with competitive accuracy, the heavyweight graph neural network can be compressed by up to . Furthermore, the learned representations have denser clusters, estimated by the Davies–Bouldin index, the Dunn index and silhouette coefficients. The ideal input data and algorithm capacity are also discussed.
1. Introduction
Human activity recognition (HAR) is aimed at developing methodologies to recognize different actions from a sequence of observations. It has been widely used in many applications, such as health monitoring, intelligent surveillance, virtual reality and human–computer interaction. HAR can help detect a baby’s dangerous behaviors, detect crowd activities to prevent crowd crush and detect the actions of athletes to help the jury in sports competitions. It can also observe actions while playing virtual reality games in order to provide better feedback to users. Robots which interact with humans also need to recognize human actions.
Recently, graph neural networks (GNNs) have come into the spotlight to recognize human actions. GNNs regard human skeletons as graphs, which emphasize the topology of graph joints, and can protect personal information such as facial identities and home settings. The earliest milestone is spatial–temporal graph convolutional networks (ST-GCN) [1] (Figure 1). Thereafter, multiple works based on ST-GCN have been proposed. Among them, the two-stream adaptive graph convolutional network (2s-AGCN) [2] is another typical work which adopts attention mechanisms. As GNNs are specialized in discovering the intrinsic relations between joints, GNN-based HAR methods have achieved a new state-of-the-art (SOTA).

Figure 1.
The algorithm ST-GCN [1]. The blue dots represent human joints. The human skeleton at each frame is regarded as a graph.
In real-life, a popular real-time action recognition algorithm should be light enough so as to quickly recognize actions without decreasing accuracy severely. However, popular GNN models such as ST-GCN usually prefer more layers to guarantee the model capacity and thereafter the model performance, leading to heavyweight models. Heavyweight models are computationally expensive and memory intensive while real-time recognition needs lightweight models. Given a heavyweight model, algorithm compression is one practical way for generating a lightweight algorithm while preserving the performance.
There are many ways to compress neural networks (NNs). Among them, knowledge distillation (KD) is well-known [3] because the structure of the light algorithm that it can discover is more flexible. Self-distillation, a KD model, was proposed to train and compress heavy models simultaneously. It does not need to carefully redesign the architecture, but instead simply takes part of the heavy model as the light model. During training, the knowledge from the deeper layers is squeezed to guide the shallower layers in order to make them achieve a similar performance to the deeper layers. BYOT [4] is one well-known self-distillation model. It was first proposed for ResNet [5] to perform object detection. The authors argue that the lightweight ResNet by BYOT contributes to comparable accuracy compared with the heavyweight ResNet. They did not analyze BYOT’s capability for compressing GNNs thoroughly, nor did they analyze the extracted representations concretely. As far as we know, we are the first to use BYOT to generate a lightweight GNN backbone for HAR tasks. The heavyweight GNN backbone can be compressed by up to without losing much performance.
This paper is organized as follows: Section 2 gives a literature review on GNNs and self-distillation. Then, Section 3 demonstrates the methodology, leading to the following Section 4, which analyzes the performance of the proposed methods and the characteristics of learned representations, and Section 5, which provides the summary.
2. Previous Works
2.1. GNNs
Recently, there is an increasing interest in graph data [6,7]. Their applications include human action recognition, chemistry molecules [8], citation network [9], agriculture [10], production planning [11], etc. Graph data are non-Euclidean [12,13] and thus they do not satisfy the basic assumption that instances are independent. On the contrary, each node is related to others through various types of links. This dependency contributes to the intrinsic information. Moreover, transforming data to graphs can protect personal privacy. For example, human skeleton graphs remove human faces and surrounding environments in the captured videos, preventing the observed subjects from being identified.
Motivated by the requirement of mining graph data, GNNs were first introduced by Gori et al. [14] in 2005. Afterwards, inspired by convolutional neural networks (CNNs) and recurrent neural networks (RNNs), convolutional GNNs (ConvGNNs) and recurrent GNNs (RecGNNs) were developed gradually. ConvGNNs include spectral and spatial ConvGNNs. Spectral ConvGNNs adopt graph kernels to process input data in spectral space, while spatial ConvGNNs perform convolution on the k-order topological neighbors. Apart from them, alternatives such as graph autoencoders (GAEs) and spatio–temporal graph neural networks (STGNNs) have also emerged.
Considering the success of GNNs, if human skeletons are built as graphs, then any GNN proposal can be a possible candidate for skeleton graph-based HAR. GNNs used for HAR are classified as spatial-based approaches, spatio–temporal-based approaches and generated approaches [15]. This work is based on ST-GCN, a typical example of the spatio–temporal approach, which is very powerful for HAR.
2.2. Model Compression
There are mainly four categories in models that compress NNs, namely, parameter pruning and quantization, low-rank factorization, compact convolutional filters and knowledge distillation (KD) [3]. Parameter pruning and quantization tries to decrease redundant parameters or downgrade the data precision without losing model performance. Low-rank factorization extracts informative parameters by matrix decomposition. Compact convolutional filters reduce the size of parameters by redesigning special convolutional filters. KD teaches the light NNs (the student) with the knowledge “squeezed” from the heavy NNs (the teacher).
Among them, pruning is efficient but may hurt the performance or requires configuration of the sensitivities of the layers manually; low-rank factorization and compact convolutional filters demand prior knowledge, while KD does not need to change the structure severely and can achieve robust performance end-to-end [16].
Three schemes are preferred in distillation: offline distillation that requires a pretrained heavy model, online distillation and self-distillation [17] that can train heavy and light models simultaneously. Self-distillation has the advantage of training the same network architecture for the heavy and the light model at the same time, which makes it practical in applications.
3. Algorithm
3.1. Problem Definition
If the human skeleton of each frame is imagined as a graph, naturally, the nodes of the graph are skeleton joints and edges are the physical connections (bones) between joints. Then the graph size will be the number of skeleton joints, n. The graph is represented as , where the node set is the set of skeleton joints, featured by , and the edge set contains physical connections between nodes . One example of a skeleton graph is shown in Figure 1.
For further utilization, the graph G’s topology is represented as an adjacency matrix, , with each element denoting whether there is an edge between two nodes. Concretely,
where and .
Given the skeleton graph G, its adjacency matrix and node features , the light network after compression can be solved by
where the compressing model forces the size of the light model to be smaller than the size of the heavy model while maintaining the network performance.
3.2. Input Features
The most direct way for featuring the nodes of a skeleton graph at a specific frame t are 3D coordinates, represented as , where the numbers are three different coordinate axes, and c represents coordinates. These features are denoted as pos (position). To emphasize the importance of joint variations between frames, the movement features are defined as one frame displacement, , where t is the frame index. The movement features are denoted as mov.
3.3. ST-GCN Compression Based on Self-Distillation
3.3.1. ST-GCN Blocks
Actions are usually demonstrated by videos. The input skeleton graphs extracted from videos consist of both spatial and temporal information. ST-GCN is proposed to handle this information, with spatial graph convolution extracting along the human skeleton graph topology, and traditional convolution processing along the temporal dimension.
The spatial graph convolution is similar to the traditional convolution on images, because it updates the features of each node. For each pixel of an image, traditional convolution convolves its k-nearest pixels on the image grid, while spatial graph convolution defines the k-nearest neighbors along the graph topology. Specifically, the spatial graph convolution is defined as [1]
where is the input features, is the matrix of trainable weights and is the Laplacian matrix for renormalizing the new adjacency matrix . Concretely, is the identity matrix that represents the nodes themselves and are the adjacency matrices redefined by spatial partitioning. Specifically, records the centripetal joints and root joints and records the centrifugal joints. Examples of are shown in Figure 2. Spatial partitioning classifies joints and their k-neighbors into three groups with the allowance of applying different weights. The three groups are the node itself, the centrifugal group and the centripetal group (Figure 3).
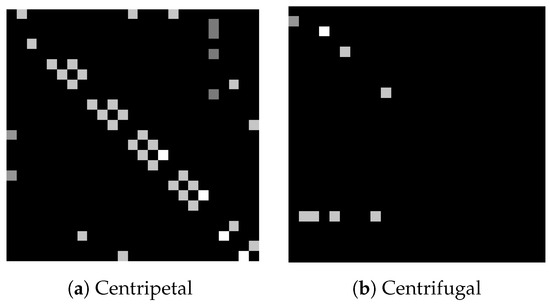
Figure 2.
The normalized adjacency matrices after spatial partition. Each row or column represents one pair of nodes. The centripetal matrix records the root nodes and their centripetal nodes, while the centrifugal matrix only records the centrifugal joints.
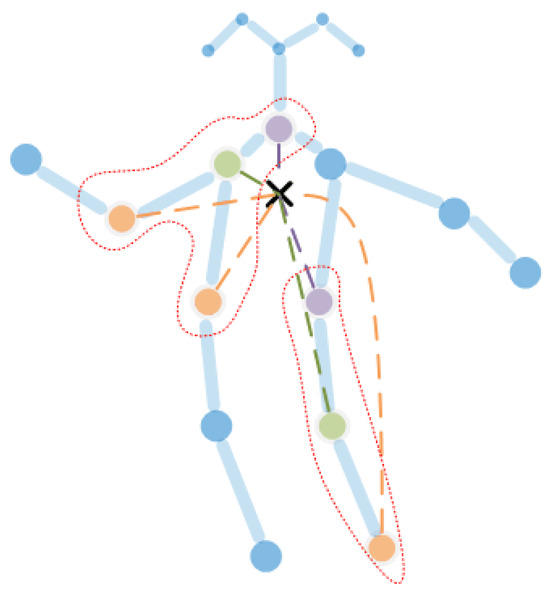
Figure 3.
The spatial partition to build new adjacency matrices. The black cross is the center of gravity of the whole skeleton, usually summarized as the average of all joints. The green nodes are the selected root joints and the purple nodes are centripetal nodes, while the orange nodes are centrifugal joints. The distance between the centripetal nodes and the center of gravity is shorter than the distance between the centrifugal nodes and the center of gravity.
The idea of spatial partitioning comes from [1]. The centripetal joints usually relate to different movements compared with the centrifugal joints, e.g., for the shoulder joint, its centripetal node (the neck) has smaller movements compared with the centrifugal joint (the elbow) while running.
The spatial graph convolution and convolution along the temporal dimension together build an ST-GCN unit, combining the process of spatial and temporal information together. The proposed ST-GCN in [1] has 9 units, and therefore 18 convolutional layers. Taking the input preprocess layer and the fully connected layer into consideration, it has 20 layers in total. Here they are divided into three blocks. Each block is marked as . The division of blocks is shown in Figure 4. By removing some units from each block, ST-GCN in 12 layers and ST-GCN in 8 layers (Figure 4b,c) are also built, denoted as ST-GCN 12 and ST-GCN 8 separately.

Figure 4.
The blocks division of each backbone. The green layers denoted by ‘Preprocess’ represent preprocessing such as batch normalization. The number denotes the dimensions of the output features from each block. The b1, b2, b3 indicate ST Blocks, and each layer (ST-GCN unit, marked by red, purple or blue) contains two units: graph spatial unit and temporal unit. Therefore, for ST-GCN 20, the number of layers in b1, b2, b3 are 18 layers in total, and counting the preprocessing layer and output fully connection (FC) layer, that would be 20 layers.
3.3.2. Self-Distillation Compression
If , any ST-GCN block can be defined as a light network compressed based on the heavy network . Based on this idea, the light compressed network is formed as
where N is the maximum index of blocks in , denotes the compressing model which forces to be close to the performance of the whole uncompressed model , s.t. denotes “subject to” and denotes block i.
The compressing model adopted here is BYOT; its framework is shown in Figure 5. The basic idea of BYOT is taking the knowledge from the deeper blocks and squeezing this knowledge to the shallower blocks; therefore, the shallower blocks will have similar performance to the deeper blocks. This idea is also named as self-distillation. The benefit of the self-distillation structure was confirmed in [4]. The authors showed that it can help convergence to flat minima, which improves generalization inherently and can prevent models from having the vanishing gradient problem. Here we first use it to compress skeleton graph-based HAR backbones.
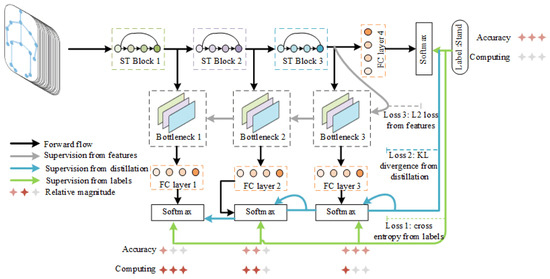
Figure 5.
The compression algorithm framework, drawn based on [4]. The ST Block is one block of the ST-GCN algorithm. There are three ST Blocks in total. The FC is the fully connection layer. The number of star-shaped symbols for computing denotes the relative magnitude of computing resources required.
Since is trained and distilled simultaneously, a supervised loss purely from labels is not sufficient to distill the knowledge from the deeper block to the shallower block. To deal with this requirement, the loss functions are built from three resources: labels to have supervision, the prediction just after the Softmax layer to limit the predicted distribution from each block and the features after each block to force feature similarity. The action labels capture the prior knowledge of actions; therefore, the cross entropy loss aims to approximate the predicted labels in order to make the predictions close to this prior knowledge. The predicted distributions from different blocks are expected to be similar, so their distances are measured by KL divergence and are forced to be small enough. Furthermore, the features from each blocks hold better performance if kept close together, and they are controlled by the norm. These losses are marked as and , respectively, with being the cross entropy loss from action labels under supervision, being the distribution loss and being the feature distance loss.
Given the labels , the input and the skeleton graph topology , the loss function L is:
where is the Softmax function and denote the blocks .
4. Experiments and Discussion
To evaluate the compression power of BYOT on ST-GCN, and the extracted feature quality, action classification is adopted to evaluate the HAR accuracy and feature clusters. The proposed method is tested on NTU-RGB+D [18], a dataset built in 2016 and captured by three Kinect V2 cameras. It contains 60 action classes and 56,880 video samples. RGB videos, depth map sequences, 3D skeletons and infrared (IR) videos for each sample are provided. Each skeleton has 25 body joints. The first 50 actions are performed by a single subject, while the last ten are interacted actions. Here, only the 3D skeletons are picked as the input.
The NTU dataset is divided into two datasets; one is NTU xsub, the other is NTU xview. The NTU xsub dataset evaluates cross-subjects, with 20 subjects as the training set and the remaining 20 subjects as the test set. The NTU xview dataset evaluates cross-views, with three views as the training set and the remaining two views as the test set. The NTU xview is easier to use than the NTU xsub for action recognition [15].
The evaluation was carried out on three backbones, which differed in the number of layers: ST-GCN 8, ST-GCN 12 and ST-GCN 20, respectively (Figure 4). Furthermore, the influence of input features is tested, which are divided as three types and noted as pos, mov and mov + pos for the skeleton coordinates, one frame displacements and both, respectively. The method of building these features is described in Section 3.2.
The performance is measured by top-1 accuracy,
where is the true positive, is the false positive, is the true negative and is the false negative.
Next, the main observations that can be drawn from the results are stated.
4.1. Accuracy
When the backbone capacity is proper, the self-distillation guarantees better performance compared with pure supervision. The evaluated accuracy on datasets NTU xview and NTU xsub are presented in Table 1 and Table 2, respectively. They demonstrate that the accuracies of the whole backbone ST-GCN 20 or ST-GCN 12 by self-distillation are better than the supervised results, while the ST-GCN 8 by self-distillation underperforms the supervised ST-GCN 8. One posssible explanation for the poor performance of ST-GCN 8 is that the self-distillation of a lower capacity backbone misleads the optimization to converge to a sub-optimal point [19]. When the capacities (layers) of backbones are diminished, the accuracy slightly decreases in ST-GCN 12 and extremely decreases in ST-GCN 8. However, the performance of ST-GCN 12 is still competitive compared with ST-GCN 20. Figure 6 gives an explicit impression between the accuracy from self-distillation and accuracy from supervision for each block (the previous tables only show the performance of the overall output). Notice that the supervised models are trained by exactly the same parameters as in the original ST-GCN 20 [1], except for the parallel computing strategy. This could explain the accuracies shown in our results released by the original supervised ST-GCN 20 (88.3 on NTU xsub, 81.5 on NTU xview).

Table 1.
The accuracy performed on NTU xview. ST 20 means ST-GCN with 20 layers; ST 12 and ST 8 follow similar explanations. The supervised models are noted with Sup. and only used labels for training.

Table 2.
The accuracy performed on NTU xsub. ST 20 means ST-GCN with 20 layers; ST 12 and ST 8 follow similar explanations. The supervised models are noted with Sup. and only used labels for training.
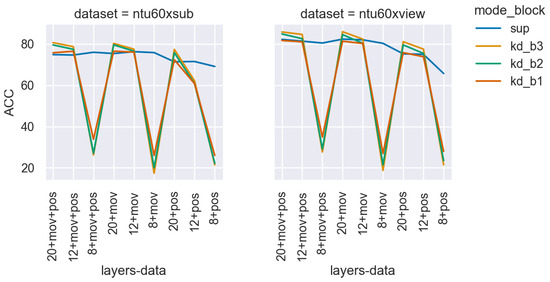
Figure 6.
The accuracy increments of different blocks in HAR task, where kd_b1, kd_b2 and kd_b3 are the result from different blocks after self-distillation; sup indicates the results by supervision. The integers on the x-axis denote the number of layers of ST-GCN, and the pos/mov/mov + pos indicate different input data.
When the capacity of the backbone is small, the accuracy from shallower blocks is better. As shown in Figure 6, at ST-GCN 20 or ST-GCN 12, the contributions from deeper blocks 2 or 3 are explicitly higher than for block 1, while in ST-GCN 8, the contributions from block 1 are higher than the other deeper blocks. One reason for this is that when the capacity of the model is large, it is more difficult to distill the knowledge and then back propagate it by gradient flow across blocks considering the possible gradient vanishing, while when the capacity is small these difficulties are alleviated.
The backbones trained with mov + pos data are usually the best. Table 1, Table 2 and Figure 6 all illustrate this. The pos data contains the 3D positions of each skeleton joint to record the spatial movements of each frame, while the mov data emphasizes the temporal movements amplitude for each skeleton joint at each frame. The mov data helps to fulfill some missing information (e.g., the differences between running and walking) and therefore leads to the best result generated by mov + pos.
4.2. Compression
The backbone size can be compressed by at least 50% at the second block, and by at least at the first block. The compressed backbones and uncompressed backbones follow a similar architecture. The compressed parameter percentage of each block is shown based on the corresponding whole heavy backbone in Figure 7. According to Figure 6, the accuracy by the second block of ST-GCN 12 is competitive compared with the whole ST-GCN 20. Since the rank of parameter size for each ST-GCN backbone is , if taking the second block of ST-GCN 12, the compressed percentage is compared with the whole ST-GCN 20, including the compression from decreasing backbone layers and decreasing the number of blocks.
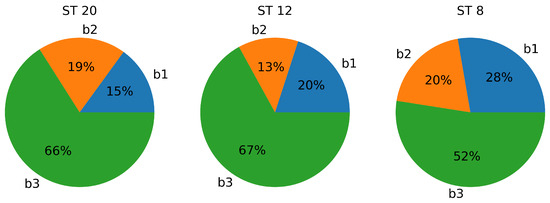
Figure 7.
The percentage of the parameter size for each block compared with the corresponding whole backbone, where b1, b2, b3 denote block 1, block 2 and block 3, and ST 20, ST 12, ST 8 represent ST-GCN 20, ST-GCN 12 and ST-GCN 8, respectively. The parameter sizes of b1, b2, b3 differ because of the varied output dimensions shown in Figure 4. The size of b1 includes the preprocessing layer, and the size of b3 includes the FC layer.
The real-time running time can be accelerated by up to at least 1.42× at the second block, and by at least 2.33× at the first block. The details are listed in Table 3.

Table 3.
The relative execution time for each sample compared with the block 3 of ST 20, which is the heaviest model. The ST 20, ST 12 and ST 8 denote ST-GCN 20, ST-GCN 12, and ST-GCN 8, respectively. Each sample has 300 frames.
4.3. Denser Representations
There are 60 actions in NTU, which are hard to plot together; therefore, 8 actions are chosen for plotting. The chosen actions are drinking water, reading, taking off a shoe, making a phone call/answering phone, taking a selfie, sneezing/coughing, staggering and falling. The first six actions are daily activities, while the last two are actions that may be related to abnormal activities.
To further evaluate the cluster qualities, three common cluster metrics are used to estimate their densities.
- Davies–Bouldin [20]: The good clusters should have low intra-cluster distance and high inter-cluster distance, and therefore a small Davies–Bouldin index. The metric is defined aswhere K is the number of clusters, is the centroid for the i-th cluster, is the average intra-class distance and is the distance between centroids . It assumes a spherical shape with similar sizes and densities for each cluster.
- Dunn index [21,22]: The clusters with a higher Dunn Index are more desirable. The formula iswhere is the inter-class distance between cluster and the distance between centroids and is the maximum distance between points in cluster . One issue for the Dunn Index is that if only one cluster is extremely stretched, while the other clusters are tightly packed, the Dunn index will be low because of the max in the denominator.
- Silhouette coefficients [23]: The clusters with a high silhouette value are considered well clustered. The silhouette coefficients ranges in . Its formula iswhere and . denote the number of points inside the clusters .
The geometric shape of the representation learned by self-distillation is estimated, and the differences of representations from different blocks are compared.
4.3.1. Geometric Shapes of Feature Representations
The representations learned by ST-GCN after self-distillation have more complex geometric shapes that are linearly separable. Different ways for projecting the extracted representations to 2D space were tried, namely principal components analysis (PCA) [24], t-distributed stochastic neighbor embedding (T-SNE) [25,26] and k-nearest-neighbor-graphs (k-NNG) [27] (Figure 8). PCA generates clusters with mixed classes. The projections by T-SNE and k-NNG are more impressive; actions with similar semantics such as drinking water and making a phone call are close, and vice versa. Because PCA tends to draw the clusters with linear separable features well, this demonstrates that the representations learned by ST-GCN have more complex geometric shapes.

Figure 8.
The (a) PCA; (b) T-SNE; (c) 20-Nearest Neighbor Graph projections for representations learned by self-distillation. The features come from ST-GCN 20 with pos as input data, performed on NTU xsub, captured from the first block.
4.3.2. Self-Distillation vs. Supervision
The representations learned by self-distillation are denser than representations trained under supervision. As shown in Figure 9, the cluster densities of representations by self-distillation are better than the representations under pure supervision. For ST-GCN 20 and ST-GCN 12, the Dunn index and silhouette coefficients of self-distillation are larger than the supervision, and the Davies–Bouldin index of self-distillation is smaller than the supervision. The training under supervision only adopts action labels to drive the predicted labels to be close to the ground truth labels, while the self-distillation also emphasizes the similarities between predicted distributions and feature distances. By limiting the predicted distributions to be close to the ground truth (well compacted clusters), each cluster’s density is limited. The forcing of close feature distances ensures that the learned representations are geometrically close to the ground truth.
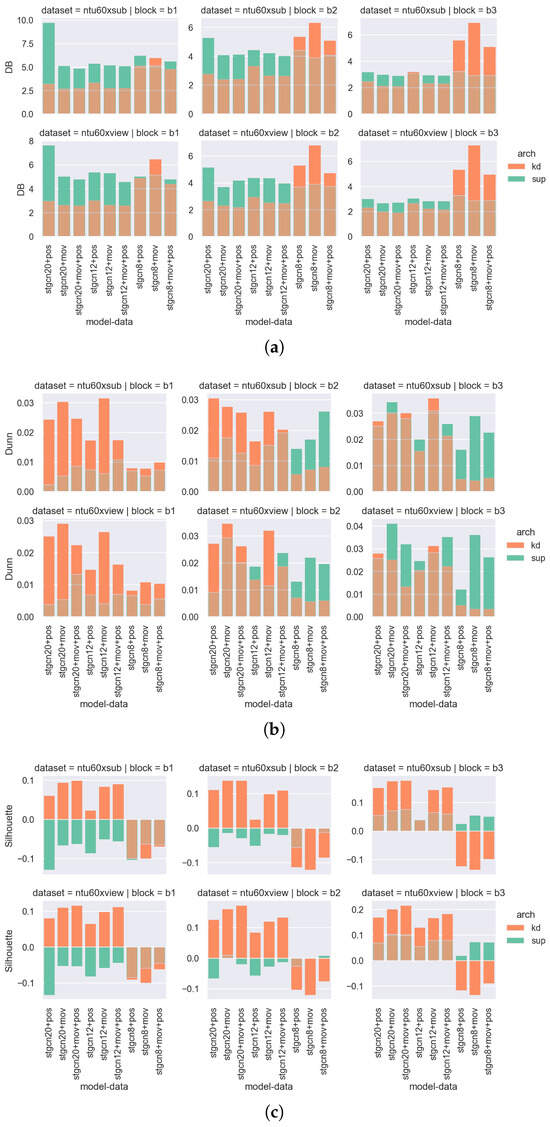
Figure 9.
The cluster densities of representations estimated by (a) Davies–Bouldin index, (b) Dunn index and (c) silhouette coefficients. The representations are trained by self-distillation or pure labels, which are labeled as kd, and sup in the legend, respectively. The brown color, which is not shown in the legend, is the overlapped region between kd and sup. For each subgraph, each row shows the densities on different datasets, and each column shows different blocks. The x-axis denotes trained backbones and input data. All instances are evaluated here.
4.3.3. Each Block’s Feature Representation
The deeper blocks generate denser clusters. When the blocks are deeper, the cluster densities (Figure 9) improve. This is illustrated by a smaller Davies–Bouldin index and larger Dunn Index and silhouette index. The features of eight actions from different blocks are also projected to visualize the density differences. In Figure 10, as the depth of the block deepens, the denser each cluster is, and the farther the cluster are from each other. This is reasonable considering the back propagation of training. The gradient flows are back propagated from the deeper blocks to the shallower blocks. The blocks that are close to the output layer are more nourished with informed gradients and therefore generated representations more similar to the true clusters. Furthermore, the shallower blocks first learn the coarse features, and gradually the fine features are learned by the deeper blocks.
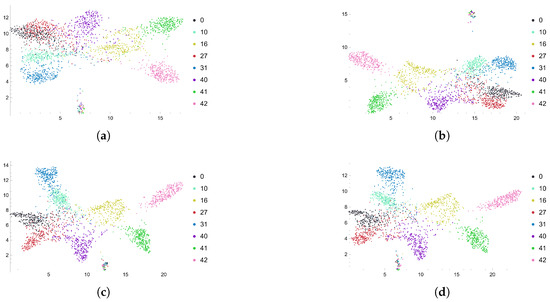
Figure 10.
The features from (a) the 1st block; (b) the 2nd block; (c) the 3rd block and (d) the overall output are projected by the 20-nearest-neighbor-graph. The features are trained by ST-GCN 20 with pos as input data, performed on NTU xsub. The overall output includes the features from the output of the whole backbone. From (a,b), the classes and 27 (marked as black, red and yellow) are more separated. From (b,c), the classes 0 and 27 are separated more clearly. From (c,d), the distance between actions 10 and 31 becomes larger.
Increasing the capacity of the model encourages the model to focus more on the detailed difference of each action. In the eight selected actions, staggering and falling are anomalies that vary from other actions, if taking the moving speed and moving amplitude into consideration. ST-GCN 20 and ST-GCN 12 can both classify each action, while ST-GCN 8 can divide staggering and falling from the other six actions, but fails to further divide the other actions clearly. As demonstrated in Figure 11, although the clusters of actions 0, 10, 16, 27, 31 and 40 are mixed together, actions 41 and 42 (falling and staggering) are already separated from the others.
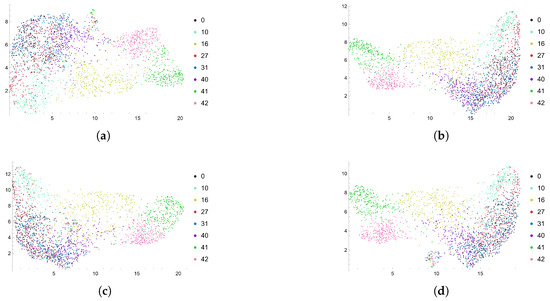
Figure 11.
The features from (a) the 1st block; (b) the 2nd block; (c) the 3rd block and (d) the overall output are projected by the 20-nearest-neighbor-graph. The features are trained by ST-GCN 8 with pos as input data, performed on NTU xsub. The overall output includes the features from the output of the whole backbone. Although many classes are mixed together, classes 41 (green) and 42 (pink) can be linearly separated. They are falling and staggering, which are anomalies compared with the other six daily actions.
When increasing the model capacity, the eight actions are classified more clearly. More layers contribute to more capability for the model to have enough parameters to record the difference of actions that differ slightly.
5. Discussion and Conclusions
This paper proposes the use of self-distillation (BYOT) for creating a lightweight HAR GCN model (ST-GCN). If taking the second block of ST-GCN 12 as the compressed result, compared with the heaviest backbone ST-GCN 20, the compression rate is . The features from the lightweight ST-GCN are denser than those for the ST-GCN trained with pure action labels, and the features from deeper blocks are denser than the features from shallower blocks.
In the future, work will be carried out to improve the proposed idea. Considering the generalization, the self-disllation (BYOT) will be tested on more action datasets [28] and more popular skeleton-graph-GNNs [2]. Furthermore, the current idea is limited by the cost of manual labelling. Trying to optimize the self-distillation under self-supervision will decrease the cost because it trains the backbone without action labels. Moreover, the compressed lightweight ST-GCN can be used on other applications, such as real-time anomaly detection.
Author Contributions
M.F. carried out the work and drafted the manuscript; J.M. supervised the work. All authors have read and agreed to the published version of the manuscript.
Funding
This research was funded by the China Scholarship Council (CSC) csc201903170208 and the Natural Sciences and Engineering Research Council of Canada (NSERC) RGPIN-2020-05095.
Data Availability Statement
The dataset NTU RGB+D was released by “NTU RGB+D: A Large Scale Dataset for 3D Human Activity Analysis”, which can be downloaded from https://rose1.ntu.edu.sg/dataset/actionRecognition/ and are accessible from 1 January 2017.
Conflicts of Interest
The authors declare no conflict of interest. The funding agency had no role in the design of the study; in the collection, analysis, or interpretation of data; in the writing of the manuscript; or in the decision to publish the results.
Abbreviations
The following abbreviations are used in this manuscript:
| GNNs | Graph Neural Networks |
| HAR | Human Action Recognition |
| BYOT | Be Your Own Teacher |
References
- Yan, S.; Xiong, Y.; Lin, D. Spatial temporal graph convolutional networks for skeleton-based action recognition. In Proceedings of the AAAI Conference on Artificial Intelligence, New Orleans, LO, USA, 2–7 February 2018; Volume 32. [Google Scholar]
- Shi, L.; Zhang, Y.; Cheng, J.; Lu, H. Two-stream adaptive graph convolutional networks for skeleton-based action recognition. In Proceedings of the IEEE/CVF Conference on Computer Vision and Pattern Recognition, Long Beach, CA, USA, 15–20 June 2019; pp. 12026–12035. [Google Scholar]
- Cheng, Y.; Wang, D.; Zhou, P.; Zhang, T. A Survey of Model Compression and Acceleration for Deep Neural Networks. arXiv 2020, arXiv:1710.09282. [Google Scholar]
- Zhang, L.; Song, J.; Gao, A.; Chen, J.; Bao, C.; Ma, K. Be Your Own Teacher: Improve the Performance of Convolutional Neural Networks via Self Distillation. arXiv 2019, arXiv:1905.08094. [Google Scholar]
- He, K.; Zhang, X.; Ren, S.; Sun, J. Deep Residual Learning for Image Recognition. arXiv 2015, arXiv:1512.03385. [Google Scholar]
- Veličković, P. Everything is connected: Graph neural networks. Curr. Opin. Struct. Biol. 2023, 79, 102538. [Google Scholar] [CrossRef] [PubMed]
- Wang, X.; Xu, H.; Wang, X.; Xu, X.; Wang, Z. A Graph Neural Network and Pointer Network-Based Approach for QoS-Aware Service Composition. IEEE Trans. Serv. Comput. 2023, 16, 1589–1603. [Google Scholar] [CrossRef]
- Zhang, Y.; Hu, Y.; Han, N.; Yang, A.; Liu, X.; Cai, H. A survey of drug-target interaction and affinity prediction methods via graph neural networks. Comput. Biol. Med. 2023, 163, 107136. [Google Scholar] [CrossRef] [PubMed]
- Zhao, Q.; Feng, X. Utilizing citation network structure to predict paper citation counts: A Deep learning approach. J. Inf. 2022, 16, 101235. [Google Scholar] [CrossRef]
- Bukumira, M.; Antonijevic, M.; Jovanovic, D.; Zivkovic, M.; Mladenovic, D.; Kunjadic, G. Carrot grading system using computer vision feature parameters and a cascaded graph convolutional neural network. J. Electron. Imaging 2022, 31, 061815. [Google Scholar] [CrossRef]
- Hameed, M.S.A.; Schwung, A. Graph neural networks-based scheduler for production planning problems using reinforcement learning. J. Manuf. Syst. 2023, 69, 91–102. [Google Scholar] [CrossRef]
- Hamilton, W.L. Graph representation learning. Synth. Lect. Artifical Intell. Mach. Learn. 2020, 14, 1–159. [Google Scholar]
- Bruna, J.; Zaremba, W.; Szlam, A.; LeCun, Y. Spectral networks and locally connected networks on graphs. arXiv 2013, arXiv:1312.6203. [Google Scholar]
- Gori, M.; Monfardini, G.; Scarselli, F. A new model for learning in graph domains. In Proceedings of the 2005 IEEE International Joint Conference on Neural Networks, Montreal, QC, Canada, 31 July–4 August 2005; IEEE: Piscataway, NJ, USA, 2005; Volume 2, pp. 729–734. [Google Scholar]
- Feng, M.; Meunier, J. Skeleton Graph-Neural-Network-Based Human Action Recognition: A Survey. Sensors 2022, 22, 2091. [Google Scholar] [CrossRef] [PubMed]
- Li, Z.; Li, H.; Meng, L. Model Compression for Deep Neural Networks: A Survey. Computers 2023, 12, 60. [Google Scholar] [CrossRef]
- Gou, J.; Yu, B.; Maybank, S.J.; Tao, D. Knowledge distillation: A survey. Int. J. Comput. Vis. 2021, 129, 1789–1819. [Google Scholar] [CrossRef]
- Shahroudy, A.; Liu, J.; Ng, T.T.; Wang, G. Ntu rgb+ d: A large scale dataset for 3d human activity analysis. In Proceedings of the IEEE Conference on Computer Vision and Pattern Recognition, Las Vegas, NV, USA, 27–30 June 2016; pp. 1010–1019. [Google Scholar]
- Stanton, S.; Izmailov, P.; Kirichenko, P.; Alemi, A.A.; Wilson, A.G. Does knowledge distillation really work? Adv. Neural Inf. Process. Syst. 2021, 34, 6906–6919. [Google Scholar]
- Davies, D.L.; Bouldin, D.W. A Cluster Separation Measure. IEEE Trans. Pattern Anal. Mach. Intell. 1979, PAMI-1, 224–227. [Google Scholar] [CrossRef]
- Dunn, J.C. A Fuzzy Relative of the ISODATA Process and Its Use in Detecting Compact Well-Separated Clusters. J. Cybern. 1973, 3, 32–57. [Google Scholar] [CrossRef]
- Dunn†, J.C. Well-Separated Clusters and Optimal Fuzzy Partitions. J. Cybern. 1974, 4, 95–104. [Google Scholar] [CrossRef]
- Rousseeuw, P.J. Silhouettes: A graphical aid to the interpretation and validation of cluster analysis. J. Comput. Appl. Math. 1987, 20, 53–65. [Google Scholar] [CrossRef]
- Jolliffe, I.T.; Cadima, J. Principal component analysis: A review and recent developments. Philos. Trans. R. Soc. A Math. Phys. Eng. Sci. 2016, 374, 20150202. [Google Scholar] [CrossRef]
- Hinton, G.E.; Roweis, S. Stochastic neighbor embedding. Adv. Neural Inf. Process. Syst. 2002, 15, 833–840. [Google Scholar]
- Van der Maaten, L.; Hinton, G. Visualizing data using t-SNE. J. Mach. Learn. Res. 2008, 9, 2579–2605. [Google Scholar]
- Preparata, F.P.; Shamos, M.I. Computational Geometry: An Introduction; Springer Science & Business Media: Berlin/Heidelberg, Germany, 2012. [Google Scholar]
- Kay, W.; Carreira, J.; Simonyan, K.; Zhang, B.; Hillier, C.; Vijayanarasimhan, S.; Viola, F.; Green, T.; Back, T.; Natsev, P.; et al. The kinetics human action video dataset. arXiv 2017, arXiv:1705.06950. [Google Scholar]
Disclaimer/Publisher’s Note: The statements, opinions and data contained in all publications are solely those of the individual author(s) and contributor(s) and not of MDPI and/or the editor(s). MDPI and/or the editor(s) disclaim responsibility for any injury to people or property resulting from any ideas, methods, instructions or products referred to in the content. |
© 2023 by the authors. Licensee MDPI, Basel, Switzerland. This article is an open access article distributed under the terms and conditions of the Creative Commons Attribution (CC BY) license (https://creativecommons.org/licenses/by/4.0/).