Article

A Novel Machine-Learning Approach to Predict Stress-Responsive Genes in Arabidopsis

1
Crop and Horticultural Science Research Department, Fars Agricultural and Natural Resources Research and Education Center, Agricultural Research, Education and Extension Organization (AREEO), Shiraz 71558-63511, Iran
2
Agricultural Research, Education and Extension Organization (AREEO), Seed and Plant Improvement Institute, Karaj 31359-33151, Iran
3
Department of Biosystems Engineering, University of Manitoba, Winnipeg, MB R3T 5V6, Canada
*
Authors to whom correspondence should be addressed.
Algorithms 2023, 16(9), 407; https://doi.org/10.3390/a16090407
Submission received: 17 July 2023 / Revised: 21 August 2023 / Accepted: 24 August 2023 / Published: 27 August 2023
(This article belongs to the Special Issue Machine Learning Algorithms in Natural Science)

Abstract

:
This study proposes a hybrid gene selection method to identify and predict key genes in Arabidopsis associated with various stresses (including salt, heat, cold, high-light, and flagellin), aiming to enhance crop tolerance. An open-source microarray dataset (GSE41935) comprising 207 samples and 30,380 genes was analyzed using several machine learning tools including the synthetic minority oversampling technique (SMOTE), information gain (IG), ReliefF, and least absolute shrinkage and selection operator (LASSO), along with various classifiers (BayesNet, logistic, multilayer perceptron, sequential minimal optimization (SMO), and random forest). We identified 439 differentially expressed genes (DEGs), of which only three were down-regulated (AT3G20810, AT1G31680, and AT1G30250). The performance of the top 20 genes selected by IG and ReliefF was evaluated using the classifiers mentioned above to classify stressed versus non-stressed samples. The random forest algorithm outperformed other algorithms with an accuracy of 97.91% and 98.51% for IG and ReliefF, respectively. Additionally, 42 genes were identified from all 30,380 genes using LASSO regression. The top 20 genes for each feature selection were analyzed to determine three common genes (AT5G44050, AT2G47180, and AT1G70700), which formed a three-gene signature. The efficiency of these three genes was evaluated using random forest and XGBoost algorithms. Further validation was performed using an independent RNA_seq dataset and random forest. These gene signatures can be exploited in plant breeding to improve stress tolerance in a variety of crops.

1. Introduction

The yield and nutritional quality of a crop are impacted by the different stresses experienced by plants during growth. Such stresses can be broadly classified into two groups, biotic and environmental (abiotic) [1]. Plants usually respond to stress through complicated molecular mechanisms, such as changes in the transcriptome and regulatory networks [2]. In severe cases, irreversible damage and plant death could be observed if the stress exceeds the plant’s tolerance threshold [2]. These threshold limits are encoded in and determined by the plant’s genetic makeup.
Advances in high-throughput gene expression technologies, such as microarray platforms, have offered a new pathway for the identification of key genes involved in plant responses to specific stress conditions [3]. Considering plants are capable of activating stress-specific and general stress response networks to adapt to various stressors [2], identifying genes that play a general role in stress response can facilitate the development of stress-tolerant cultivars through genetic engineering [4].
Stress factors such as water/nutrient deficiencies/excesses, sub-optimal environmental conditions, pathogens, and so on in plants may elicit a gene expression pattern [5]. To improve plant adaptability to changing environments, it is critical to understand the underlying mechanisms for stress responses in plants. While a large amount of gene expression information is now available via public databases, merging data from independent transcriptome analysis (meta-analysis) remains challenging because of differences in experimental procedures and analysis methods [6].
Building on this, researchers such as [7] generated a large dataset of gene expression profiles in Arabidopsis thaliana subjected to various stresses (including salt, temperature, high-light (HL), and flagellin (FLG)). The authors investigated transcriptional regulatory networks during single and combined stresses, such as weighted gene co-expression network analysis (WGCNA), transcription factors (TFs), TF binding motifs and sequence logos, and network component analysis (NCA). However, the gene signature responsible for plant stress tolerance was not explicitly investigated.
Adding another dimension, several studies have elucidated transcriptome changes in response to isolated biotic and abiotic stresses [8,9,10]. Rasmussen et al. [9] especially highlighted a significant point: transcriptome responses to a singular stress could not always predict the alterations in relation to combined stresses. This is a crucial revelation because plants in the field frequently encounter multiple stresses concurrently. Identifying genes responsive to these combined stresses is thus paramount. Yet, there is a complication as obtaining such gene expression data experimentally is both labor-intensive and costly. This is where machine learning (ML) offers a beacon of hope, emerging as a formidable tool for biomarker discovery. Not only does it streamline the process, but it also uncovers gene relationships that traditional methods might overlook.
Considering that such knowledge could contribute to gene analysis and the development of stress-tolerant plants, the present study proposes applying ML algorithms to the gene expression data [7] generated in Arabidopsis thaliana. We aim to use state-of-the-art ML approaches, including feature selection techniques, to identify the genes or gene clusters responsible for stress tolerance.
Feature selection algorithms in ML have previously been used to find optimum features and generate gene signatures [11]. Some of the well-known feature selection techniques include information gain (IG), ReliefF, and least absolute shrinkage and selection operator (LASSO) [12,13]. Du et al. [14] successfully applied LASSO methods to gene co-expression networks to identify key genes associated with salt stress in rice. Information gain and ReliefF have also performed well in identifying feature dependencies [15,16].
To further advance the understanding of stress tolerance in crops, the present work undertakes a comprehensive analysis of the Arabidopsis crop model. By employing novel hybrid gene selection methods such as IG, ReliefF, and LASSO, this study plans to identify key genes responsible for various stress responses in Arabidopsis. This comparative evaluation of different gene selection methods and classifiers explores the discovery of key genetic signatures that can serve as robust biomarkers for stress tolerance. The synergy between different feature selection methods aims to facilitate the identification of common genes, offering valuable genetic insight into the physiological responses of plants under stress. The outcomes of this research are expected to provide valuable guidance for breeding and pre-breeding programs, enhancing the resilience of crop plants to diverse environmental stresses. Moreover, the innovative methodology employed in this study introduces a promising avenue for exploring the complex genetic landscape of stress tolerance in other agricultural species.
The paper is structured as follows. Section 2 delves into the detailed methodology, including the novel hybrid gene selection techniques employed. Section 3 presents the results of the comparative evaluation of the different gene selection methods and classifiers, along with the identified key genes. The section also discusses the implications of these findings, the synergy between feature selection methods, and the potential applications in breeding programs, as well as limitations and future works. Finally, Section 4 summarizes the major findings of the research.

2. Materials and Methods

A flowchart providing an overview of the data analysis process used in this study is presented in Figure 1, which we describe in detail in this section.

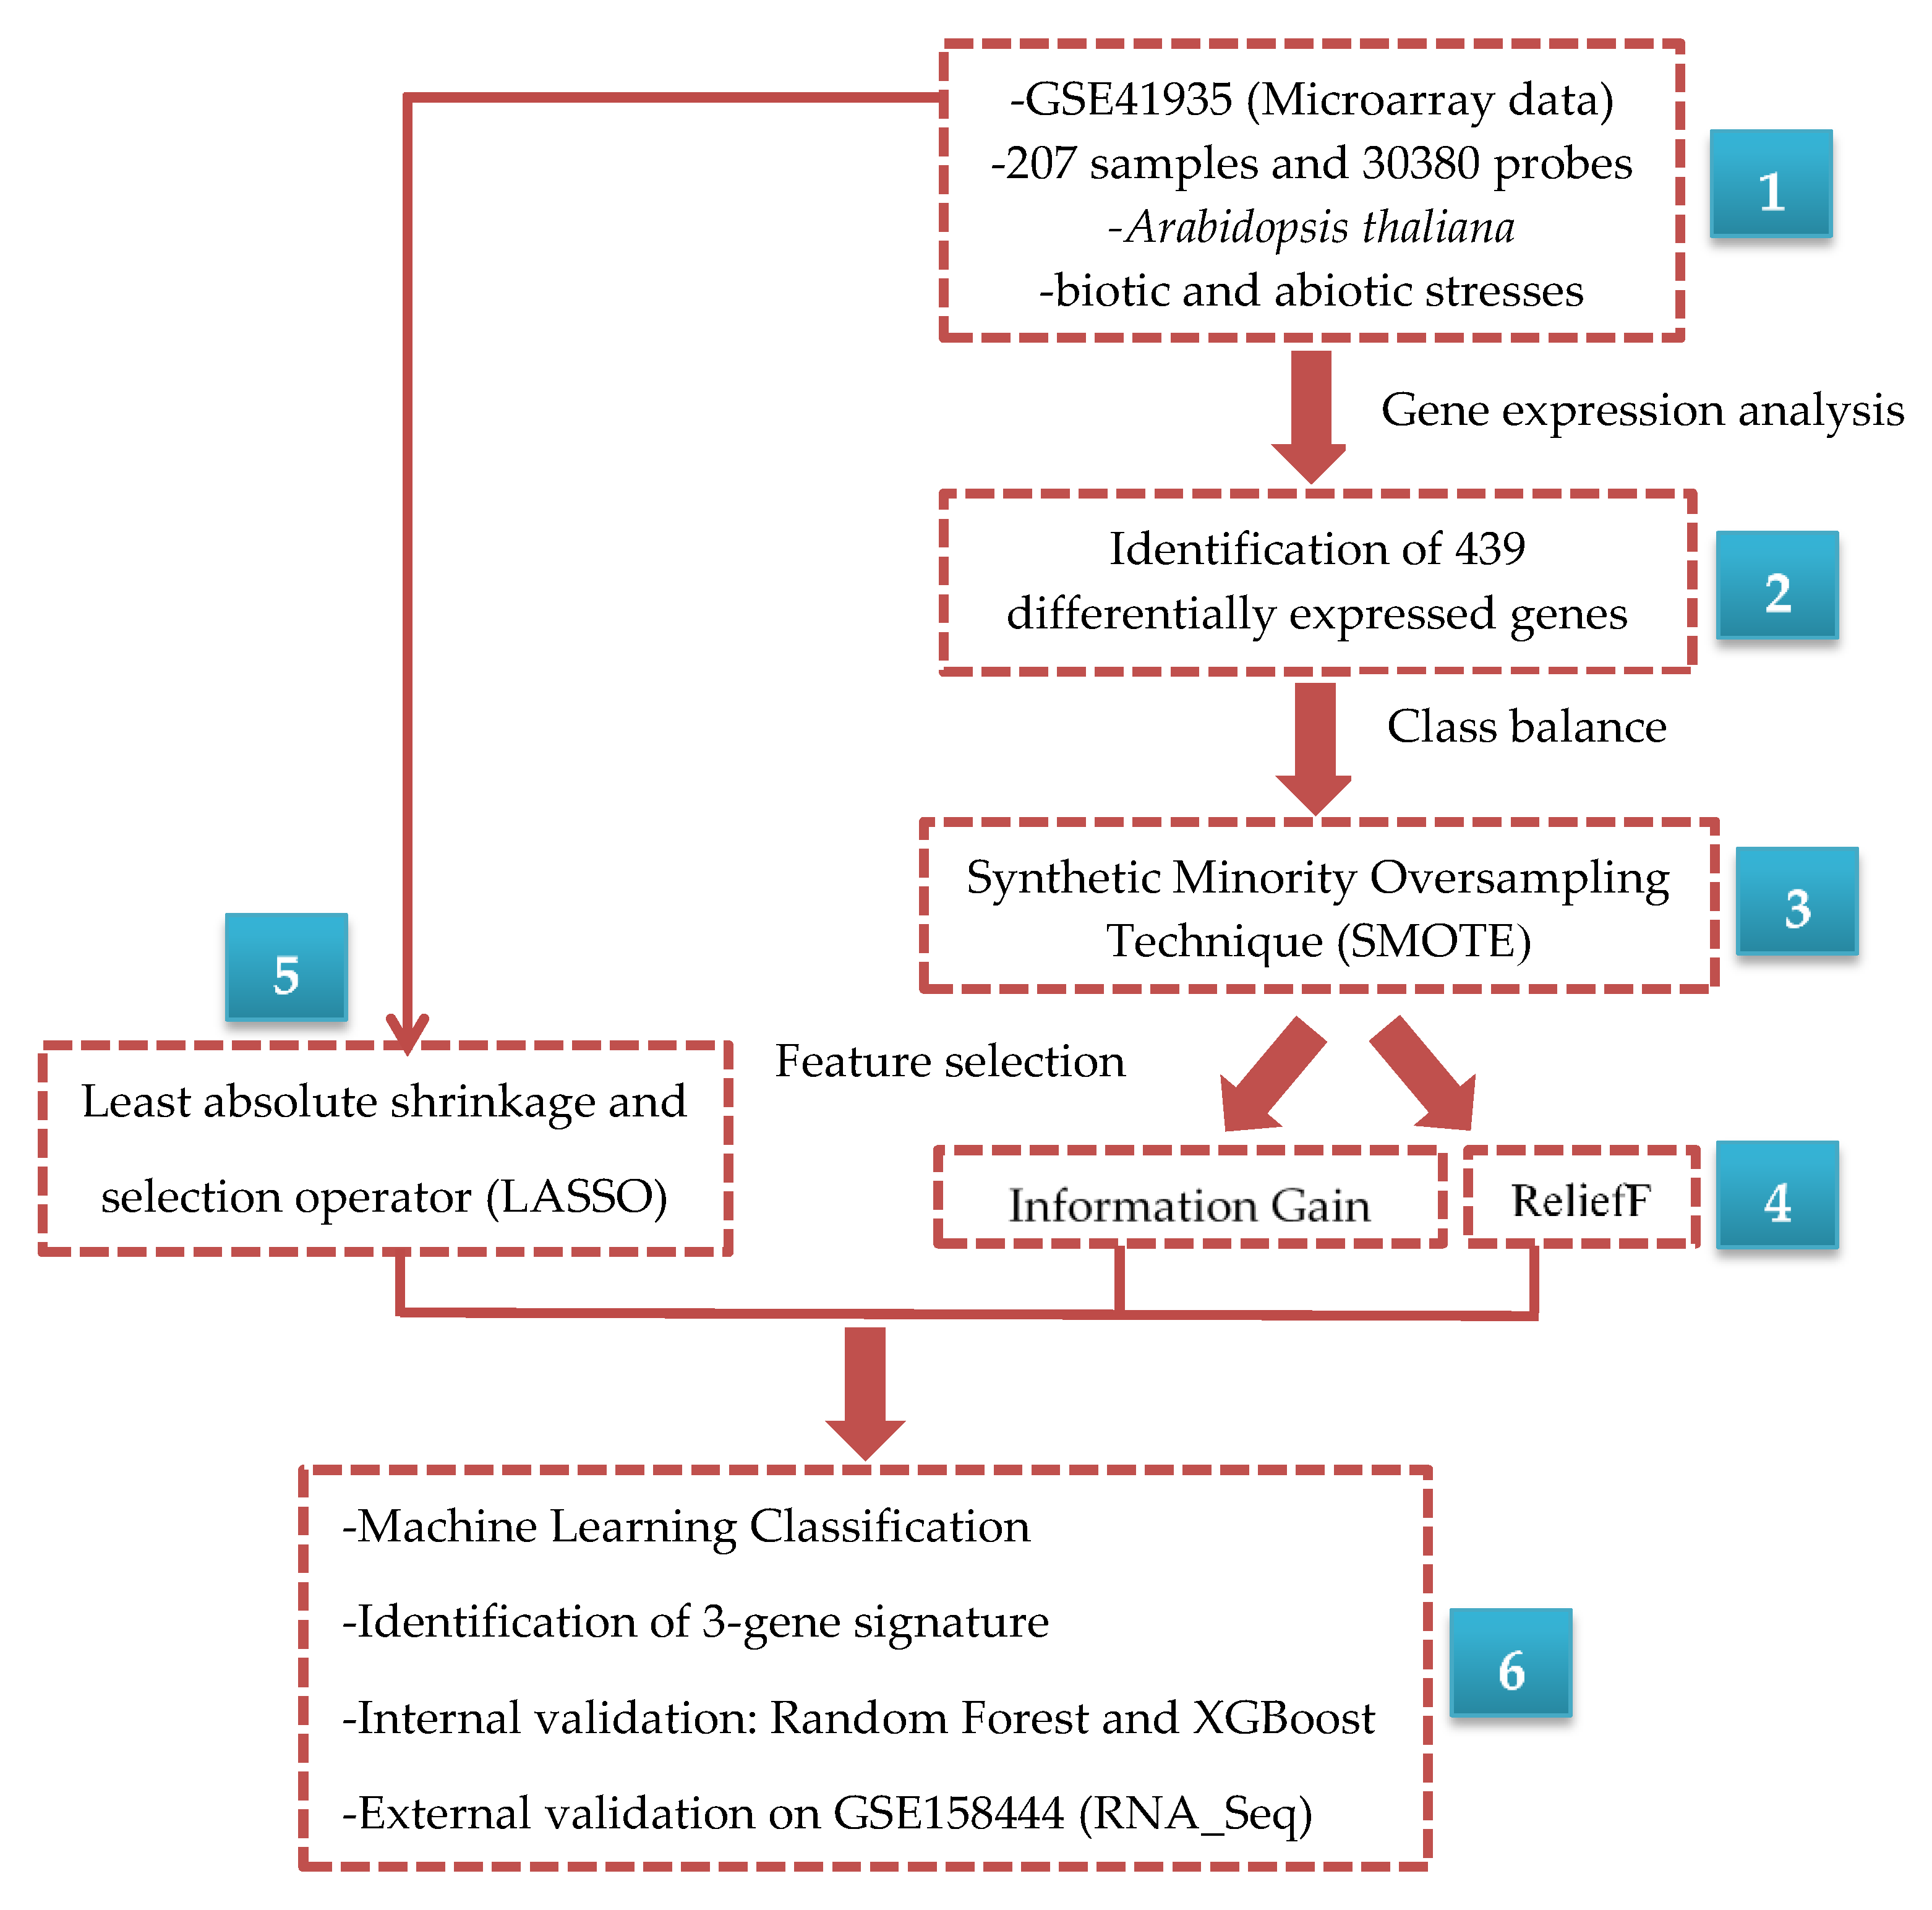
2.1. Microarray Data

The microarray data were accessed on 25 June 2022 from Gene Expression Omnibus (GEO) (http://www.ncbi.nlm.nih.gov/geo/) with the record number GSE41935. The experiment included 207 samples (arrays) and 59 unique experiments (treatments), including 10 genotypes of A. thaliana subjected to salt, temperature, HL, FLG, and their combinations [7]. We extracted the expression set from the GEOquery R package (Version 2.62.2). The sample information (phenotype data) was obtained from the expression set of the series matrix file. To identify the differentially expressed genes (DEGs) out of 30,380 microarray genes (probes), we used the limma R package (Version 4.1.2) together with the false discovery rate (FDR) method (FDR was set to 0.01). Gene expression groups showing empirical Bayes moderated p-values < 0.01 were considered differentially expressed. The identified list comprised 439 DEGs used for further analysis.
Differential expression (DE) analysis has been employed for gene expression profiles and uncovers the underlying mechanisms that govern tolerance to stress in Arabidopsis [17,18]. Given that gene expression profiles are often high-dimension matrices encompassing thousands of strongly correlated genes (including hundreds of highly correlated DEGs), it is impractical to utilize all DEGs to pinpoint genes that transcriptionally respond to stress in plants. Consequently, data-driven approaches have been extensively employed to discern the gene signature using gene expression data in plants [19].

2.2. Class Imbalance

This study’s samples were binary and categorized as either control or stress. Among the 207 samples introduced in Section 2.1, 32 were control and 175 were stress, indicating class-imbalanced data. In such cases, using standard classification methods could lead to bias toward the majority class, potentially increasing the misclassification rate in the minority class.
To address this issue, an ML-based algorithm known as ‘oversampling’ was employed. The oversampling technique generates synthetic samples in the minority class to balance the dataset. The details on the principle of oversampling can be found elsewhere [20]. In the present work, the synthetic minority oversampling technique (SMOTE) [20] was applied in WEKA software (Machine Learning Group, University of Waikato, New Zealand) [21] to oversample the minority class. Nearest neighbors (K), specifying the number of nearest neighbors, and random seed value were kept as defaults (i.e., 5 and 1, respectively). The percentage parameter, which determines the amount of oversampling, was set to 400.

2.3. Feature Selection Methods

Feature selection is an essential step in the analysis of large datasets that allows for reducing the dimensionality of data by removing redundant features and selecting the most important ones [15]. This study utilized three common feature selection methods for gene expression analysis, LASSO, IG, and ReliefF, which are briefly described below.

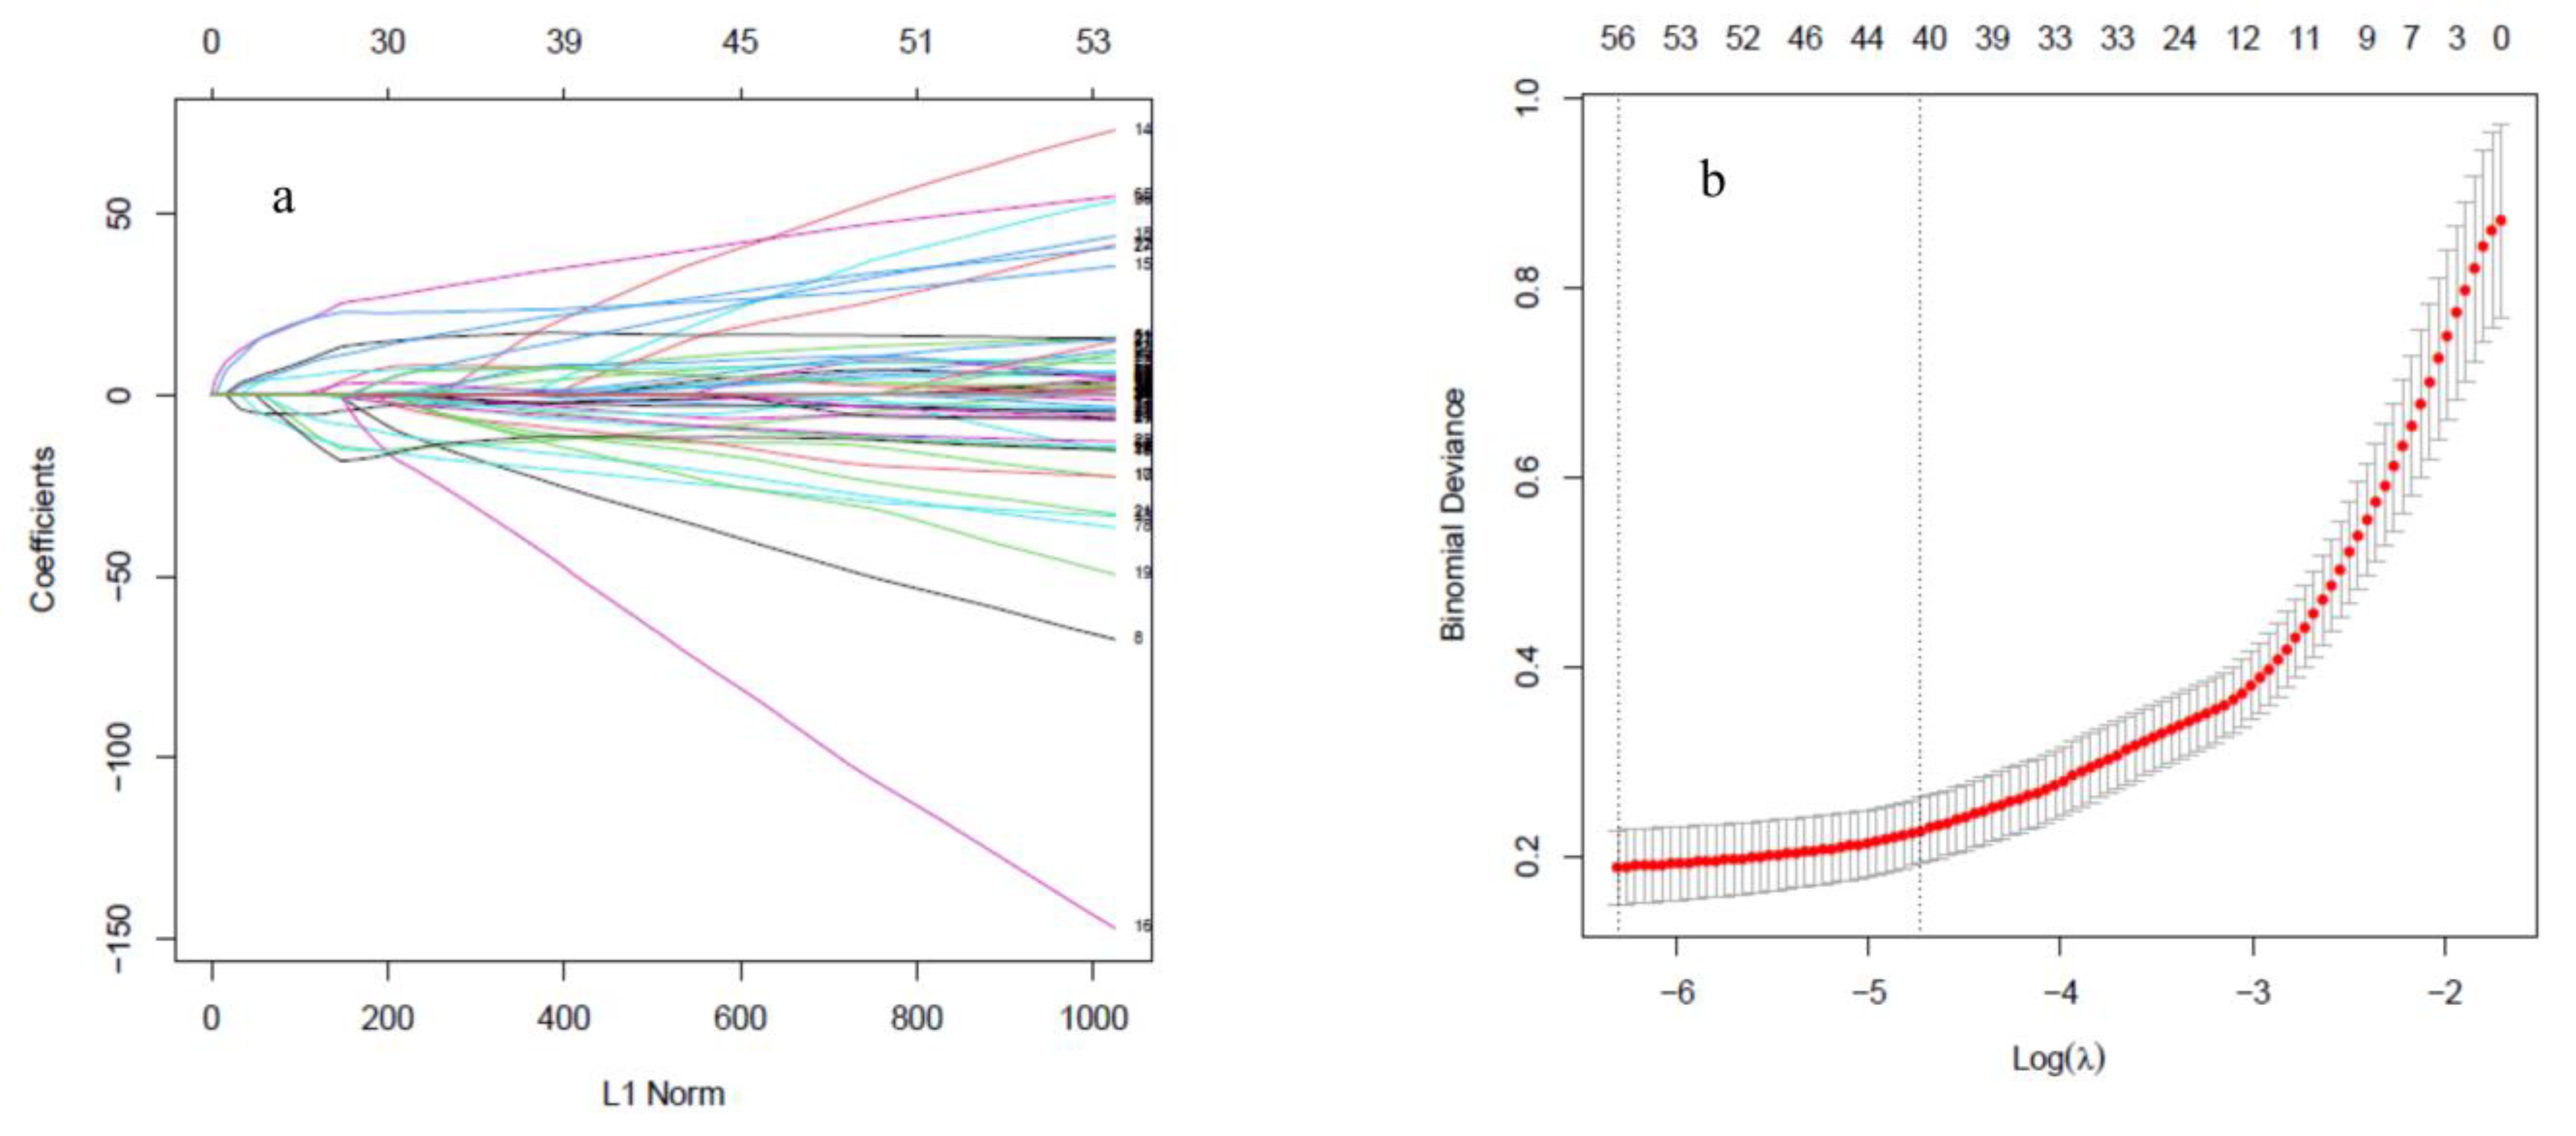
2.3.1. Least Absolute Shrinkage and Selection Operator

LASSO is a regression-based feature selection method [22] commonly used in gene expression analysis. In this algorithm, a set of informative genes can be selected by shrinking the regression coefficient to zero in the linear regression model [23]. LASSO can be defined as follows:
min β 0 ,   β 1 N   i = 1 N ω i l ( y i ,   β 0 +   β T x i ) +   λ   [ 1 α β 2 2 2 +   α β 1 ]  
where l(yii) is the negative log-likelihood contribution for observation i. ω i represents the weight for observation i and y i is the observed response for observation i, while the predicted response is given by β 0 +   β T x i . The elastic net penalty in LASSO regression is controlled by α = 1 (the default). The parameter λ is the tuning parameter that controls the overall penalty strength. It is known that LASSO tends to pick one of the coefficients of correlated predictors and discard the others. Further details on the principle and operation of LASSO analysis method can be found elsewhere [22]. In the present study, a 10-fold cross-validation was performed on the gene expression profile using the glmnet package in R (version 4.1.2), with alpha set to 1 and λ adjusted to select the optimal number of genes.

2.3.2. Information Gain

IG is an entropy-based measure applied in gene selection to rank genes based on IG value. A higher IG value indicates that the gene contributes more relevant information to the dataset [24].
IG of gene Y can be calculated as follows:
IG (Y) = entropy (N) − entropy Y (N)
where
Entropy   ( N ) = i = 1 k P C i ,   N × log P C i ,   N
Entropy   Y   ( N ) = j = 1 m N j N × Entropy   N j
Let N represent instances assigned to k classes, P (Ci, N) is the proportion of Ci to N, where Ci are instance sets belonging to the ith class, i = {1, 2, …, k}. Assuming gene Y has V = {v1, v2, …, vm} distinct value, and Nj  N | Y = v j , entropy Y (N) can then be calculated [24] using Equation (4). Further details on the principle and operation of the IG analysis method can be found elsewhere [24].

2.3.3. ReliefF

ReliefF is another feature selection tool with high discriminatory power among different classes in the microarray gene expression data [25]. In this approach, each gene is assigned a feature weight, ranging from −1 as the worst to +1 as the best, based on its feature statistics [16].
ReliefF algorithm identifies the K nearest neighbors from the same class (nearest hits, H) and the K nearest neighbors from each of the different classes (nearest misses, M) for each instance. It then updates the quality estimation Wi for each gene i based on the difference in values of the gene in the instance and its nearest hits and misses. Wi can be estimated using the following equation:
W i =   W i k = 1 k D H n · k + C = 1 C 1 P C   .   k = 1 k D M C n · k
where n is the total number of instances in the dataset; k is the number of nearest neighbors considered; DH (or D M C ) represents the sum of the distances between the selected instances and the nearest hits H (or misses MC) for feature i; PC is the probability of class C; and Wi is the weight of feature i, which represents the importance of that feature in distinguishing between different classes. Detailed discussions on the ReliefF algorithm can be found elsewhere [26].

2.3.4. Identification and Validation of Gene Signature

IG and ReliefF were performed on the DEGs’ expression profile in WEKA [21], with the threshold set to −1.7976, which is the default value used to identify significant features by filtering out those with weights below this value. In each case, 20 top genes were selected for further discriminant analysis (Section 2.4). BioVenn (https://www.biovenn.nl/ (accessed on 25 June 2022)), a web application for comparing and visualizing biological lists, was used to identify and visualize the distribution and intersected genes among feature selection methods.
Common genes among the three methods were selected as potential biomarkers to demonstrate the efficacy of feature selection methods in identifying important genes involved in biotic and abiotic stresses in Arabidopsis. A 10-fold cross-validation was performed using RandomForest and XGBoost packages in R. The ROCR package was employed to determine accuracy and receiver operating characteristics (ROC). Ultimately, the values of the area under the ROC curve (AUC) were considered to assess the efficiency of the selected key predictive genes [27]. Out-of-bag error, also called OOB estimate, was reported for measuring the prediction error of random forests using bootstrap aggregating (bagging). Bagging creates training samples by subsampling with replacement, allowing the model to learn from different data combinations. OOB error is the mean prediction error on each training sample xi, using only the trees that did not have xi in their bootstrap sample [28]. Mean decrease accuracy, mean decrease gini, and the Boruta algorithm by Boruta package [29] were also adopted to rank feature importance. In the Boruta analysis, each feature is labeled as either confirmed, tentative, or rejected. These labels indicate whether a gene was considered important, unclear, or not essential, respectively, for the classification.

2.3.5. Validation of Gene Signature Using External Dataset

To validate the three-gene signature, an RNA-Seq experiment, GSE158444, was selected [30]. This dataset comprises transcriptome response to heat stress in 148 samples of the Arabidopsis. Counts were downloaded from GEO and 10-fold cross-validation random forest was performed using randomForest in R, as explained in Section 2.3.4.

2.4. Discrimination Analysis

Discrimination analysis was performed using the WEKA software to assess the ability of the selected genes to discriminate between samples under stress and control class [21]. The gene expression matrix associated with the 20 selected genes was used to construct classification models, with each row representing 1 of the 207 samples.
A preliminary screening was conducted using various methods to identify the most effective classifiers for discriminating between the control and stress classes. Ultimately, the BayesNet, logistic, multilayer perceptron, sequential minimal optimization (SMO), and random forest classifiers were selected for the discrimination analysis. A detailed discussion on the principle and operation of these classifiers can be found elsewhere [21]. The parameters of different classifiers are provided in Table 1.
The discrimination analysis was conducted using a 10-fold cross-validation approach. The performance of the classifiers was evaluated using various metrics, including confusion matrices, TP (true positive) and FP (false positive) rate values, precision, F-measure, ROC area, and precision–recall (PRC) Area, and Matthews correlation coefficient (MCC). Equations (6)–(13) indicate the equations of the above-mentioned evaluation metrics.
Accuracy = (TP + TN)/(TP + FP+ TN + FN) × 100
TPRate = Recall = TP/(TP + FN)
FPRate = FP/(FP + TN)
Precision = TP/(TP + FP)
Recall = TP/(TP + FN)
F1-Measure = 2 × ((Precision × Recall)/(Precision + Recall))
ROC Area = Area under TP Rate vs. FP Rate curve
PRC Area = Area under Precision vs. Recall curve
MCC   = TP   × TN FP   × FN   TP   +   FP × TP   +   FN × TN   +   FP × TN   +   FN    
where TN represents true negative and FN indicates false negative.

3. Results and Discussion

Stress tolerance is crucial for crop plants to survive under adverse environmental and pathological conditions. Despite numerous studies to discover the molecular mechanisms behind stress tolerance in the Arabidopsis crop model, distinct biomarkers for germplasm screening and breeding of tolerance to stress have remained limited. In this study, we aimed to identify key genes involved in the stress response in Arabidopsis and evaluate the efficiency of different gene selection methods and classifiers.

3.1. Identification of Differentially Expressed Genes

Based on empirical Bayes statistics for differential expression and adjusted p-value ≤ 0.01, 439 genes were found to be DEGs between control and stress conditions. The ranking of the top 20 DEGs using the absolute value of log fold change is presented in Supplementary Table S1. Only three genes, including AT3G20810, AT1G31680, and AT1G30250, were down-regulated; the remaining genes were up-regulated. The top three up-regulated genes are AT4G27310, AT4G36010, and AT4G25480.

3.2. SMOTE Balancing and Feature Selection

SMOTE was applied to generate synthetic data in the control group, resulting in 160 control samples compared with the original 32 control samples. IG and ReliefF were then used to select important genes in a sample space of 439 DEGs.
Gene expression profiles of all probes were mined through LASSO regression analysis to identify the key genes involved in various stresses in Arabidopsis. The LASSO model fitted to the gene expression data is given in Figure 2a. Each curve corresponds to a variable showing the path of its coefficient in different λ against the L1 norm of the whole coefficient. The 42 genes with non-zero coefficients (Supplementary Table S2) were obtained by 10-fold cross-validation of LASSO presented in Figure 2b. The top 20 genes for each feature selection method were selected for further analysis.
To narrow down the list of important genes, we performed feature selection using three different methods: ReliefF, IG, and LASSO. ReliefF and IG are filter-based methods that rank genes based on their relevance to the classification task, while LASSO is a wrapper-based method that selects a subset of genes by optimizing the performance of a specific classifier. Comparisons between ReliefF and IG in terms of accuracy and effectiveness for all classifiers tested is presented in the subsequent Section 3.3 to further elucidate the role and capability of these methods in identifying genes involved in stress response in Arabidopsis.

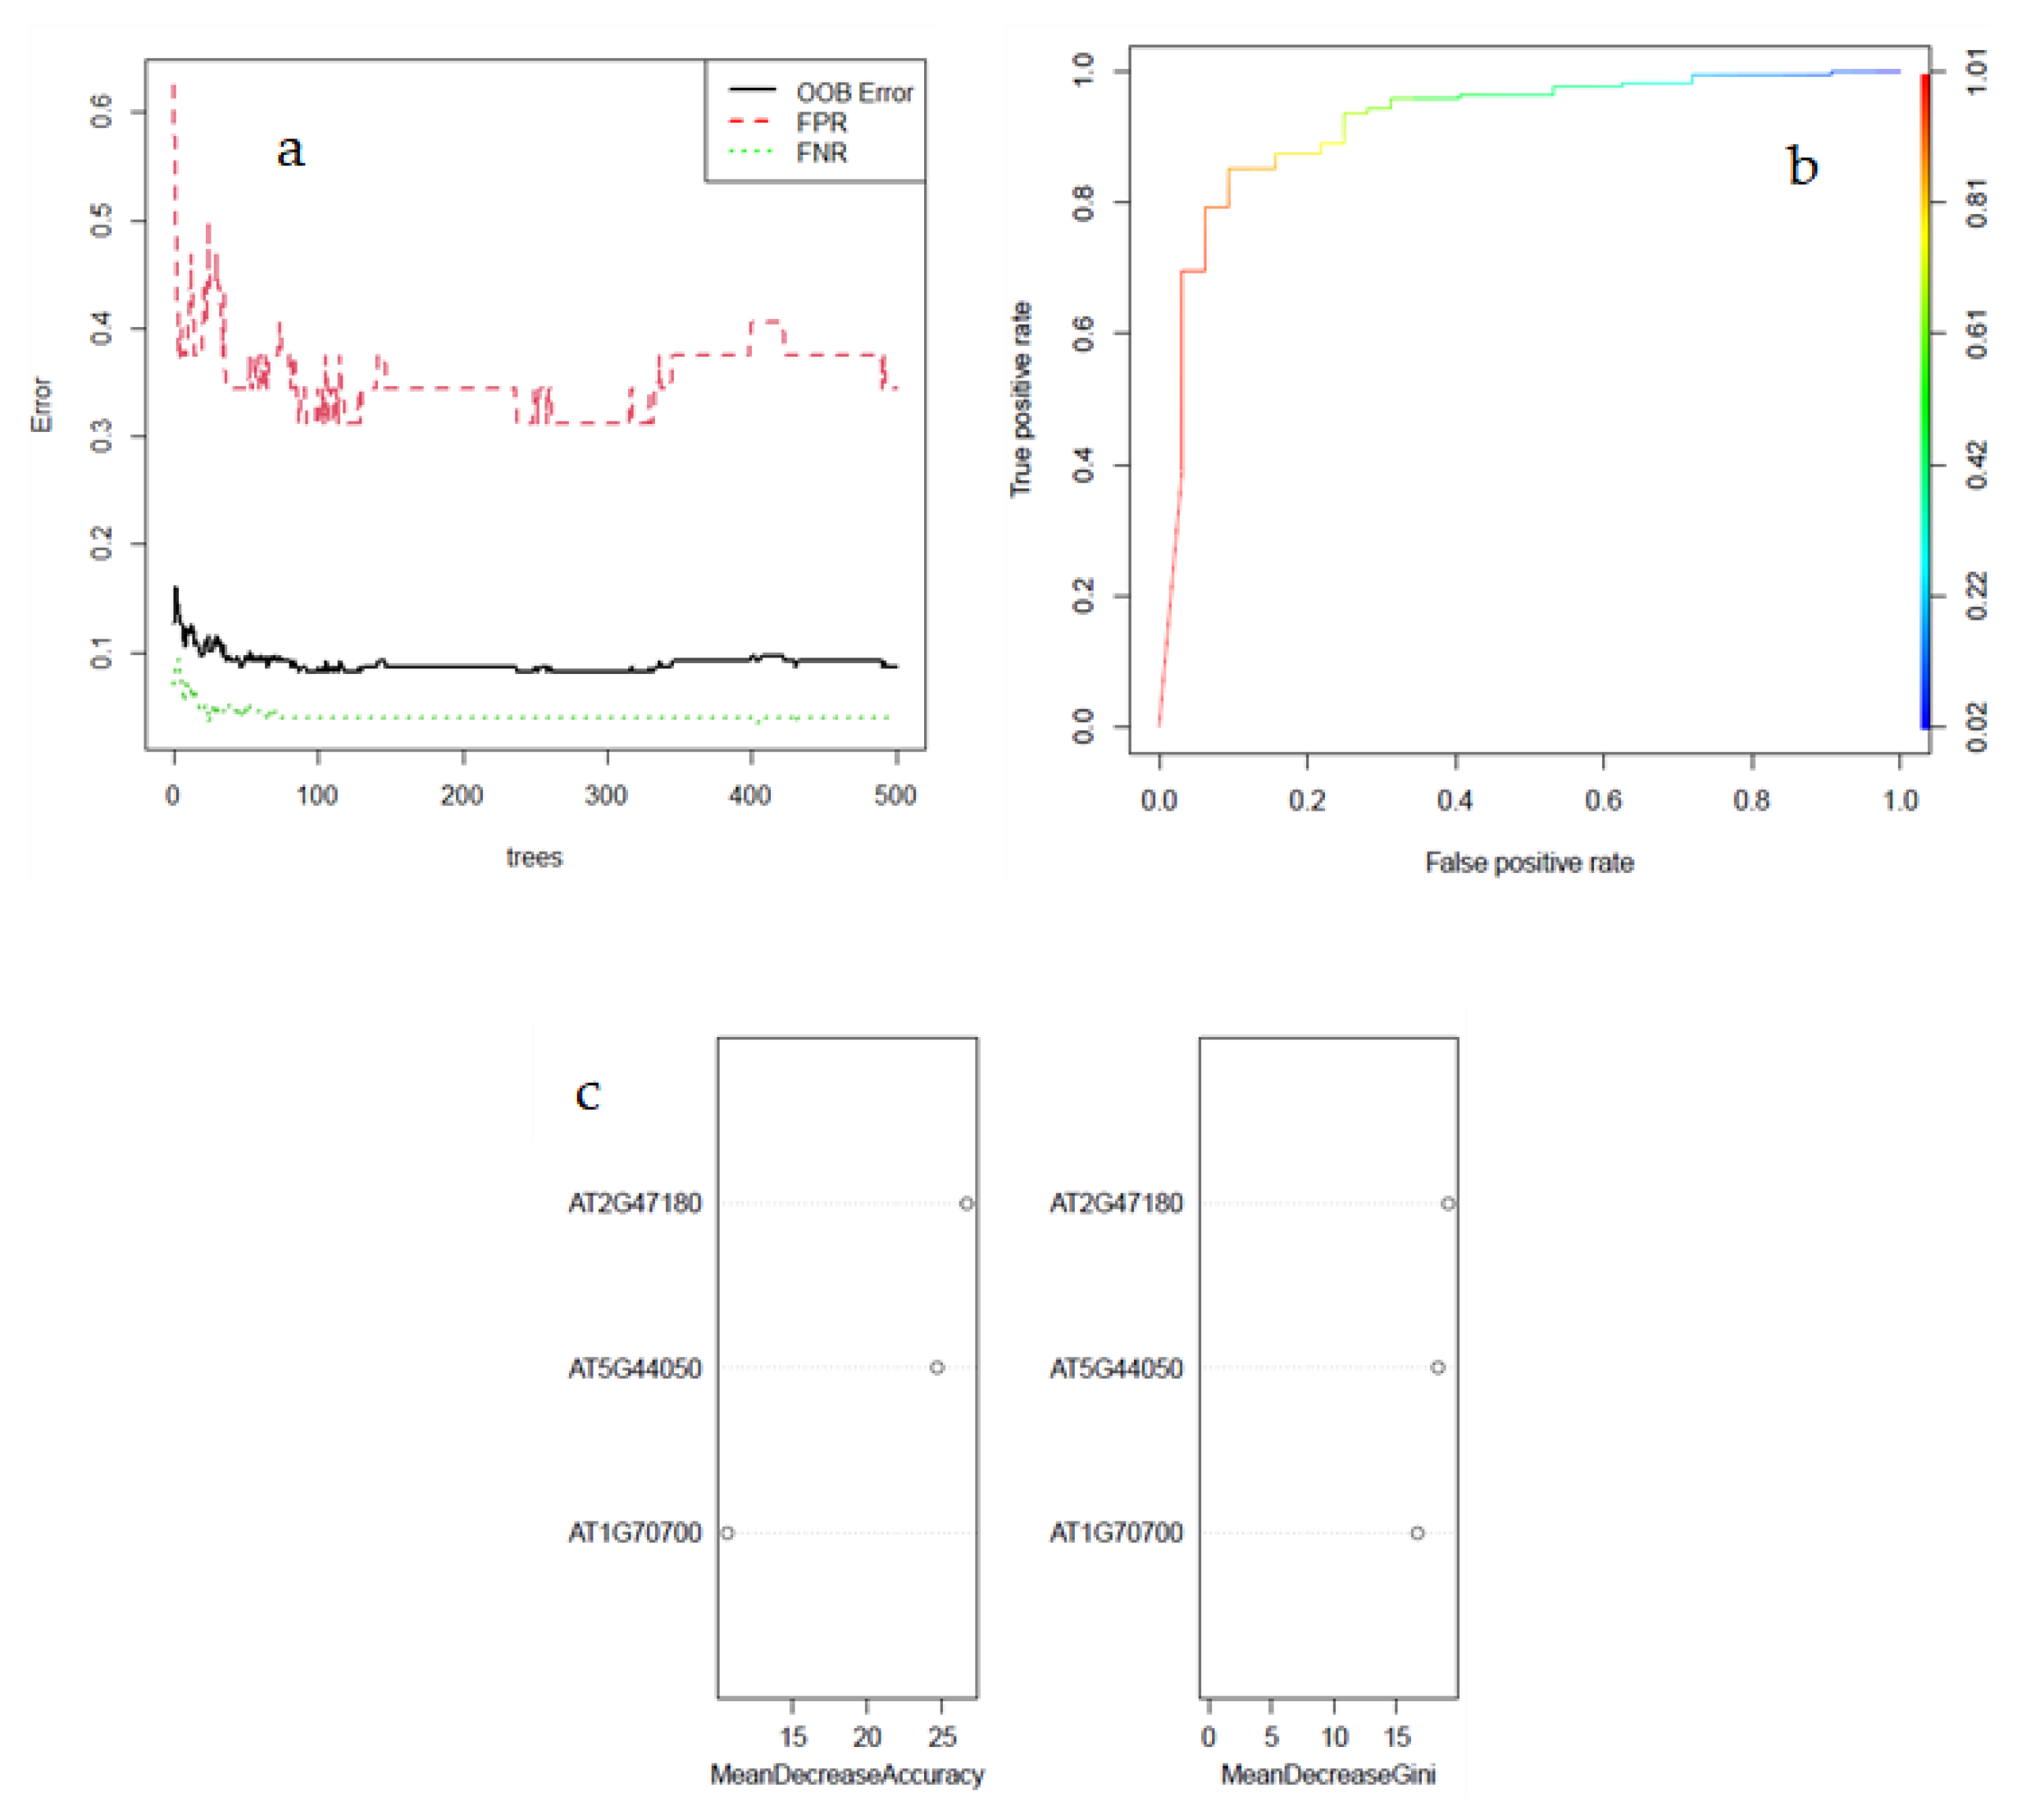
3.3. Machine Learning Classification

Table 2 shows the confusion matrix and classification performance of the top 20 genes selected based on IG. Accuracy as well as eight further measurements are presented in Table 2. Different classifiers were used to evaluate the performance of the 20 selected genes based on the IG algorithm, resulting in relatively high accuracy. The accuracy ranged from 95.22% related to logistic and SMO classifiers to 97.91% for random forest. The average accuracy considering all five classifiers stands to be 96.24%. Moreover, the relative efficiency of random forest over other classifiers could be reflected by considering all performance parameters (Table 2). Despite similar results for logistic and SMO for TP rate, FP rate, precision, recall, F-measure, and MCC parameters, the logistic algorithm provided a better ROC and PRC area, demonstrating better performance than SMO (Table 2).
In the ReliefF selection method, the overall accuracy was 97.016% (Table 3), which was higher than the accuracy obtained by the IG algorithm. Random forest and multilayer perceptron had the highest and similar accuracy ratings of 98.51%, while the minimum accuracy was obtained by BayesNet (94.93%). Overall, random forest performed slightly better considering all parameters together (Table 3).
Random forest was the best-performing classifier among all of the classifiers tested, providing the highest accuracy and other tested evaluation metrics for both ReliefF and IG (Table 2 and Table 3). The effectiveness of random forest may be due to its ability to handle large datasets with many variables and automatically balance datasets, making it suitable for complex tasks [31], as previously demonstrated in other studies [32].

3.4. Selection and Validation of Key Genes

We selected the 20 top-ranked genes by LASSO, IG, and ReliefF to find the key common genes identified by the three methods (Figure 3). The intersection of the top 20 genes from each of the three feature selection methods (ReliefF, IG, and LASSO) led to the identification of three common genes, AT5G44050, AT2G47180, and AT1G70700 (Figure 3).
A random forest algorithm was implemented to identify the performance of this three-gene signature. OOB error was estimated to be 8.7% (Figure 4a). The ROC was plotted by the true positive rate against the false positive rate. Therefore, the primary focus was on AUC to measure classification performance. The AUC of the three-gene set was equal to 0.921875, indicating that the gene set is excellent in discriminating control samples from those subjected to various types of stresses (Figure 4b) and can be introduced as potential biomarkers for stress tolerance in Arabidopsis owing to their efficient discrimination between control and stress conditions (Figure 4). Further, the mean decrease accuracy and mean decrease gini of each gene in the random forest algorithm were measured (Figure 4c). AT2G47180 seems to have the biggest contribution to the model, followed by AT5G44050 and AT1G70700. The same rank was obtained by the Boruta algorithm, and the contribution of the three-gene signature was confirmed. In comparison, the XGBoost classification model exhibited superior performance with an accuracy of 0.991%, a sensitivity of 0.9876%, and a specificity of 0.9943%. The XGBoost has proven to perform better in terms of efficiency and performance relative to other classifiers [33].

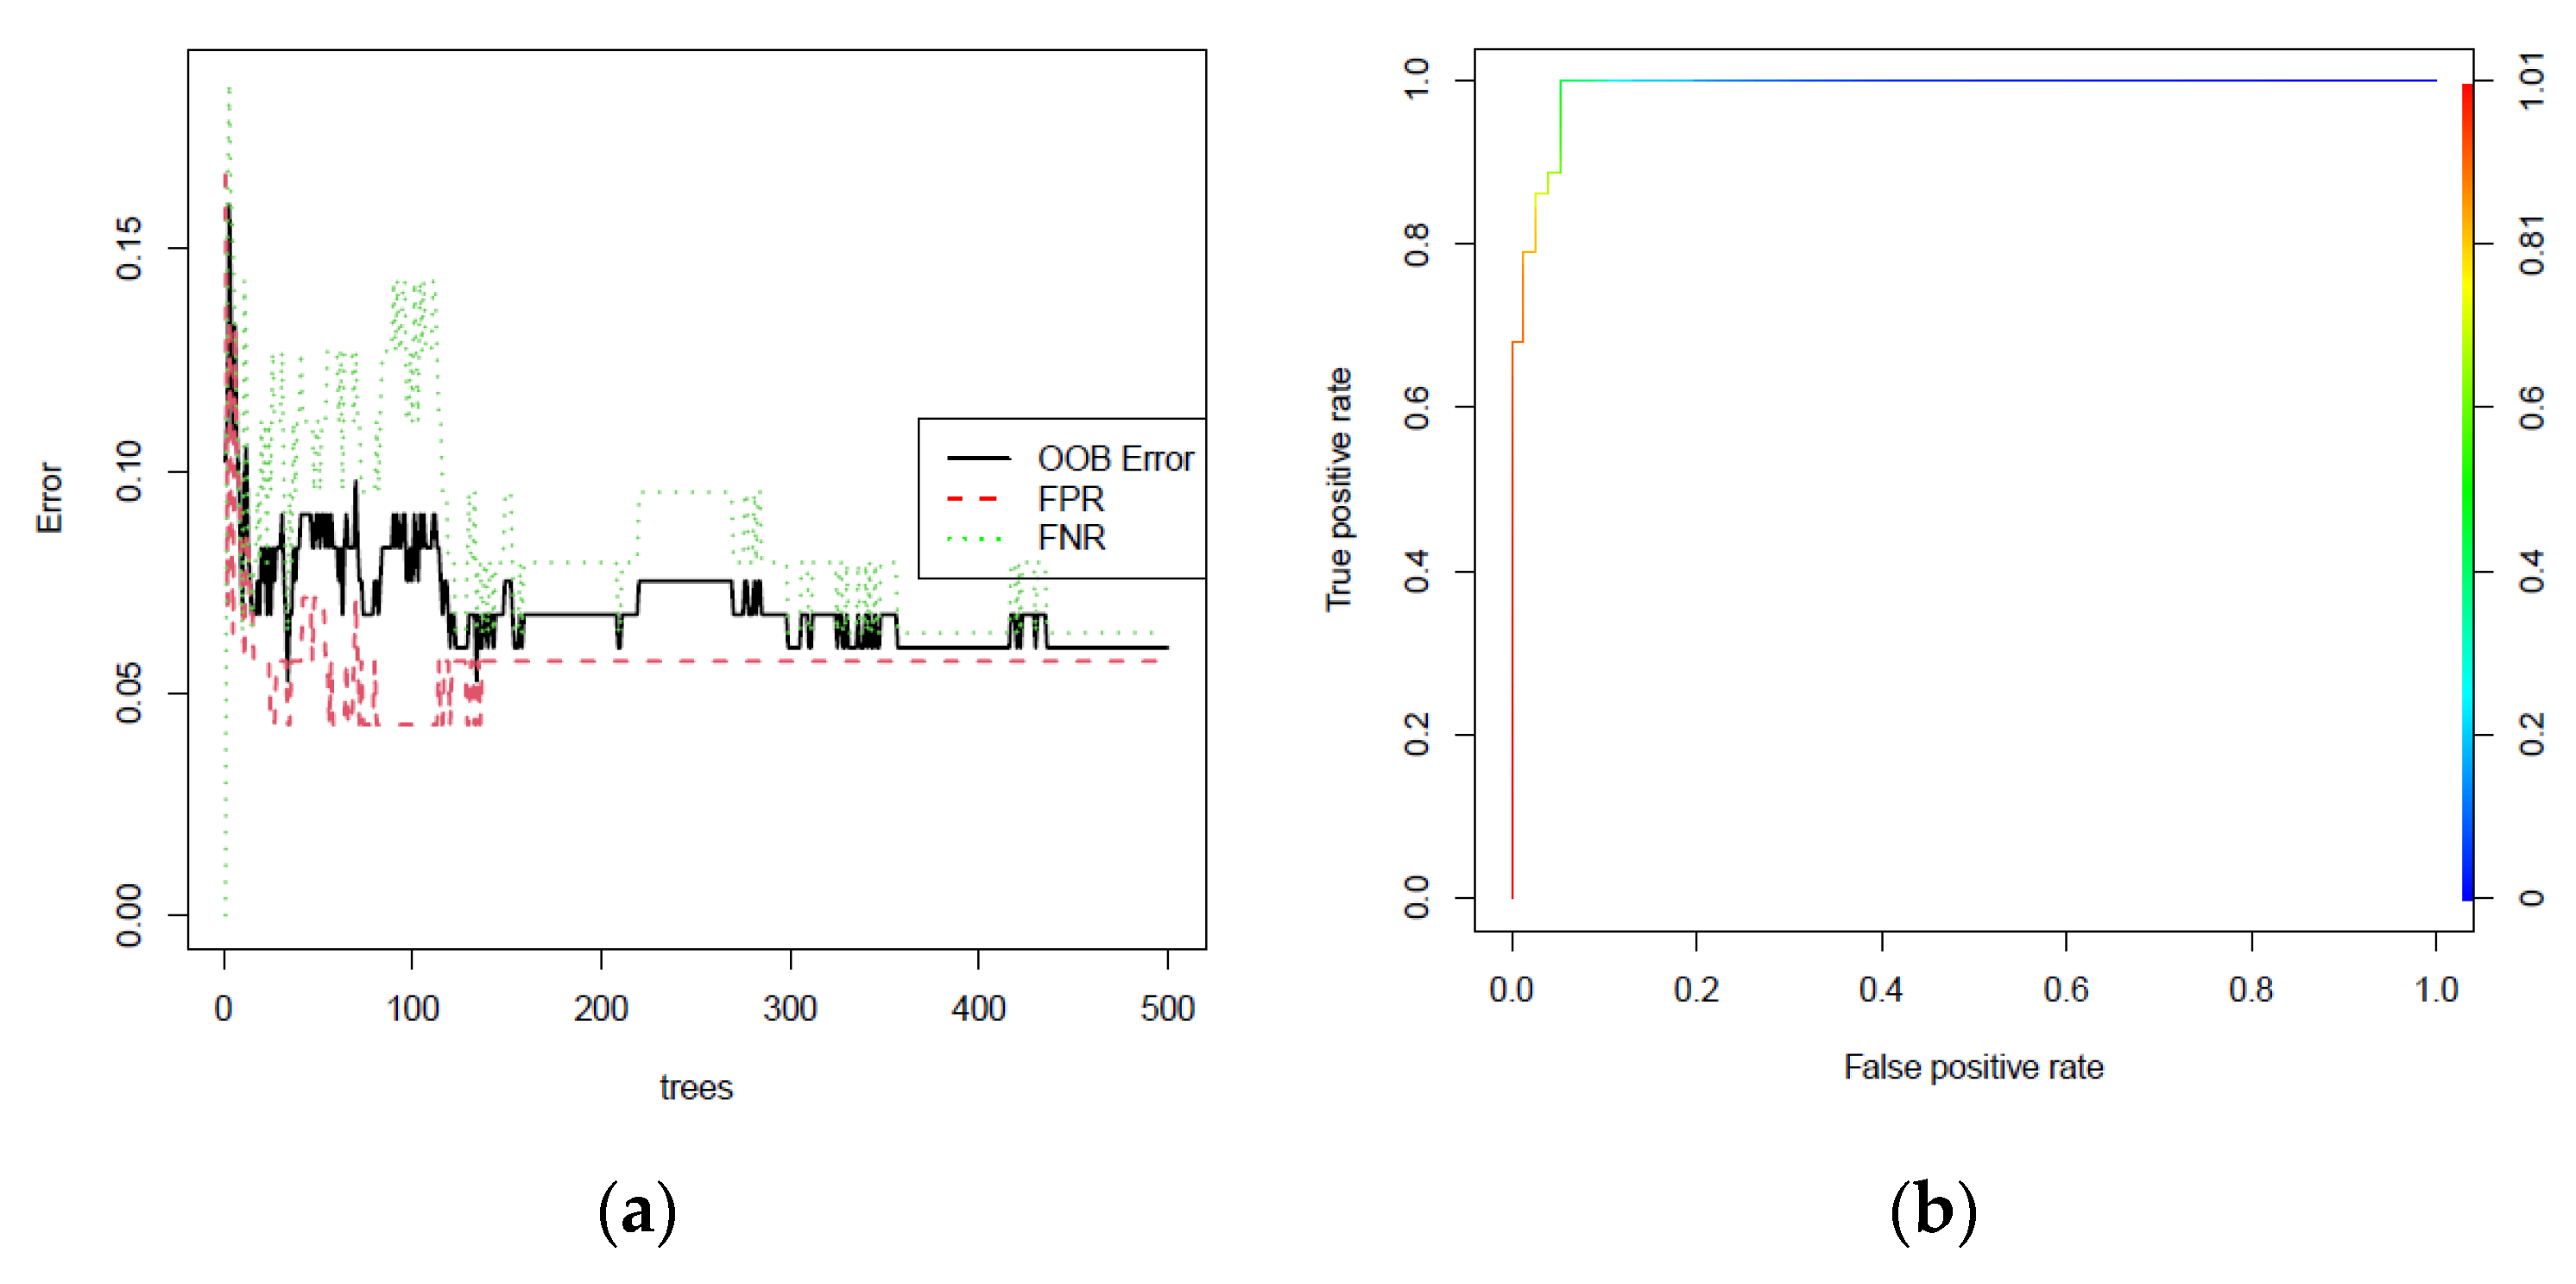
3.5. External Validation of Three-Gene Signature

As depicted in Figure 5, the OOB error rate diminishes as the number of trees increases, ultimately settling at 6.02% with 500 trees (Figure 5a). The achieved AUC was 0.9898, underscoring the potent predictive capability of the three-gene signature for heat stress in Arabidopsis.
AT5G44050, located on chromosome 5, encodes the MATE efflux family protein, also known as MRH10.16. Scholars have previously reported on the active function of the MATE gene in other crops to enhance general stress tolerance, including OsMATE1 and OsMATE2 in rice [34] and DTX/MATE in cotton [35]. Ref. [36] reported 174 A MATE families in four Cucurbitaceae species coping with severe salt stress.
AT2G47180 encodes a galactinol synthase 1 (GolS1) that has been reported to be induced by drought and high-salinity stresses in Arabidopsis [37]. In a study, [38] reported the GolS1 promotor as a potential biosensor for heat stress and fungal infection in Arabidopsis. Another study has revealed that GolS1 expression is regulated by other stressors, including ionic, osmotic, and heat stresses [39].
AT1G70700 encodes a TIFY domain/divergent CCT motif family protein (TIFY7). TIFY, also known as JAZ9 (Jasmonate-Zim-Domain Protein 9), which plays an important role when plants are subjected to various stresses. The role of the TIFY family in response to various stress has been reported in different species, e.g., in tomato (Solanum lycopersicum) [40], wheat (Triticum aestivum) [41], and rice (Oryza sativa) [42].

3.6. Limitation and Future Works

This study has made remarkable progress in identifying crucial genes related to stress response in Arabidopsis and provides valuable insights for the future breeding of stress-tolerant crops. However, some limitations and directions for future work must be acknowledged.
The study was conducted with the available datasets, which might not include all types of environmental stresses or Arabidopsis cultivars. Expanding the analysis to more diverse conditions and genotypes could provide a more comprehensive understanding. Moreover, the use of SMOTE to oversample the control samples may have potential implications on the analytical process. While in our analysis, the DEGs were identified before the application of SMOTE, thus maintaining the original integrity of the data, it is worth acknowledging that the oversampling process may introduce specific biases or effects. This complexity underscores the need for caution and may serve as an engaging avenue for future investigations, possibly leading to refinements in the methodology.
Machine-learning-based models may have some limitations, including the reliability of data resources, different protocols for data collection and gene expression experiments, and heterogeneity of the phenotypes. These factors might negatively affect the accuracy and predictability of the identified biomarkers through machine learning. Additionally, the choice of feature selection methods and classifiers can have a significant impact on the final result. Exploring additional machine learning algorithms and techniques, including the exploration of CatBoost, a gradient boosting framework, could offer further insights into the selected features and enhance the predictive performance of the models.
While computational methods offer valuable insights, experimental validation of identified genes in real plant systems is paramount. Field, greenhouse, and laboratory experiments are pivotal for the validation and verification of these biomarkers, promising tangible results for breeding programs. The proposed biomarkers can be authenticated using real-time qPCR. Moreover, the integration of advanced imaging and spectroscopy technologies offers a nuanced perspective on stress responses, especially in the context of agri-food quality monitoring [43,44,45]. As we move towards practical applications in agriculture, considerations such as cost, scalability, and the ethical implications of genetic modifications become indispensable. Comprehensive evaluations encompassing these factors are essential for translating research into real-world applications.
Arabidopsis serves as a model plant, but the findings should be extended to other economically important crops. Future research should also focus on how these findings can be translated to breeding programs for enhancing stress tolerance in crops of agricultural importance. Moreover, plants’ stress response is complex and may involve interactions with various environmental factors. Understanding the intricate relationship between genes and environmental conditions, including soil properties, humidity, and temperature, will be essential for a more holistic approach to improving stress tolerance.

4. Conclusions

In conclusion, this study utilized a hybrid gene selection approach to identify predictive genes involved in stress tolerance in Arabidopsis, which could potentially be used to improve crop production systems and address food security challenges. Through the use of various feature selection tools and machine learning algorithms, the study identified three common genes (AT5G44050, AT2G47180, and AT1G70700) that could serve as biomarkers for tolerant crops. The XGBoost and random forest algorithms demonstrated superior performance in classifying stress and control conditions, indicating their potential utility in crop breeding programs. However, further experimental research is needed to validate the identified genes and explore their potential for developing stress-tolerant crop varieties. Overall, this study provides valuable insights into the mechanisms underlying stress responses in plants and highlights the potential of gene selection and machine learning approaches for improving crop resilience.

Supplementary Materials

The following supporting information can be downloaded at: https://www.mdpi.com/article/10.3390/a16090407/s1, Supplementary Table S1: Differentially Expressed Genes (DEGs) based on empirical Bayes statistics and p-value ≤ 0.01 as well as the ranking of the top 20 DEGs for Arabidopsis under control and various stress condition; Supplementary Table S2: The top genes identified by differentially expressed genes (DEGs) analysis and different feature selection methods.

Author Contributions

Conceptualization, L.N. and V.G.; methodology, L.N. and M.N.; software, L.N; validation, L.N., V.G., M.N. and J.P.; formal analysis, L.N.; investigation, L.N. and M.N.; resources, L.N.; data curation, L.N.; writing—original draft preparation, L.N., V.G. and M.N.; writing—review and editing, L.N., V.G., M.N. and J.P.; visualization, L.N. and M.N.; supervision, L.N. and J.P.; project administration, L.N. M.N. and J.P. All authors have read and agreed to the published version of the manuscript.

Funding

This research received no external funding.

Data Availability Statement

The data presented in this study are openly available in Gene Expression Omnibus (GEO) (http://www.ncbi.nlm.nih.gov/geo/ (accessed on 25 June 2022)), reference number GSE41935.

Conflicts of Interest

The authors declare no conflict of interest.

References

  1. Barah, P.; Bones, A.M. Multidimensional approaches for studying plant defence against insects: From ecology to omics and synthetic biology. J. Exp. Bot. 2015, 66, 479–493. [Google Scholar] [CrossRef] [PubMed]
  2. Mosa, K.A.; Ismail, A.; Helmy, M. (Eds.) Introduction to Plant Stresses. In Plant Stress Tolerance: An Integrated Omics Approach; Springer International Publishing: Cham, Switzerland, 2017; pp. 1–19. [Google Scholar]
  3. Panigrahi, S.C.; Alam, M.S.; Mukhopadhyay, A. Chapter 12—Feature Selection and Analysis of Gene Expression Data Using Low-Dimensional Linear Programming. In Emerging Trends in Computational Biology, Bioinformatics, and Systems Biology; Tran, Q.N., Arabnia, H., Eds.; Morgan Kaufmann: Boston, MA, USA, 2015; pp. 235–264. [Google Scholar]
  4. Suzuki, N.; Rivero, R.M.; Shulaev, V.; Blumwald, E.; Mittler, R. Abiotic and biotic stress combinations. New Phytol. 2014, 203, 32–43. [Google Scholar] [CrossRef] [PubMed]
  5. Matters, G.L.; Scandalios, J.G. Changes in plant gene expression during stress. Dev. Genet. 1986, 7, 167–175. [Google Scholar] [CrossRef] [PubMed]
  6. Moreau, Y.; Aerts, S.; De Moor, B.; De Strooper, B.; Dabrowski, M. Comparison and meta-analysis of microarray data: From the bench to the computer desk. Trends Genet. 2003, 19, 570–577. [Google Scholar] [CrossRef] [PubMed]
  7. Barah, P.; Jayavelu, N.D.; Sowdhamini, R.; Shameer, K.; Bones, A.M. Transcriptional regulatory networks in Arabidopsis thaliana during single and combined stresses. Nucleic Acids Res. 2016, 44, 3147–3164. [Google Scholar] [CrossRef]
  8. Coolen, S.; Proietti, S.; Hickman, R.; Olivas, N.H.D.; Huang, P.-P.; Van Verk, M.C.; Van Pelt, J.A.; Wittenberg, A.H.; De Vos, M.; Prins, M.; et al. Transcriptome dynamics of Arabidopsis during sequential biotic and abiotic stresses. Plant J. 2016, 86, 249–267. [Google Scholar] [CrossRef]
  9. Rasmussen, S.; Barah, P.; Suarez-Rodriguez, M.C.; Bressendorff, S.; Friis, P.; Costantino, P.; Bones, A.M.; Nielsen, H.B.; Mundy, J. Transcriptome Responses to Combinations of Stresses in Arabidopsis. Plant Physiol. 2013, 161, 1783–1794. [Google Scholar] [CrossRef]
  10. Wang, X.; Li, N.; Li, W.; Gao, X.; Cha, M.; Qin, L.; Liu, L. Advances in Transcriptomics in the Response to Stress in Plants. Glob. Med. Genet. 2020, 07, 30–34. [Google Scholar] [CrossRef]
  11. Mallik, S.; Zhao, Z. Identification of gene signatures from RNA-seq data using Pareto-optimal cluster algorithm. BMC Syst. Biol. 2018, 12, 126. [Google Scholar] [CrossRef]
  12. Khalid, S.; Khalil, T.; Nasreen, S. A survey of feature selection and feature extraction techniques in machine learning. In Proceedings of the Science and Information Conference (SAI), London, UK, 27–29 August 2014; pp. 372–378. [Google Scholar]
  13. Mahendran, N.; Vincent, P.M.D.R.; Srinivasan, K.; Chang, C.-Y. Machine Learning Based Computational Gene Selection Models: A Survey, Performance Evaluation, Open Issues, and Future Research Directions. Front. Genet. 2020, 11, 603808. [Google Scholar] [CrossRef]
  14. Du, Q.; Campbell, M.; Yu, H.; Liu, K.; Walia, H.; Zhang, Q.; Zhang, C. Network-based feature selection reveals substructures of gene modules responding to salt stress in rice. Plant Direct 2019, 3, e00154. [Google Scholar] [CrossRef]
  15. Prasetiyowati, M.I.; Maulidevi, N.U.; Surendro, K. Determining threshold value on information gain feature selection to increase speed and prediction accuracy of random forest. J. Big Data 2021, 8, 84. [Google Scholar] [CrossRef]
  16. Urbanowicz, R.J.; Meeker, M.; La Cava, W.; Olson, R.S.; Moore, J.H. Relief-based feature selection: Introduction and review. J. Biomed. Inform. 2018, 85, 189–203. [Google Scholar] [CrossRef] [PubMed]
  17. Bechtold, U.; Penfold, C.A.; Jenkins, D.J.; Legaie, R.; Moore, J.D.; Lawson, T.; Matthews, J.S.; Vialet-Chabrand, S.R.; Baxter, L.; Subramaniam, S.; et al. Time-Series Transcriptomics Reveals That AGAMOUS-LIKE22 Affects Primary Metabolism and Developmental Processes in Drought-Stressed Arabidopsis. Plant Cell 2016, 28, 345–366. [Google Scholar] [CrossRef] [PubMed]
  18. Marais, D.L.D.; McKay, J.K.; Richards, J.H.; Sen, S.; Wayne, T.; Juenger, T.E. Physiological Genomics of Response to Soil Drying in Diverse Arabidopsis Accessions. Plant Cell 2012, 24, 893–914. [Google Scholar] [CrossRef]
  19. Parkinson, E.; Liberatore, F.; Watkins, W.J.; Andrews, R.; Edkins, S.; Hibbert, J.; Strunk, T.; Currie, A.; Ghazal, P. Gene filtering strategies for machine learning guided biomarker discovery using neonatal sepsis RNA-seq data. Front. Genet. 2023, 14, 1158352. [Google Scholar] [CrossRef]
  20. Blagus, R.; Lusa, L. SMOTE for high-dimensional class-imbalanced data. BMC Bioinform. 2013, 14, 106. [Google Scholar] [CrossRef]
  21. Bouckaert, R.R.; Frank, E.; Hall, M.; Kirkby, R.; Reutemann, P.; Seewald, A.; Scuse, D. WEKA Manual for Version 3-9-1; University of Waikato: Hamilton, New Zealand, 2016. [Google Scholar]
  22. Tibshirani, R. Regression shrinkage and selection via the lasso. J. R. Stat. Soc. Ser. B 1996, 58, 267–288. [Google Scholar] [CrossRef]
  23. Tibshirani, R.J. The lasso problem and uniqueness. Electron. J. Stat. 2013, 7, 1456–1490. [Google Scholar] [CrossRef]
  24. Lai, C.-M.; Yeh, W.-C.; Chang, C.-Y. Gene selection using information gain and improved simplified swarm optimization. Neurocomputing 2016, 218, 331–338. [Google Scholar] [CrossRef]
  25. Hall, M.A.; Smith, L.A. Practical feature subset selection for machine learning. In Computer Science ’98 Proceedings of the 21st Australasian Computer Science Conference ACSC’98, Perth, Australia, 4–6 February 1998; McDonald, C., Ed.; Springer: Berlin, Germany, 1998; pp. 181–191. [Google Scholar]
  26. Robnik-Šikonja, M.; Kononenko, I. Theoretical and Empirical Analysis of ReliefF and RReliefF. Mach. Learn. 2003, 53, 23–69. [Google Scholar] [CrossRef]
  27. Sing, T.; Sander, O.; Beerenwinkel, N.; Lengauer, T. ROCR: Visualizing classifier performance in R. Bioinformatics 2005, 21, 3940–3941. [Google Scholar] [CrossRef] [PubMed]
  28. James, G.; Witten, D.; Hastie, T.; Tibshirani, R. An Introduction to Statistical Learning; Springer: New York, NY, USA, 2013. [Google Scholar]
  29. Kursa, M.B.; Rudnicki, W.R. Feature Selection with the Boruta Package. J. Stat. Softw. 2010, 36, 1–13. [Google Scholar] [CrossRef]
  30. Bonnot, T.; Nagel, D.H. Time of the day prioritizes the pool of translating mRNAs in response to heat stress. Plant Cell 2021, 33, 2164–2182. [Google Scholar] [CrossRef] [PubMed]
  31. Biau, G.; Scornet, E. A random forest guided tour. TEST 2016, 25, 197–227. [Google Scholar] [CrossRef]
  32. Tabl, A.A.; Alkhateeb, A.; ElMaraghy, W.; Rueda, L.; Ngom, A. A Machine Learning Approach for Identifying Gene Biomarkers Guiding the Treatment of Breast Cancer. Front. Genet. 2019, 10, 256. [Google Scholar] [CrossRef]
  33. Li, Q.; Yang, H.; Wang, P.; Liu, X.; Lv, K.; Ye, M. XGBoost-based and tumor-immune characterized gene signature for the prediction of metastatic status in breast cancer. J. Transl. Med. 2022, 20, 177. [Google Scholar] [CrossRef]
  34. Tiwari, M.; Sharma, D.; Singh, M.; Tripathi, R.D.; Trivedi, P.K. Expression of OsMATE1 and OsMATE2 alters development, stress responses and pathogen susceptibility in Arabidopsis. Sci. Rep. 2014, 4, 3964. [Google Scholar] [CrossRef]
  35. Magwanga, R.O.; Lu, P.; Kirungu, J.N.; Lu, H.; Wang, X.; Cai, X.; Zhou, Z.; Zhang, Z.; Salih, H.; Wang, K.; et al. Characterization of the late embryogenesis abundant (LEA) proteins family and their role in drought stress tolerance in upland cotton. BMC Genet. 2018, 19, 6. [Google Scholar] [CrossRef]
  36. Shah, I.H.; Manzoor, M.A.; Sabir, I.A.; Ashraf, M.; Haq, F.; Arif, S.; Abdullah, M.; Niu, Q.; Zhang, Y. Genome-wide identification and comparative analysis of MATE gene family in Cucurbitaceae species and their regulatory role in melon (Cucumis melo) under salt stress. Hortic. Environ. Biotechnol. 2022, 63, 595–612. [Google Scholar] [CrossRef]
  37. Taji, T.; Ohsumi, C.; Iuchi, S.; Seki, M.; Kasuga, M.; Kobayashi, M.; Yamaguchi-Shinozaki, K.; Shinozaki, K. Important roles of drought- and cold-inducible genes for galactinol synthase in stress tolerance in Arabidopsis thaliana. Plant J. 2002, 29, 417–426. [Google Scholar] [CrossRef] [PubMed]
  38. Janse van Rensburg, H.C. The Arabidopsis GolS1 Promotor as a Potential Biosensor for Heat Stress and Fungal Infection? Master’s Thesis, Stellenbosch University, Stellenbosch, South Africa, 2016. [Google Scholar]
  39. Kahraman, N.; Pehlivan, N. Harboured cation/proton antiporters modulate stress response to integrated heat and salt via up-regulating KIN1 and GOLS1 in double transgenic Arabidopsis. Funct. Plant Biol. 2022, 49, 1070–1084. [Google Scholar] [CrossRef] [PubMed]
  40. Chini, A.; Ben-Romdhane, W.; Hassairi, A.; Aboul-Soud, M.A.M. Identification of TIFY/JAZ family genes in Solanum lycopersicum and their regulation in response to abiotic stresses. PLoS ONE 2017, 12, e0177381. [Google Scholar] [CrossRef] [PubMed]
  41. Ebel, C.; BenFeki, A.; Hanin, M.; Solano, R.; Chini, A. Characterization of wheat (Triticum aestivum) TIFY family and role of Triticum Durum TdTIFY11a in salt stress tolerance. PLoS ONE 2018, 13, e0200566. [Google Scholar] [CrossRef]
  42. Ye, H.; Du, H.; Tang, N.; Li, X.; Xiong, L. Identification and expression profiling analysis of TIFY family genes involved in stress and phytohormone responses in rice. Plant Mol. Biol. 2009, 71, 291–305. [Google Scholar] [CrossRef]
  43. Erkinbaev, C.; Nadimi, M.; Paliwal, J. A unified heuristic approach to simultaneously detect fusarium and ergot damage in wheat. Meas. Food 2022, 7, 100043. [Google Scholar] [CrossRef]
  44. Nadimi, M.; Hawley, E.; Liu, J.; Hildebrand, K.; Sopiwnyk, E.; Paliwal, J. Enhancing traceability of wheat quality through the supply chain. Compr. Rev. Food Sci. Food Saf. 2023, 22, 2495–2522. [Google Scholar] [CrossRef] [PubMed]
  45. Nadimi, M.; Loewen, G.; Bhowmik, P.; Paliwal, J. Effect of Laser Biostimulation on Germination of Sub-Optimally Stored Flaxseeds (Linum usitatissimum). Sustainability 2022, 14, 12183. [Google Scholar] [CrossRef]
Figure 1. Overview of the modeling process implemented to classify and interrogate gene expression relationships between control and stress conditions in Arabidopsis.
Algorithms 16 00407 g001
Figure 2. (a) The LASSO model: each curve corresponds to a variable. It shows the path of its coefficient against the L1 norm of the whole coefficient vector as λ varies. The axis above the graph indicates the number of non-zero coefficients at the current λ, which is LASSO’s effective degree of freedom (df). (b) LASSO model identified 42 genes that provide the most regularized model such that the cross-validated error is within one standard error of the minimum.
Algorithms 16 00407 g002
Figure 3. Venn diagram of common overlapping genes for the top 20 ranked genes by the information gain (IG), ReliefF, and LASSO methods.
Algorithms 16 00407 g003
Figure 4. A random forest algorithm to identify the performance of the three-gene signature common among LASSO, IG, and ReliefF selection (a). The ROC is plotted by the true positive rate against the false positive rate (b). Mean decrease accuracy and mean decrease gini to confirm and rank the importance of the selected genes (c).
Algorithms 16 00407 g004
Figure 5. Validation of the three-gene signature by the random forest algorithm on the GSE158444 dataset, which is an RNA_seq transcriptome of Arabidopsis subjected to heat stress (a). The ROC is plotted by the true positive rate against the false positive rate (b).
Algorithms 16 00407 g005
Table 1. The parameters of different classifiers for the discrimination of Arabidopsis based on gene expression levels under control and stress conditions.
ClassifierParameter Adjustment
BayesNetdebug: False; estimator: SimpleEstimator; searchAlgorithms: K2; useADTree: False
Logisticdebug: False; maxIts: −1; ridge: 10−8
Multilayer Perceptrondebug: False; hiddenLayers: a; learningRate: 0.3; momentum: 0.2; normalizeNumericClass: True; NominalToBinaryFilter: True; normalizeAttributes: True; reset: True; seed: 0; trainingTime: 500; validationThreshold: 20
SMObuildLogisticModels: False; c: 1.0; checksTurnedOff: False; debug: False; epsilon: 10−12; filterType: Normalize training data; kernel: polyKernel, numFolds: −1; randomSeed: 1; tolerance Parameter: 0.0010
Random Forestdebug: False; maxDepth: 0; numFeatures: 0; numTrees: 10; seed: 1
XGBoostmax_depth = 2, eta = 1, nround = 2, set.seed = 1
Table 2. The confusion matrices and discrimination performance of Arabidopsis on expression levels of 20 selected differentially expressed genes (DEGs) under control and stress conditions based on the information gain (IG) feature selection algorithm.
ClassifierPredicted ClassActual ClassAccuracy (%)TP RateFP RatePrecisionRecall F-MeasureMCCROC AreaPRC Area
ControlStress
BayesNet1555control96.420.9640.0350.9640.9640.9640.9280.9930.994
7168stress
Logistic1555control95.220.9520.0460.9530.9520.9520.9050.9870.979
11164stress
Multilayer Perceptron1582control96.420.9640.0340.9650.9640.9640.9290.9940.994
10165stress
SMO1546control95.220.9520.0470.9530.9520.9520.9050.9530.931
10165stress
Random Forest1573control97.910.9790.0210.9790.9790.9790.9580.9930.999
4171stress
Table 3. The confusion matrices and discrimination performance of Arabidopsis on expression levels of 20 selected differentially expressed genes (DEGs) under control and stress conditions based on the ReliefF feature selection algorithm.
ClassifierPredicted ClassActual ClassAccuracy (%)TP RateFP RatePrecisionRecall F-MeasureMCCROC AreaPRC Area
ControlStress
BayesNet1528control94.930.9490.0510.9490.9490.9490.8980.9930.993
9166stress
Logistic1564control95.520.9550.0430.9560.9550.9550.9110.9760.965
11164stress
Multilayer Perceptron1582control98.510.9850.0150.9850.9850.9850.970.9980.998
3172stress
SMO1591control97.610.9760.0220.9770.9760.9760.9530.9770.965
7168stress
Random Forest1600control98.510.9850.0140.9860.9850.9850.9710.9980.999
5170stress
Disclaimer/Publisher’s Note: The statements, opinions and data contained in all publications are solely those of the individual author(s) and contributor(s) and not of MDPI and/or the editor(s). MDPI and/or the editor(s) disclaim responsibility for any injury to people or property resulting from any ideas, methods, instructions or products referred to in the content.

