Article

Optimized Tensor Decomposition and Principal Component Analysis Outperforming State-of-the-Art Methods When Analyzing Histone Modification Chromatin Immunoprecipitation Profiles

1
Department of Computer Science, King Abdulaziz University, Jeddah 21589, Saudi Arabia
2
The School of Computer Science and Engineering, Vellore Institute of Technology, Vellore 21389, India
3
Department of Physics, Chuo University, Tokyo 112-8551, Japan
*
Author to whom correspondence should be addressed.
Algorithms 2023, 16(9), 401; https://doi.org/10.3390/a16090401
Submission received: 21 July 2023 / Revised: 20 August 2023 / Accepted: 21 August 2023 / Published: 23 August 2023
(This article belongs to the Special Issue Supervised and Unsupervised Classification Algorithms (2nd Edition))

Abstract

:
It is difficult to identify histone modification from datasets that contain high-throughput sequencing data. Although multiple methods have been developed to identify histone modification, most of these methods are not specific to histone modification but are general methods that aim to identify protein binding to the genome. In this study, tensor decomposition (TD) and principal component analysis (PCA)-based unsupervised feature extraction with optimized standard deviation were successfully applied to gene expression and DNA methylation. The proposed method was used to identify histone modification. Histone modification along the genome is binned within the region of length L. Considering principal components (PCs) or singular value vectors (SVVs) that PCA or TD attributes to samples, we can select PCs or SVVs attributed to regions. The selected PCs and SVVs further attribute p-values to regions, and adjusted p-values are used to select regions. The proposed method identified various histone modifications successfully and outperformed various state-of-the-art methods. This method is expected to serve as a de facto standard method to identify histone modification. For reproducibility and to ensure the systematic analysis of our study is applicable to datasets from different gene expression experiments, we have made our tools publicly available for download from gitHub.

1. Introduction

Identification of histone modification [1] from high-throughput sequencing (HTS) datasets is important for the following reasons:
  • Histone modification contributes to various functional genomic features, including transcription [2] and alteration of chromatin structures [3].
  • In contrast to variable gene expression, histone modification is more stable [4]; thus, it may be used to characterize the state of the genome.
  • In contrast to DNA methylation, which has only two states, methylated or not, histones are modified in various ways. Thus, histone modification is related to a more detailed functionality of the genome [5].
  • Since histone modification may activate or suppress transcription, combinations of various histone modifications may have more complicated transcriptional roles [6].
Despite the importance of histone modification, gene expression and DNA methylation have instead been the focus of genomic studies for the following reasons.
  • To identify histone modification throughout the genome, the detection of antibody binding to the entire genome is required [7]. In contrast, gene expression can be detected only if transcription start sites are sequenced.
  • In contrast to gene expression that can be measured only when exons are considered or DNA methylation that is meaningful only if promoter regions are considered, specific regions of the genome cannot be used due to limited knowledge of the position-specific functionality of histone modification [8].
  • Because of these two reasons, HTS for histone modification requires more depth, which is both time-consuming and expensive [9].
  • Similarly, the number of datasets and computational resources required to identify histone modification is greater than that required to measure gene expression and DNA methylation [10].
Possibly because of its unpopularity, fewer methods specific to histone modification have been developed.
In general, histone modification is measured to identify proteins that can bind to specific histone modifications. After fixing the binding of proteins to histone modifications, the remaining part without histone modification is digested and removed. Only the DNA sequences to which proteins bind remain and are mapped to the genome sequence. Therefore, the input datasets are profiles of the amount of proteins that bind to DNA sequences where specific histone modifications occur. This technology is called ChIP-seq.
Because histone modification is often measured using chromatin immunoprecipitation sequencing (ChIP-seq) technology to identify protein binding sites on DNA [9], so-called peak-call programs [11] developed to process protein binding to DNA via ChIP-seq have often been used to process HTS datasets used for histone modification. However, because histone modifications are hardly regarded as distributed over the genome by forming peaks, these peak-calling algorithms are not guaranteed to identify histone modification. For example, most methods employ binomial distributions to identify the amount of histone modification over the genome [12], but we are unsure if these methods are suitable. A more flexible method that does not assume a specific distribution of histone modification over the whole genome is required.
To fulfill this requirement, the method of tensor decomposition (TD)- and principal component analysis (PCA)-based unsupervised feature extraction (FE) with optimized standard deviation (SD) that was successfully applied to gene expression [13] and DNA methylation [14] was tested to determine if histone modification could also be identified. In contrast to two previous studies [13,14] where PC or SVVs obey the Gaussian distribution, which is assumed in the null hypothesis after SD optimization, in our method, PC and SVVs follow a mixed Gaussian distribution. Nevertheless, empirically, SD optimization allows the correct identification of histone modification to some extent, even when compared to various state-of-the-art methods.
The following is the structure of the rest of this manuscript.
In the next section, Materials and Methods, we first list the histone modification profiles to be analyzed and discuss the preprocessing applied to these profiles. Then, we briefly introduce PCA- and TD-based unsupervised FE, which are employed in this study. We also introduce the enrichment analysis used for performance evaluation and the methods used for performance comparison.
In Section 3, we first test a specific histone modification profile, H2K9me3, retrieved from GSE24850, using PCA-based unsupervised FE. We then validate the performance of other methods using this profile. Next, we test various histone modification profiles other than H3K9me3. Finally, we test TD-based unsupervised FE. Section 4 and Section 5 follow.
Our main contribution is that we can successfully identify histone modifications without assuming the so-called “peak-calling” concept. This is a very promising aspect of this study, as it opens the door to more flexible conceptualizations of histone modification identification.

2. Materials and Methods

Figure 1 shows the schematic diagram of the analyses in this study.

2.1. Histone Modification Profiles

The histone modification profiles in Table 1 have been used to evaluate the performance of the proposed method. All profiles were retrieved from the Gene Expression Omnibus (GEO) database [15].

2.2. Histone Modification Profile Preprocessing

To apply the proposed method to histone modification profiles, individual histone modification profiles must share region index i. Therefore, the amount of histone modification is averaged within shared regions that are generated by dividing the whole human or mouse genome into equal length, L, intervals in each chromosome. L = 1 , 000 is used for all histone profiles except H3K9me3, for which L = 25,000 is used.
There are two kinds of bed formats for histone modification. One is coarse-grained histone modification, where histone modification is averaged within intervals; the other is the genomic loci, where histone modification occurs. For the former, coarse-grained values are further averaged with the region of length L; for the latter, the regions overlapping the regions of length L are counted.

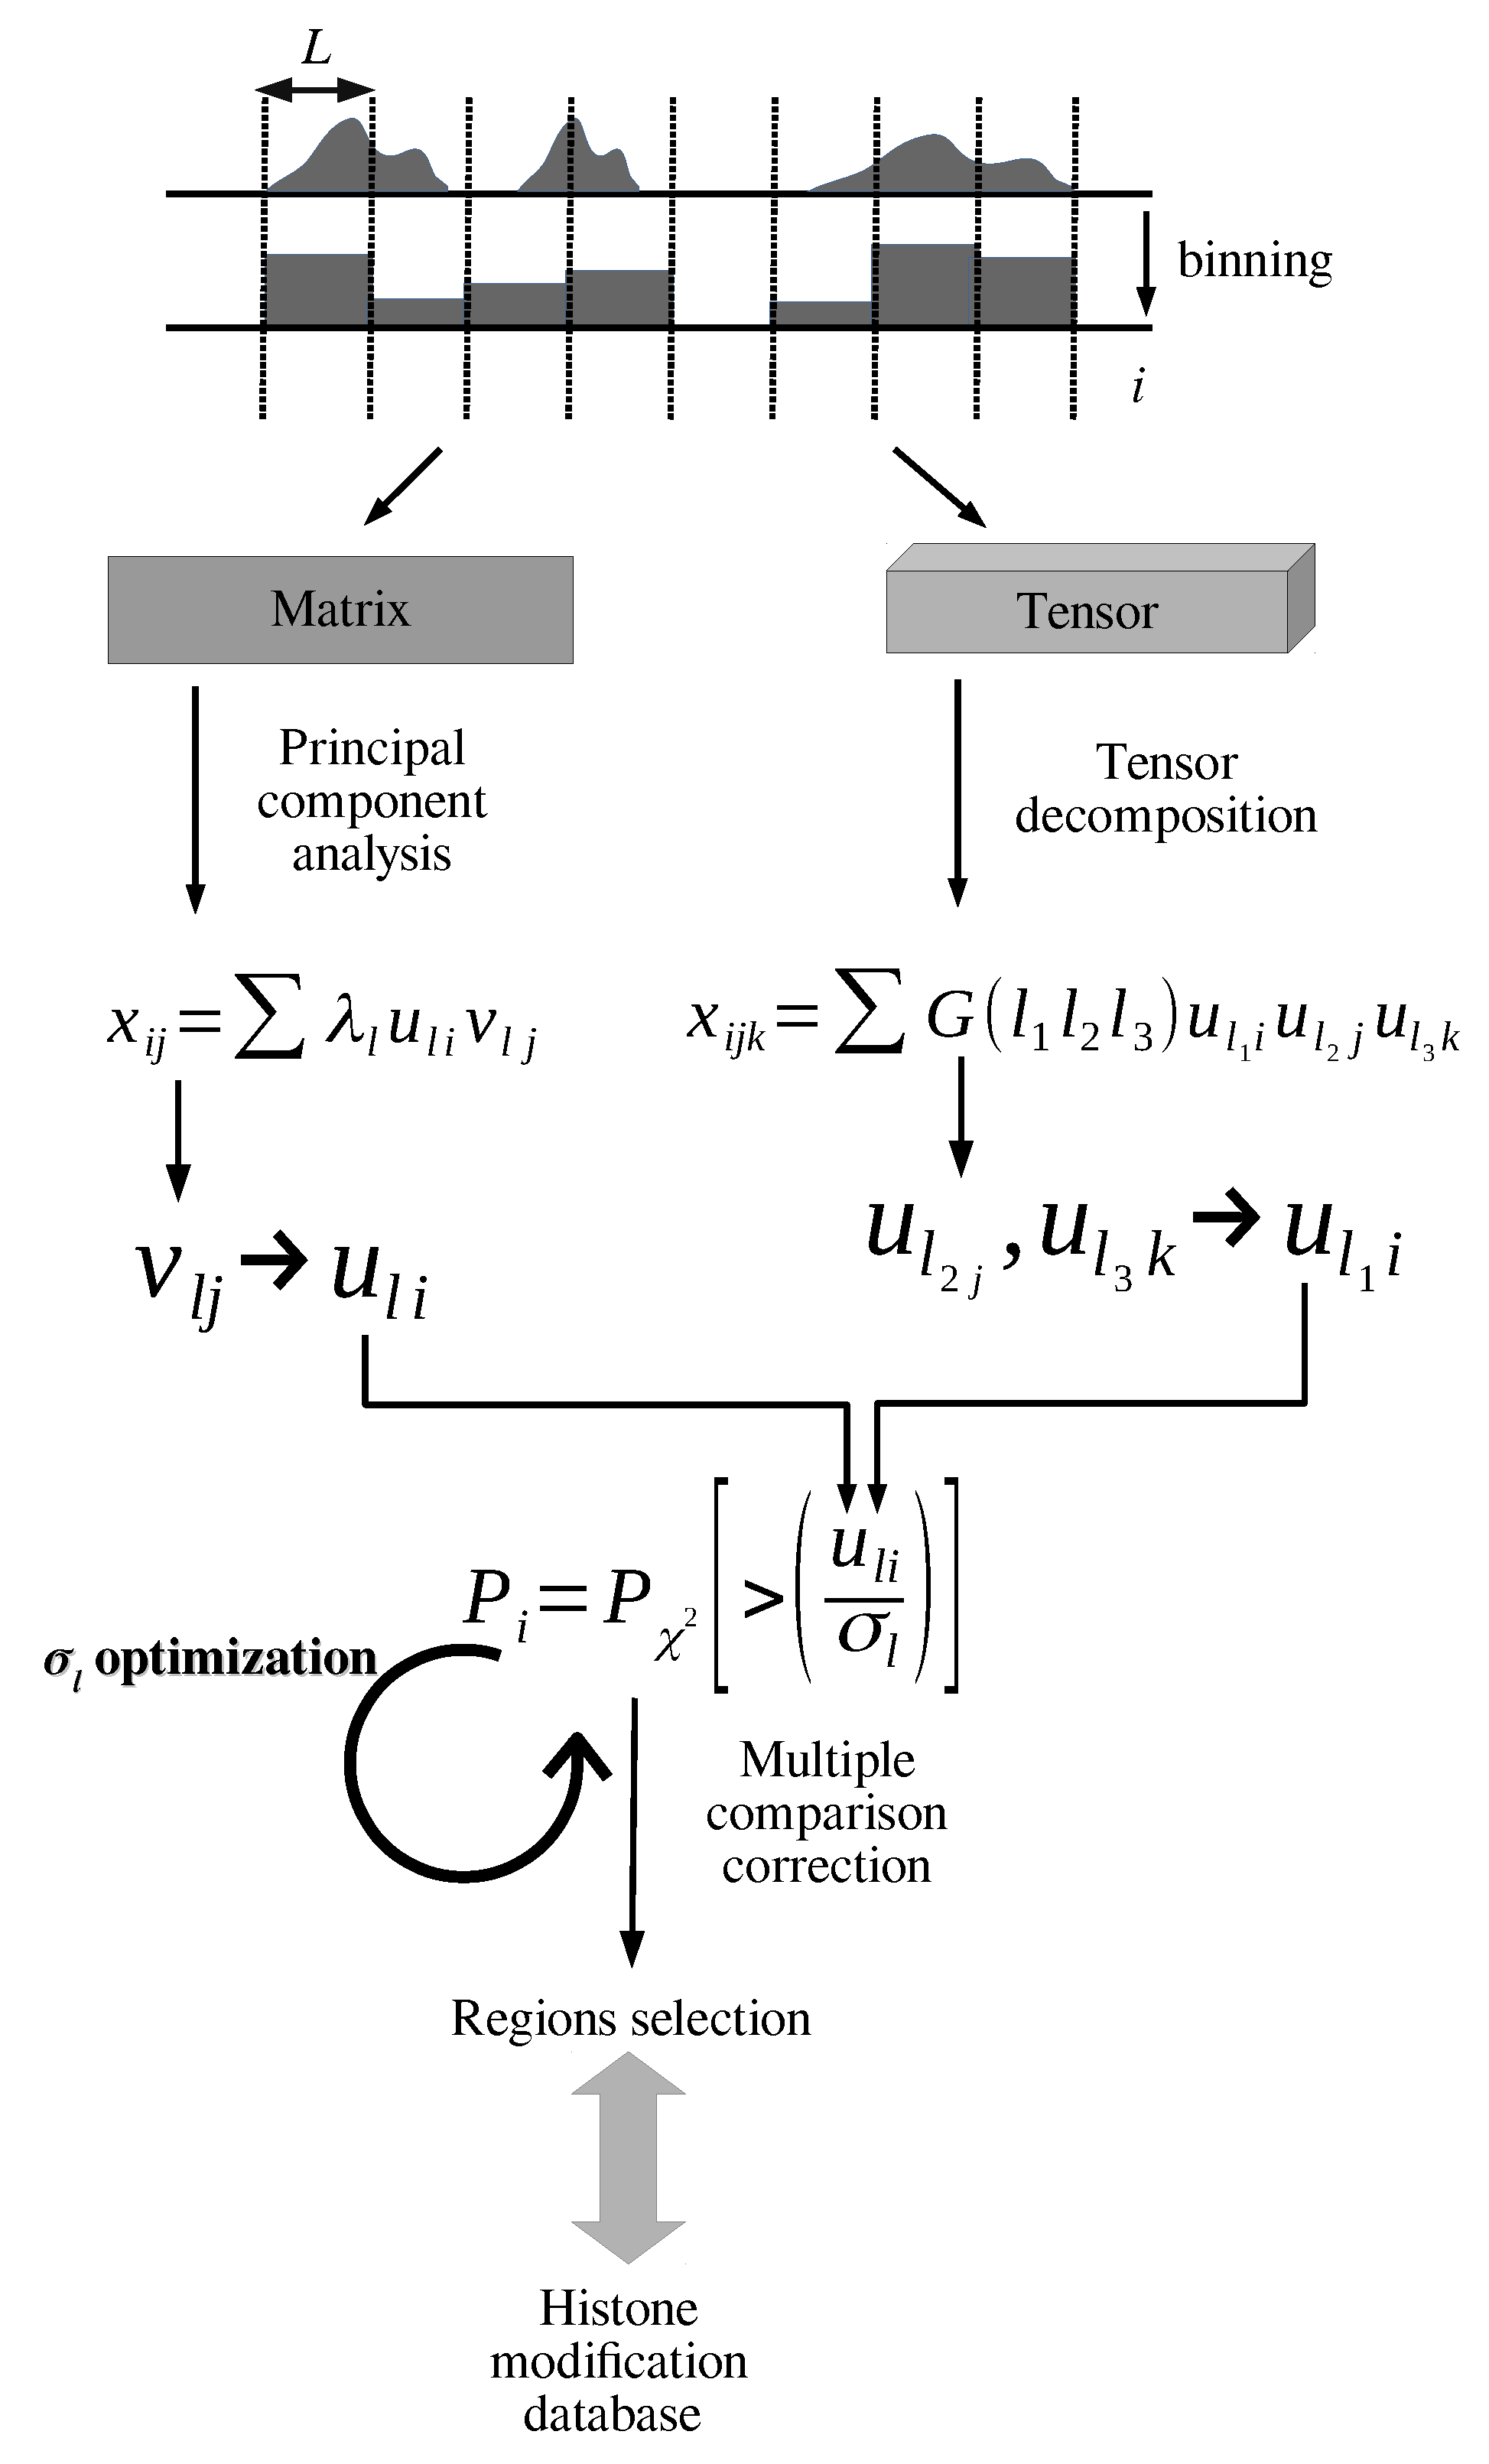
2.3. PCA-Based Unsupervised FE with Optimized SD

In our work, we used the PCA-based unsupervised FE with an optimized SD method. In the literature, few proposed methods have dealt with PCA-based unsupervised feature extraction; such methods can be found in previous studies [13,14]. It is briefly described in the following section.
Suppose histone modification profiles are formatted as a matrix x i j R N × M that represents histone modification of ith regions in jth samples. Here, we assume that x i j is normalized as
i = 1 N x i j = 0 ,
i = 1 N x i j 2 = N .
Applying PCA to x i j should obtain
x i j = = 1 min ( N , M ) λ u i v j ,
where
i u i u i = j v j v j = δ .
To obtain u i , the eigenvalues and vector of j x i j x i j R N × N must be obtained as
i j x i j x i j u i = λ u i ,
and v j can be obtained as
v j = i u i x i j .
To select regions of interest, i, first, the v j associated with the desired property is identified. In this study, the property of interest is histone modification that is independent of samples (i.e., biological replicates); that is, v j should be independent of j (biological replicates) as well. When samples are composed of treated samples and controls, v j associated with distinction between controls and treate samples are employed. After identifying of interest, an optimal SD of u i is obtained such that u i obeys the Gaussian distribution (null hypothesis) as much as possible.
SD optimization can be performed as follows. First, p-values are attributed to the ith region as
P i = P χ 2 > u i σ 2 ,
where P χ 2 [ > x ] is the cumulative χ 2 distribution where the argument is larger than x and σ is the SD. Then, the histogram h s of P i is computed, which is the number of is that satisfy
s N s 1 P i s + 1 N s , 0 s N s 1 .
h s is expected to have constant values for s s 0 , with some s 0 , and a sharp peak exists at k 0 < k . In this case, is included in h s , s > s 0 are selected based on association with significant histone modification. N s is the total number of bins taken to be 100. Next, P i s are recomputed with optimized SD, the obtained P i s are corrected using the BH criterion [24], and is with adjusted P i s less than 0.01 are selected.

2.4. TD-Based Unsupervised FE with Optimized SD

We show how PCA is replaced with TD. Suppose that histone modification is formatted as a tensor x i j k R N × M × K in the ith region of the jth sample under the kth condition, and TD is obtained as
x i j k = 1 = 1 N 2 = 1 M 3 = 1 K G ( 1 2 3 ) u 1 i u 2 j u 3 k
where G R N × M × K and
i u 1 i u 1 i = δ 1 1 ,
j u 2 j u 2 j = δ 2 2 ,
k u 3 k u 3 k = δ 3 3 ,
with higher-order singular value decomposition (HOSVD [24]). After identifying 2 and 3 of interest by investigating the dependence of u 2 j and u 3 k on j and k, the u 1 i associated with absolutely the largest G is selected using the selected 2 and 3 . The following procedure is the same as above.

2.5. Performance Evaluation by Enrichr

After the regions were selected, Entrez gene IDs included in these regions were listed and were converted to gene symbols using the gene ID converter implemented in DAVID [25,26]. The obtained list of gene symbols was uploaded to Enrichr [27]. The primary “Epigenomics Roadmap HM ChIP-seq” category was employed to evaluate the performance, and the “ENCODE Histone Modifications 2015” category was additionally used for the evaluation if no significant results were obtained in the “Epigenomics Roadmap HM ChIP-seq” category using the proposed method.

2.6. Methods for Comparison

The methods used for comparison in the proposed method (Table 2) were selected based on the following criteria.
  • The method must accept bed or bigWig file formats as input, since the proposed method cannot accept the sam/bam format as input, which is used by the most popular methods.
  • The method must be stand-alone (not web-based).
  • The method must be performed on the Linux platform.
  • The method must be implemented as free (open) software.
The dataset tested was GSE24850 (H3K9me3).

3. Results

A full list of genes and the enrichment analysis are in the Supplementary Materials.

3.1. GSE24850

3.1.1. PCA-Based Unsupervised FE with Optimized SD

The proposed method was applied to H3K9me3 modifications in the GSE24850 dataset. PCA was applied to three saline-treated samples and two cocaine samples (five samples in total). The first PC loading, v 1 j , attributed to samples was independent of j attributed to samples. Then, the corresponding first PC score, u 1 i , was used for gene selection. SD was optimized, and the SD = 0.04264199. The histogram of 1 P i appeared to be a combination of two Gaussian distributions, as opposed to a single Gaussian distribution (Figure 2). A small number of regions (1302) were selected among a total of 106,204 regions (i.e., only a few percentages), and the associated 894 Entrez gene IDs were identified. The gene IDs were converted to 641 gene symbols, which were uploaded to Enrichr. Table 3 shows the enriched histone modification associated with adjusted p-values of less than 0.05. All were H3K9me3 modifications, suggesting that the proposed method was successful. In addition, 5 out of 10 were brain-related, which was coincident with GSE24850 comprising experiments that used the nucleus accumbens, strengthening the success of the proposed method.

3.1.2. Comparisons with State-of-the-Art Methods

Although the proposed method performed successfully, if other state-of-the-art methods perform similarly, the importance of the proposed method drastically decreases. To reject this possibility, various state-of-the-art methods were used to analyze the GSE24850 dataset. No state-of-the-art method had a comparative performance.

MOSAiCS

The first state-of-the-art method tested was MOSAiCS. Since MOSAiCS only accepts a pair of ChIP-seq and input datasets (i.e., a control), MOSAiCS was repeatedly applied to five pairs of ChIP-seq data (i.e., three saline and two cocaine samples) and one input profile. MOSAiCS identified 4367, 3648, 2096, 1985, and 5566 peak regions and 1833, 1599, 1136, 1018, and 2223 associated Entrez gene IDs. Finally, 994, 851, 567, 532, and 1184 gene symbols were identified. Next, these five sets of genes were uploaded to Enrichr one by one and the number of histone modifications that were significantly enriched in the “Epigenomics Roadmap HM ChIP-seq” category of Enrichr was determined.
Table 4 shows the performance of MOSAiCS, which identifies at most only three significantly enriched histone modifications, of which two, at most, are H3K9me3 modifications. Since the proposed method identified as many as 10 enriched histone modifications, all of which are H3K9me3 modifications, the proposed method outperforms MOSAiCS.

DFilter

The next state-of-the-art method tested was DFilter, which was also applied to the five pairs of data. DFilter identified 25,080, 22,863, 21,371, 23,811, and 23,369 peak regions and 6286, 5721, 5407, 5987, and 5903 Entrez gene IDs, of which 2621, 2524, 2499, 2631, and 2544 gene symbols were associated with each of the five pairs. These sets of gene symbols were uploaded to Enrichr and no enriched H3K9me3 modifications were observed (Table 4). Thus, the proposed method outperforms DFilter.

F-Seq2

The F-Seq2 method could not be performed with the available computer memory. Therefore, we could not compare the performance of F-Seq2 to the proposed method.

HOMER

The next state-of-the-art method was HOMER, which has been used in the ENCODE project and has been used for recent reports [35]. HOMER has the capability to compare five input profiles directly with five H3K9me3 profiles. Using this capability, HOMER identified 114,727 peak regions, 6771 associated Entrez genes, and 6747 gene symbols, which were uploaded to Enrichr. Unfortunately, Enrichr did not identify enriched regions of H3K9me3 modifications (Table 4).

RSEG

The last comparison was with the state-of-the-art method RSEG, which resulted in a core dump, although no compile errors were detected. The RSEG demo file also could not be treated without errors; it was too old to be used on the present platform. Although it has been cited many times as a popular tool with which to process ChIP-seq datasets, it has not been tested in recent publications.

3.2. Histone Modification Other than H3K9me3

Although the superiority of the proposed method has been demonstrated using H3K9me3 profiles, one of five “core histone marks” proposed by the Roadmap Epigenomics Consortium [36] (H3K4me1/H3K27ac, H3K4me3, H3K36me3, H3K27me3, and H3K9me3), there is a possibility that the proposed method is not effective with other histone modifications. To reject this possibility, the proposed method was tested on various other histone modifications.

3.2.1. GSE159075

Regions, is, with non-zero missing values among three samples were discarded in advance. PCA was applied to three samples with the same histone modification (H3K4me3, H3K27me3, or H3K27ac) and v 1 j was always associated with the independence of j (biological replicates). Next, the corresponding first PC score, u 1 i , was used for gene selection. SDs were optimized, and the SD = 0.19218492 (H3K4me3), 0.8650455 (H3K27me3), and 0.3911769 (H3K27ac). The histogram of 1 P i seemed to obey a combination of two Gaussian distributions, and not a single Gaussian distribution (Figure 3). As a result, 34,538, 62,141, and 61,306 regions were selected, and 13,692, 5217, and 11,604 Entrez gene IDs were identified. The 13,671, 5208, and 11,590 gene symbols associated with the gene IDs were identified and uploaded to Enrichr. Table 5 shows the performance evaluation by Enrichr and demonstrates the success of the proposed method.

3.2.2. GSE74055

PCA was applied to 16 H3K4me1 modifications divided by the corresponding input (regions, is, for which input samples were zero, were discarded in advance). The u 1 i could not provide reasonable results, so u 2 i was used for gene selection. SDs were optimized, and the SD = 0.1873585. Figure 4 shows the histogram of 1 P i with optimized SD. Next, 61,329 regions, 11,890 Entrez gene IDs, and 11,858 gene symbols were identified. The gene symbols were uploaded to Enrichr. Table 5 shows the performance evaluation by Enrichr. Its superiority was reduced since no enriched H3K4me1 modifications were identified for the “Epigenomics Roadmap HM ChIP-seq” category. The other category “ENCODE Histone Modifications 2015”, which had more enriched histone modifications, needs to be consulted. Regardless, non-zero enriched H3K4me1 profiles could be detected in Enrichr.

3.2.3. GSE124690

PCA was applied to six H3K4me1, four H3K4me3, and four H3K27ac ChIP-seq profiles separately, and v 1 j was always associated with the independence of j (biological replicates). However, v 2 j was used for H3K4me1 modifications as u 1 i could not provide good results. Next, the corresponding first PC score, u 1 i , was used for gene selection for H3K4me3 and H3K27ac modifications, and the second PC score, u 2 i , was used for gene selection for H3K4me1 modifications. SDs were optimized, and the SD = 0.5468109 (H3K4me1), 0.5600861 (H3K4me3), and 0.4509331 (H3K27ac). The histogram of 1 P i seemed to obey a combination of two Gaussian distributions and not a single Gaussian distribution (Figure 5). A total of 164,466, 37,534, and 81,249 regions, 14,893, 14,972, and 13,061 Entrez gene IDs, and 14,866, 14,946, and 13,061 gene symbols (second PC was used for H3K4me1) were identified. The gene symbols were uploaded to Enrichr. Table 5 shows the performance evaluation by Enrichr. Again, its superiority toward H3K4me1 modifications was reduced since no enriched H3K4me1 modifications were identified for the “Epigenomics Roadmap HM ChIP-seq” or “ENCODE Histone Modifications 2015” categories. For the other two histone modifications, Enrichr was successful.

3.2.4. GSE188173

PCA was applied to 16 H3K27ac profiles and v 1 j was always associated with the independence of j (biological replicates). Next, the corresponding first PC score, u 1 i , was used for gene selection. SDs were optimized, and the SD = 0.5319398. Figure 6 shows the histogram of 1 P i with optimized SD. A total of 105,438 regions, 15,579 Entrez gene IDs, and 15,548 gene symbols were identified that were uploaded to Enrichr. Table 5 shows the performance evaluation by Enrichr, which demonstrates the success of the proposed method.

3.2.5. GSE159022

PCA was applied to H3K27me3 ChIP-seq profiles and v 1 j was always associated with the independence of j (biological replicates). Then, the corresponding first PC score, u 1 i , was used for gene selection. SDs were optimized, and the SD = 0.06544008. Figure 7 shows the histogram of 1 P i with optimized SD. A total of 55,923 regions, 5022 Entrez gene IDs, and 4996 gene symbols were identified. The gene symbols were uploaded to Enrichr. Table 5 shows the performance evaluation by Enrichr, which demonstrates the success of the proposed method.

3.2.6. GSE168971

PCA was applied to six H3K9ac ChIP-seq profiles and two corresponding inputs. v 1 j was distinct between treated and control samples. Next, the corresponding first PC score, u 1 i , was used for gene selection. SDs were optimized, and the SD = 0.3697877. Figure 8 shows the histogram of 1 P i with optimized SD. A total of 58,490 regions, 15,460 Entrez gene IDs, and 15,452 gene symbols were identified. The gene symbols were uploaded to Enrichr. Table 5 shows the performance evaluation by Enrichr. Its performance for H3K9ac modifications was reduced since the “ENCODE Histone Modifications 2015” category had to be consulted, and it only identified six enriched H3K9ac profiles in the “ENCODE Histone Modifications 2015” category.

3.2.7. GSE159411

PCA was applied to four H3K36me3 ChIP-seq profiles. v 1 j was always associated with the independence of j (biological replicates). Then, the corresponding first PC score, u 1 i , was used for gene selection. SDs were optimized, and the SD = 0.6005592. Figure 9 shows the histogram of 1 P i with optimized SD. A total of 253,326 regions, 12,282 Entrez gene IDs, and 12270 gene symbols were identified. The gene symbols were uploaded to Enrichr. Table 5 shows the Enrichr performance evaluation, which demonstrates the success of the proposed method.

3.2.8. GSE181596

PCA was applied to four H3K27me3 ChIP-seq profiles. v 1 j was always associated with the independence of j (biological replicates). Next, the corresponding first PC score, u 1 i , was used for gene selection. SDs were optimized, and the SD = 1.855494. Figure 10 shows the histogram of 1 P i with optimized SD. A total of 36,972 regions, 3543 Entrez gene IDs, and 3545 gene symbols were identified. The gene symbols were uploaded to Enrichr. Table 5 shows the Enrichr performance evaluation, which demonstrates the success of the proposed method.

3.3. TD-Based Unsupervised FE with Optimized SD

All of these experiments used PCA. To determine whether TD-based unsupervised FE with optimized SD worked as well, TD-based unsupervised FE with optimized SD was used to analyze the GSE74005 dataset. This dataset did not work well with the PCA-based unsupervised FE with the optimized SD method. Histone modification was formatted as a tensor x i j k R N × 16 × 2 that represented H3K4me1 modifications in the ith region of the jth sample in the kth treatment ( k = 1 : treated, k = 2 : input). After obtaining SVVs, u 1 j and u 2 k were coincidences with the independence of the samples, and the distinction between the treated and controlled samples. G ( 2 , 1 , 2 ) had the largest absolute value, thus u 2 i was used to select regions. As a result, a total of 70,187 regions, the associated 14,220 Entrez gene IDs, and 14,187 gene symbols have been identified. Although these numbers are not so different from those in Table 5, performance is improved (Table 5). Thus, when PCA does not work, TD is also worth testing.

4. Discussion

The proposed method has several advantages. First, it is a fully linear method that simply applies PCA or HOSVD to matrices and tensors. The only time-consuming process is SD optimization, which typically ends in a few minutes. Second, the proposed method accepts the bed or the bigWig file formats. In contrast to bam/sam files that retain information about how individual short reads are mapped onto the genome, bed or bigWig files do not keep this information and instead retain which regions of the short reads are mapped. Third, it is robust. Independent of samples, species, and platforms, the proposed method achieved similar performance levels. For example, the H3K27me3 modification is considered three times in Table 5; two are human ChIP-seq, and one is mouse ChIP-seq. Despite the different species, all three are associated with a similar number of gene symbols, 5208, 4994, and 3545, and they are all associated with the same number of enriched H3K27me3 profiles in the “Epigenomics Roadmap HM ChIP-seq” category of Enrichr. H3K27ac modifications were considered three times with two distinct protocols, ChIP-seq and CUT&Tag. A similar number of gene symbols, 11,590, 13,061, and 15,548, and the same number of H3K27ac-enriched profiles, 24, in the “Epigenomics Roadmap HM ChIP-seq” category of Enrichr were associated. Usually, although CUT&Tag requires protocols specific to CUT&Tag [19], the proposed method handled both ChIP-seq and CUT&Tag seamlessly. In addition, as seen in Table 4 and Table 5, the proposed method successfully deals with all five “core histone marks” (H3K27ac, H3K4me3, H3K36me3, H3K27me3, and H3K9me3). Unfortunately, H3K4me1 cannot be properly dealt with using the proposed method. However, this is not a critical problem, since it can process H3K27ac modifications, which are strongly associated with H3K4me1 modifications [37]. Thus, the proposed method is still worth investigating.
In the above, u i does not obey a Gaussian distribution, but instead fits a combination of two Gaussian distributions. To confirm these points, the analysis of the Gaussian mixture to u 1 i of the GSE24850 dataset was applied (whose histogram 1 P i is shown in Figure 2). Gaussian mixture analysis was performed using the mclust package [38] in R [30]. The mclust function was applied to u 1 i for GSE24850. Then, the Bayesian information criterion of the Gaussian mixture drastically improves when the number of clusters increases from one to two and does not improve for more numbers of clusters. Table 6 shows the confusion matrix between clustering and selection of the proposed method when the number of assumed clusters varies from two to four. It is obvious that they are in agreement only when the number of clusters is assumed to be two, as expected. All regions not selected by the proposed method are in one cluster, and the majority of the selected regions belong to another cluster, whereas this does not occur when the number of assumed clusters is either three or four. Thus, as expected, u i did not obey a Gaussian distribution, but a mixture of two Gaussian distributions. Since the optimization of SD assumes a single Gaussian distribution, it is not expected to work well, but it does work well empirically (Table 5). The limitations of the proposed methods applied to histone modification must be investigated in the future.
The proposed method has some weaknesses. It does not work well if it is applied to non-core histone marks. For example, its performance is reduced if it is applied to H3K9ac modifications. More detailed conditions in which the proposed method may be successfully applied to histone modification need to be investigated. In addition, we do not know how the proposed method outperforms the previous state-of-the-art methods. It is important to note that the proposed method is an unsupervised method. In contrast to the other methods that must assume some statistical properties on histone modification distribution along the genome, the proposed method assumes only that PCs and SVVs obtained obey Gaussian distributions. Other methods can be successfully applied to gene expression [13] and DNA methylation [14] because target specific methods can be developed. However, since no assumptions about the statistical properties of histone modification can be made, other methods are not robust when applied to identification of histone modification. The proposed method can infer histone modification correctly.

5. Conclusions

In this paper, a recently proposed PCA-based unsupervised FE with optimized SD was applied to identify histone modifications. After histone modifications were averaged over bins of length L nucleotides, PCA- and TD-based unsupervised FE were applied to the various histone modification profiles: H3K4me3, H3K27me3, H3K27ac, H3K4me1, H3K4me3, H3K9ac, and H3K36me3. After identifying the principal components (PCs) and singular value vectors (SVVs) that are coincident with the class labels, the corresponding PCs and SVVs that are attributed to bins are selected. The selected regions included in bins are then biologically evaluated. It successfully counted five core histone marks and outperformed the state-of-the-art methods. The proposed method is expected to be a new state-of-the-art method for histone modification. In the future, it is expected that more data-driven histone modification processing software will be developed. Most existing tools are based on the concept of "peak calling," which is not always biologically justified. By investigating the histone modification distribution within the regions in the selected bins, it is expected that more reasonable assumptions about histone modification distribution can be identified.

Supplementary Materials

A full list of genes and the enrichment analysis are in the Supplementary Materials downloaded at: https://www.mdpi.com/article/10.3390/a16090401/s1. They include several excel files whose contents can be easily understood by file names.

Author Contributions

Y.-H.T. planned the research and performed analyses. T.T., S.S.R., and Y.-H.T. evaluated the results, discussions, outcomes and wrote and reviewed the manuscript. All authors have read and agreed to the published version of the manuscript.

Funding

This work was supported by KAKENHI (grant numbers 20H04848 and 20K12067) to Y.-H.T.

Data Availability Statement

Supplementary files and sample R code to perform analyses in this study can be found at https://github.com/tagtag/PCAUFEOPSDHM (accessed on 20 August 2023).

Conflicts of Interest

The authors declare no conflict of interest. The funders had no role in the design of the study; in the collection, analyses, or interpretation of data; in the writing of the manuscript; or in the decision to publish the results.

References

  1. Nakato, R.; Sakata, T. Methods for ChIP-seq analysis: A practical workflow and advanced applications. Methods 2021, 187, 44–53. [Google Scholar] [CrossRef] [PubMed]
  2. Berger, S.L. Histone modifications in transcriptional regulation. Curr. Opin. Genet. Dev. 2002, 12, 142–148. [Google Scholar] [CrossRef] [PubMed]
  3. Bannister, A.J.; Kouzarides, T. Regulation of chromatin by histone modifications. Cell Res. 2011, 21, 381–395. [Google Scholar] [CrossRef] [PubMed]
  4. Gruppuso, P.A.; Boylan, J.M.; Zabala, V.; Neretti, N.; Abshiru, N.A.; Sikora, J.W.; Doud, E.H.; Camarillo, J.M.; Thomas, P.M.; Kelleher, N.L.; et al. Stability of histone post-translational modifications in samples derived from liver tissue and primary hepatic cells. PLoS ONE 2018, 13, e0203351. [Google Scholar] [CrossRef]
  5. Millán-Zambrano, G.; Burton, A.; Bannister, A.J.; Schneider, R. Histone post-translational modifications—Cause and consequence of genome function. Nat. Rev. Genet. 2022, 23, 563–580. [Google Scholar] [CrossRef]
  6. Zhang, T.; Cooper, S.; Brockdorff, N. The interplay of histone modifications - writers that read. EMBO Rep. 2015, 16, 1467–1481. [Google Scholar] [CrossRef]
  7. Bock, I.; Dhayalan, A.; Kudithipudi, S.; Brandt, O.; Rathert, P.; Jeltsch, A. Detailed specificity analysis of antibodies binding to modified histone tails with peptide arrays. Epigenetics 2011, 6, 256–263. [Google Scholar] [CrossRef] [PubMed]
  8. van Leeuwen, F.; van Steensel, B. Histone modifications: From genome-wide maps to functional insights. Genome Biol. 2005, 6, 113. [Google Scholar] [CrossRef] [PubMed]
  9. O’Geen, H.; Echipare, L.; Farnham, P.J. Using ChIP-Seq Technology to Generate High-Resolution Profiles of Histone Modifications. In Methods in Molecular Biology; Humana Press: New York, NY, USA, 2011; pp. 265–286. [Google Scholar] [CrossRef]
  10. Shah, S.G.; Mandloi, T.; Kunte, P.; Natu, A.; Rashid, M.; Reddy, D.; Gadewal, N.; Gupta, S. HISTome2: A database of histone proteins, modifiers for multiple organisms and epidrugs. Epigene. Chromatin 2020, 13, 31. [Google Scholar] [CrossRef]
  11. Thomas, R.; Thomas, S.; Holloway, A.K.; Pollard, K.S. Features that define the best ChIP-seq peak calling algorithms. Briefings Bioinform. 2016, 18, 441–450. [Google Scholar] [CrossRef]
  12. Flensburg, C.; Kinkel, S.A.; Keniry, A.; Blewitt, M.E.; Oshlack, A. A comparison of control samples for ChIP-seq of histone modifications. Front. Genet. 2014, 5, 329. [Google Scholar] [CrossRef] [PubMed]
  13. Taguchi, Y.h.; Turki, T. Adapted tensor decomposition and PCA based unsupervised feature extraction select more biologically reasonable differentially expressed genes than conventional methods. Sci. Rep. 2022, 12, 17438. [Google Scholar] [CrossRef] [PubMed]
  14. Taguchi, Y.H.; Turki, T. Principal component analysis- and tensor decomposition-based unsupervised feature extraction to select more suitable differentially methylated cytosines: Optimization of standard deviation versus state-of-the-art methods. Genomics 2023, 115, 110577. [Google Scholar] [CrossRef] [PubMed]
  15. Edgar, R.; Domrachev, M.; Lash, A.E. Gene Expression Omnibus: NCBI gene expression and hybridization array data repository. Nucleic Acids Res. 2002, 30, 207–210. [Google Scholar] [CrossRef] [PubMed]
  16. Maze, I.; Feng, J.; Wilkinson, M.B.; Sun, H.; Shen, L.; Nestler, E.J. Cocaine dynamically regulates heterochromatin and repetitive element unsilencing in nucleus accumbens. Proc. Natl. Acad. Sci. USA 2011, 108, 3035–3040. [Google Scholar] [CrossRef] [PubMed]
  17. Kanki, Y.; Muramatsu, M.; Miyamura, Y.; Kikuchi, K.; Higashijima, Y.; Nakaki, R.; Suehiro, J.; Sasaki, Y.; Kubota, Y.; Koseki, H.; et al. Bivalent-histone-marked immediate-early gene regulation is vital for VEGF-responsive angiogenesis. Cell Rep. 2022, 38, 110332. [Google Scholar] [CrossRef]
  18. Yan, J.; Chen, S.A.A.; Local, A.; Liu, T.; Qiu, Y.; Dorighi, K.M.; Preissl, S.; Rivera, C.M.; Wang, C.; Ye, Z.; et al. Histone H3 lysine 4 monomethylation modulates long-range chromatin interactions at enhancers. Cell Res. 2018, 28, 204–220. [Google Scholar] [CrossRef]
  19. Kaya-Okur, H.S.; Wu, S.J.; Codomo, C.A.; Pledger, E.S.; Bryson, T.D.; Henikoff, J.G.; Ahmad, K.; Henikoff, S. CUT&Tag for efficient epigenomic profiling of small samples and single cells. Nat. Commun. 2019, 10, 1930. [Google Scholar] [CrossRef]
  20. Wei, X.; Lienhard, M.; Murgai, A.; Franke, J.; Pöhle-Kronawitter, S.; Kotsaris, G.; Wu, H.; Börno, S.; Timmermann, B.; Glauben, R.; et al. Neurofibromin 1 controls metabolic balance and Notch-dependent quiescence of juvenile myogenic progenitors. bioRxiv 2021. [Google Scholar] [CrossRef]
  21. Sarode, G.V.; Neier, K.; Shibata, N.M.; Shen, Y.; Goncharov, D.A.; Goncharova, E.A.; Mazi, T.A.; Joshi, N.; Settles, M.L.; LaSalle, J.M.; et al. Wilson Disease: Intersecting DNA Methylation and Histone Acetylation Regulation of Gene Expression in a Mouse Model of Hepatic Copper Accumulation. Cell. Mol. Gastroenterol. Hepatol. 2021, 12, 1457–1477. [Google Scholar] [CrossRef]
  22. Gonzalez-Teran, B.; Pittman, M.; Felix, F.; Thomas, R.; Richmond-Buccola, D.; Hüttenhain, R.; Choudhary, K.; Moroni, E.; Costa, M.W.; Huang, Y.; et al. Transcription factor protein interactomes reveal genetic determinants in heart disease. Cell 2022, 185, 794–814.e30. [Google Scholar] [CrossRef]
  23. Yuan, H.; Suzuki, S.; Terui, H.; Hirata-Tsuchiya, S.; Nemoto, E.; Yamasaki, K.; Saito, M.; Shiba, H.; Aiba, S.; Yamada, S. Loss of IκBζ Drives Dentin Formation via Altered H3K4me3 Status. J. Dent. Res. 2022, 101, 220345221075968. [Google Scholar] [CrossRef] [PubMed]
  24. Taguchi, Y.H. Unsupervised Feature Extraction Applied to Bioinformatics; Springer International Publishing: Berlin/Heidelberg, Germany, 2020. [Google Scholar] [CrossRef]
  25. Huang, D.W.; Sherman, B.T.; Lempicki, R.A. Systematic and integrative analysis of large gene lists using DAVID bioinformatics resources. Nat. Protoc. 2008, 4, 44–57. [Google Scholar] [CrossRef]
  26. Huang, D.W.; Sherman, B.T.; Lempicki, R.A. Bioinformatics enrichment tools: Paths toward the comprehensive functional analysis of large gene lists. Nucleic Acids Res. 2008, 37, 1–13. [Google Scholar] [CrossRef] [PubMed]
  27. Xie, Z.; Bailey, A.; Kuleshov, M.V.; Clarke, D.J.B.; Evangelista, J.E.; Jenkins, S.L.; Lachmann, A.; Wojciechowicz, M.L.; Kropiwnicki, E.; Jagodnik, K.M.; et al. Gene Set Knowledge Discovery with Enrichr. Curr. Protoc. 2021, 1, e90. [Google Scholar] [CrossRef] [PubMed]
  28. Sun, G.; Chung, D.; Liang, K.; Keleş, S. Statistical Analysis of ChIP-seq Data with MOSAiCS. In Methods in Molecular Biology; Humana Press: New York, NY, USA, 2013; pp. 193–212. [Google Scholar] [CrossRef]
  29. Huber, W.; Carey, V.J.; Gentleman, R.; Anders, S.; Carlson, M.; Carvalho, B.S.; Bravo, H.C.; Davis, S.; Gatto, L.; Girke, T.; et al. Orchestrating high-throughput genomic analysis with Bioconductor. Nat. Methods 2015, 12, 115–121. [Google Scholar] [CrossRef]
  30. R Core Team. R: A Language and Environment for Statistical Computing; R Foundation for Statistical Computing: Vienna, Austria, 2022. [Google Scholar]
  31. Kumar, V.; Muratani, M.; Rayan, N.A.; Kraus, P.; Lufkin, T.; Ng, H.H.; Prabhakar, S. Uniform, optimal signal processing of mapped deep-sequencing data. Nat. Biotechnol. 2013, 31, 615–622. [Google Scholar] [CrossRef]
  32. Zhao, N.; Boyle, A.P. F-Seq2: Improving the feature density based peak caller with dynamic statistics. NAR Genom. Bioinform. 2021, 3, lqab012. [Google Scholar] [CrossRef]
  33. Heinz, S.; Benner, C.; Spann, N.; Bertolino, E.; Lin, Y.C.; Laslo, P.; Cheng, J.X.; Murre, C.; Singh, H.; Glass, C.K. Simple Combinations of Lineage-Determining Transcription Factors Prime cis-Regulatory Elements Required for Macrophage and B Cell Identities. Mol. Cell 2010, 38, 576–589. [Google Scholar] [CrossRef]
  34. Song, Q.; Smith, A.D. Identifying dispersed epigenomic domains from ChIP-Seq data. Bioinformatics 2011, 27, 870–871. [Google Scholar] [CrossRef]
  35. Morales, J.; Pujar, S.; Loveland, J.E.; Astashyn, A.; Bennett, R.; Berry, A.; Cox, E.; Davidson, C.; Ermolaeva, O.; Farrell, C.M.; et al. A joint NCBI and EMBL-EBI transcript set for clinical genomics and research. Nature 2022, 604, 310–315. [Google Scholar] [CrossRef] [PubMed]
  36. Kundaje, A.; Meuleman, W.; Ernst, J.; Bilenky, M.; Yen, A.; Heravi-Moussavi, A.; Kheradpour, P.; Zhang, Z.; Wang, J.; Ziller, M.J.; et al. Integrative analysis of 111 reference human epigenomes. Nature 2015, 518, 317–330. [Google Scholar] [CrossRef] [PubMed]
  37. Kang, Y.; Kim, Y.W.; Kang, J.; Kim, A. Histone H3K4me1 and H3K27ac play roles in nucleosome eviction and eRNA transcription, respectively, at enhancers. FASEB J. 2021, 35, e21781. [Google Scholar] [CrossRef] [PubMed]
  38. Scrucca, L.; Fop, M.; Murphy, T.B.; Raftery, A.E. mclust 5: Clustering, Classification and Density Estimation Using Gaussian Finite Mixture Models. R J. 2016, 8, 289–317. [Google Scholar] [CrossRef] [PubMed]
Figure 1. Schematic diagram for processing histone modification data. Histone modification is binned within the region of length L. Binned profiles are integrated as matrices or tensors to which PCA or TD is applied. Obtained v j or u 2 j , u 3 k attributed to samples is used to identify which u i or u 1 i is used to attribute the p-value, P i , to the ith region. P i s are corrected by BH criterion, and regions associated with adjusted p-values less than 0.01 are selected. Enrichment of histone modification in databases is investigated toward the selected regions.
Algorithms 16 00401 g001
Figure 2. Histogram of 1 P i computed using the proposed method for the GSE24850 dataset (H3K9me3).
Algorithms 16 00401 g002
Figure 3. Histogram of 1 P i computed by the proposed method using the GSE159075 dataset (from top to bottom, H3K4me3, H3K27me3, and H3K27ac).
Algorithms 16 00401 g003
Figure 4. Histogram of 1 P i computed by the proposed method using the GSE74055 dataset (H3K4me1).
Algorithms 16 00401 g004
Figure 5. Histogram of 1 P i computed by the proposed method using the GSE124690 dataset (From top to bottom, H3K4me1, H3K4me3, and H3K27ac).
Algorithms 16 00401 g005
Figure 6. Histogram of 1 P i computed by the proposed method using the GSE188173 dataset (H3K27ac).
Algorithms 16 00401 g006
Figure 7. Histogram of 1 P i computed by the proposed method using the GSE159022 dataset (H3K27me3).
Algorithms 16 00401 g007
Figure 8. Histogram of 1 P i computed by the proposed method using the GSE168971 dataset (H3K9ac).
Algorithms 16 00401 g008
Figure 9. Histogram of 1 P i computed by the proposed method using the GSE159411 dataset (H3K36me3).
Algorithms 16 00401 g009
Figure 10. Histogram of 1 P i computed by the proposed method using the GSE188173 dataset (H3K27ac).
Algorithms 16 00401 g010
Table 1. The list of histone modification profiles analyzed in this study.
GEO IDs and descriptions
GSE24850
This study contained 11 H3K9me3 ChIP-seq mouse nucleus accumbens experiments comprising six controls, three saline-treated samples, and two cocaine samples [16]. Among them, five controls and five treated samples were employed. Ten bed files that were provided as a Supplementary File in GEO were downloaded. One control sample with a GEO identification (ID) of GSM612984 was discarded, and the other ten samples were used.
GSE159075
This study contained various histone modification ChIP-seq experiments using human umbilical vein endothelial cell lines [17]. Among them, three H3K4me3 ChIP-seq, three H3K27me3 ChIP-seq, and three H3K27ac ChIP-seq, as well as one input ChIP-seq profile, were employed. The corresponding 10 bigWig files were downloaded from the GEO Supplementary File.
GSE74055
This study contained various histone modification ChIP-seq experiments using mouse E14 or DKO cell lines [18]. Among them, 16 H3K4me1 ChIP-seq profiles and the corresponding 16 input profiles (32 profiles in total) were downloaded in the bigWig format provided in the GEO Supplementary File.
GSE124690
This study comprised various histone modification CUT&Tag experiments using human H1 or K562 cell lines [19]. Among them, six bulk H3K4me1 profiles (GSM3536499_H1_K4me1_Rep1.bed.gz, GSM3536499_H1_K4me1_Rep2.bed.gz, GSM3536516_K562_K4me1_Rep1.bed.gz, GSM3536516_K562_K4me1_Rep2.bed.gz, GSM3680223_K562_H3K4me1_Abcam_8895.bed.gz, GSM3680224_K562_H3K4me1 _ActMot_39113.bed.gz), four bulk H3K3me3 profiles (GSM3536501_H1_K4me3 _Rep1.bed.gz, GSM3536501_H1_K4me3_Rep2.bed.gz, GSM3536518_K562_K4me3 _Rep1.bed.gz, GSM3536518_K562_K4me3_Rep2.bed.gz), and four bulk H3K27ac profiles (GSM3536497_H1_K27ac_Rep1.bed.gz, GSM3536497_H1 _K27ac_Rep2.bed.gz, GSM3536514_K562_K27ac_Rep1.bed.gz, GSM3536514_K562_K27ac _Rep2.bed.gz) were downloaded from the GEO Supplementary File.
GSE188173
This study contained nine ChIP-seq H3K27ac profiles (with one control and one treated with SPT) using patient–derived xenografts of human castration-resistant prostate cancer (18 profiles in total). The corresponding 18 bigWig files were extracted from the file GSE188173_RAW.tar retrieved from GEO Supplementary File.
GSE159022
This study comprised four H3K4me3 ChIP-seq profiles, four H3K27me3 ChIP-seq profiles, and four H4K16ac ChIP-seq profiles using mouse progenitor cells (two wild type (WT) and two neurofibromin knockouts) [20]. Among them, four H3K27me3 profiles were used and four bigWig files were downloaded from the GEO Supplementary File.
GSE168971
This study contained H3K27ac and H3K9ac ChIP-seq profiles taken from various experimental conditions  [21], six H3K9ac profiles using C3H-WT mouse liver, and two corresponding inputs were used. The corresponding eight bigWig files were downloaded from the GEO Supplementary File.
GSE159411
This study comprised various ChIP-seq profiles [22]. Among them, four H3K36me3 ChIP-seq profiles (two hiPSC cardiomyocytes and two WT hiPSCs) were used. The four corresponding bigWig files were downloaded from the GEO Supplementary File.
GSE181596
This study consisted of four H3K27me3 ChIP-seq profiles (two controls and two treatments) and four H3K4me3 ChIP-seq profiles (two controls and two treatments) in addition to two input profiles that used cells as odontoblasts (treatment was siRNA: si-IKBz) [23]. Among them, four H3K27me3 ChIP-seq profiles were downloaded from the GEO Supplementary File.
Table 2. The list of methods used for the comparison with the present study.
Names of methods and descriptions
MOSAiCS
MOSAiCS [28] was implemented as a bioconductor package [29]. Version 2.32.0 was installed in R [30] and applied to GSE24850. MOSAiCS provides biologically motivated statistical models for reads that arise under both non-enrichment (background) and enrichment (signal). Furthermore, MOSAiCS builds a parametric background model that accounts for biases such as GC content and mappability that are inherent to ChIP-seq data. The MOSAiCS model does not assume punctuated or broad peak structures, but instead quantifies whether the ChIP reads show enrichment compared to the background reads for every genomic interval (e.g., bin) of user-defined size in the genome.
DFilter
DFilter [31] was implemented as a Linux command-line program. Ver. 1.6 was downloaded from https://reggenlab.github.io/DFilter/ (accessed on 20 August 2023). DFilter takes as input a set of sequence tags mapped to a reference genome. Based on the genomic distribution of tags, the algorithm classifies individual n-base-pair bins as positive (signal) or negative (noise) regions. DFilter implements linear finite-impulse-response detection, that is, a windowed linear filter h of user-specified width, followed by the standard thresholding step.
F-Seq2
F-Seq2 [32] was implemented as a Linux command-line program. It was downloaded from https://github.com/Boyle-Lab/F-Seq2 (accessed on 20 August 2023). F-Seq2 employed the Gaussian kernel density function to quantify the amount of protein binding. The total control read count was linearly scaled to be equal to the total treatment read count at the individual chromosome level, as the ratios of total reads fluctuated between different chromosomes.
HOMER
HOMER [33] was implemented as a Linux command-line program. The latest version, HOMER 4.11, which was released on 24 October 2019, was downloaded from http://homer.ucsd.edu/homer/ (accessed on 20 August 2023). For each ChIP-seq experiment, ChIP-enriched regions (peaks) were found by first identifying significant clusters of ChIP-seq tags and then filtering these clusters for those that were significantly enriched relative to background sequencing and local ChIP-seq signal.
RSEG
RSEG [34] was implemented as a Linux command-line program. The latest version, 0.4.9, was downloaded from http://smithlabresearch.org/software/rseg/ (accessed on 20 August 2023). The negative binomial distribution is assumed to quantify the amount of protein binding between control and treated samples using the NBDiff distribution, which is the discrete distribution of the difference between two independent negative binomial random variables.
Table 3. Enriched histone modification in the “Epigenomics Roadmap HM ChIP-seq” category of Enrichr for the GSE24850 dataset (H3K9me3).
TermOverlapp-ValueAdjusted p-Value
H3K9me3 Brain Mid Frontal Lobe22/217 2.02 × 10 6 7.45 × 10 4
H3K9me3 Brain Inferior Temporal Lobe18/170 9.31 × 10 6 1.72 × 10 3
H3K9me3 CD4 Naive Primary Cells10/64 3.39 × 10 5 4.17 × 10 3
H3K9me3 Brain Anterior Caudate15/141 4.82 × 10 5 4.45 × 10 3
H3K9me3 IMR9045/814 2.82 × 10 4 2.08 × 10 2
H3K9me3 Brain Hippocampus Middle15/170 3.90 × 10 4 2.40 × 10 2
H3K9me3 Stomach Smooth Muscle17/217 6.56 × 10 4 3.33 × 10 2
H3K9me3 Colon Smooth Muscle10/92 7.24 × 10 4 3.33 × 10 2
H3K9me3 CD8 Naive Primary Cells11/110 8.11 × 10 4 3.33 × 10 2
H3K9me3 Brain Cingulate Gyrus11/115 1.17 × 10 3 4.33 × 10 2
Table 4. The number of regions/peaks, Entrez gene IDs, and gene symbols selected by various methods and that of the H3K9me3-associated enriched histone modification in the “Epigenomics Roadmap HM ChIP-seq” category of Enrichr with adjusted p-values less than 0.05 for the GSE24850 dataset (H3K9me3).
Enriched
Methods Pair No. Regions Entrez Gene Histone H3K9me3
/Peaks Genes Symbols Modification
Proposed method13028946411010
14367183399431
23648159985100
MOSAiCS32096113656700
41985101853222
555562223118420
125,0806286262110
222,8635721252410
DFilter321,3715470249910
423,8115987263110
523,3695902254410
F-Seq2
HOMER114,7276771674710
RSEG
Table 5. The number of regions/peaks, Entrez gene IDs, and gene symbols selected by various methods and that of associated enriched histone modification (all and targeted) in the “Epigenomics Roadmap HM ChIP-seq” category of Enrichr with adjusted p-values less than 0.05 for other profiles than GSE24850 shown in Table 3. *: ENCODE Histone Modifications 2015.
Histone
Modification
GEO ID Histone Regions Entrez Gene All Targeted Species
Modification /Peaks Genes Symbols
H3K4me334,53813,69213,67119854
GSE159075H3K27me362,141521752088356Human
H3K27ac61,30611,60411,59017524
GSE74055H3K4me161,32911,89011,85858 *6 *Mouse
(when PCA is replaced with TD)70,18714,22014,187102 *10 *
H3K4me1164,46614,89314,8663 *0 *
GSE124690H3K4me337,53414,97214,94620054Human
(CUT&Tag)H3K27ac81,24913,08613,06113924
GSE188173H3K27ac105,43815,57915,54815524Human
GSE159022H3K27me355,923502249967056Mouse
GSE168971H3K9ac58,49015,46015,45281 *6 *Mouse
GSE159411H3K36me3253,32612,28212,27020132Human
GSE181596H3K27me336,972354335457256Human
Table 6. Confusion matrix between clustering by a mixture of Gaussian distributions (row) and selection by the proposed method (column).
Number of Assumed Clusters
234
Proposed Method
Adjusted p -ValueAdjusted p -ValueAdjusted p -Value
Cluster>0.01≤0.01>0.01≤0.01>0.01≤0.01
Gaussian Mixture1104,90242899,285039,5550
208745605122261,9850
309233501240
4074
Disclaimer/Publisher’s Note: The statements, opinions and data contained in all publications are solely those of the individual author(s) and contributor(s) and not of MDPI and/or the editor(s). MDPI and/or the editor(s) disclaim responsibility for any injury to people or property resulting from any ideas, methods, instructions or products referred to in the content.

