
Detecting Image Forgery over Social Media Using U-NET with Grasshopper Optimization


Abstract
:1. Introduction
- (1)
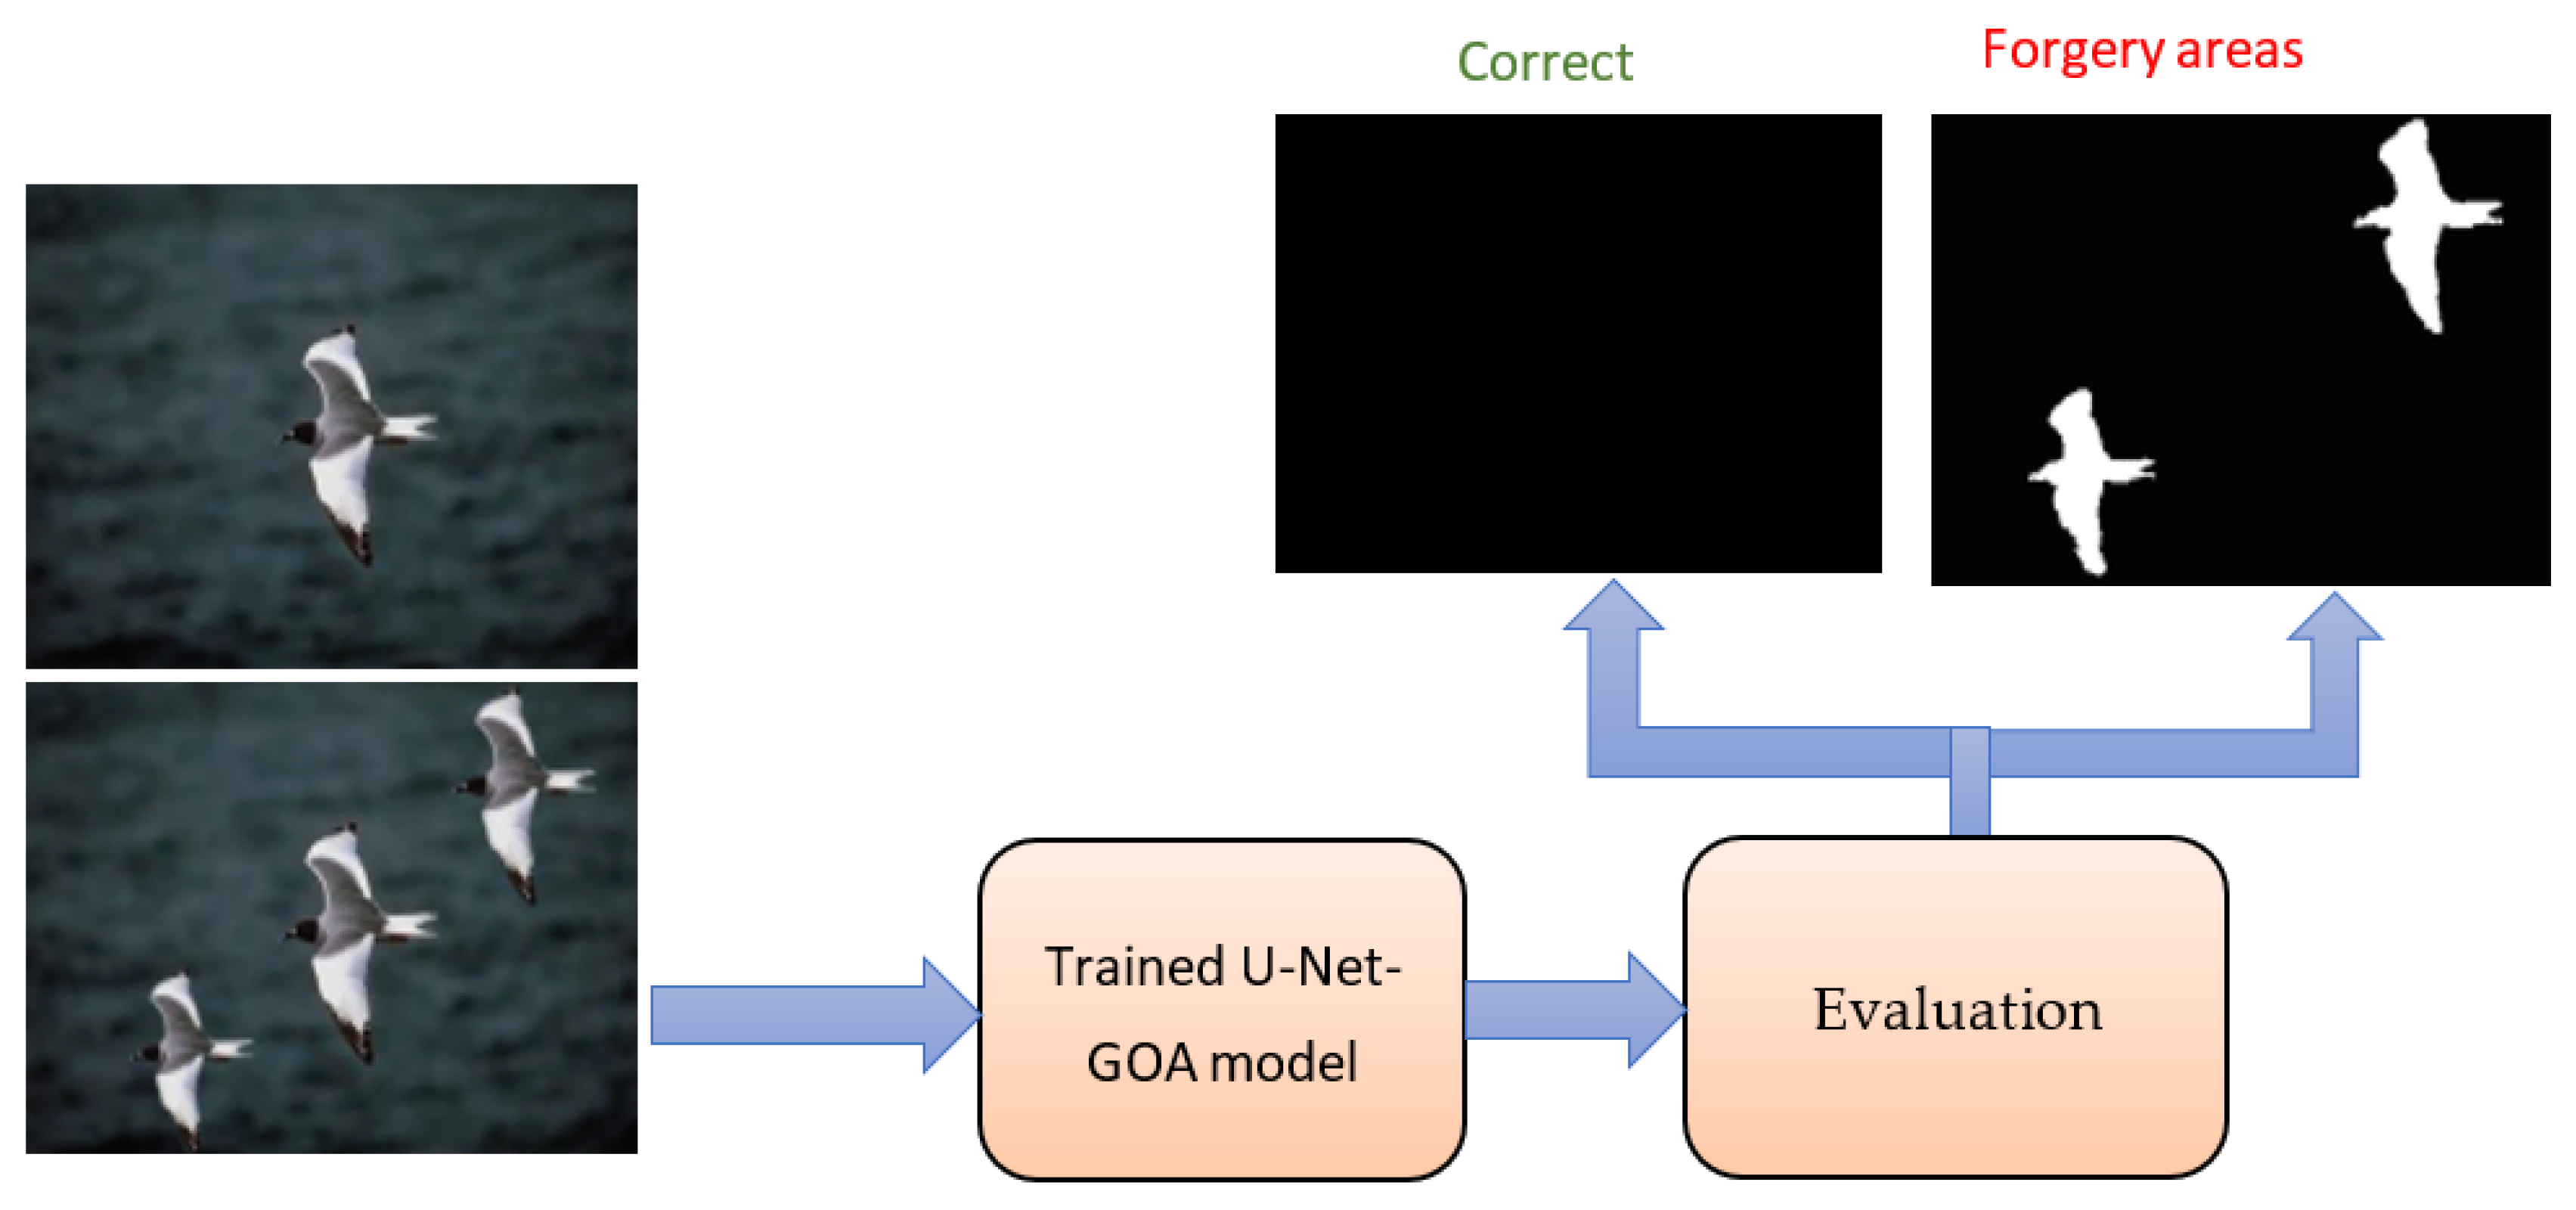
- We are proposing a new method based on a U-net CNN to improve the fine details of images, which aims to increase the efficiency of image forgery detection.
- (2)
- Inspired by the proposed deep learning model for complex medical image segmentation [5], we intend to conduct a similar task to exploit the unique features of U-Net for image enhancement in the current work.
- (3)
- The proposed method’s meta-parameters of the U-Net network are optimized using the grasshopper optimization algorithm (GOA). These parameters are the initial learning rate, the learning rate drop rate, the learning rate of cuts with the drop rate, and the mini-batch size.
1.1. Related Work
1.1.1. Detecting Copy-Move Forgery Using Block Methods
1.1.2. Detecting Copy-Move Forgery Using Keypoint Methods
1.1.3. Issues and Motivation for Current Research
2. Materials and Methods
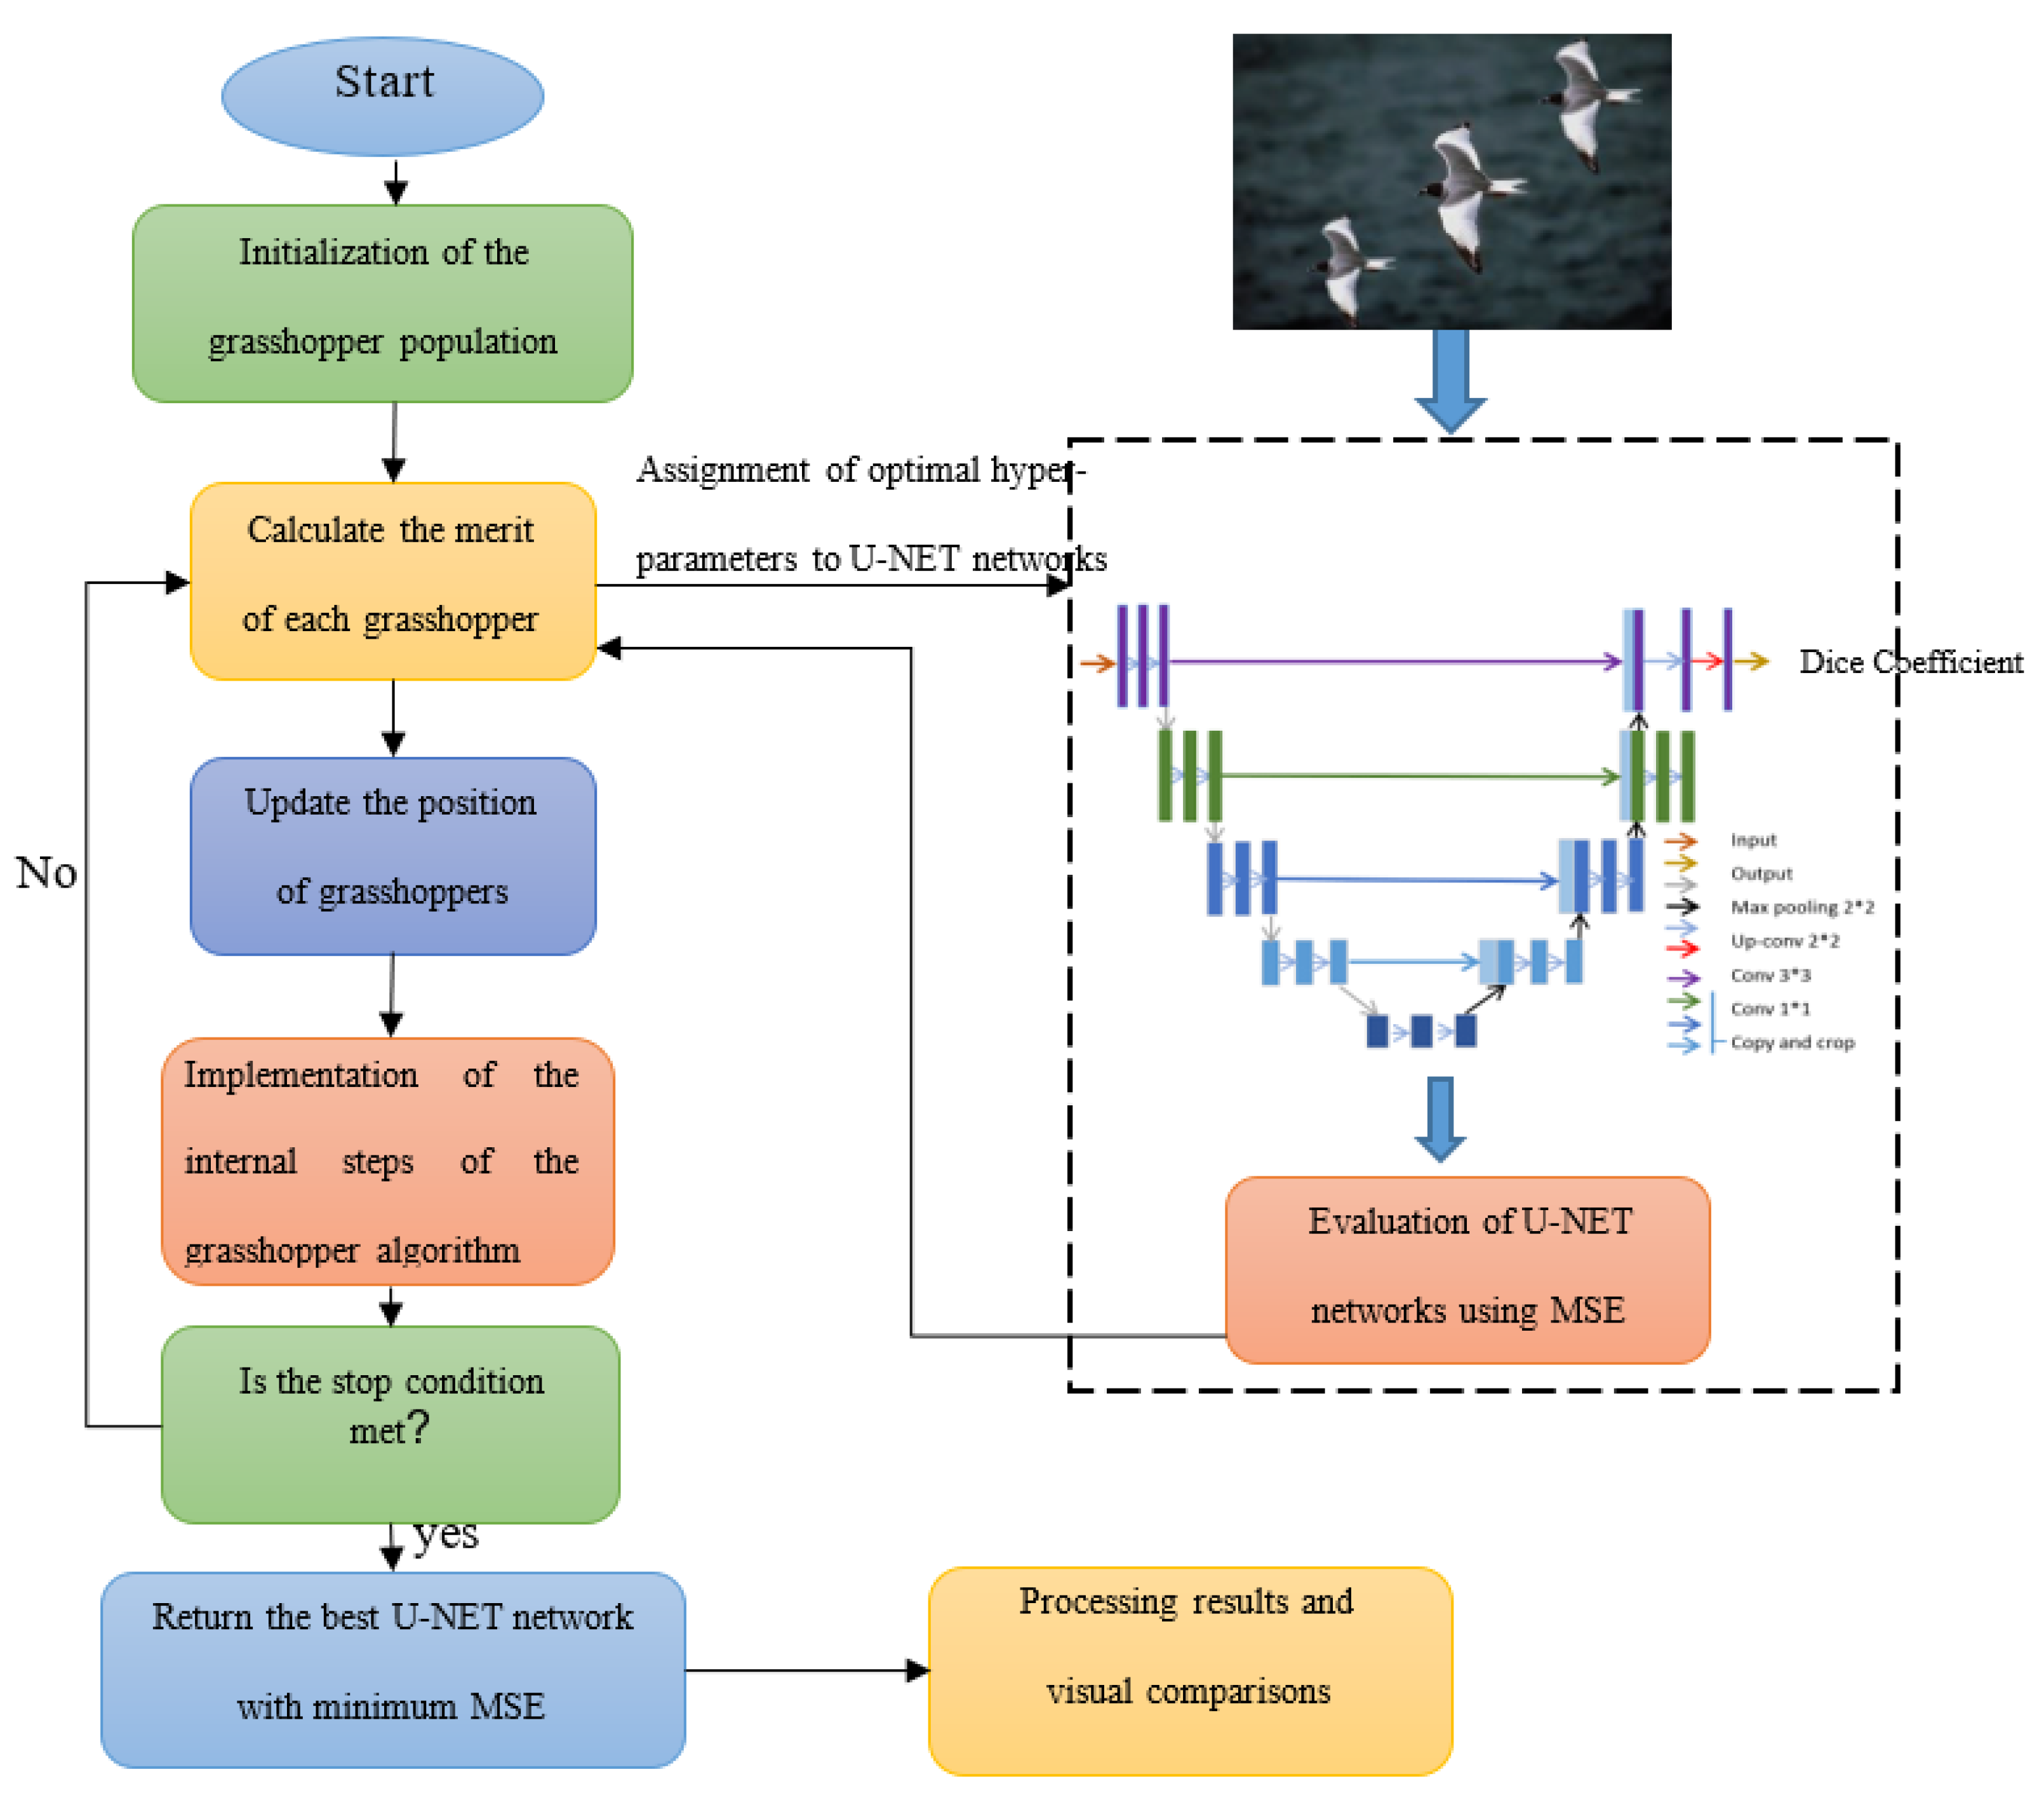
2.1. Methodology
- The pre-processing of data, which includes the separation of data into a training and test set, as well as the scaling of photographs to a consistent size.
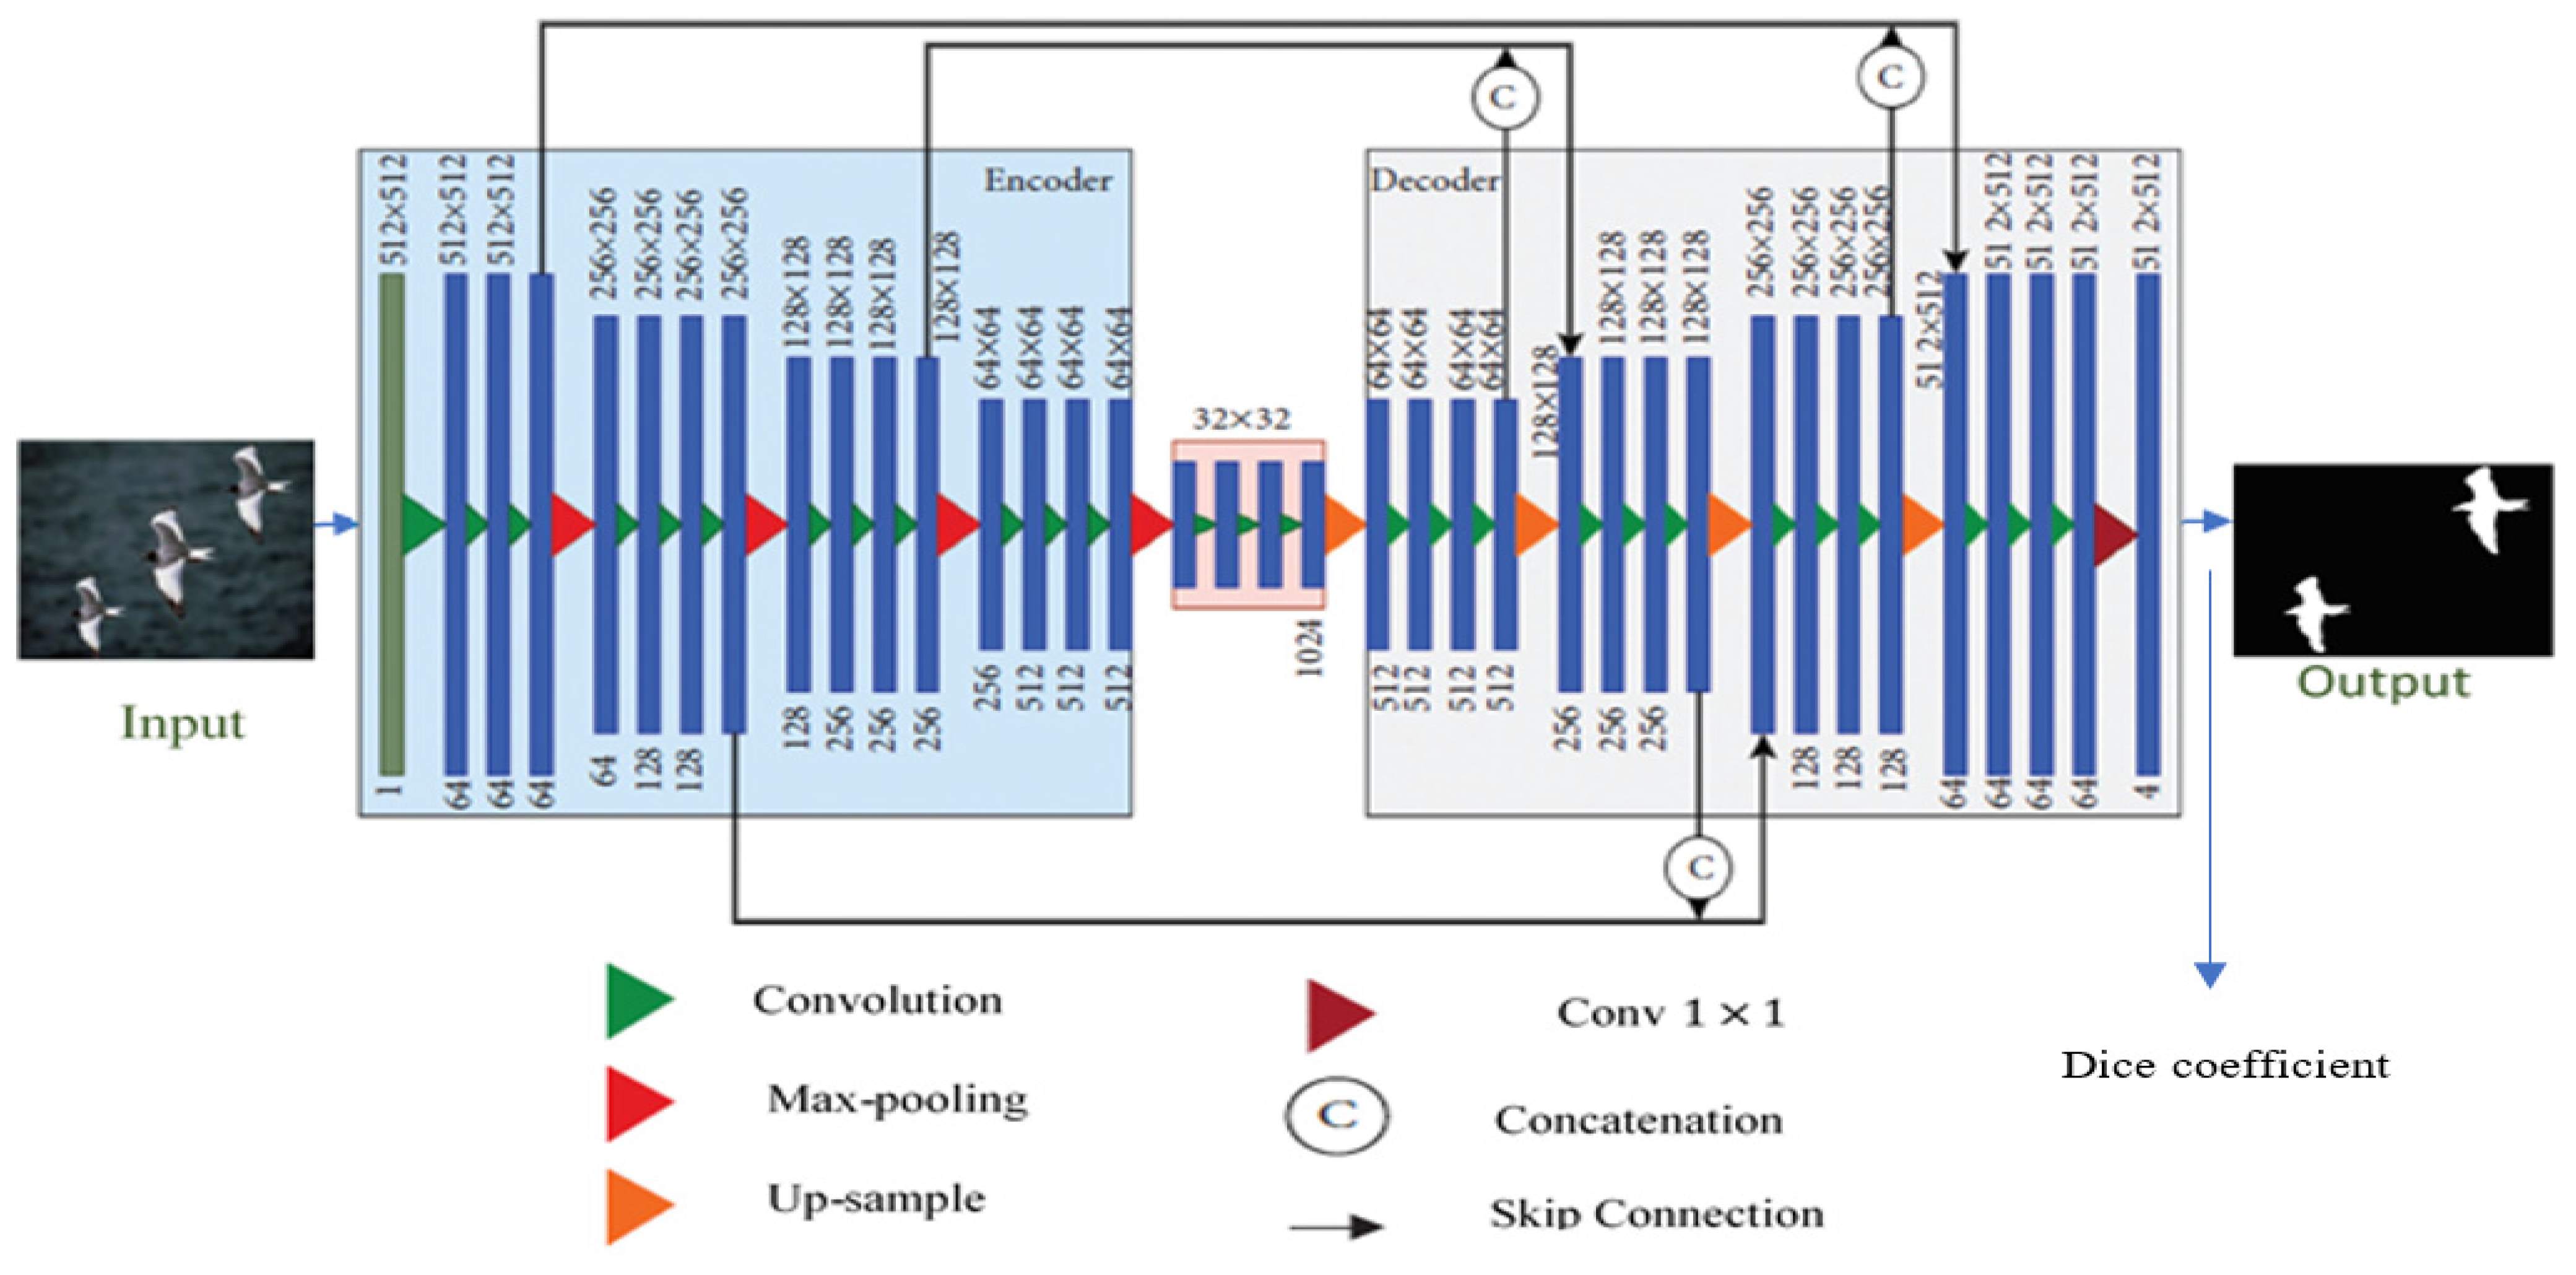
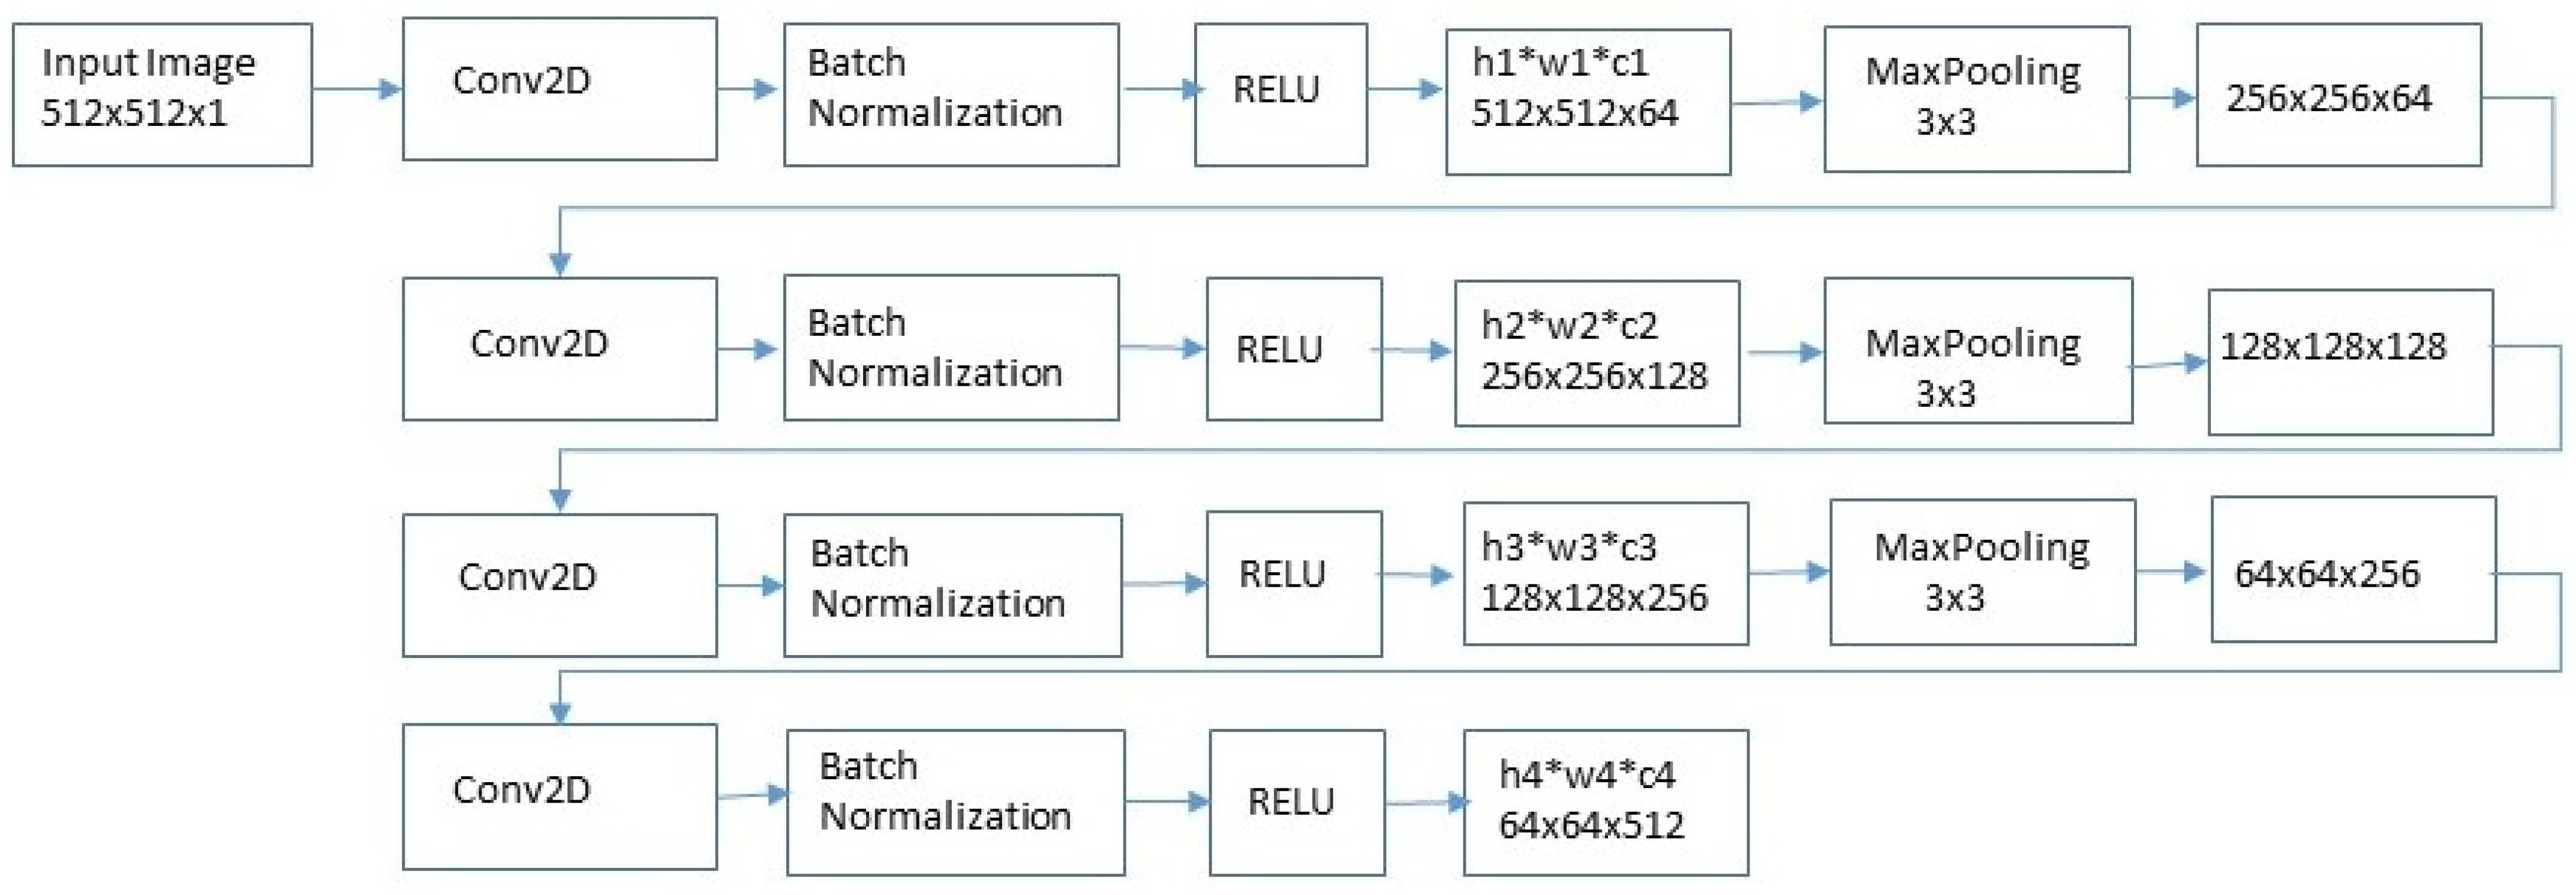
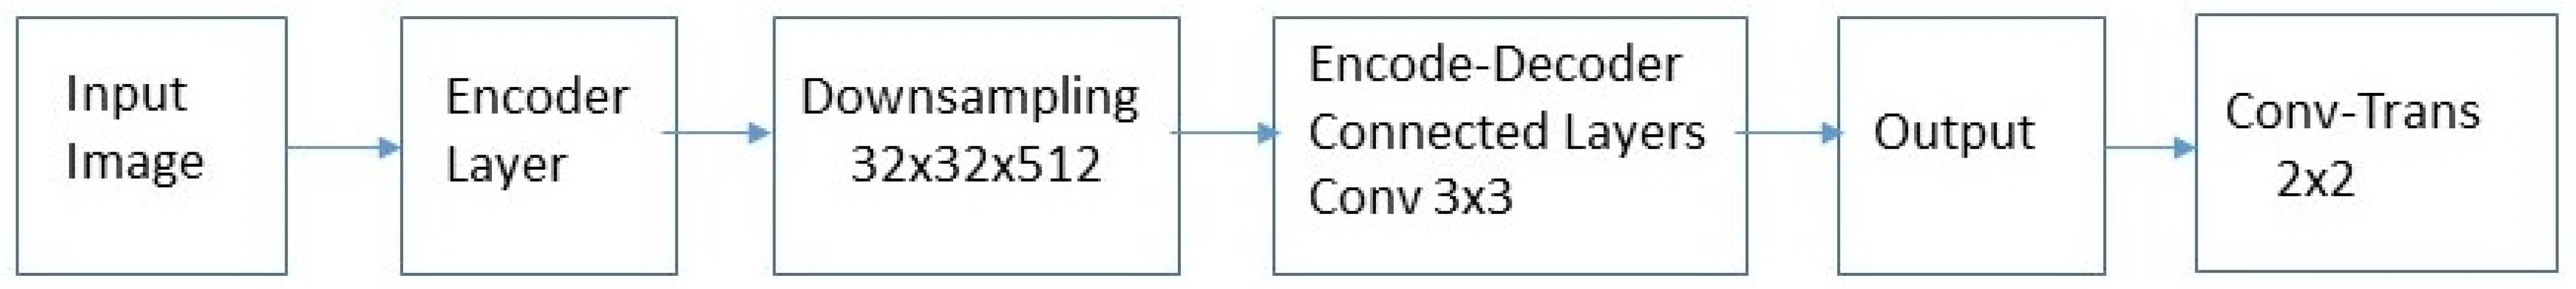
- Develop the architecture of the U-Net network, with an encoder and a decoder, in addition to many convolutional layers and max-pooling/upsampling layers.
- Train the U-Net network for a predetermined number of epochs utilizing the Dice coefficient loss function and the Adam optimizer.
- Apply the GOA algorithm to optimize the U-Net network by utilizing the network parameters as decision variables and the mean squared error as the fitness function.
- Evaluate the performance of the U-Net network based on measures such as precision, recall, and the F1 score by testing it with the test set.
2.2. Models and Architecture
2.2.1. Cross-Entropy (XE) Training
2.2.2. Hyperparameter Tuning Using Grasshopper Optimization Algorithm (GOA)
2.3. Datasets
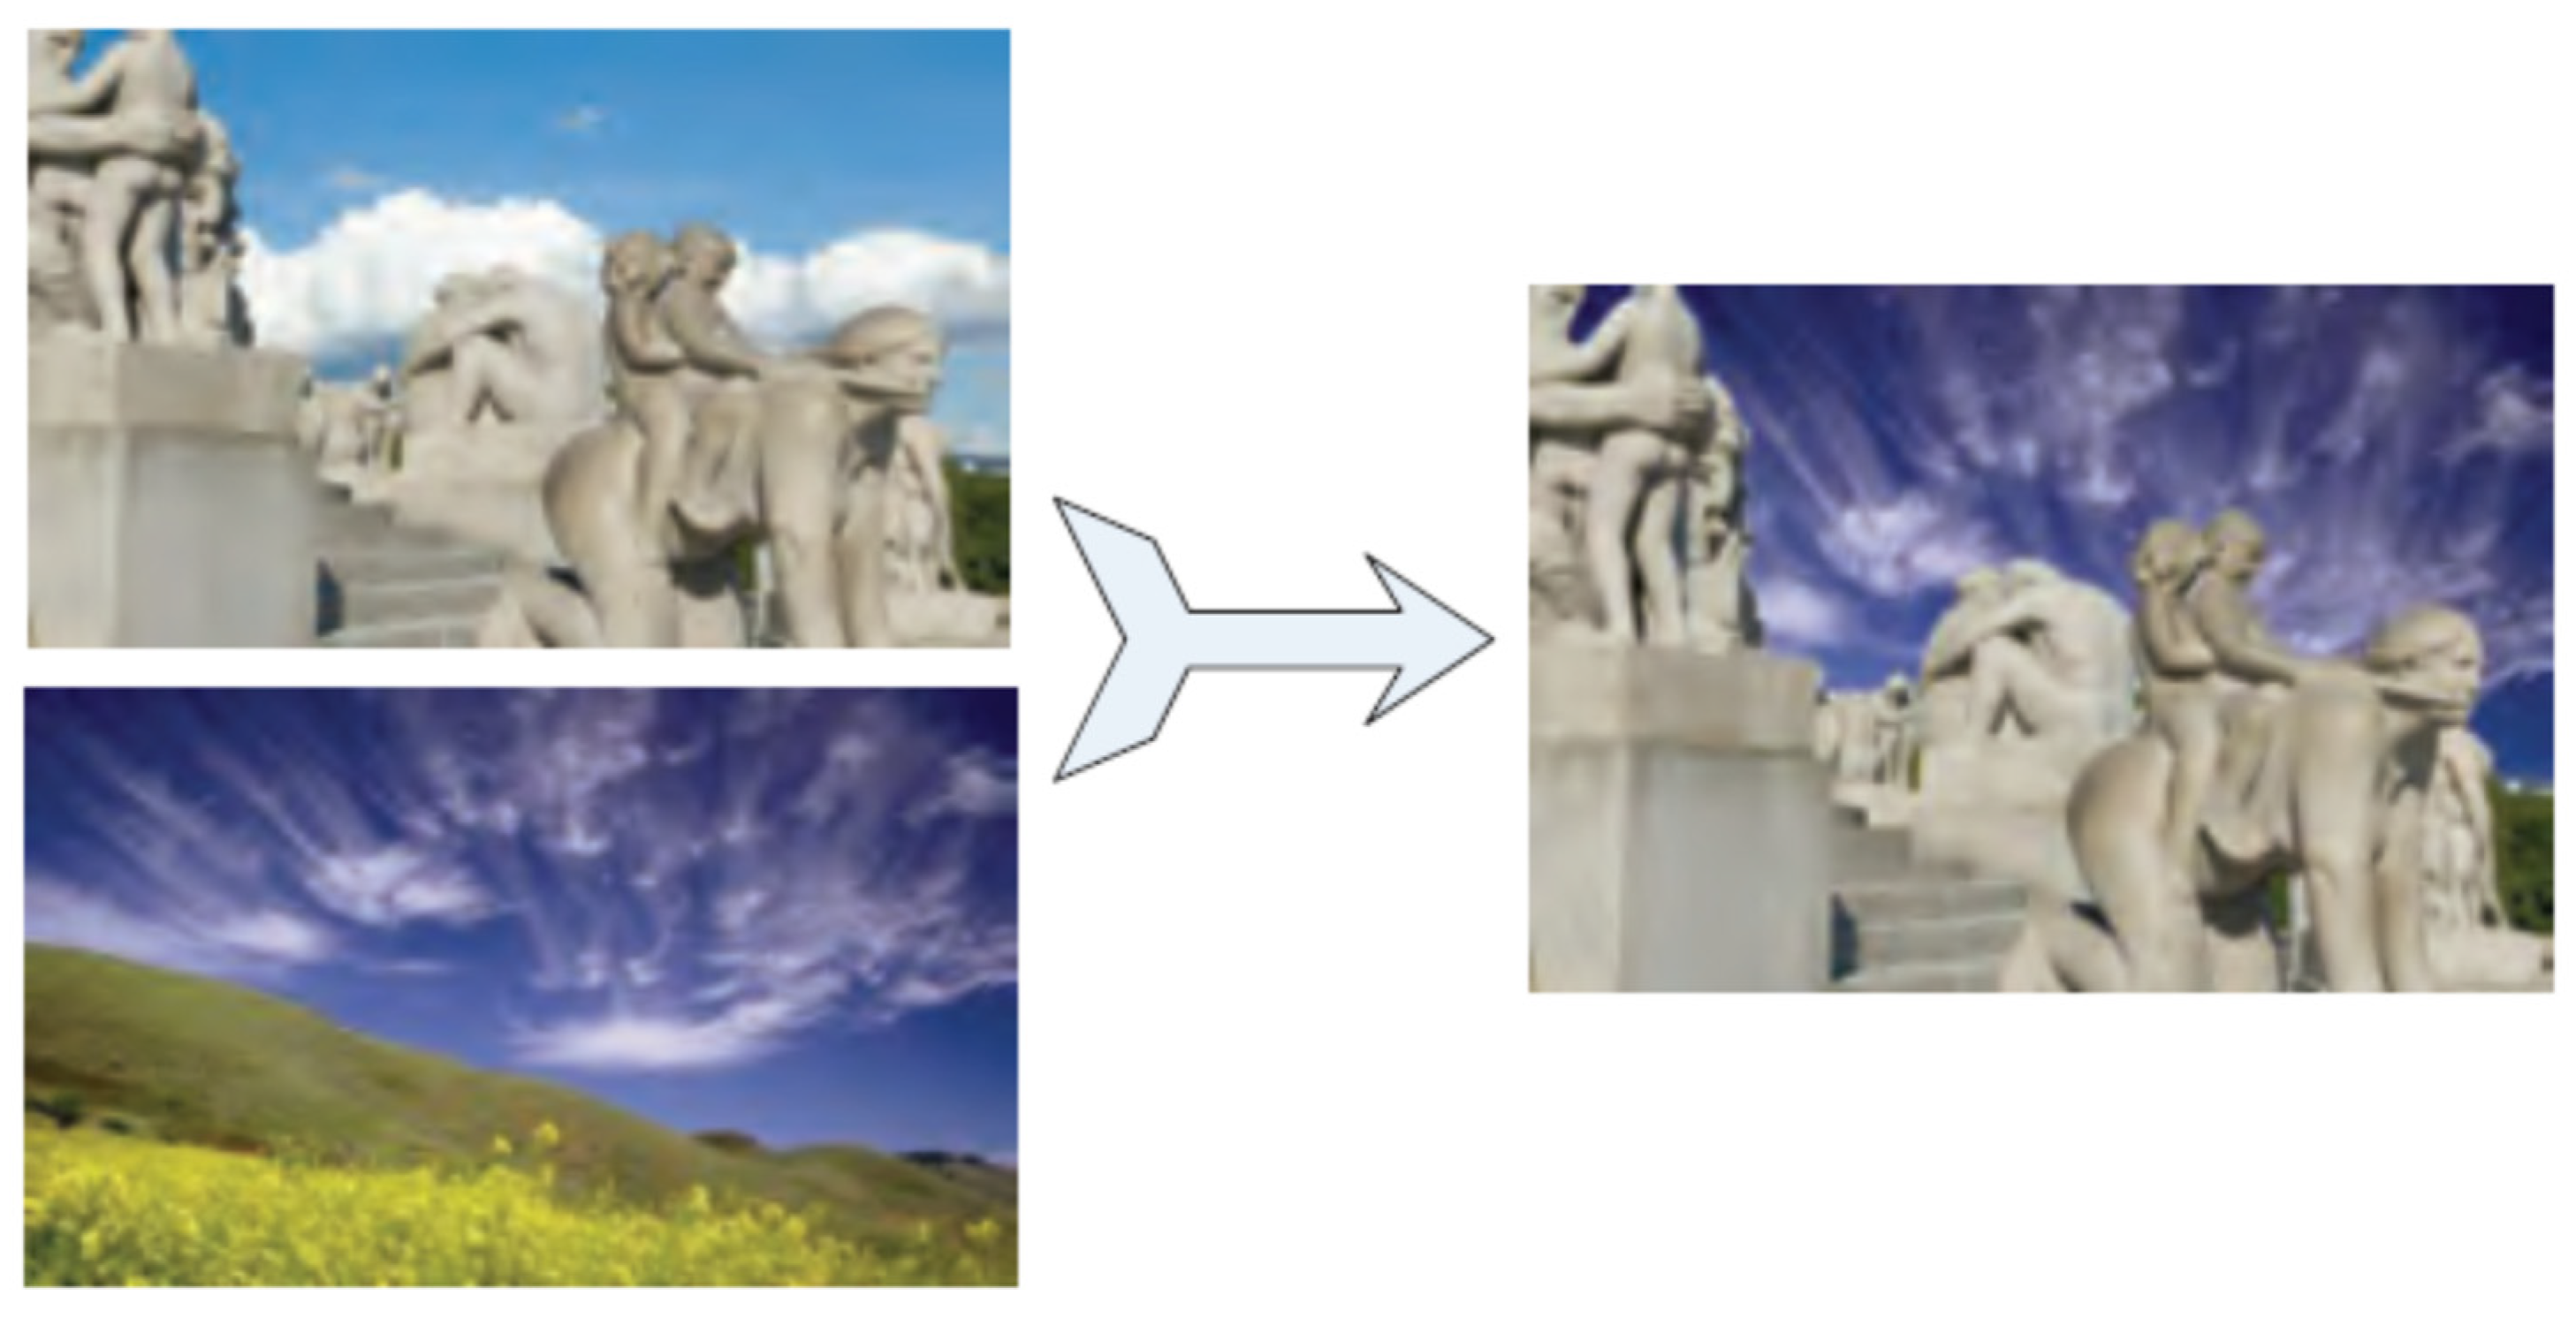
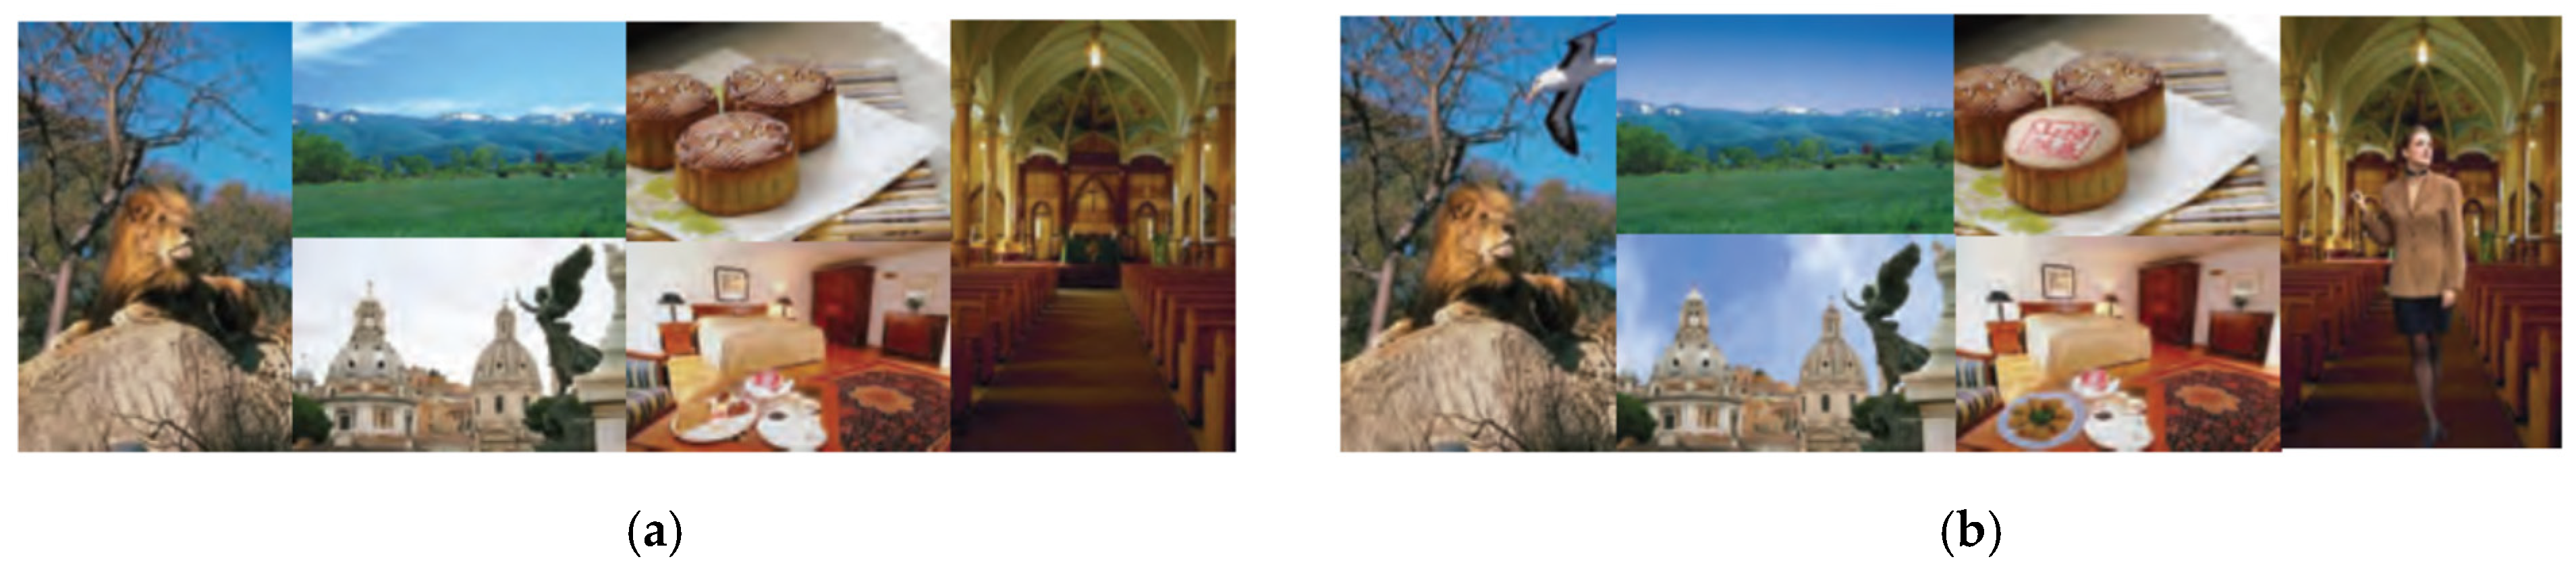
- Illumination changes to spliced regions;
- Splicing with blurring;
- Copy-move;
- Text insertion;
- Image retouching.
2.4. Training Strategy
- Illumination changes to spliced regions;
- Splicing with blurring;
- Copy-move;
- Text insertion;
- Image retouching.
3. Results
Discussion
4. Conclusions
Author Contributions
Funding
Data Availability Statement
Conflicts of Interest
References
- Jain, I.; Gooel, N. Advancements in Image Splicing and Copy-move Forgery Detection Techniques: A Survey. In Proceedings of the 11th International Conference on Cloud Computing, Data Science & Engineering (Confluence), Noida, India, 28–29 January 2021. [Google Scholar] [CrossRef]
- Nabi, S.T.; Kumar, M.; Singh, P.; Aggarwal, N.; Kumar, K. A Comprehensive Survey of Image and Video Forgery Techniques: Variants, Challenges, and Future Directions. Multimed. Syst. 2022, 28, 939–992. [Google Scholar] [CrossRef]
- Barad, Z.; Goswami, M.M. Image Forgery Detection using Deep Learning: A Survey. In Proceedings of the 2020 6th International Conference on Advanced Computing and Communication Systems (ICACCS), Coimbatore, India, 6–7 March 2020; pp. 571–576. [Google Scholar]
- Hebbar, N.K.; Kunte, A.S. Image Forgery Localization Using U-Net based Architecture and Error Level Analysis. In Proceedings of the 2021 3rd International Conference on Advances in Computing, Communication Control and Networking (ICAC3N), Greater Noida, India, 17–18 December 2021; pp. 1992–1996. [Google Scholar] [CrossRef]
- Ronneberger, O.; Fischer, P.; Brox, T. U-Net: Convolutional Networks for Biomedical Image Segmentation. In Lecture Notes in Computer Science; Springer International Publishing: Cham, Switzerland, 2015; pp. 234–241. [Google Scholar] [CrossRef]
- Abd Warif, N.B.; Wahab, A.W.A.; Idris, M.Y.I.; Ramli, R.; Salleh, R.; Shamshirband, S.; Choo, K.K.R. Copy-move forgery detection: Survey, challenges and future directions. J. Netw. Comput. Appl. 2016, 75, 259–278. [Google Scholar] [CrossRef]
- Zhao, F.; Shi, W.; Qin, B.; Liang, B. Image forgery detection using segmentation and swarm intelligent algorithm. Wuhan Univ. J. Nat. Sci. 2017, 22, 141–148. [Google Scholar] [CrossRef]
- Jalab, H.; Subramaniam, T.; Ibrahim, R.; Kahtan, H.; Noor, N. New Texture Descriptor Based on Modified Fractional Entropy for Digital Image Splicing Forgery Detection. Entropy 2019, 21, 371. [Google Scholar] [CrossRef]
- Bunk, J.; Bappy, J.H.; Mohammed, T.M.; Nataraj, L.; Flenner, A.; Manjunath, B.S.; Peterson, L. Detection and Localization of Image Forgeries Using Resampling Features and Deep Learning. In Proceedings of the 2017 IEEE Conference on Computer Vision and Pattern Recognition Workshops (CVPRW), Honolulu, HI, USA, 21–26 July 2017. [Google Scholar] [CrossRef]
- Zhang, Y.; Goh, J.; Win, L.L.; Thing, V.L.L. Image Region Forgery Detection: A Deep Learning Approach. In EBook: Volume 14: Proceedings of the Singapore Cyber-Security Conference (SG-CRC) 2016, Singapore, 14–15 January 2016; IOS Press: Singapore, 2016. [Google Scholar] [CrossRef]
- Zhou, J.; Ni, J.; Rao, Y. Block-Based Convolutional Neural Network for Image Forgery Detection. In Digital Forensics and Watermarking; Kraetzer, C., Shi, Y.-Q., Dittmann, J., Kim, H.J., Eds.; Springer International Publishing: Cham, Switzerland, 2017; pp. 65–76. [Google Scholar]
- Kim, D.-H.; Lee, H.-Y. Image manipulation detection using convolutional neural network. Int. J. Appl. Eng. Res. 2017, 12, 11640–11646. [Google Scholar]
- Khan, M.; Yousaf, A.; Abbas, A.; Khurshid, K. Deep Learning for Automated Forgery Detection in Hyperspectral Document Images. J. Electron. Imaging 2018, 27, 053001. [Google Scholar] [CrossRef]
- Liu, Y.; Guan, Q.; Zhao, X. Copy-move forgery detection based on convolutional kernel network. Multimed. Tools Appl. 2017, 77, 18269–18293. [Google Scholar] [CrossRef]
- Cozzolino, D.; Thies, J.; Rössler, A.; Riess, C.; Nießner, M.; Verdoliva, L. ForensicTransfer: Weakly-supervised Domain Adaptation for Forgery Detection. arXiv 2018, arXiv:1812.02510. [Google Scholar]
- Khalid, H.; Woo, S.S. OC-FakeDect: Classifying Deepfakes Using One-class Variational Autoencoder. In Proceedings of the 2020 IEEE/CVF Conference on Computer Vision and Pattern Recognition Workshops (CVPRW), Seattle, WA, USA, 14–19 June 2020; pp. 2794–2803. [Google Scholar] [CrossRef]
- Marra, F.; Gragnaniello, D.; Verdoliva, L.; Poggi, G. A Full-Image Full-Resolution End-to-End-Trainable CNN Framework for Image Forgery Detection. IEEE Access 2020, 8, 133488–133502. [Google Scholar] [CrossRef]
- Meena, K.B.; Tyagi, V. Image Forgery Detection: Survey and Future Directions. In Data, Engineering and Applications; Shukla, R.K., Agrawal, J., Sharma, S., Singh Tomer, G., Eds.; Springer: Singapore, 2019; pp. 163–194. [Google Scholar] [CrossRef]
- Walia, S.; Saluja, K. Digital image forgery detection: A systematic scrutiny. Aust. J. Forensic Sci. 2019, 51, 488–526. [Google Scholar] [CrossRef]
- Li, L.; Bao, J.; Zhang, T.; Yang, H.; Chen, D.; Wen, F.; Guo, B. Face X-Ray for More General Face Forgery Detection. In Proceedings of the IEEE/CVF Conference on Computer Vision and Pattern Recognition, Seattle, WA, USA, 13–19 June 2020; pp. 5000–5009. [Google Scholar] [CrossRef]
- Abbas, M.N.; Ansari, M.S.; Asghar, M.N.; Kanwal, N.; O’Neill, T.; Lee, B. Lightweight Deep Learning Model for Detection of Copy-Move Image Forgery with Post-Processed Attacks. In Proceedings of the 2021 IEEE 19th World Symposium on Applied Machine Intelligence and Informatics (SAMI), Herl’any, Slovakia, 21–23 January 2021; pp. 125–130. [Google Scholar] [CrossRef]
- Saber, A.H.; Khan, M.; Mejbel, B. A Survey on Image Forgery Detection Using Different Forensic Approaches. Adv. Sci. Technol. Eng. Syst. J. 2020, 5, 361–370. [Google Scholar] [CrossRef]
- Zhang, R.; Ni, J. A Dense U-Net with Cross-Layer Intersection for Detection and Localization of Image Forgery. In Proceedings of the ICASSP 2020–2020 IEEE International Conference on Acoustics, Speech and Signal Processing (ICASSP), Barcelona, Spain, 4–8 May 2020. [Google Scholar] [CrossRef]
- Liu, Y.; Guan, Q.; Zhao, X.; Cao, Y. Image Forgery Localization based on Multi-Scale Convolutional Neural Networks. In Proceedings of the 6th ACM Workshop on Information Hiding and Multimedia Security, Innsbruck, Austria, 20–22 June 2018. [Google Scholar] [CrossRef]
- Liu, B.; Wu, R.; Bi, X.; Xiao, B.; Li, W.; Wang, G.; Gao, X. D-Unet: A Dual-encoder U-Net for Image Splicing Forgery Detection and Localization. arXiv 2020, arXiv:2012.01821. [Google Scholar]
- Marra, F.; Gragnaniello, D.; Cozzolino, D.; Verdoliva, L. Detection of GAN-Generated Fake Images over Social Networks. In Proceedings of the 2018 IEEE Conference on Multimedia Information Processing and Retrieval (MIPR), Miami, FL, USA, 10–12 April 2018. [Google Scholar] [CrossRef]
- Kadam, K.; Ahirrao, S.; Kotecha, K.; Sahu, S. Detection and Localization of Multiple Image Splicing Using MobileNet V1. IEEE Access 2021, 9, 162499–162519. [Google Scholar] [CrossRef]
- Jaiswal, A.; Srivastava, R. Image Splicing Detection using Deep Residual Network. In Proceedings of the 2nd International Conference on Advanced Computing and Software Engineering (ICACSE), Sultanpur, India, 8–9 February 2019; pp. 99–102. [Google Scholar] [CrossRef]
- Stehouwer, J.; Dang, H.; Liu, F.; Liu, X.; Jain, A.K. On the Detection of Digital Face Manipulation. In Proceedings of the 2020 IEEECVF Conference on Computer Vision and Pattern Recognition CVPR, Seattle, WA, USA, 13-19 June 2020; pp. 5780–5789. [Google Scholar]
- Nguyen, H.H.; Fang, F.; Yamagishi, J.; Echizen, I. Multi-task Learning for Detecting and Segmenting Manipulated Facial Images and Videos. In Proceedings of the 2019 IEEE 10th International Conference on Biometrics Theory, Applications and Systems (BTAS), Tampa, FL, USA, 23–26 September 2019; pp. 1–8. [Google Scholar]
- Li, Y.; Lyu, S. Exposing DeepFake Videos by Detecting Face Warping Artifacts. arXiv 2018, arXiv:1811.00656. [Google Scholar]
- Gidaris, S.; Singh, P.; Komodakis, N. Unsupervised Representation Learning by Predicting Image Rotations. arXiv 2018, arXiv:1803.07728. [Google Scholar]
- Wang, L.; Li, D.; Zhu, Y.; Tian, L.; Shan, Y. Dual Super-Resolution Learning for Semantic Segmentation. In Proceedings of the 2020 IEEE/CVF Conference on Computer Vision and Pattern Recognition (CVPR), Seattle, WA, USA, 13–19 June 2020; pp. 3773–3782. [Google Scholar] [CrossRef]
- Yu, L.; Zhang, J.; Wu, Q. Dual Attention on Pyramid Feature Maps for Image Captioning. IEEE Trans. Multimed. 2022, 24, 1775–1786. [Google Scholar] [CrossRef]
- Singh, B.; Sharma, D.K. Image Forgery over Social Media Platforms–A Deep Learning Approach for its Detection and Localization. In Proceedings of the 2021 8th International Conference on Computing for Sustainable Global Development (INDIACom), New Delhi, India, 17–19 March 2021; pp. 705–709. [Google Scholar]
- Wang, X.Y.; Li, S.; Liu, Y.; Niu, Y.; Yang, H.; Zhou, Z. A new keypoint-based copy-move forgery detection for small smooth regions. Multimed. Tools Appl. 2016, 76, 23353–23382. [Google Scholar] [CrossRef]
- Mahmoud, K.; Husien, A. Moment Based Copy Move Forgery Detection Methods. Int. J. Comput. Sci. Inf. Secur. 2016, 14, 28–35. [Google Scholar]
- Wang, X.-Y.; Liu, Y.-N.; Xu, H.; Wang, P.; Yang, H.-Y. Robust Copy—Move Forgery Detection Using Quaternion Exponent Moments. Pattern Anal. Appl. 2018, 21, 451–467. [Google Scholar] [CrossRef]
- Kuznetsov, A.; Myasnikov, V. A new copy-move forgery detection algorithm using image preprocessing procedure. In Proceedings of the 3rd International Conference “Information Technol. Nanotechnol. ITNT-2017, Samara, Russia, 25–27 April 2017; Volume 201, pp. 436–444. [Google Scholar] [CrossRef]
- Niu, P.; Wang, C.; Chen, W.; Yang, H.; Wang, X. Fast and Effective Keypoint-Based Image Copy-Move Forgery Detection using Complex-Valued Moment Invariants. J. Vis. Commun. Image Represent. 2021, 77, 103068. [Google Scholar] [CrossRef]
- Huang, H.-Y.; Ciou, A.-J. Copy-move forgery detection for image forensics using the superpixel segmentation and the Helmert transformation. EURASIP J. Image Video Process. 2019, 2019, 68. [Google Scholar] [CrossRef]
- Dixit, A.; Bag, S. A fast technique to detect copy-move image forgery with reflection and non-affine transformation attacks. Expert Syst. Appl. 2021, 182, 115282. [Google Scholar] [CrossRef]
- Yang, J.; Liang, Z.; Gan, Y.; Zhong, J. A novel copy-move forgery detection algorithm via two-stage filtering. Digit. Signal Process. 2021, 113, 103032. [Google Scholar] [CrossRef]
- Dong, J.; Wang, W.; Tan, T. CASIA Image Tampering Detection Evaluation Database. In Proceedings of the 2013 IEEE China Summit and International Conference on Signal and Information Processing, Beijing, China, 6–10 July 2013; pp. 422–426. [Google Scholar]
- Lei, Z.; Pietikainen, M.; Li, S.Z. Learning discriminative face descriptor. IEEE Trans. Pattern Anal. Mach. Intell. 2014, 36, 289–302. [Google Scholar]
- Huang, J.; Li, Z.; Wang, J.; Wu, Y. Labeled Faces in the Wild: A Database for Studying Face Recognition in Unconstrained Environments; Technical Report; University of Massachusetts: Amherst, MA, USA, 2007. [Google Scholar]
- Abd El-latif, E.; Taha, A.; Zayed, H. A Passive Approach for Detecting Image Splicing using Deep Learning and Haar Wavelet Transform. Int. J. Comput. Netw. Inf. Secur. 2019, 11, 28–35. [Google Scholar] [CrossRef]
- Bi, X.; Wei, Y.; Xiao, B.; Li, W. RRU-Net: The Ringed Residual U-Net for Image Splicing Forgery Detection. In Proceedings of the 2019 IEEECVF Conference on Computer Vision and Pattern Recognition. Workshop CVPRW, Long Beach, CA, USA, June 16–17 June 2019; pp. 30–39. [Google Scholar]
- Doegar, A.; Dutta, M.; Gaurav, K. CNN Based Image Forgery Detection Using Pre-trained AlexNet Model. Int. J. Comput. Intell. IoT 2019, 2, 1. [Google Scholar]
- Wu, Y.; Abd-Almageed, W.; Natarajan, P. BusterNet: Detecting Copy-Move Image Forgery with Source/Target Localization. In Proceedings of the European Conference on Computer Vision, Munich, Germany, 8–14 September 2018. [Google Scholar]


| Dataset | Image Type | Image Size | Authentic | Spliced |
|---|---|---|---|---|
| CASIA v1.0 | jpg | 384 × 256 | 800 | 921 |
| CASIA v2.0 | jpg tif bmp | 240 × 160 900 × 600 | 7491 | 5123 |
| Category | No. of Images | |
|---|---|---|
| JPEG Format | 921 | |
| Manipulation without pre-processing | 562 | |
| Source of Tampered Region(s) | Same Image | 451 |
| Different Images | 470 | |
| Manipulation with pre-processing | Rotation | 25 |
| Resize | 206 | |
| Distortion | 53 | |
| Rotation and Resize | 45 | |
| Resize and Distortion | 27 | |
| Rotation and Distortion | 3 | |
| Rotation, Distortion and Resize | 0 | |
| Shape of Tampered Region | Circular boundary | 114 |
| Rectangular boundary | 169 | |
| Triangular boundary | 102 | |
| Arbitrary boundary | 536 | |
| Category | No. of Images | |
|---|---|---|
| JPEG Format | 2064 | |
| TIFF Format | 3059 | |
| Manipulation without pre-processing | 1843 | |
| Manipulation without post-processing (blurring) | 4144 | |
| Source of Tampered Region(s) | Same Image | 3274 |
| Different Images | 1849 | |
| Manipulation with pre-processing | Rotation | 568 |
| Resize | 1648 | |
| Distortion | 196 | |
| Rotation and Resize | 532 | |
| Resize and Distortion | 211 | |
| Rotation and Distortion | 42 | |
| Rotation, Distortion and Resize | 83 | |
| Manipulation with post-processing | Blurring along spliced edges | 848 |
| Blurring on other regions | 131 | |
| Size of Tampered Region | Small | 3358 |
| Medium | 819 | |
| Large | 946 | |
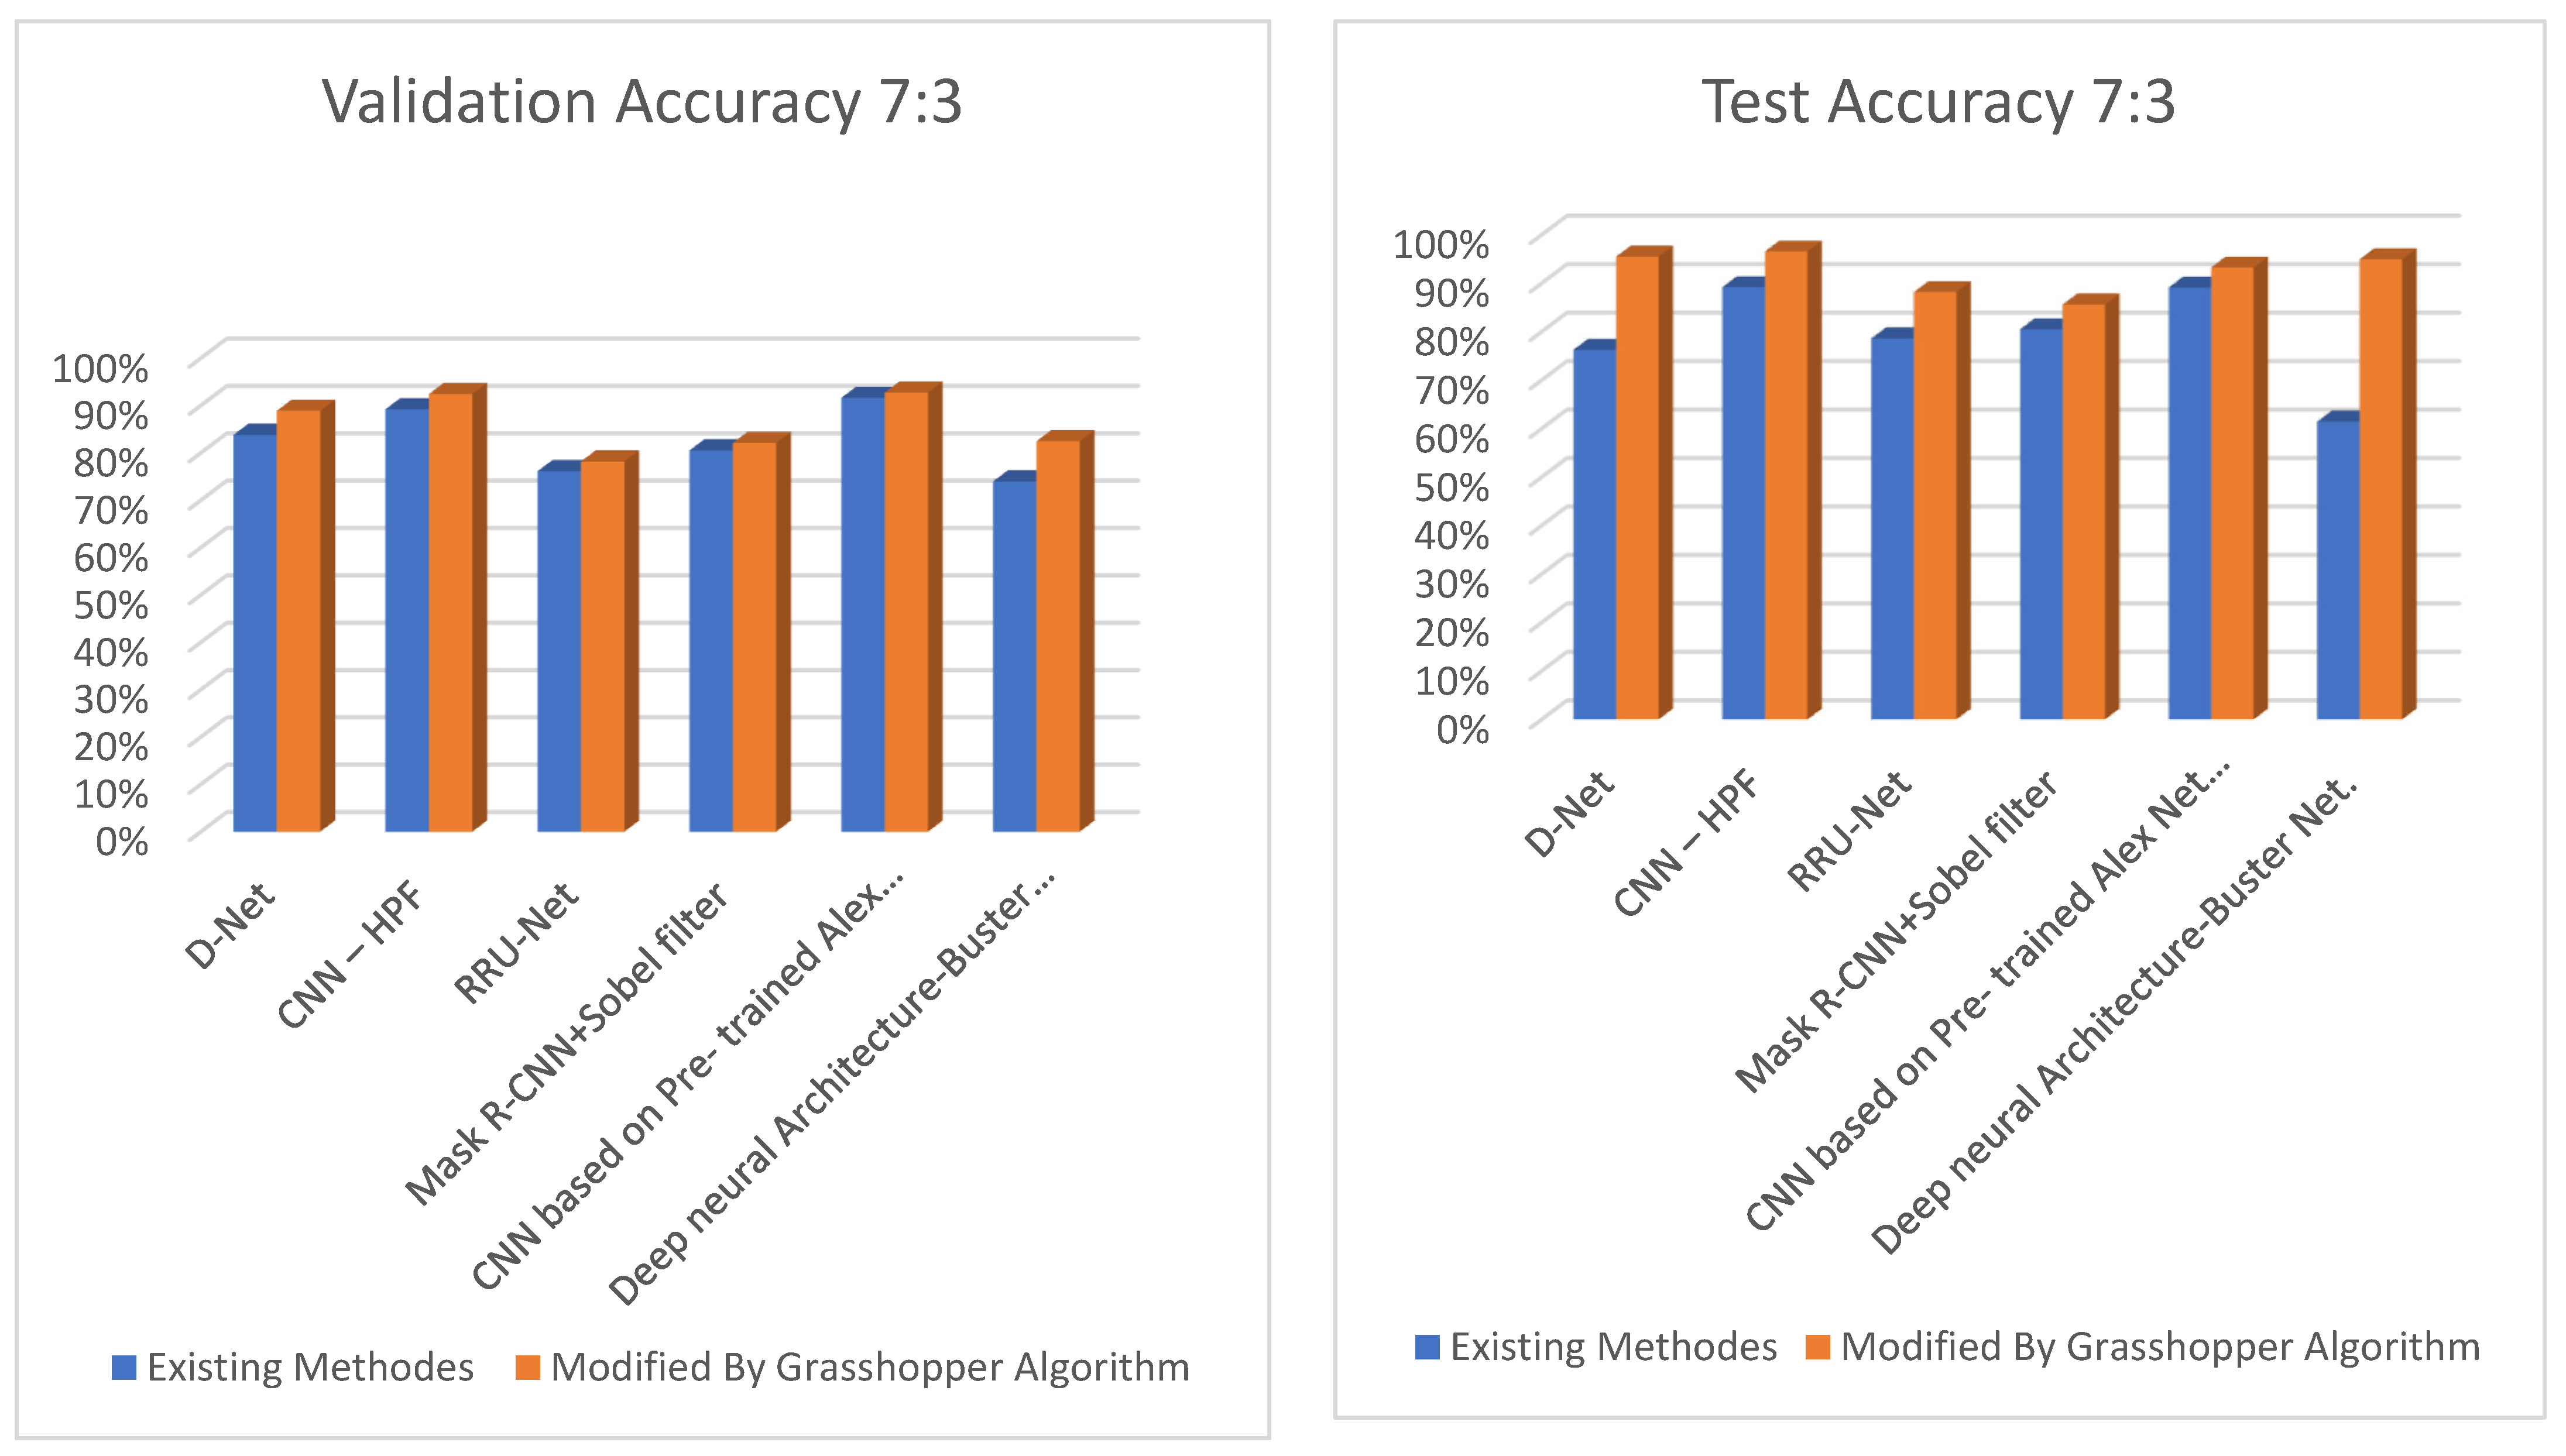
| Methods | Train/Valid = 7:3 Accuracy of Validation Set for Each Epoch during the Training Process (%) | ||||||||||
|---|---|---|---|---|---|---|---|---|---|---|---|
| E 1 | E 2 | E 3 | E 4 | E 5 | E 6 | E 7 | E 8 | E 9 | E 10 | ||
| D-Net [33] | 66.22 | 72.31 | 68.01 | 73.45 | 75.37 | 83.8 | 80.23 | 83.8 | 82.43 | 81.88 | |
| CNN–HPF [43] | 77.1 | 75.22 | 77.94 | 75.22 | 77.8 | 88.76 | 85.6 | 86.07 | 89.22 | 89.22 | |
| RRU-Net [45] | 62.71 | 67.8 | 73.41 | 75.4 | 73.4 | 76.13 | 73.4 | 76.01 | 75.5 | 75.5 | |
| Mask R-CNN + Sobel filter [43] | 65.07 | 77.91 | 76.33 | 80.53 | 76.49 | 77.97 | 78.62 | 75.58 | 77.78 | 80.53 | |
| CNN based on pre-trained Alex Net model [46] | 76.91 | 85.97 | 88.84 | 90.05 | 90.05 | 88.29 | 91.63 | 90.29 | 88.66 | 91.63 | |
| Deep Neural Architecture-Buster Net [47] | 63.21 | 66.8 | 73.97 | 70.92 | 73.97 | 70.92 | 70.38 | 71.34 | 73.97 | 71.73 | |
| Modified | D-Net | 77.5 | 85.3 | 88.91 | 87.16 | 86.04 | 88.91 | 88.74 | 87.1 | 87.1 | 87.98 |
| CNN–HPF | 80.11 | 91.24 | 89.58 | 90.28 | 90.92 | 92.43 | 90.82 | 90.32 | 90.03 | 91.71 | |
| RRU-Net | 66.77 | 78.19 | 75.89 | 75.14 | 75.47 | 77.13 | 74.91 | 78.19 | 76.13 | 77.13 | |
| Mask R-CNN + Sobel filter | 70.7 | 81.47 | 82.12 | 79.69 | 82.12 | 80.01 | 82.03 | 80.92 | 81.83 | 80.86 | |
| CNN based on pre-trained Alex Net model | 81.46 | 85.71 | 91.28 | 92.75 | 92.8 | 91.28 | 92.75 | 92.09 | 92.64 | 92.75 | |
| Deep Neural Architecture-Buster Net. | 67.86 | 75.77 | 82.46 | 80.69 | 80.78 | 82.28 | 78.17 | 79.81 | 79.56 | 82.83 | |
| U-NET network optimized with Grasshopper | 78.78 | 85.75 | 90.57 | 92.3 | 92.34 | 94.63 | 93.57 | 93.47 | 93.67 | 94.63 | |
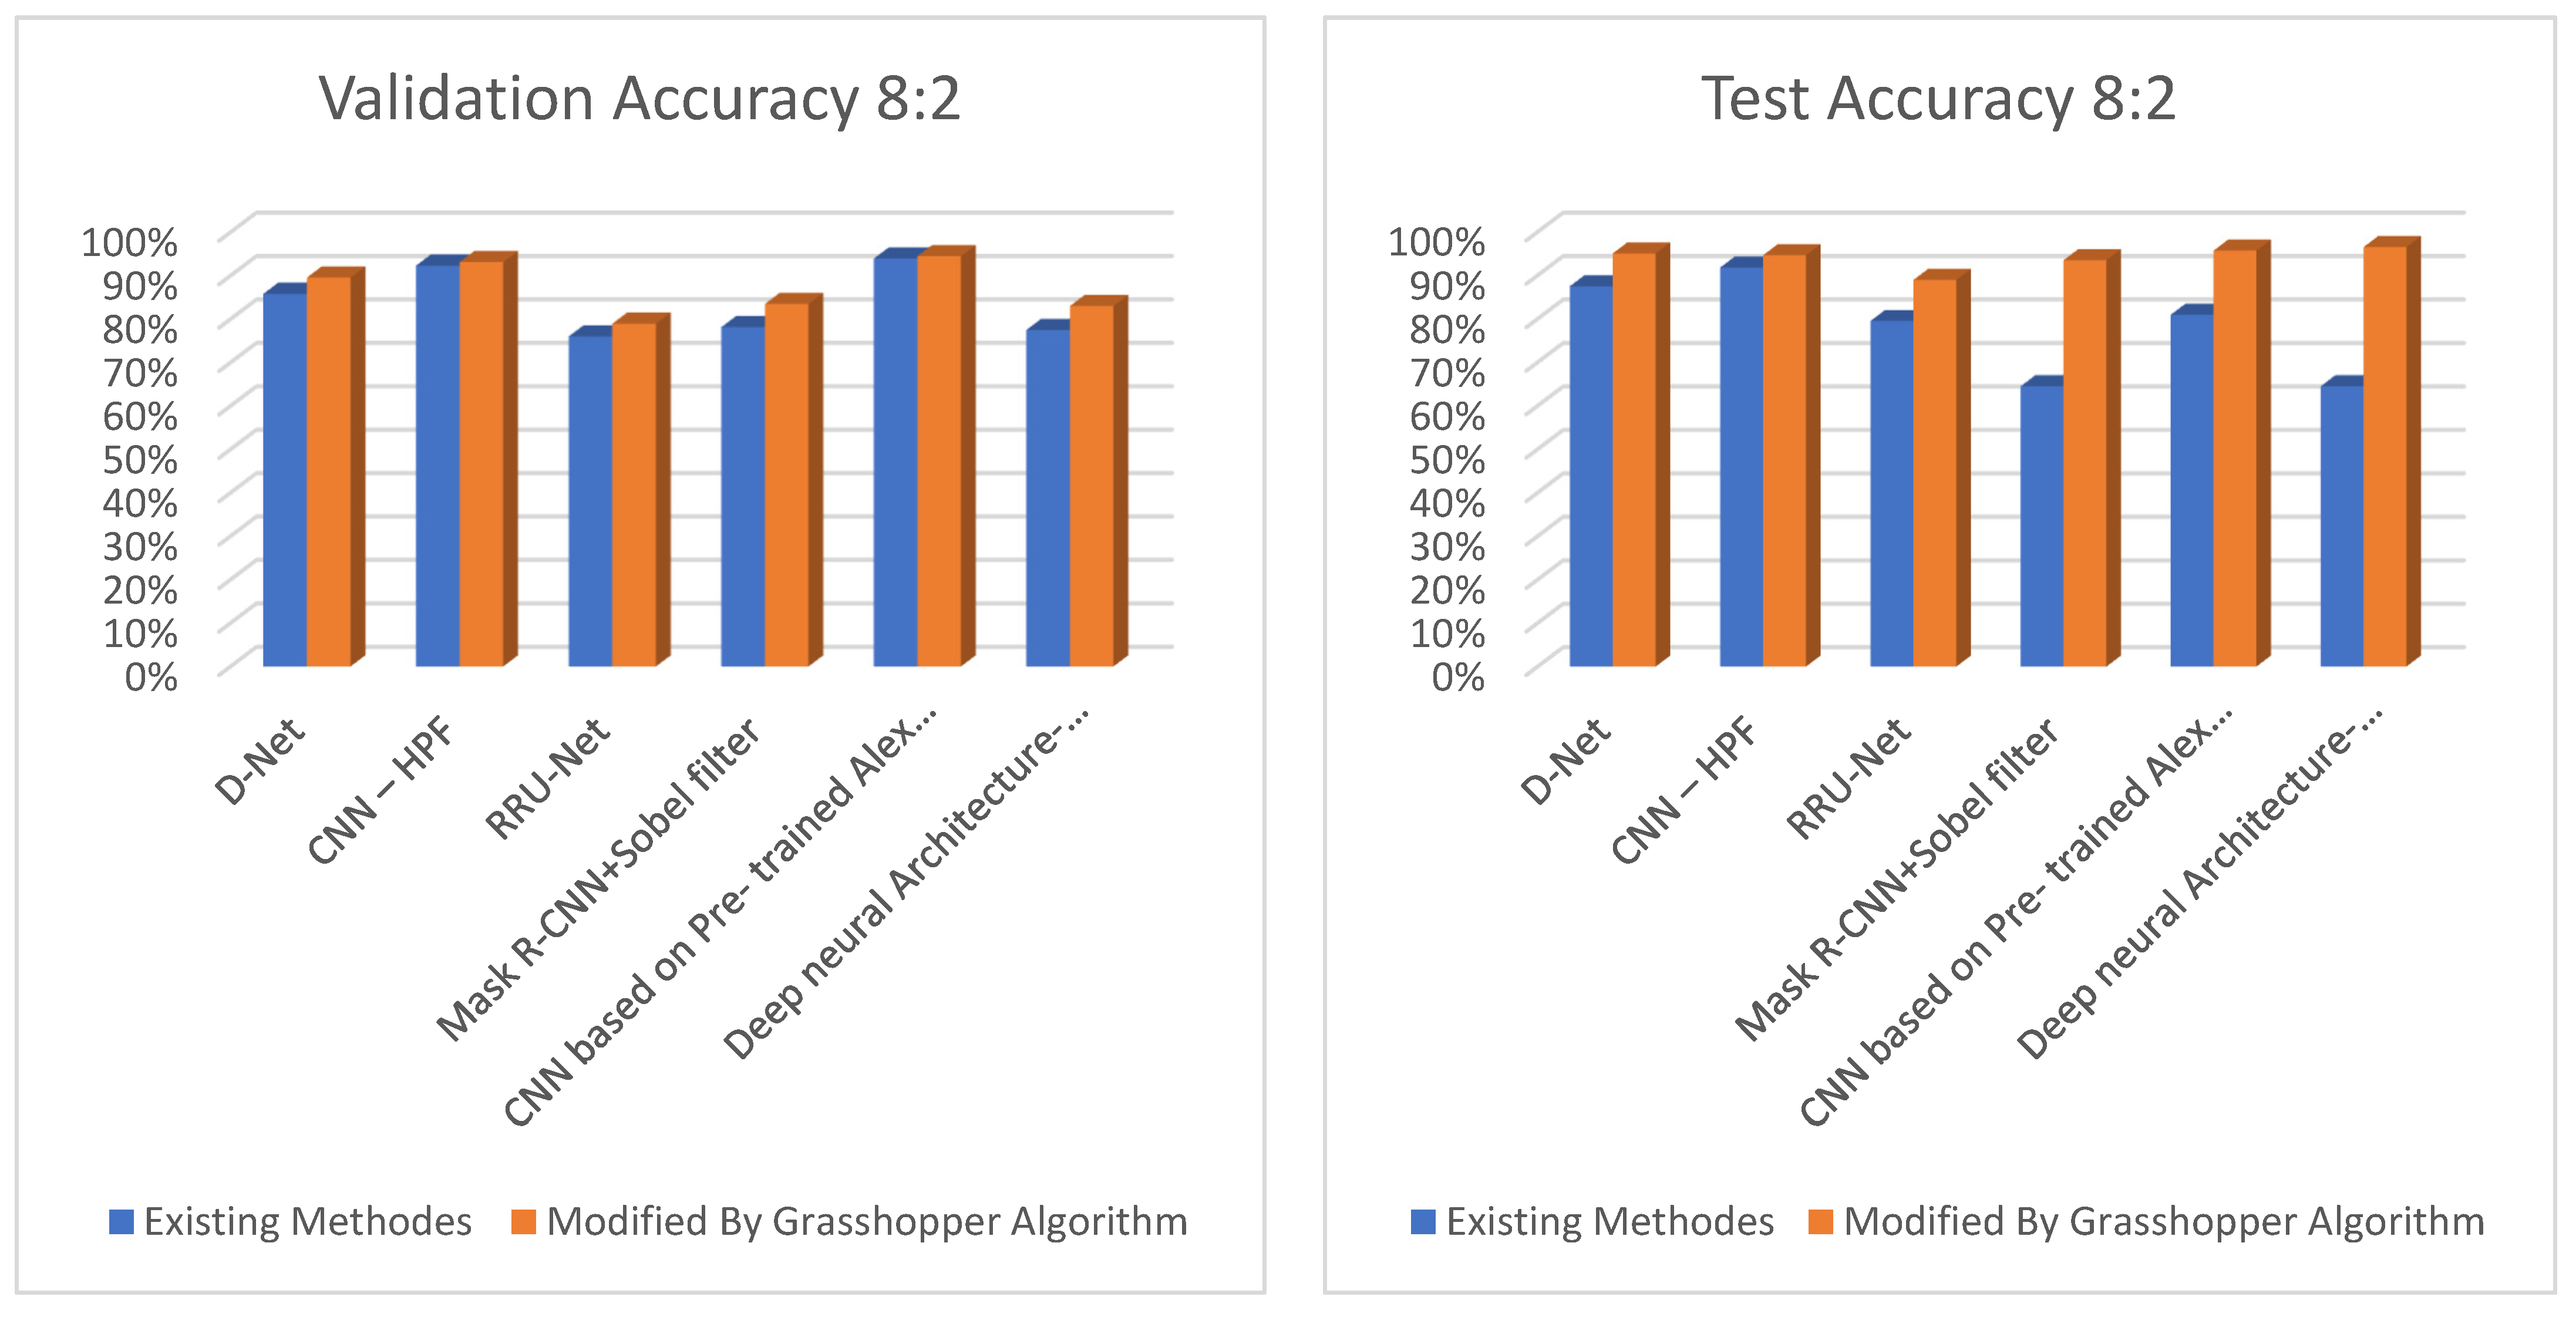
| Methods | Train/Valid = 8:2 Accuracy of Validation Set for Each Epoch during the Training Process (%) | ||||||||||
|---|---|---|---|---|---|---|---|---|---|---|---|
| E 1 | E 2 | E 3 | E 4 | E 5 | E 6 | E 7 | E 8 | E 9 | E 10 | ||
| D-Net [33] | 75.73 | 77.36 | 85.8 | 80.54 | 84.04 | 85.8 | 82.23 | 81.96 | 83.14 | 85.01 | |
| CNN–HPF [43] | 79.58 | 85.24 | 89.2 | 92.3 | 90.96 | 89.2 | 90.72 | 92.3 | 90.87 | 91.2 | |
| RRU-Net [45] | 63.64 | 74.73 | 72.18 | 75.4 | 74.19 | 76.01 | 76.01 | 74.83 | 73.5 | 75.4 | |
| Mask R-CNN + Sobel filter [43] | 66.61 | 77.13 | 76.98 | 78.16 | 77.81 | 78.09 | 76.5 | 77.56 | 76.5 | 78.16 | |
| CNN based on pre-trained Alex Net model [46] | 77.69 | 86.62 | 89.21 | 92.37 | 91.86 | 89.96 | 93.41 | 93.94 | 93.94 | 92.3 | |
| Deep Neural Architecture-Buster Net [47] | 63.86 | 75.12 | 76.29 | 72.04 | 77.49 | 71.69 | 74.03 | 70.97 | 76.68 | 77.49 | |
| Modi fied | D-Net | 77.06 | 82.34 | 87.94 | 87.94 | 82.82 | 89.56 | 87.5 | 87.5 | 85.88 | 89.56 |
| CNN–HPF | 80.5 | 85.8 | 90.36 | 92.06 | 91.57 | 92.1 | 93.14 | 92.1 | 90.98 | 93.08 | |
| RRU-Net | 68.44 | 75.6 | 77.67 | 78.95 | 78.95 | 77.67 | 77.5 | 78.23 | 77.5 | 78.8 | |
| Mask R-CNN + Sobel filter | 70.47 | 75.25 | 81.61 | 81.12 | 83.5 | 82.33 | 79.98 | 83.5 | 83.5 | 81.98 | |
| CNN based on pre-trained Alex Net model | 83.24 | 89.36 | 90.65 | 90.95 | 93.12 | 90.23 | 93.12 | 94.49 | 93.76 | 94.49 | |
| Deep Neural Architecture-Buster Net. | 68.51 | 82.12 | 80.09 | 83.01 | 81.73 | 80.91 | 83.01 | 78.69 | 78.69 | 81.46 | |
| U-NET network optimized with Grasshopper | 79.55 | 86.38 | 92.50 | 90.65 | 93.96 | 95.31 | 92.45 | 95.14 | 95.31 | 95.26 | |
| Methods | Train/Valid = 9:1 Accuracy of Validation Set for Each Epoch during the Training Process (%) | ||||||||||
|---|---|---|---|---|---|---|---|---|---|---|---|
| E 1 | E 2 | E 3 | E 4 | E 5 | E 6 | E 7 | E 8 | E 9 | E 10 | ||
| D-Net [33] | 75.73 | 77.36 | 85.8 | 80.54 | 84.04 | 85.8 | 82.23 | 81.96 | 83.14 | 85.01 | |
| CNN–HPF [43] | 79.58 | 85.24 | 89.2 | 92.3 | 90.96 | 89.2 | 90.72 | 92.3 | 90.87 | 91.2 | |
| RRU-Net [45] | 63.64 | 74.73 | 72.18 | 75.4 | 74.19 | 76.01 | 76.01 | 74.83 | 73.5 | 75.4 | |
| Mask R-CNN + Sobel filter [43] | 66.61 | 77.13 | 76.98 | 78.16 | 77.81 | 78.09 | 76.5 | 77.56 | 76.5 | 78.16 | |
| CNN based on pre-trained Alex Net model [46] | 77.69 | 86.62 | 89.21 | 92.37 | 91.86 | 89.96 | 93.41 | 93.94 | 93.94 | 92.3 | |
| Deep Neural Architecture-Buster Net [47] | 63.86 | 75.12 | 76.29 | 72.04 | 77.49 | 71.69 | 74.03 | 70.97 | 76.68 | 77.49 | |
| Modi fied | D-Net | 78.03 | 85.89 | 89.4 | 89.65 | 86.94 | 90.87 | 90.96 | 87.87 | 85.44 | 90.89 |
| CNN–HPF | 82.46 | 90.81 | 91.33 | 92.72 | 92.82 | 95.81 | 93.31 | 93.59 | 95.81 | 92.34 | |
| RRU-Net | 67.02 | 78.39 | 80.58 | 80.11 | 80.62 | 81.56 | 78.43 | 80.21 | 81.56 | 81.56 | |
| Mask R-CNN + Sobel filter | 74.04 | 83.99 | 81.09 | 85.54 | 80.71 | 83.19 | 83.11 | 85.54 | 85.54 | 83.96 | |
| CNN based on pre-trained Alex Net model | 84.96 | 89.35 | 92.13 | 94.27 | 95.38 | 91.99 | 94.73 | 95.38 | 94.97 | 95.38 | |
| Deep Neural Architecture-Buster Net. | 71.65 | 81.89 | 81.65 | 86.33 | 82.2 | 83.19 | 79.39 | 83.19 | 82.24 | 86.33 | |
| U-NET network optimized with Grasshopper | 85.68 | 89.6 | 94.45 | 92.58 | 92.45 | 97.98 | 94.45 | 97.98 | 95.6 | 97.98 | |
| Methods | Train/Valid Ratio = 7:3 | Train/Valid Ratio = 8:2 | Train/Valid Ratio = 9:1 | ||||
|---|---|---|---|---|---|---|---|
| Valid Accuracy | Test Accuracy | Valid Accuracy | Test Accuracy | Valid Accuracy | Test Accuracy | ||
| D-Net [33] | 83.80% | 76.30% | 85.80% | 87.5% | 86.81% | 87.64% | |
| CNN–HPF [43] | 89.22% | 89.22% | 92.30% | 91.80% | 93.73% | 75.40% | |
| RRU-Net [45] | 76.13% | 78.63% | 76.01% | 79.51% | 78.75% | 79.58% | |
| Mask R-CNN + Sobel filter [43] | 80.53% | 80.53% | 78.16% | 64.50% | 81.28% | 75.98% | |
| CNN based on pre-trained Alex Net model [46] | 91.63% | 89.13% | 93.94% | 80.94% | 94.70% | 95.40% | |
| Deep Neural Architecture-Buster Net [47] | 73.97% | 61.47% | 77.49% | 64.49% | 84.37% | 78.54% | |
| Modified | D-Net | 88.91% | 95.50% | 89.56% | 95.06% | 90.96% | 93.85% |
| CNN–HPF | 92.43% | 96.58% | 93.14% | 94.64% | 95.81% | 95.95% | |
| RRU-Net | 78.19% | 88.19% | 78.95% | 88.95% | 81.56% | 85.73% | |
| Mask R-CNN + Sobel filter | 82.12% | 85.62% | 83.50% | 93.50% | 85.54% | 87.21% | |
| CNN based on pre-trained Alex Net model | 92.75% | 93.25% | 94.49% | 95.70% | 95.38% | 95.38% | |
| Deep Neural Architecture-Buster Net. | 82.46% | 94.96% | 83.01% | 96.51% | 86.33% | 93.63% | |
| U-NET network optimized with Grasshopper | 94.63% | 98.13% | 95.31% | 100.00% | 97.98% | 97.85% | |
| Train/Valid Ratio = 7:3 | ||||||
|---|---|---|---|---|---|---|
| Specificity | Recall | Precision | F1 Score | AUC | ||
| D-Net | 0.913 | 0.706 | 0.857 | 0.774 | 0.926 | |
| CNN–HPF | 0.913 | 0.824 | 0.875 | 0.848 | 0.941 | |
| RRU-Net | 0.733 | 1 | 0.714 | 0.833 | 0.81 | |
| Mask R-CNN + Sobel filter | 0.933 | 0.8 | 0.889 | 0.842 | 0.927 | |
| CNN based on pre-trained Alex Net model | 0.913 | 0.941 | 0.889 | 0.914 | 0.972 | |
| Deep Neural Architecture-Buster Net. | 0.933 | 0.811 | 0.928 | 0.865 | 0.932 | |
| Modified | D-Net | 0.939 | 0.789 | 0.893 | 0.968 | 0.968 |
| CNN–HPF | 0.939 | 0.787 | 0.893 | 0.923 | 0.923 | |
| RRU-Net | 0.892 | 0.687 | 0.803 | 0.855 | 0.855 | |
| Mask R-CNN + Sobel filter | 0.9 | 0.937 | 0.908 | 0.976 | 0.976 | |
| CNN based on pre-trained Alex Net model | 0.956 | 0.766 | 0.918 | 0.923 | 0.923 | |
| Deep Neural Architecture-Buster Net. | 0.94 | 0.662 | 0.875 | 0.878 | 0.878 | |
| U-Net with GOA | 0.956 | 0.937 | 0.957 | 0.986 | 0.986 | |
| Train/Valid Ratio = 8:2 | ||||||
|---|---|---|---|---|---|---|
| Specificity | Recall | Precision | F1 Score | AUC | ||
| D-Net | 0.94 | 0.8 | 0.88 | 0.82 | 0.92 | |
| CNN–HPF | 0.95 | 0.9 | 0.955 | 0.926 | 0.96 | |
| RRU-Net | 0.783 | 0.941 | 0.762 | 0.842 | 0.882 | |
| Mask R-CNN + Sobel filter | 0.783 | 1 | 0.773 | 0.872 | 0.923 | |
| CNN based on pre-trained Alex Net model | 0.9 | 1 | 0.833 | 0.909 | 1 | |
| Deep Neural Architecture-Buster Net. | 0.967 | 0.829 | 0.967 | 0.892 | 0.938 | |
| Modified | D-Net | 0.95 | 0.844 | 0.916 | 0.904 | 0.904 |
| CNN–HPF | 0.969 | 0.82 | 0.944 | 0.951 | 0.951 | |
| RRU-Net | 0.941 | 0.649 | 0.875 | 0.922 | 0.922 | |
| Mask R-CNN + Sobel filter | 0.95 | 0.9 | 0.955 | 0.982 | 0.982 | |
| CNN based on pre-trained Alex Net model | 0.944 | 0.865 | 0.908 | 0.965 | 0.965 | |
| Deep Neural Architecture-Buster Net. | 0.946 | 0.718 | 0.896 | 0.946 | 0.946 | |
| U-Net with GOA | 0.9 | 1 | 0.833 | 0.991 | 0.991 | |
| Train/Valid Ratio = 9:1 | ||||||
|---|---|---|---|---|---|---|
| Specificity | Recall | Precision | F1 Score | AUC | ||
| D-Net | 0.9 | 0.8 | 0.8 | 0.8 | 0.928 | |
| CNN–HPF | 0.867 | 0.9 | 0.818 | 0.857 | 0.978 | |
| RRU-Net | 0.8 | 1 | 0.714 | 0.833 | 0.88 | |
| Mask R-CNN + Sobel filter | 0.87 | 0.941 | 0.842 | 0.889 | 0.928 | |
| CNN based on pre-trained Alex Net model | 0.961 | 0.911 | 0.937 | 0.924 | 1 | |
| Deep Neural Architecture-Buster Net. | 0.967 | 0.857 | 0.968 | 0.909 | 0.938 | |
| Modified | D-Net | 0.977 | 0.887 | 0.961 | 0.95 | 0.924 |
| CNN–HPF | 0.965 | 0.89 | 0.943 | 0.951 | 0.923 | |
| RRU-Net | 0.925 | 0.793 | 0.872 | 0.875 | 0.875 | |
| Mask R-CNN + Sobel filter | 0.933 | 0.943 | 0.943 | 0.978 | 0.978 | |
| CNN based on pre-trained Alex Net model | 0.974 | 0.883 | 0.956 | 0.954 | 0.954 | |
| Deep Neural Architecture-Buster Net. | 0.962 | 0.818 | 0.933 | 0.905 | 0.905 | |
| U-Net with GOA | 0.967 | 0.986 | 0.972 | 0.98 | 0.98 | |
| Train/Valid Ratio | Highest Accuracy | Highest AUC | ||
|---|---|---|---|---|
| D-Net | 9:1 | 87.64% | 0.928 | |
| CNN–HPF | 9:1 | 93.73% | 0.978 | |
| RRU-Net | 9:1 | 79.58% | 0.882 | |
| Mask R-CNN + Sobel filter | 9:1 | 81.28% | 0.928 | |
| CNN based on pre-trained Alex Net model | 9:1 | 95.40% | 1 | |
| Deep Neural Architecture-Buster Net. | 9:1 | 84.37% | 0.938 | |
| Modified | D-Net | 7:3 | 95.50% | 0.968 |
| CNN–HPF | 7:3 | 96.58% | 0.951 | |
| RRU-Net | 8:2 | 88.95% | 0.922 | |
| Mask R-CNN + Sobel filter | 8:2 | 93.50% | 0.982 | |
| CNN based on pre-trained Alex Net model | 8:2 | 95.70% | 0.965 | |
| Deep Neural Architecture-Buster Net. | 8:2 | 96.51% | 0.946 | |
| U-Net with GOA | 8:2 | 100.00% | 0.991 | |
Disclaimer/Publisher’s Note: The statements, opinions and data contained in all publications are solely those of the individual author(s) and contributor(s) and not of MDPI and/or the editor(s). MDPI and/or the editor(s) disclaim responsibility for any injury to people or property resulting from any ideas, methods, instructions or products referred to in the content. |
© 2023 by the authors. Licensee MDPI, Basel, Switzerland. This article is an open access article distributed under the terms and conditions of the Creative Commons Attribution (CC BY) license (https://creativecommons.org/licenses/by/4.0/).
Share and Cite
Ghannad, N.; Passi, K. Detecting Image Forgery over Social Media Using U-NET with Grasshopper Optimization. Algorithms 2023, 16, 399. https://doi.org/10.3390/a16090399
Ghannad N, Passi K. Detecting Image Forgery over Social Media Using U-NET with Grasshopper Optimization. Algorithms. 2023; 16(9):399. https://doi.org/10.3390/a16090399
Chicago/Turabian StyleGhannad, Niousha, and Kalpdrum Passi. 2023. "Detecting Image Forgery over Social Media Using U-NET with Grasshopper Optimization" Algorithms 16, no. 9: 399. https://doi.org/10.3390/a16090399
APA StyleGhannad, N., & Passi, K. (2023). Detecting Image Forgery over Social Media Using U-NET with Grasshopper Optimization. Algorithms, 16(9), 399. https://doi.org/10.3390/a16090399