1. Introduction
The heart is a vital organ responsible for circulating blood throughout the body, which is crucial for maintaining overall health and well-being [
1]. Impaired heart function can harm other organs, including the kidneys and brain, emphasizing the importance of maintaining a healthy cardiovascular system [
2]. Heart disease is a prevalent and severe condition worldwide that contributes to millions of deaths every year, making it a significant global health concern [
3,
4]. Notably, certain regions, such as Asia and the United States, bear a higher burden of heart disease [
5]. Moreover, gender and age also influence the risk of developing heart issues, with males and older individuals being more susceptible [
6].
Extensive medical research has identified various risk factors associated with heart disease, including physical inactivity, poor lifestyle choices, obesity, and unhealthy diet. Additionally, certain conditions, such as high blood pressure, smoking, family history, hypertension, stress, diabetes, and high cholesterol, can further elevate the risk of heart disease [
7,
8,
9,
10,
11,
12]. Given the complexity and multifactorial nature of heart disease, effective prediction and prevention strategies are essential for mitigating its impact.
Data mining and machine learning techniques have emerged as valuable tools for analyzing large datasets and extracting valuable insights from across numerous domains, including healthcare [
13]. In particular, machine learning algorithms can effectively process vast amounts of medical data to identify hidden patterns and facilitate accurate disease diagnosis, detection, and prediction [
14,
15,
16]. Despite previous research efforts in disease prediction, achieving reliable outcomes in heart disease prediction remains a challenge [
17]. To address this gap, this study presents a prediction model for heart disease that combines ensemble learning algorithms, hyperparameter optimization techniques, and preprocessing steps. The model aims to accurately predict heart disease by evaluating the classification accuracy of various ensemble learning algorithms, including random forest, extra tree classifier, XGBoost, and CatBoost. Hyperparameter optimization techniques, such as grid search CV and randomized search CV, are employed to find the optimal hyperparameters for these algorithms. Additionally, preprocessing steps, such as handling missing values, removing duplicates and outliers, and normalizing data, are applied to enhance the model’s performance.
The main contributions of this work are as follows:
A predictive model that focuses on hyperparameter tuning through hyperparameter optimization techniques and preprocessing steps;
The improved accuracy of heart disease prediction, reductions in false predictions, and a comparison of the default and optimal hyperparameters using grid search CV and randomized search CV to determine the optimal approach;
The identification of the most suitable prediction algorithm among four ensemble learning algorithms for accurately classifying a combined heart disease dataset;
The validation of the model’s performance using various metrics, such as accuracy, precision, recall, F1-score, Cohen’s kappa, precision–recall curve (PRC), and the area under the ROC curve, with the experimental results demonstrating the superiority of the proposed model.
2. Literature Review
In recent years, there has been significant progress in using data mining and machine learning techniques for predicting heart disease, focusing on early diagnosis and prevention. Several key studies within the field have contributed to this advancement. Here, we discuss these studies, their methodologies, findings, and limitations.
In 2023, Bhatt et al. [
18] conducted a study that applied various machine learning algorithms, including random forest, decision tree, multilayer perceptron (MLP), and XGBoost. Their dataset consisted of approximately 59,000 rows and 11 attributes. The MLP algorithm yielded the highest cross-validation accuracy of 87.28%, demonstrating excellent precision, recall, F1-score, and area under the ROC curve values.
Similarly, in 2023, Ogundepo and Yahya [
19] conducted a predictive analysis of heart disease risk factors using two independent datasets. They trained classification models on the Cleveland dataset and validated the results using the Statlog dataset. Through exploratory analysis, they identified significant associations between specific bio-clinical variables and heart disease. The support vector machine (SVM) exhibited the best performance among the 10 classification models trained on the Cleveland dataset, achieving 85% accuracy, 82% sensitivity, 88% specificity, 87% precision, and 38% log loss. The findings were validated using 10-fold CV on the Statlog dataset, demonstrating a consistent performance.
In another study conducted in 2023 by Ming Zeng [
20], decision tree, KNN, SVM, and XGBoost algorithms were employed to predict heart disease based on 11 clinical features. The SVM algorithm outperformed the other models, achieving 88.8% accuracy, 89.3% recall, and 90.7% f1-score. The study emphasized the significance of angina and ST depression induced by exercise as important features associated with heart disease.
Additionally, in 2023, Arslan Khan et al. [
21] analyzed a dataset of randomly selected patients with heart disease using various machine learning algorithms, including decision tree, SVM, naïve Bayes, logistic regression, and random forest. The random forest algorithm demonstrated the highest accuracy of 85.01% and outperformed the other algorithms, highlighting the potential of machine learning for analyzing and predicting cardiovascular disease.
Other studies have also contributed to predicting heart disease using machine learning techniques. For example, Zhang et al. (2023) found that logistic regression achieved the best results for heart disease prediction, with an accuracy of 96.7%, using a 70:30 split ratio and the robust scaling method [
22]. Additionally, Almustafa K.M. (2020) found that KNN achieved the best results for heart disease prediction, with an accuracy of 99.7073% [
23]. Shah et al. (2020) utilized decision tree, naïve Bayes, KNN, and random forest models on the Cleveland dataset and found that KNN provided the most reliable prediction, with an accuracy of 86.885% [
24]. Similarly, Apurv Garg et al. (2021) compared the performance of KNN and random forest models using the Kaggle heart disease dataset, with KNN achieving the higher accuracy of 86.885% [
25]. Vardhan Shorewala (2021) conducted feature analysis and employed the LASSO algorithm for feature selection to predict cardiac disease. Traditional classifiers were utilized, including decision trees and neural networks, with the dense neural network achieving the highest testing accuracy of 73.9% and an F1-score of 72.0% [
26].
These studies have made significant progress in predicting heart disease using machine learning models. However, they have also encountered limitations, such as small sample sizes and methodological variations, which have affected the accuracy and reliability of their predictions. One important aspect that has been overlooked in these studies is the utilization of ensemble learning techniques with hyperparameter optimization for heart disease prediction. Most researchers have relied on default hyperparameter settings, neglecting the potential for further improvement. To address these limitations, our study adopted a comprehensive approach by employing ensemble learning techniques and exploring hyperparameter optimization through grid search and randomized search cross-validation. Additionally, we combined three Kaggle datasets with similar features to create a comprehensive dataset for analysis. By adopting this comprehensive approach, our study aimed to develop a robust and accurate heart disease prediction model.
3. Methodology
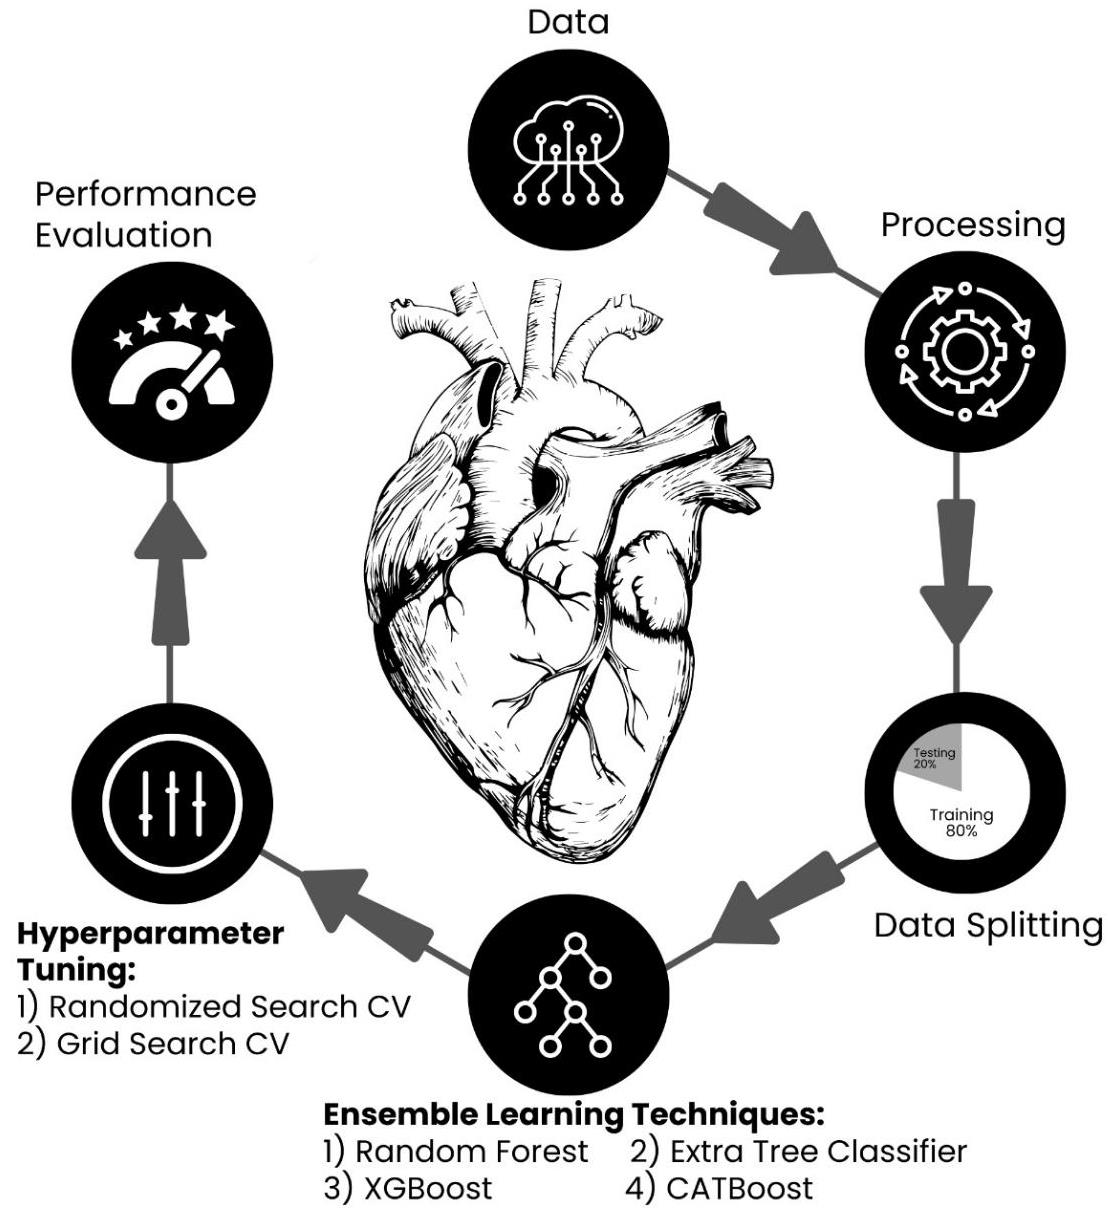
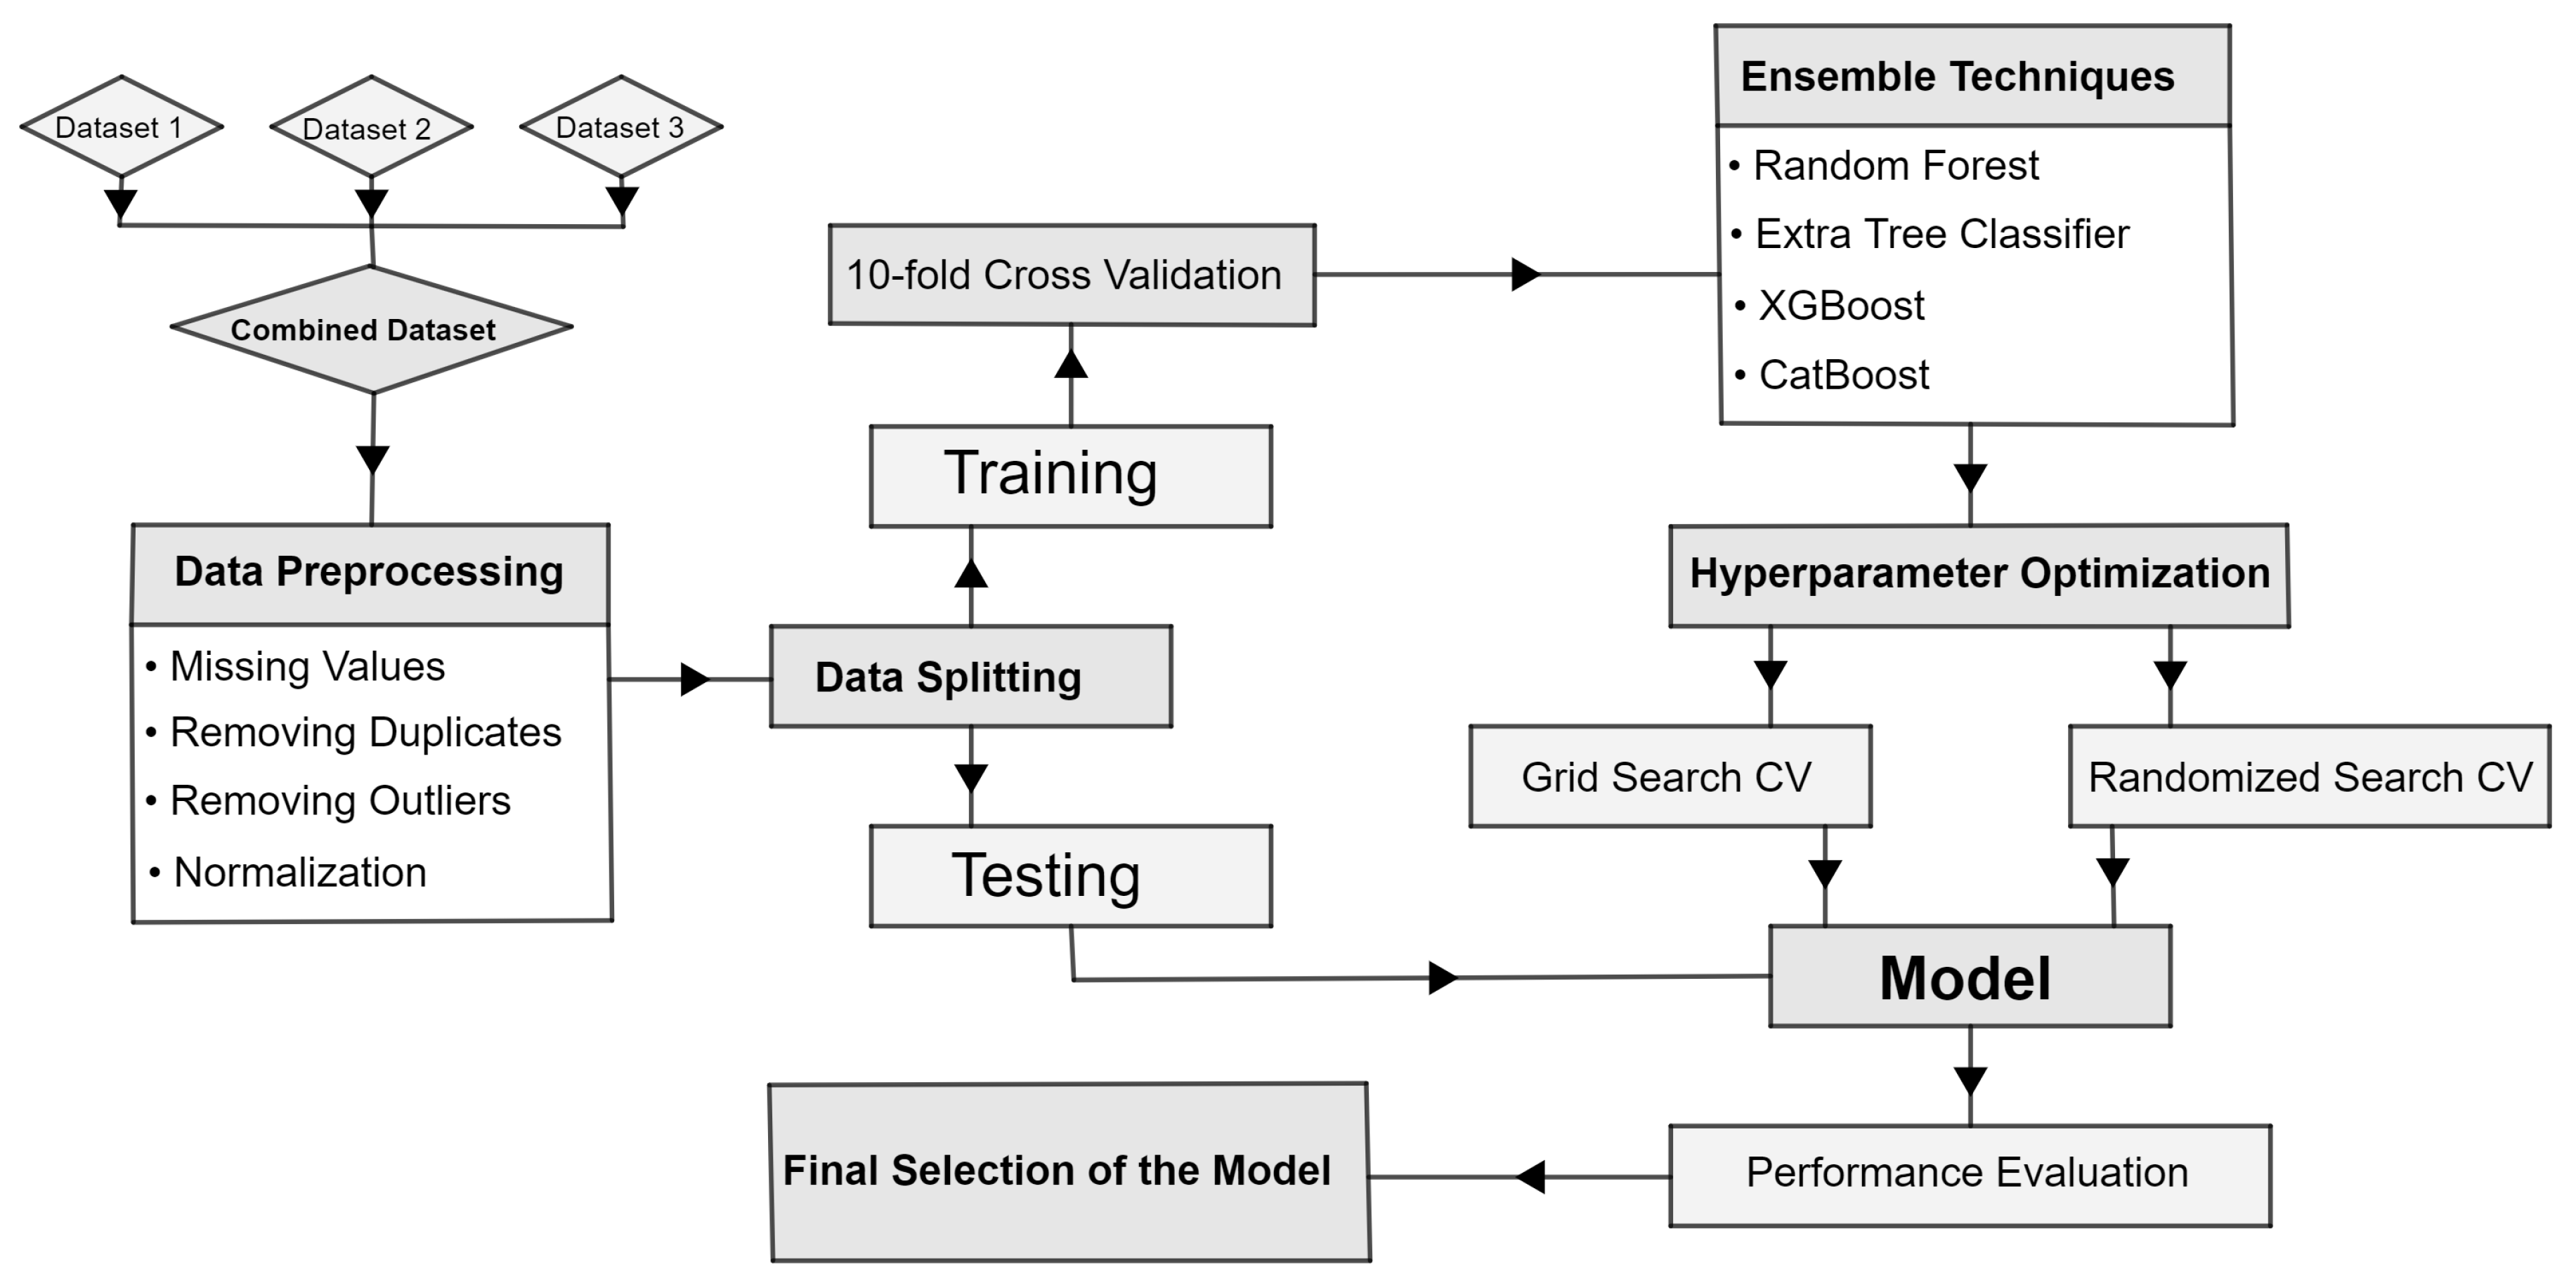
Figure 1 shows a flow chart diagram that outlines the sequential steps involved in predicting the probability of heart disease. The diagram visually depicts the data preprocessing procedures, such as cleaning, removing duplicate entries, detecting outliers, and scaling data. It also emphasizes the utilization of ensemble learning algorithms and the process of hyperparameter tuning to train and optimize the model. The flow chart serves as a visual representation of the study’s methodology, aiding in the comprehension of the research process.
3.1. Data Collection
In this study, we combined three datasets from Kaggle to enhance our analysis. Dataset 1 consisted of 297 patient records [
27], dataset 2 consisted of 1025 patient records [
28], and dataset 3 consisted of 303 patient records [
29]. Each dataset contained the same set of features, and we conducted a rigorous statistical analysis to ensure their compatibility for merging. By combining these datasets, we created a consolidated dataset comprising 1625 samples, enabling us to conduct a more comprehensive analysis. This merging process ensured the compatibility and reliability of the data, allowing us to effectively explore the relationships between predictive variables and the occurrence of heart disease. For further insights,
Table 1 provides a descriptive summary of the attributes involved in our comprehensive analysis.
3.2. Preprocessing
In the data preprocessing stage of this study, rigorous checks and transformations were performed to ensure the quality and suitability of the combined dataset. Firstly, a comprehensive search for missing values was conducted, revealing that the dataset was complete with no instances of missing data. This indicated the reliability and integrity of the dataset. Secondly, as the dataset was derived from a combination of three separate datasets, a thorough examination of duplicate values was carried out to ensure data consistency. This analysis confirmed the absence of any duplicates, reinforcing the accuracy of the dataset. Additionally, an outlier analysis was conducted to identify any extreme values that could potentially skew the analysis. Remarkably, no outliers were detected, underscoring the robustness of the dataset. To promote uniformity and facilitate meaningful comparisons among features, the data were scaled to a standardized range of 0 to 1. This scaling process enhanced the interpretability and analysis of the data. These thorough data preprocessing steps established a solid foundation for the reliable and high-quality analyses in this study.
3.3. Data Splitting
The process of data splitting played a vital role in this study. To ensure the development of a robust and accurate heart disease prediction model, the heart disease dataset was divided into an 80% training set and a 20% testing set. This division allowed the model to be trained on a significant portion of the data, enabling it to learn patterns and relationships effectively. The independent testing set served as a means to evaluate the model’s performance on unseen data, providing an unbiased assessment of its predictive capabilities.
3.4. Modeling
The utilization of ensemble learning algorithms was a crucial aspect of this research. Ensemble learning is a branch of machine learning that harnesses the power of combining multiple models to improve prediction accuracy and robustness [
30]. In this study, several ensemble learning techniques were employed, including random forest, extra tree classifier, XGBoost, and CatBoost.
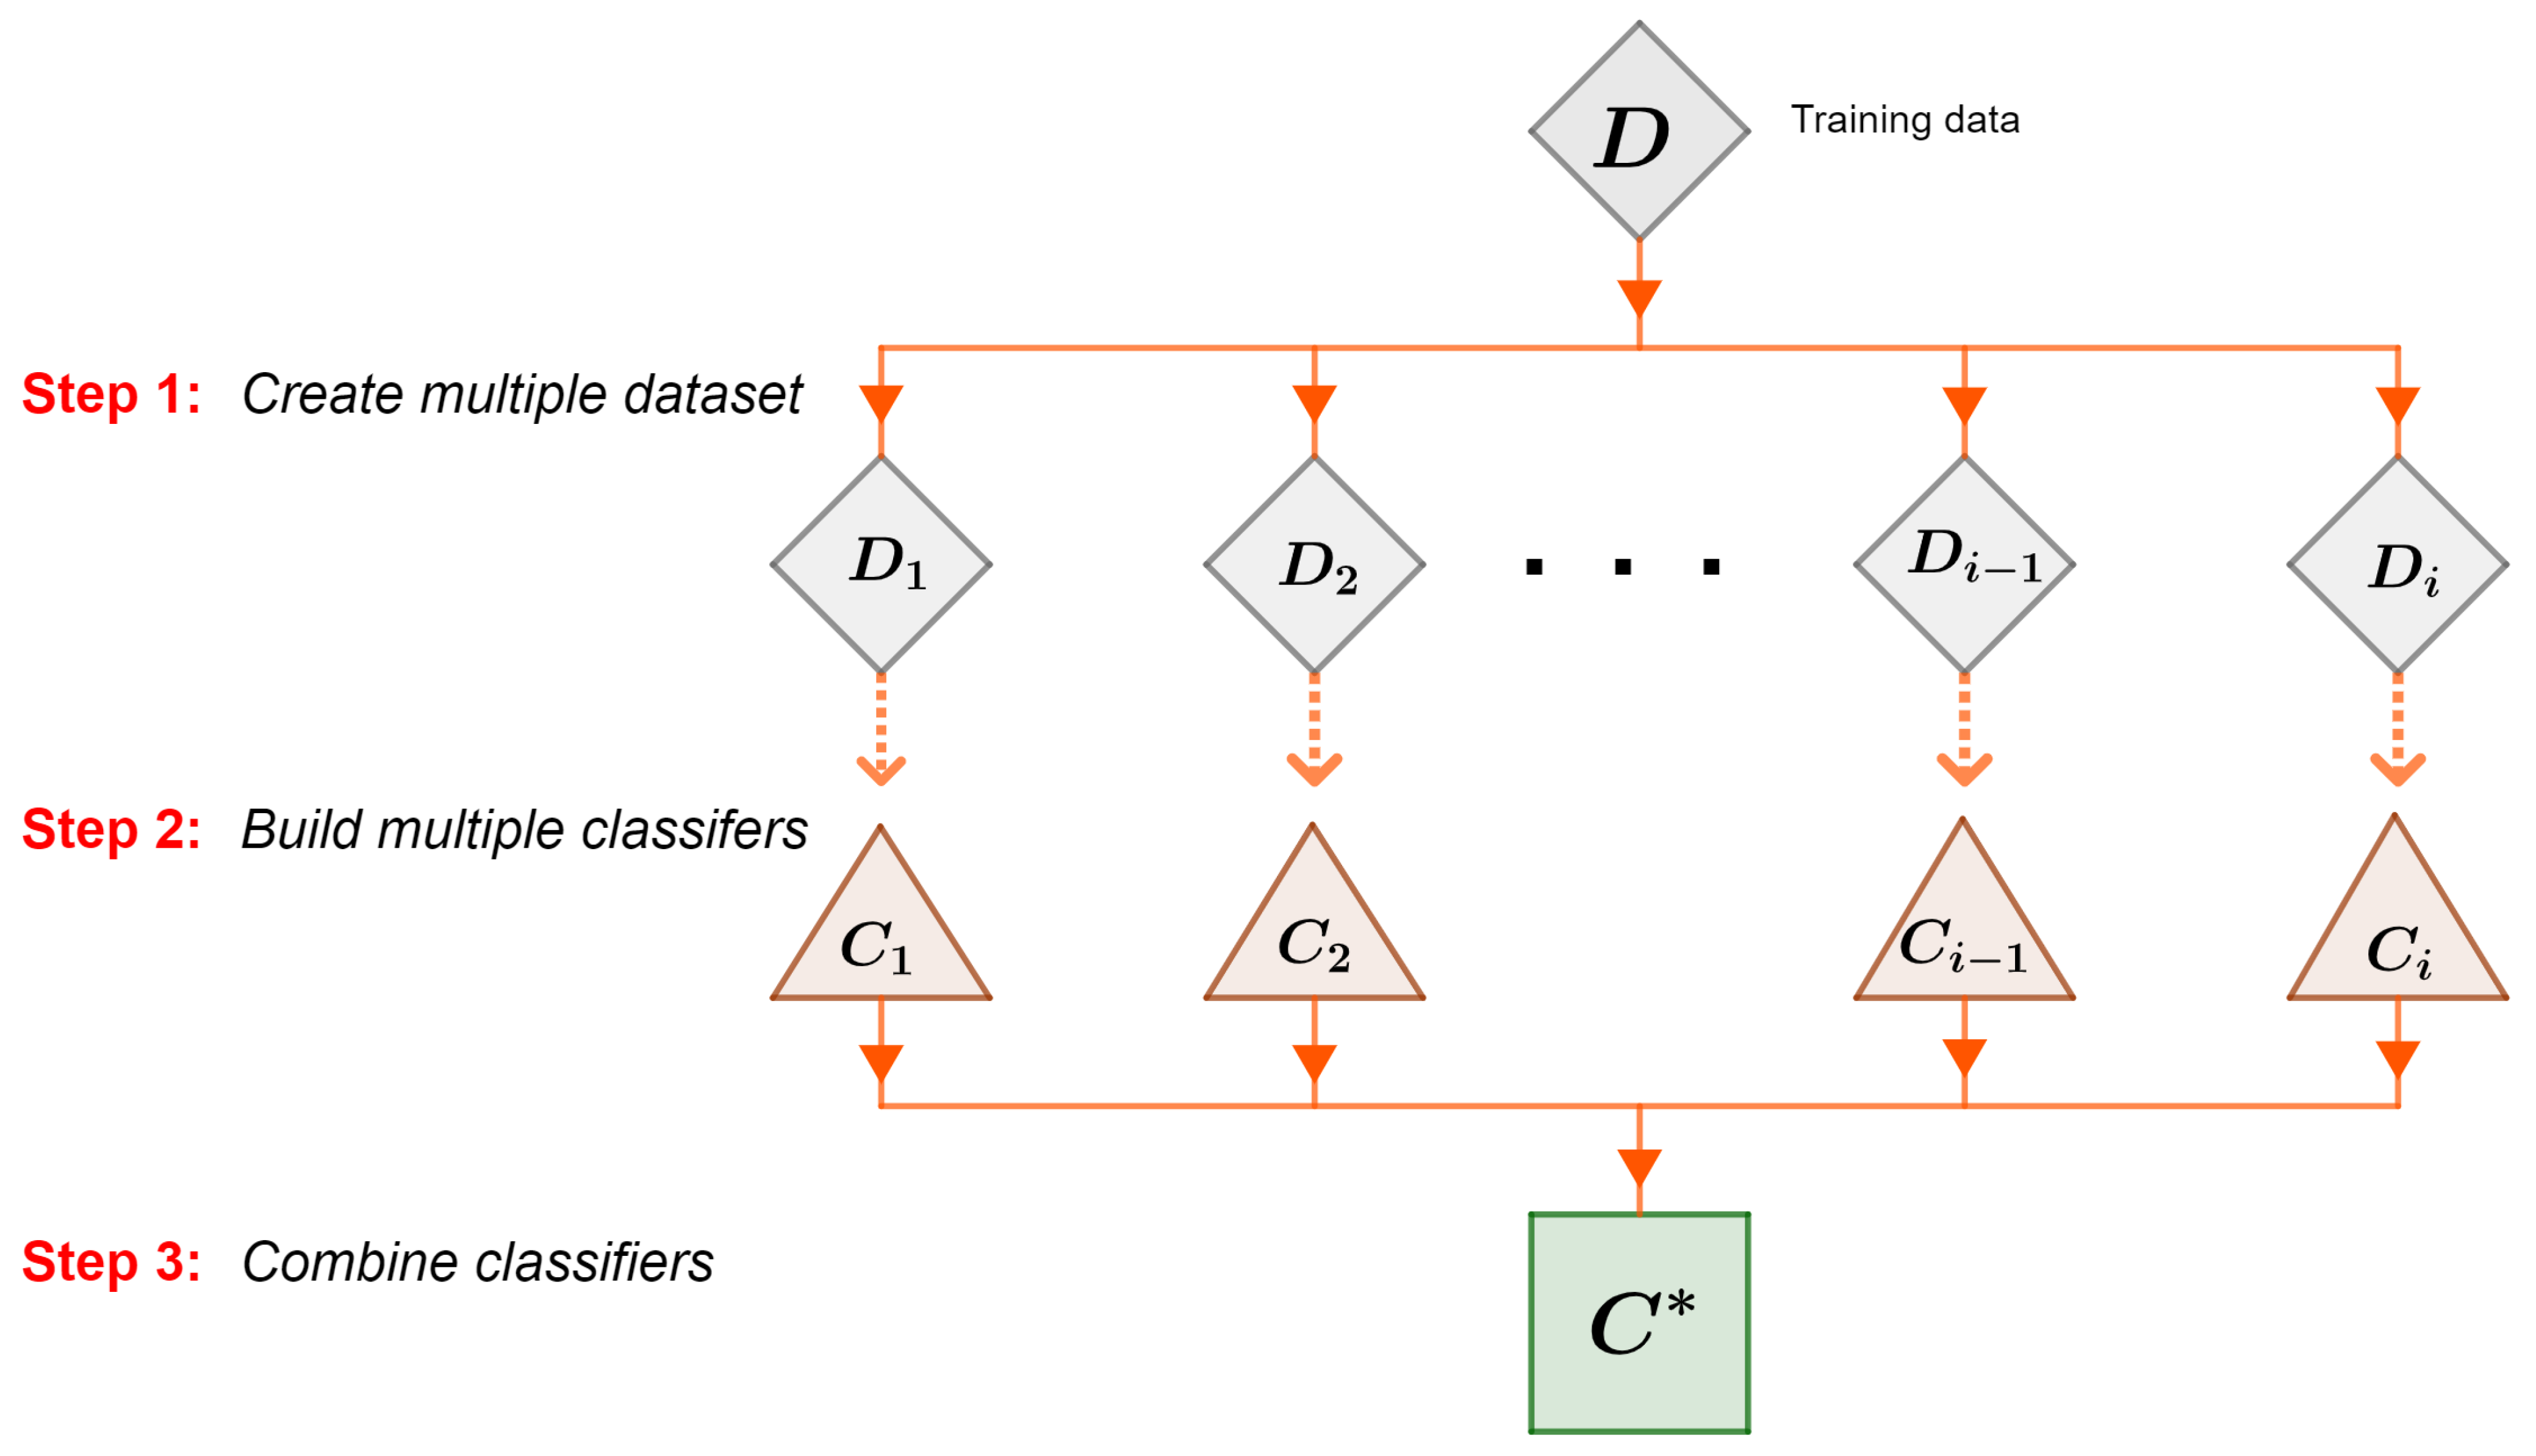
Ensemble learning entails training multiple individual models on the same dataset and aggregating their predictions to generate a final prediction.
Figure 2 provides an overview of this ensemble learning procedure, where the predictions of the individual classifiers are combined to produce a collective prediction. This aggregation enables the evaluation of ensemble models using performance metrics, such as accuracy, precision, recall, and F1-score.
In the following section, each ensemble learning technique that we used in this research is explained in detail, along with their respective pseudocodes and various hyperparameters. These algorithms were carefully chosen to leverage their unique strengths and enhance the accuracy and reliability of our heart disease prediction model.
3.4.1. Random Forest (RF)
The random forest algorithm proposed by L. Breiman [
31] is an ensemble learning method that combines multiple individual decision trees to create a powerful predictive model. Each decision tree in the random forest is constructed by recursively partitioning data based on the most informative features. At each node of the trees, the algorithm evaluates the Gini impurity and entropy of each attribute and selects the attribute that provides the most significant reduction in uncertainty.
The Gini impurity and entropy were calculated using the following formulae:
where
represents the probability of class
n.
Algorithm 1 provides the comprehensive pseudocode for the random forest classifier employed in this research. It outlines the essential steps and hyperparameter choices that were used for constructing the random forest model in this research. These hyperparameters included bootstrap, criterion, max depth, min samples split, n estimators, min samples leaf, class weight, and random state.
| Algorithm 1 The random forest pseudocode |
Require:Training dataset: D : [100, 200, 300] : [’sqrt’, ’log2’, None] : [42, 123] : [2, 5, 10] : [1, 2, 5] : [5, 10, 15] : [None, "balanced"] : [True, False] : ["gini", "entropy"]
Ensure:Ensemble prediction: procedure RandomForest(D, , , , , , , , , ) for to do is a bootstrap sample from D Build a decision tree on using end for State Majority vote of predictions from all trees on input X return end procedure
|
The bootstrap hyperparameter allowed sampling with replacement, facilitating the creation of distinct subsets of the training data for each tree in the forest. By evaluating the split quality based on the criterion hyperparameter, which determined the impurity measure, the model could effectively make decisions at each tree node. The max depth hyperparameter restricted the depth of each decision tree to prevent overfitting and enhance generalization. Additionally, the min samples split hyperparameter specified the minimum number of samples required to split a node, contributing to the optimal tree structure. Controlling the number of decision trees in the forest was achieved through the n estimators hyperparameter. Meanwhile, ensuring the reproducibility of results was facilitated by the random state hyperparameter [
32,
33].
3.4.2. Extra Tree Classifier (ETC)
The extra tree classifier (ETC), also known as extremely randomized trees, is an ensemble learning method that combines multiple decision trees to create a robust and accurate predictive model. It introduces an extra level of randomization during the tree-building process by randomly selecting splitting thresholds for each feature, thereby increasing diversity and reducing overfitting. This makes it well-suited for handling noisy data, outliers, and high-dimensional features [
34].
The extra tree classifier pseudocode provided in Algorithm 2 outlines the step-by-step procedure and hyperparameter choices that were used to construct an effective model in this research. These hyperparameters included the number of decision trees, the number of features to consider at each split, the random state for reproducibility, the number of estimators, the minimum number of samples required to split an internal node, the minimum number of samples required to be at a leaf node, the maximum number of features to consider at each split, the maximum depth of each tree, the split criterion, the class weights, and the use of bootstrap sampling.
By adjusting these hyperparameters, the behavior and performance of the extra tree classifier could be fine-tuned to meet the requirements of the dataset. For example, the number of decision trees influenced the complexity and diversity of the model. The number of features to consider at each split controlled the subset of features used for splitting nodes, while the random state ensured the reproducibility of the results. The number of estimators determined the number of trees in the ensemble. The minimum number of samples required to split an internal node and the minimum number of samples required to be at a leaf node defined the stopping criteria for tree growth. The maximum number of features to consider at each split limited the feature space explored during tree construction. The maximum depth of each tree restricted the depth of the decision trees, preventing overfitting. The split criterion determined the measure of impurity used to evaluate the split quality. Class weights could be assigned to balance the contributions of different classes during training. Finally, the bootstrap hyperparameter enabled sampling with replacement, allowing each tree in the ensemble to have a different subset of training data.
| Algorithm 2 The extra trees classifier pseudocode |
Require:training dataset: D : [100, 200, 300] : [’sqrt’, ’log2’, None] : [42, 123] : [2, 5, 10] : [1, 2, 5] : [5, 10, 15] : [None, "balanced"] : [True, False] : ["gini", "entropy"]
Ensure:-
Ensemble prediction: - 1:
procedure ExtraTreesClassifier(D, , , , , , , , , , , ) - 2:
for to do - 3:
Bootstrap sample from D - 4:
Build a decision tree on using and random split thresholds - 5:
end for - 6:
Majority vote of predictions from all trees on input X - 7:
return - 8:
end procedure
|
3.4.3. XGBoost
XGBoost (extreme gradient boost), developed by Tianqi Chen et al. in 2014 [
35], is a highly effective ensemble learning method that builds on the principles of gradient-boosting decision trees. It introduces regularization techniques to smooth the loss function and prevent overfitting, resulting in improved control over model complexity. XGBoost utilizes an efficient approximation algorithm to optimize splits, enhancing the efficiency and scalability of the gradient boosting process. Additionally, it exhibits robustness in handling missing or sparse values by allocating specific branches to address these scenarios.
The pseudocode in Algorithm 3 presents the comprehensive step-by-step procedure and hyperparameter choices used for constructing the XGBoost model in this research. Essential hyperparameters, such as learning rate, maximum tree depth, column subsampling by the tree, the number of estimators, and subsampling, were utilized to construct the model. The algorithm began by iterating a specified number of times to compute the gradients and Hessians for each sample in the training dataset. These gradients and Hessians played crucial roles in guiding the construction of the decision trees. In each iteration, a decision tree was built with a specified maximum depth, and the training dataset predictions were updated using the tree and the set learning rate. This iterative process allowed the XGBoost classifier to progressively enhance its predictions by incorporating knowledge from each decision tree. Once the ensemble of decision trees was constructed, the algorithm employed a prediction procedure to generate predictions for newly input data. The ensemble prediction started with an initial value of zero and then for each decision tree, a prediction was made based on the input data. The ensemble prediction was then updated by aggregating the predictions from each tree [
36,
37].
| Algorithm 3 The extreme gradient boost (XGBoost) pseudocode |
Require:training dataset: D : [0.1, 0.01, 0.001] : [0.8, 1.0] : [3, 5, 7] : [100, 200, 300] : [42, 123] : [0.8, 1.0]
Ensure:-
Ensemble prediction: - 1:
procedure XGBoostClassifier(D, , , , , , ) - 2:
for to N do - 3:
Compute gradients and Hessians for each sample in D - 4:
Build a decision tree with maximum depth t - 5:
Update training set predictions using the tree and learning rate - 6:
end for - 7:
Ensemble prediction Make prediction using the ensemble of decision trees on input X - 8:
return - 9:
end procedure - 10:
procedure XGBoostPrediction(X) - 11:
Ensemble prediction - 12:
for each decision tree do - 13:
Make prediction using the tree on input X - 14:
Update by adding the prediction - 15:
end for - 16:
return - 17:
end procedure
|
3.4.4. CatBoost
CatBoost, also known as category boost, is an ensemble learning algorithm developed in 2017. It was designed for gradient-boosting decision trees and offers enhancements to handle categorical variables effectively. One key feature of CatBoost is its automatic handling of categorical features, which eliminates the need for manual encoding. It utilizes a combination of one-hot and target encoding techniques for categorical variables with high cardinality.
The pseudocode in Algorithm 4 represents the steps used for constructing the CatBoost model in this research. The essential hyperparameters utilized in this process included the number of boosting iterations, which determined the number of trees in the ensemble and influenced the complexity and learning capacity of the model. The learning rate controlled the step size for updating the weights of each tree during the boosting process. The maximum tree depth governed the complexity and depth of the individual decision trees, affecting their ability to capture intricate patterns in the data. Lastly, the
regularization strength regulated the penalties applied to the leaf weights, aiding in preventing overfitting and enhancing the generalization capabilities of the model [
38,
39,
40,
41].
| Algorithm 4 The category boost (CatBoost) pseudocode |
Require:Training dataset: D : [100, 200, 300] : [0.01, 0.1, 0.5] : [4, 6, 8] : [1, 3, 5] : [42, 123]
Ensure: Ensemble prediction: - 1:
procedure CatBoostClassifier(D, , , , , ) - 2:
Initialize an empty ensemble - 3:
for to N do - 4:
Train a decision tree on D with the given parameters - 5:
for each sample x in D do - 6:
Compute the prediction of on x: - 7:
Update the ensemble prediction: - 8:
end for - 9:
end for - 10:
return - 11:
end procedure - 12:
procedure CatBoostPrediction(X) - 13:
Ensemble prediction - 14:
for each decision tree do - 15:
Make prediction using on input X - 16:
Update by adding the prediction - 17:
end for - 18:
return - 19:
end procedure
|
3.5. Hyperparameter Optimization
Hyperparameter tuning is a crucial step in machine learning to optimize the performance of models. In this study, we employed the following two commonly used techniques for hyperparameter optimization: grid search CV and randomized search CV [
42,
43,
44].
Grid search CV systematically explores predefined grids of hyperparameter values. These grids are defined by specifying different values or ranges for each hyperparameter of interest. Grid search CV then evaluates model performance for each combination of hyperparameters using CV. This exhaustive search approach ensures that all possible combinations within the grid are considered, allowing for a comprehensive exploration of the hyperparameter space. However, it can be computationally expensive, especially when dealing with a large number of hyperparameters or a wide range of possible values for each hyperparameter.
Randomized search CV, on the other hand, takes a more flexible and efficient approach. Instead of exhaustively evaluating all possible combinations, it randomly samples a specified number of hyperparameter combinations from a given distribution. This distribution can be defined based on prior knowledge or assumptions about the hyperparameter space. By using random sampling, randomized search CV can explore a broader range of hyperparameter combinations, potentially discovering better performance configurations that may not have been considered in the grid. This technique is particularly useful when the hyperparameter space is large and computationally expensive to search exhaustively.
Both grid search and randomized search CV utilize
k-fold CV to evaluate model performance for each set of hyperparameters. This helps to obtain reliable estimates of model performance by dividing data into
k equal folds and using each part as a validation dataset while the remaining parts are used for training. This approach helps to prevent overfitting and provides a more robust evaluation of the generalization ability of models [
45].
3.6. Performance Evaluation
The performance metrics used in this research played crucial roles in evaluating the effectiveness and accuracy of the classifiers. Several metrics were employed, including accuracy, recall, precision, F1-score, Cohen’s kappa
, and AUC-ROC. These metrics provided valuable insights into different aspects of the classifiers’ performance. The evaluation was based on the confusion matrix shown in
Table 2, which depicts the classification results in terms of true positives
, true negatives
, false positives
, and false negatives
.
represents the instances that were correctly predicted as the positive class, while
represents instances that were correctly predicted as the negative class.
are instances that were incorrectly predicted as the positive class and
are instances that were incorrectly predicted as the negative class.
AUC-ROC: The area under the ROC curve (AUC-ROC) is a metric that quantifies the performance of a classification model across all possible classification thresholds. It represents the trade-off between the true positive rate and the false positive rate as the classification threshold varies from 0 to 1. An AUC-ROC value of 1 indicates a flawless model, whereas an AUC-ROC value of 0.5 indicates a subpar model [
46].
PRC: A precision–recall curve (PRC) is a graphical representation that depicts the relationships between precision and recall for different classification thresholds in a binary classification problem. It illustrates how changes in the classification threshold impact the trade-off between precision and recall [
47].
4. Results
Our experimental study on a combined heart dataset utilized various classification algorithms, preprocessing steps, and hyperparameter optimization techniques. The results demonstrated good accuracy in predicting heart disease, with some algorithms performing exceptionally well. The preprocessing steps, such as handling missing values, removing duplicates and outliers, and data normalization, contributed to the improved performance. The ensemble learning algorithms used in the study, including extra tree classifier, random forest, XGBoost, and CatBoost, were compared to identify the most suitable approach for accurate classification. The dataset was split using an 80:20 ratio for training and testing, and the analysis was conducted using Python programming.
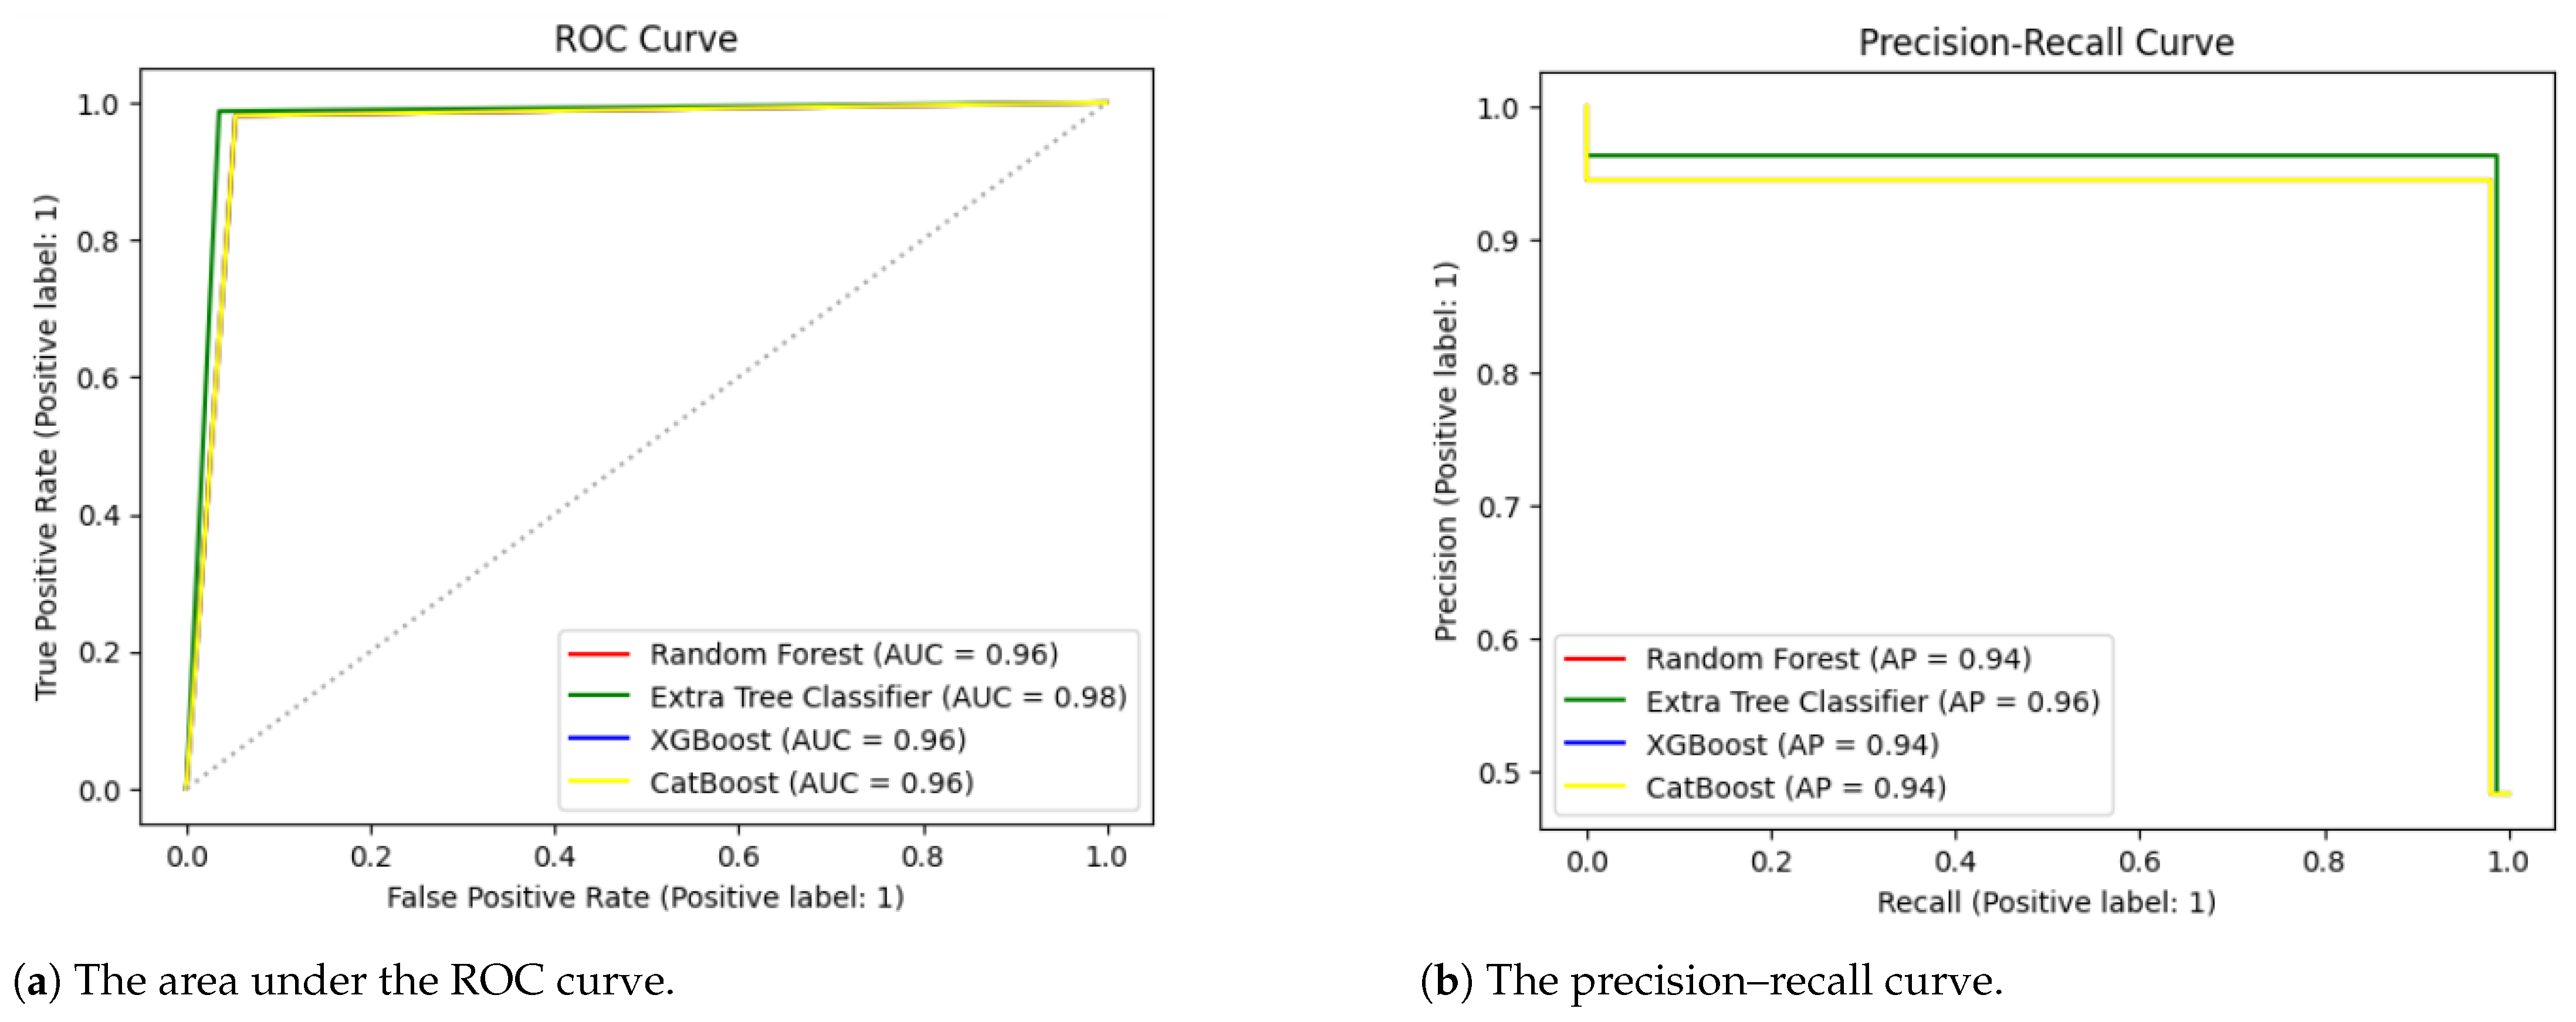
4.1. Performance Evaluation Using Default Hyperparameter Settings
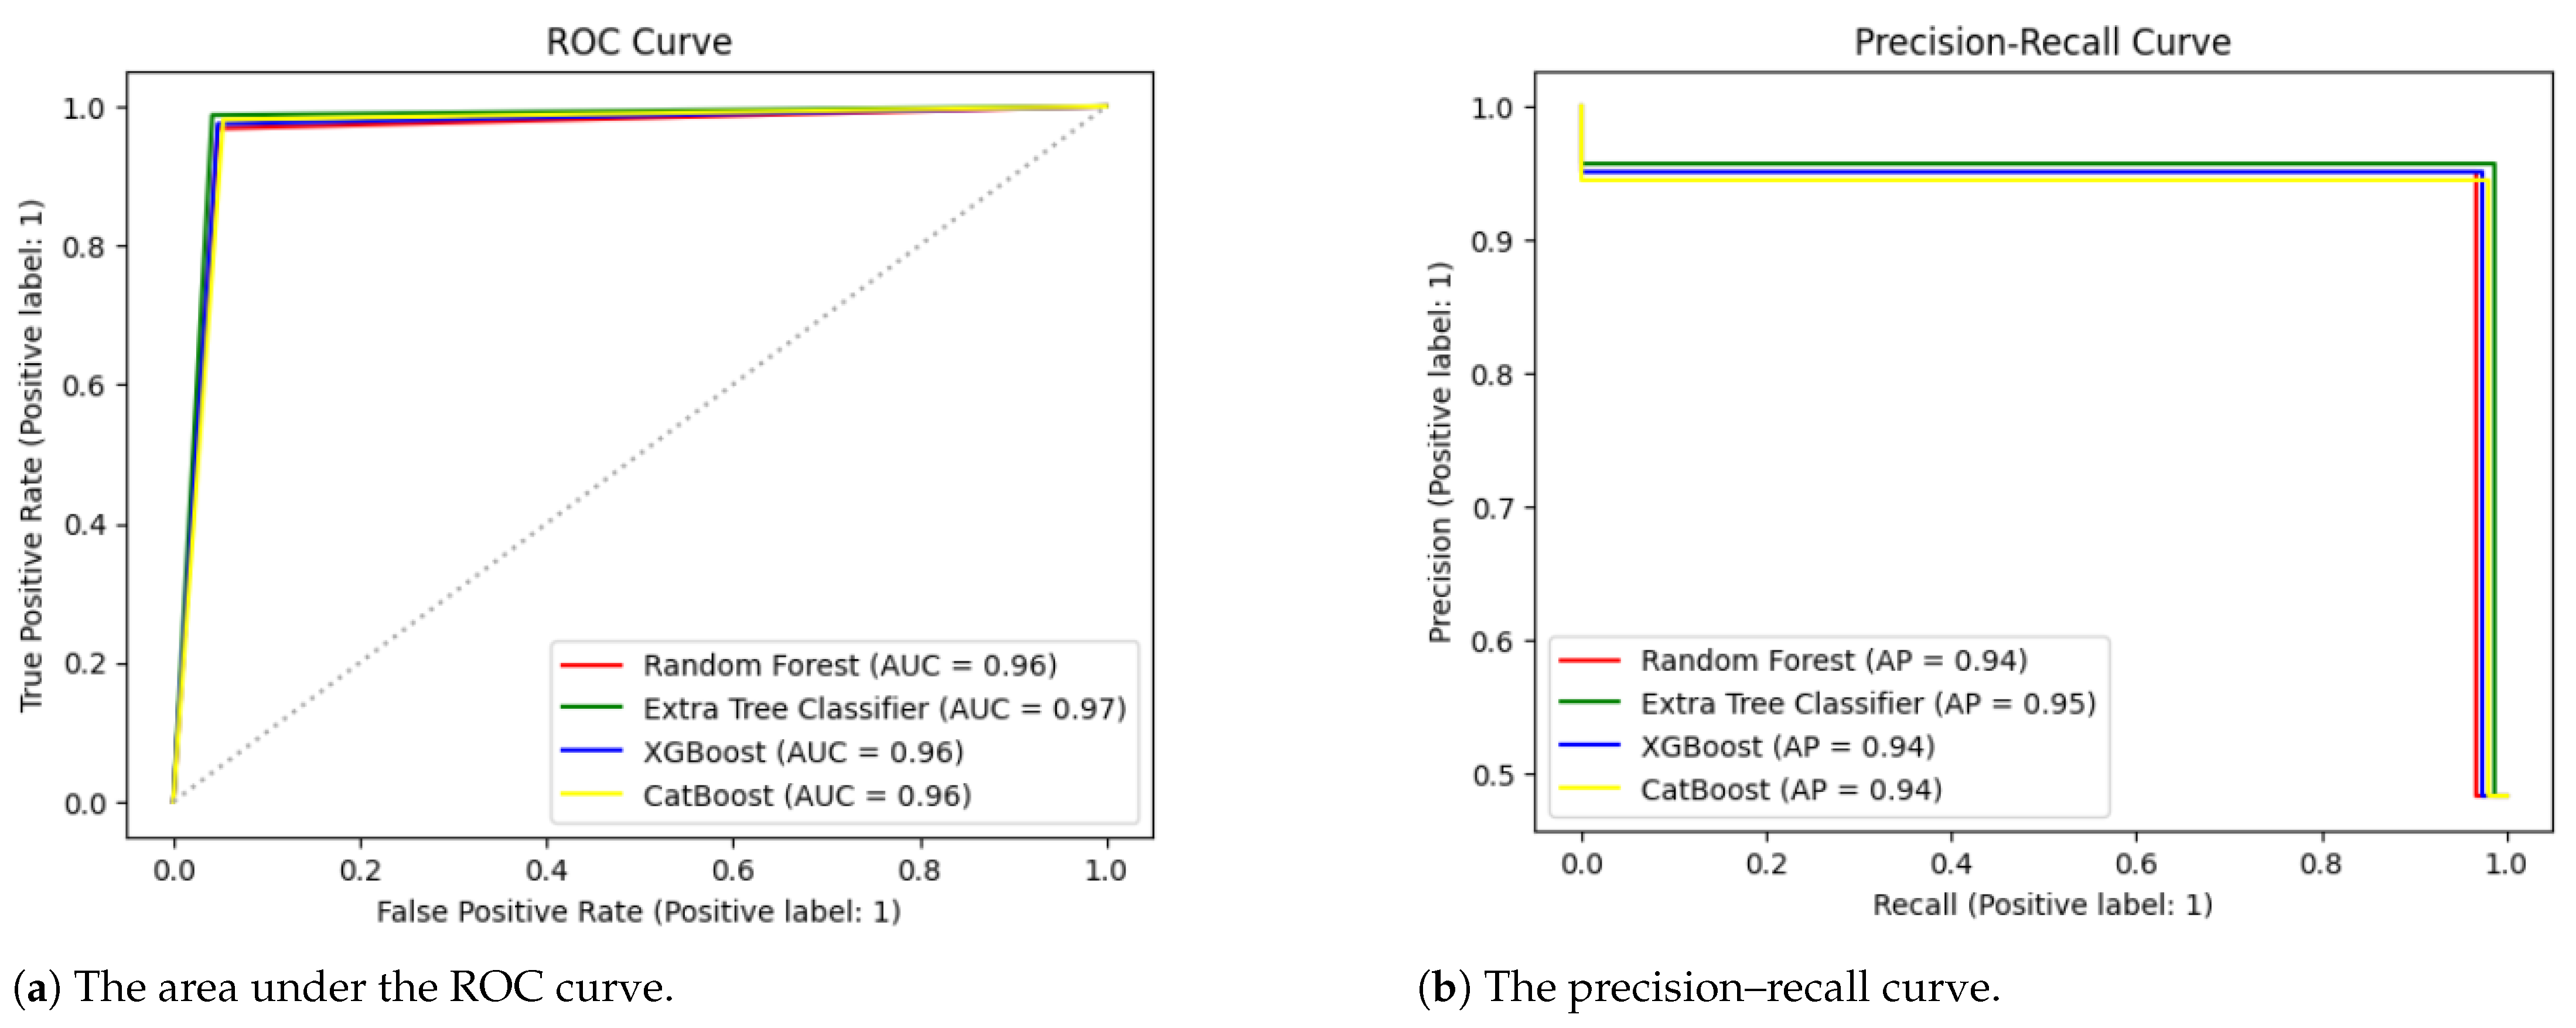
Table 3 presents the overall accuracy, precision, recall, F1-score, and Cohen’s kappa values for all four algorithms using the default hyperparameter settings. The extra tree classifier showed the highest accuracy of 97.23%. It also produced the highest precision of 95.68%, recall of 98.72%, F1-score of 97.18%, and Cohen’s kappa of 94.46%. To further validate our results, we applied an ROC curve and PR curve, as demonstrated in
Figure 3. The extra tree classifier performed better than the random forest, XGBoost and CatBoost models.
4.2. Performance Evaluation Using Randomized Search CV
Table 4 presents the optimal combinations of hyperparameters obtained using randomized search CV. These were selected based on their superior performance using tenfold randomized search CV, with 50 iterations.
Table 5 presents the impact of these hyperparameters on model performance. Among all of the algorithms, the extra tree classifier showcased exceptional results, achieving accuracy of 97.54%, precision of 96.27%, recall of 98.72%, F1-score of 97.48%, and Cohen’s kappa of 95.07%. To further validate our results, we applied an ROC curve and PR curve, as demonstrated in
Figure 4. The extra tree classifier performed better than the random forest, XGBoost and CatBoost models.
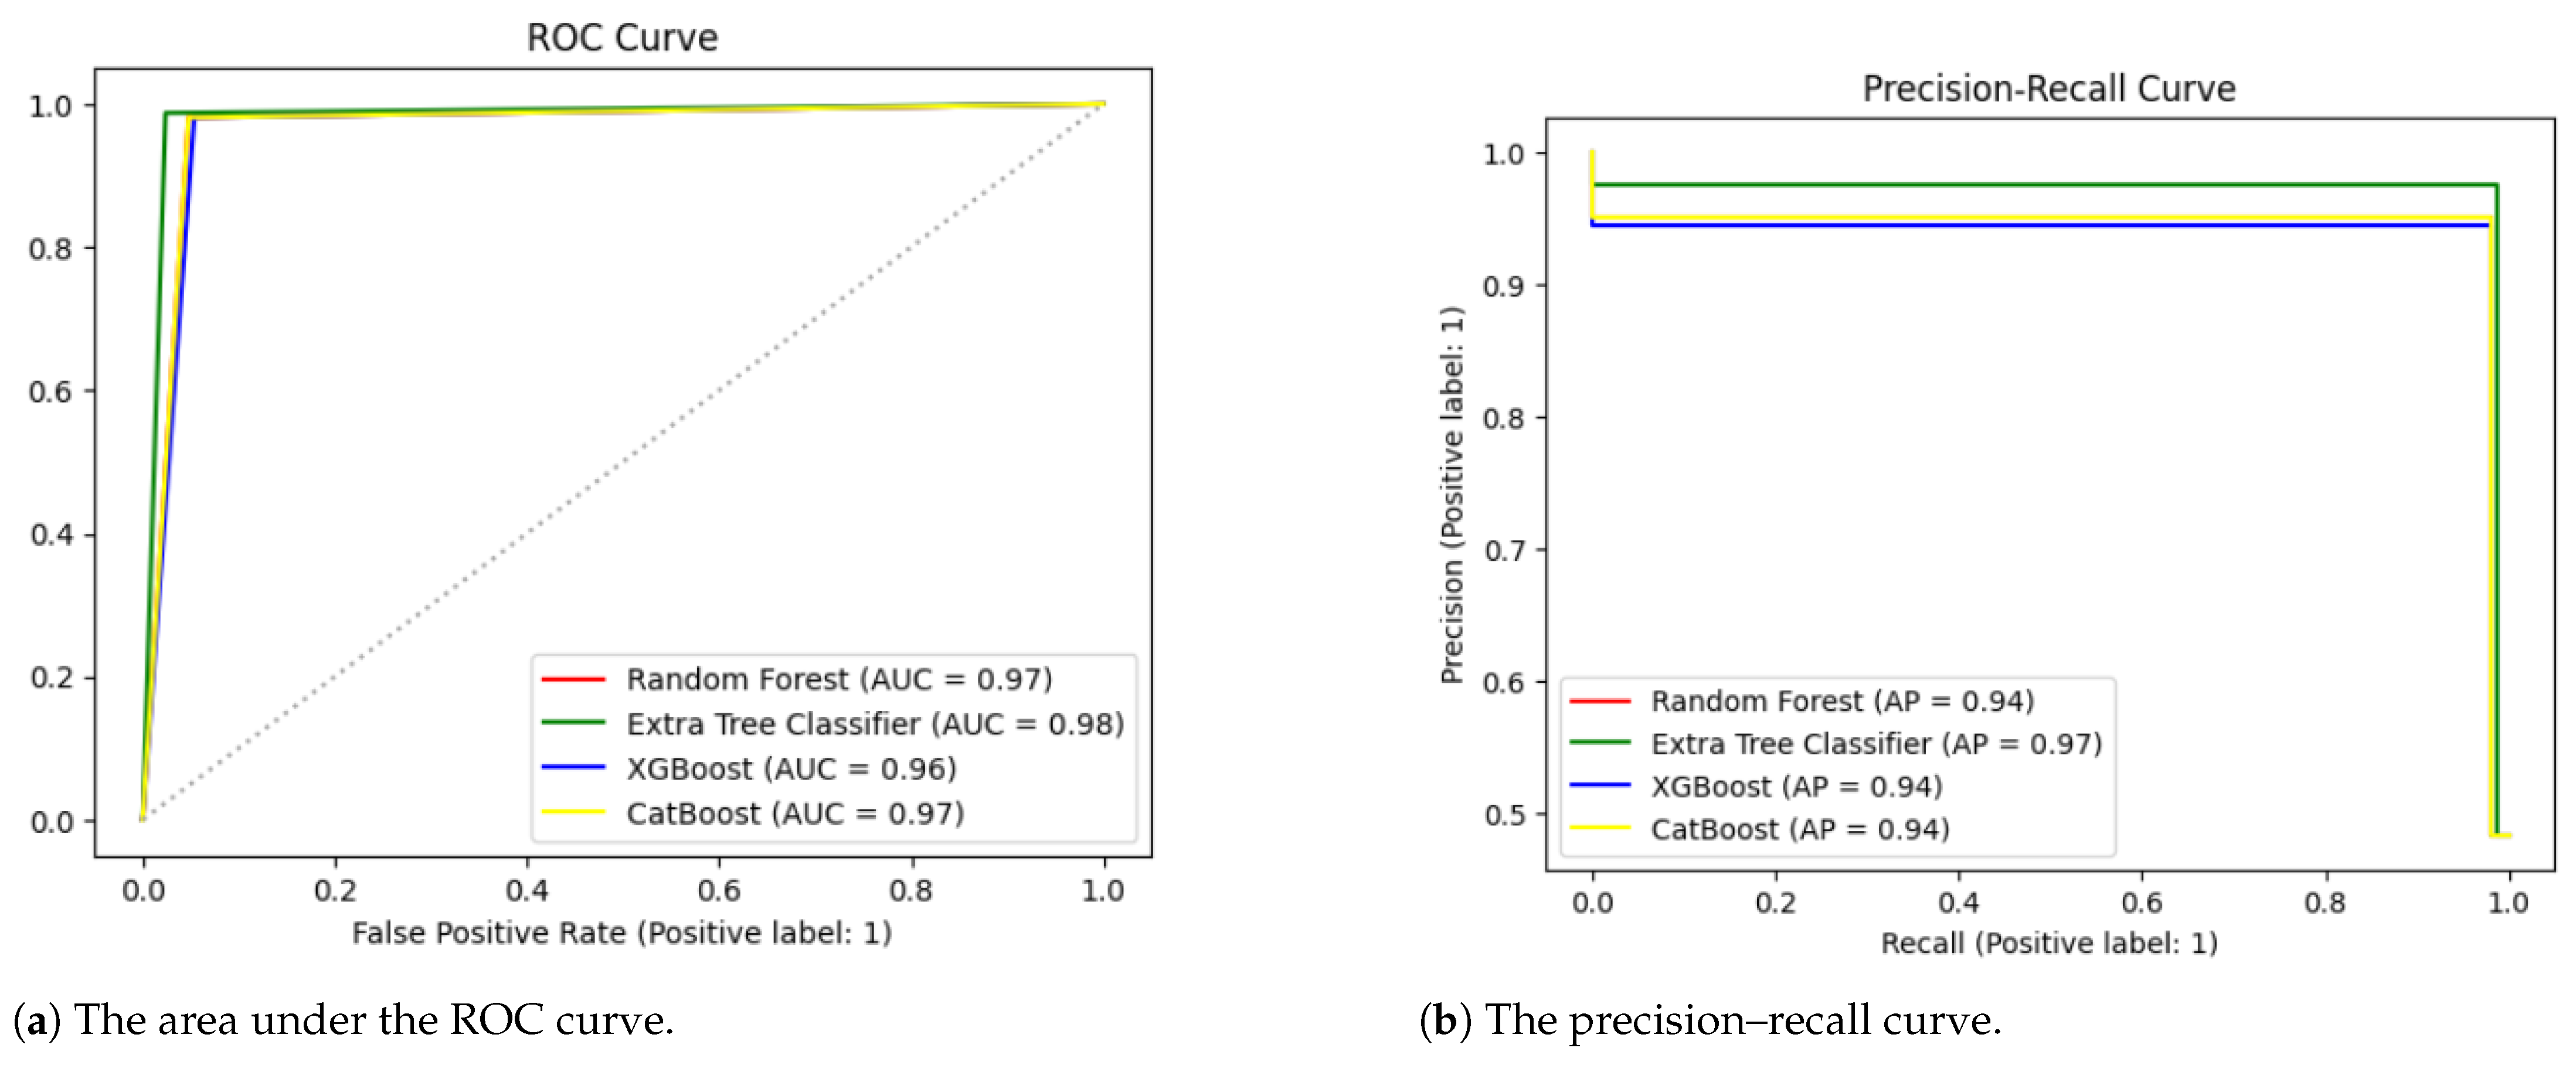
4.3. Performance Evaluation Using Grid Search CV
Table 6 presents the optimal combination of hyperparameters obtained using grid search CV. These hyperparameters were selected based on their superior performance using 10-fold CV.
Table 7 presents the impact of these hyperparameters on model performance. The extra tree classifier outperformed all other algorithms, attaining an accuracy of 98.15%, precision of 97.48%, recall of 98.72%, F1-score of 98.10%, and Cohen’s kappa of 96.30%. To further validate our results, we applied an ROC curve and PR curve, as demonstrated in
Figure 5. The extra tree classifier performed better than the random forest, XGBoost and CatBoost models.
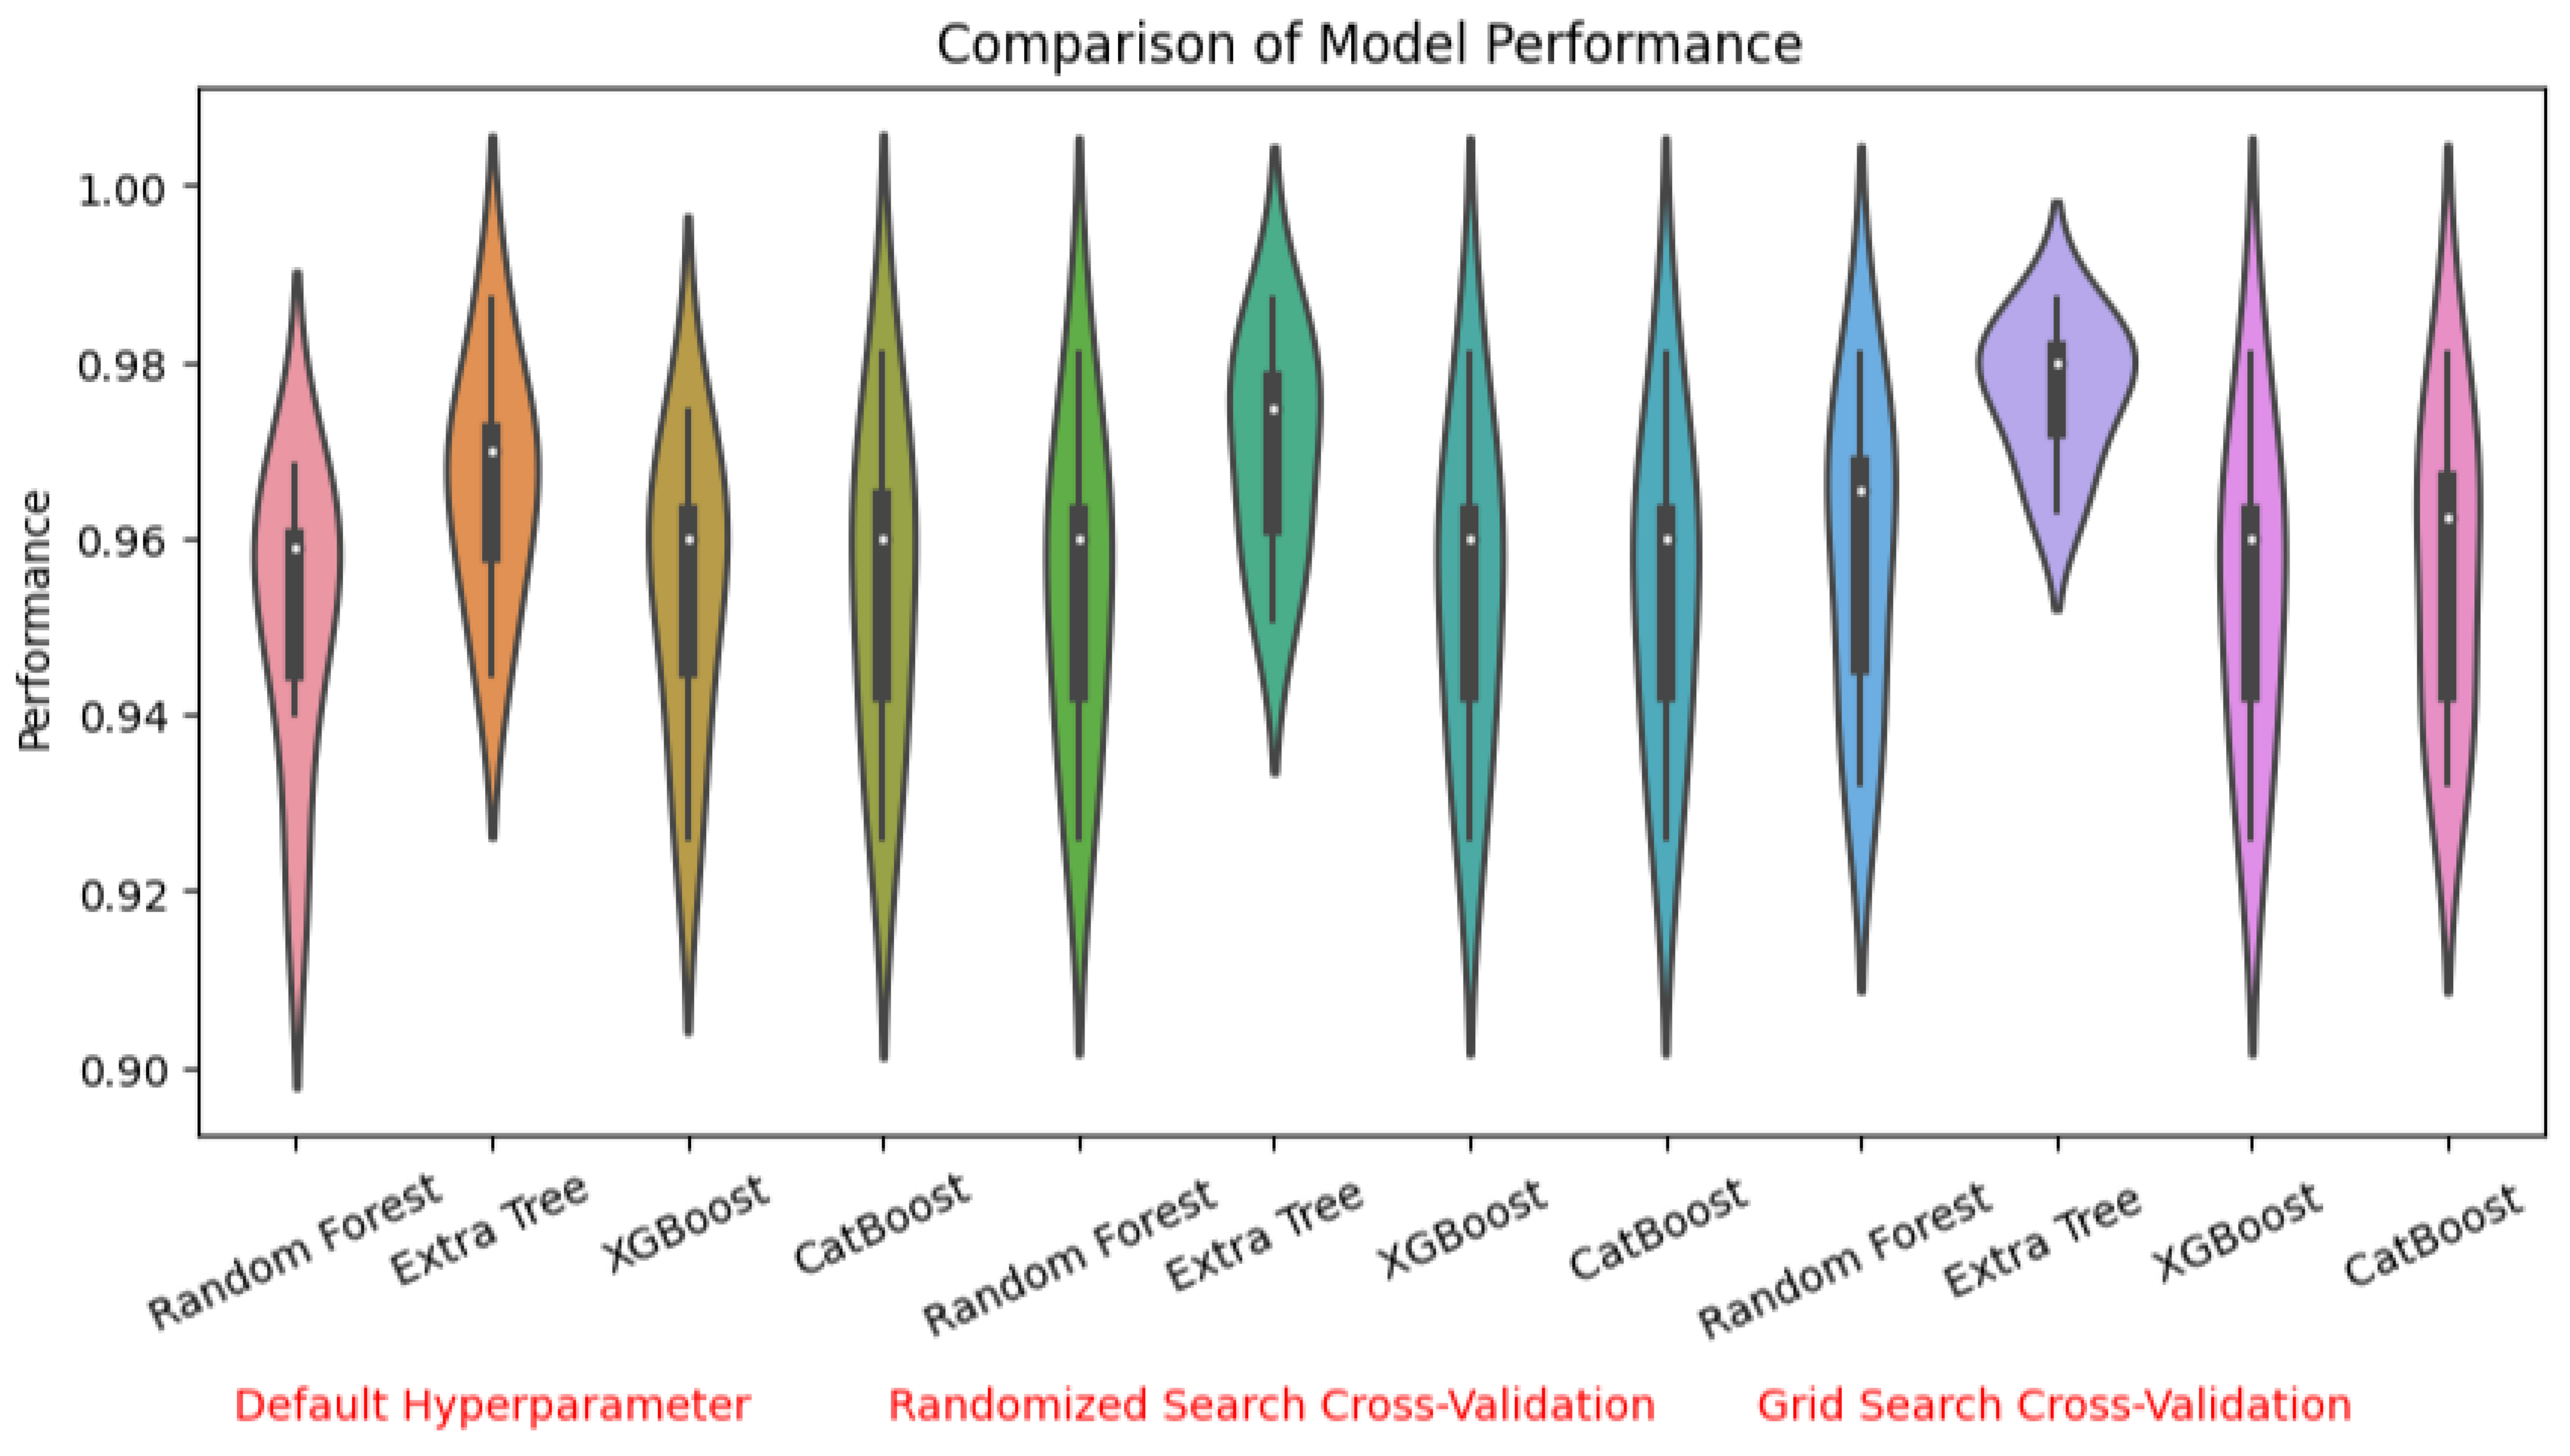
4.4. Performance Comparison
To compare the ensemble models using the different types of hyperparameter optimization, a violin plot was employed to visualize their performance. Violin plots offer valuable insights into the widths, lengths, and central points of the violins. Wider violins indicate a higher density of values, implying better performance, while longer violins suggest a larger spread of performance values. The central points represent the median performance, providing an estimate of the average. Outliers represent extreme values [
48].
Figure 6 displays our comparison of the models’ performance. It was observed that the extra tree model consistently outperformed all other models when the hyperparameters were optimized using grid search CV. This highlighted the remarkable effectiveness of the extra tree model, especially when fine-tuned using grid search CV hyperparameter optimization.
5. Discussion
In this study, we analyzed the performance of four different ensemble learning algorithms (extra tree classifier, random forest, XGBoost, and CatBoost) by considering hyperparameter tuning using default settings and hyperparameter optimization techniques. The evaluation was conducted using an 80:20 split ratio for training and testing data, and we also applied various preprocessing steps, including handling missing values, removing outliers and duplicates, and normalizing data to a scale of 0 to 1. Through the use of different hyperparameter optimization methods, such as grid search CV and randomized search CV, we identified the best hyperparameters for each algorithm. The results showed that the extra tree classifier algorithm performed better than the others.
Based on the obtained results, we observed that grid search CV outperformed the other hyperparameter optimization techniques. The evaluation of the default hyperparameter settings and the optimal hyperparameters obtained using grid search CV and randomized search CV for the extra tree classifier revealed that the optimal hyperparameters obtained using grid search CV yielded superior results compared to those obtained using the default settings and randomized search CV.
Based on our analysis, we concluded that the extra tree classifier achieved an accuracy of 97.23% using the default hyperparameter settings. However, when we applied hyperparameter optimization using the randomized search technique, the accuracy improved to 97.54%. Furthermore, when we utilized the grid search CV technique, the accuracy further increased to 98.15%. These results indicated that employing grid search CV for hyperparameter optimization significantly improved the performance of the extra tree classifier in predicting heart disease.
6. Conclusions
In this study, we evaluated four ensemble learning algorithms (extra tree classifier, random forest, XGBoost, and CatBoost) along with various hyperparameter optimization techniques to predict heart disease. We combined three datasets from Kaggle, which had similar features, to create a comprehensive dataset for analysis. The results of our experiments demonstrated that the hyperparameter optimization techniques significantly influenced the performance of the algorithms. Specifically, our proposed model achieved the higher accuracy of 98.15% when utilizing the extra tree algorithm, an 80:20 split ratio, and the optimal hyperparameters obtained using grid search CV. This model has the potential to assist researchers and practitioners in heart disease-related tasks.
However, there were limitations to consider in our study. We focused on a specific set of ensemble learning techniques, and exploring other approaches could potentially yield further improvements in heart disease prediction. Additionally, the dataset used was limited in terms of size and diversity, and expanding it could enhance the generalizability of the model. Future research should also consider integrating clinical variables and genetic data to improve the accuracy and precision of heart disease prediction models. Moreover, external validation and evaluations in real-world healthcare settings are crucial to assess the practical implementation and impacts of ensemble learning techniques in diagnosing heart disease. Addressing these limitations and incorporating these suggestions in future studies could contribute to the advancement of predictive models and their applications in clinical practice.
Author Contributions
D.A., conceptualization, data curation, methodology, software, validation, visualization, writing-original draft; M.B., conceptualization, supervision, writing—review and editing; M.S.A., conceptualization, methodology, validation, project administration, visualization, writing—original draft; A.M., funding acquisition, supervision, writing—review and editing. All authors have read and agreed to the published version of the manuscript.
Funding
The authors would like to acknowledge the support of Prince Sultan University for paying the Article Processing Charges (APC) of this publication.
Institutional Review Board Statement
Not applicable.
Informed Consent Statement
Not applicable.
Data Availability Statement
The manuscript included all required data and implementing information.
Acknowledgments
We would like to extend our gratitude to the Prince Sultan University, Riyadh, Saudi Arabia, for facilitating the publication of this paper through the Theoretical and Applied Sciences Lab.
Conflicts of Interest
The authors declare no conflict of interest.
References
- Bonow, R.O.; Mann, D.L.; Zipes, D.P.; Libby, P. Braunwald’s Heart Disease E-Book: A Textbook of Cardiovascular Medicine; Elsevier Health Sciences: Amsterdam, The Netherlands, 2011. [Google Scholar]
- Monika, G.; Singh, S.N. Predictions in heart disease using techniques of data mining. In Proceedings of the 2015 International Conference on Futuristic Trends on Computational Analysis and Knowledge Management (ABLAZE), Noida, India, 25–27 February 2015; pp. 520–525. [Google Scholar]
- Gaidai, O.; Yan, P.; Xing, Y. Future world cancer death rate prediction. Sci. Rep. 2023, 13, 303. [Google Scholar] [CrossRef] [PubMed]
- Fida, B.; Nazir, M.; Naveed, N.; Akram, S. Heart disease classification ensemble optimization using genetic algorithm. In Proceedings of the 2011 IEEE 14th International Multitopic Conference, Karachi, Pakistan, 22–24 December 2011; pp. 19–24. [Google Scholar]
- Anderson, R.N.; Smith, B.L. Deaths: Leading causes for 2002. Natl. Vital Stat. Rep. 2005, 53, 1–89. [Google Scholar] [PubMed]
- Bui, A.L.; Horwich, T.B.; Fonarow, G.C. Epidemiology and risk profile of heart failure. Nat. Rev. Cardiol. 2011, 8, 30–41. [Google Scholar] [CrossRef] [PubMed]
- Nahar, J.; Imam, T.; Tickle, K.S.; Chen, Y.P. Computational intelligence for heart disease diagnosis: A medical knowledge driven approach. Expert Syst. Appl. 2013, 40, 96–104. [Google Scholar] [CrossRef]
- Dalen, J.E.; Alpert, J.S.; Goldberg, R.J.; Weinstein, R.S. The epidemic of the 20th century: Coronary heart disease. Am. J. Med. 2014, 127, 807–812. [Google Scholar] [CrossRef] [PubMed]
- Kenchaiah, S.; Narula, J.; Vasan, R.S. Risk factors for heart failure. Med. Clin. 2004, 88, 1145–1172. [Google Scholar] [CrossRef]
- Dahlöf, B. Cardiovascular disease risk factors: Epidemiology and risk assessment. Am. J. Cardiol. 2010, 105, 3A–9A. [Google Scholar] [CrossRef]
- Tarkanyi, G.; Tenyi, A.; Hollos, R.; Kalmar, P.J.; Szapary, L. Optimization of Large Vessel Occlusion Detection in Acute Ischemic Stroke Using Machine Learning Methods. Life 2022, 12, 230. [Google Scholar] [CrossRef]
- Sayadi, M.; Varadarajan, V.; Sadoughi, F.; Chopannejad, S.; Langarizadeh, M. A Machine Learning Model for Detection of Coronary Artery Disease Using Noninvasive Clinical Parameters. Life 2022, 12, 1933. [Google Scholar] [CrossRef]
- Jothi, N.; Husain, W. Data mining in healthcare—A review. Procedia Comput. Sci. 2015, 72, 306–313. [Google Scholar] [CrossRef]
- Waigi, D.; Choudhary, D.S.; Fulzele, D.P.; Mishra, D. Predicting the risk of heart disease using advanced machine learning approach. Eur. J. Mol. Clin. Med. 2020, 7, 1638–1645. [Google Scholar]
- Ramesh, T.R.; Lilhore, U.K.; Poongodi, M.; Simaiya, S.; Kaur, A.; Hamdi, M. Predictive analysis of heart diseases with machine learning approaches. Malays. J. Comput. Sci. 2022, 132–148. [Google Scholar] [CrossRef]
- Haseena, S.; Priya, S.K.; Saroja, S.; Madavan, R.; Muhibbullah, M.; Subramaniam, U. Moth-Flame Optimization for Early Prediction of Heart Diseases. Comput. Math. Methods Med. 2022, 1, 9178302. [Google Scholar]
- Ramalingam, V.V.; Dandapath, A.; Raja, M.K. Heart disease prediction using machine learning techniques: A survey. Int. J. Eng. Technol. 2018, 7, 684–687. [Google Scholar] [CrossRef]
- Bhatt, C.M.; Patel, P.; Ghetia, T.; Mazzeo, P.L. Effective Heart Disease Prediction Using Machine Learning Techniques. Algorithms 2023, 16, 88. [Google Scholar] [CrossRef]
- Ogundepo, E.A.; Yahya, W.B. Performance analysis of supervised classification models on heart disease prediction. Innov. Syst. Softw. Eng. 2023, 19, 129–144. [Google Scholar] [CrossRef]
- Zeng, M. The Prediction of Heart Failure based on Four Machine Learning Algorithms. Highlights Sci. Eng. Technol. 2023, 39, 1377–1382. [Google Scholar] [CrossRef]
- Khan, A.; Qureshi, M.; Daniyal, M.; Tawiah, K. A Novel Study on Machine Learning Algorithm-Based Cardiovascular Disease Prediction. Health Soc. Care Community 2023, 2023, 1406060. [Google Scholar] [CrossRef]
- Bizimana, P.C.; Zhang, Z.; Asim, M.; El-Latif, A.; Ahmed, A. An Effective Machine Learning-Based Model for an Early Heart Disease Prediction. BioMed Res. Int. 2023, 52, 181–184. [Google Scholar] [CrossRef]
- Almustafa, K.M. Prediction of heart disease and classifiers’ sensitivity analysis. BMC Bioinform. 2020, 21, 278. [Google Scholar] [CrossRef]
- Shah, D.; Patel, S.; Bharti, S.K. Heart disease prediction using machine learning techniques. SN Comput. Sci. 2020, 1, 345. [Google Scholar] [CrossRef]
- Garg, A.; Sharma, B.; Khan, R. Heart disease prediction using machine learning techniques. IOP Conf. Ser. Mater. Sci. Eng. 2021, 1022, 012046. [Google Scholar] [CrossRef]
- Shorewala, V. Early detection of coronary heart disease using ensemble techniques. Informatics Med. Unlocked 2021, 26, 100655. [Google Scholar] [CrossRef]
- Heart Disease Cleveland UCI. Available online: https://www.kaggle.com/datasets/cherngs/heart-disease-cleveland-uci (accessed on 30 April 2023).
- Heart Disease Dataset. Available online: https://www.kaggle.com/datasets/johnsmith88/heart-disease-dataset (accessed on 30 April 2023).
- Heart Disease. Available online: https://www.kaggle.com/datasets/data855/heart-disease (accessed on 30 April 2023).
- Dong, X.; Yu, Z.; Cao, W.; Shi, Y.; Ma, Q. A survey on ensemble learning. Front. Comput. Sci. 2020, 14, 241–258. [Google Scholar] [CrossRef]
- Breiman, L. Random Forests. Mach. Learn. 2001, 45, 5–32. [Google Scholar] [CrossRef]
- Biau, G.; Scornet, E. A random forest guided tour. Test 2020, 25, 197–227. [Google Scholar] [CrossRef]
- Ayyadevara, V.K. Random forest. In Pro Machine Learning Algorithms: A Hands-On Approach to Implementing Algorithms in Python and R; Apress: Berkeley, CA, USA, 2018; pp. 105–116. [Google Scholar]
- Geurts, P.; Ernst, D.; Wehenkel, L. Extremely randomized trees. Mach. Learn. 2006, 63, 3–42. [Google Scholar] [CrossRef]
- Chen, T.; Guestrin, C. Xgboost: A scalable tree boosting system. In Proceedings of the 22nd ACM Sigkdd International Conference on Knowledge Discovery and Data Mining, San Francisco, CA, USA, 13–17 August 2016; pp. 785–794. [Google Scholar]
- Brownlee, J. XGBoost with Python: Gradient Boosted Trees with XGBoost and Scikit-Learn; Machine Learning Mastery: San Francisco, CA, USA, 2016. [Google Scholar]
- Wade, C.; Glynn, K. Hands-On Gradient Boosting with XGBoost and Scikit-Learn: Perform Accessible Machine Learning and Extreme Gradient Boosting with Python; Packt Publishing Ltd.: Birmingham, UK, 2020. [Google Scholar]
- Prokhorenkova, L.; Gusev, G.; Vorobev, A.; Dorogush, A.V.; Gulin, A. CatBoost: Unbiased boosting with categorical features. Adv. Neural Inf. Process. Syst. 2018, 31, 1–11. [Google Scholar]
- Hancock, J.T.; Khoshgoftaar, T.M. CatBoost for big data: An interdisciplinary review. J. Big Data 2020, 7, 1–45. [Google Scholar] [CrossRef]
- Joseph, M. The Gradient Boosters V: CatBoost. Deep & Shallow. Available online: https://deep-and-shallow.com/2020/02/29/the-gradient-boosters-v-catboost/ (accessed on 5 May 2023).
- Dorogush, A.V.; Ershov, V.; Gulin, A. CatBoost: Gradient boosting with categorical features support. arXiv 2018, arXiv:1810.11363. [Google Scholar]
- Agrawal, T.; Agrawal, T. Hyperparameter optimization using scikit-learn. In Hyperparameter Optimization in Machine Learning: Make Your Machine Learning and Deep Learning models More Efficient; Apress: Berkeley, CA, USA, 2021; pp. 31–51. [Google Scholar]
- Liashchynskyi, P.; Liashchynskyi, P. Grid search, random search, genetic algorithm: A big comparison for NAS. arXiv 2019, arXiv:1912.06059. [Google Scholar]
- Bergstra, J.; Bengio, Y. Random search for hyper-parameter optimization. J. Mach. Learn. Res. 2012, 13, 281–305. [Google Scholar]
- Berrar, D. Cross-Validation. In Reference Module in Life Sciences; Elsevier: Oxford, UK, 2019; pp. 542–545. [Google Scholar] [CrossRef]
- Fawcett, T. An introduction to ROC analysis. Pattern Recognit. Lett. 2006, 27, 861–874. [Google Scholar] [CrossRef]
- Saito, T.; Rehmsmeier, M. The precision-recall plot is more informative than the ROC plot when evaluating binary classifiers on imbalanced datasets. PLoS ONE 2015, 10, e0118432. [Google Scholar] [CrossRef]
- Hintze, J.L.; Nelson, R.D. Violin plots: A box plot-density trace synergism. Am. Stat. 1998, 52, 181–184. [Google Scholar]
| Disclaimer/Publisher’s Note: The statements, opinions and data contained in all publications are solely those of the individual author(s) and contributor(s) and not of MDPI and/or the editor(s). MDPI and/or the editor(s) disclaim responsibility for any injury to people or property resulting from any ideas, methods, instructions or products referred to in the content. |
© 2023 by the authors. Licensee MDPI, Basel, Switzerland. This article is an open access article distributed under the terms and conditions of the Creative Commons Attribution (CC BY) license (https://creativecommons.org/licenses/by/4.0/).


