Article

Deep Cross-Network Alignment with Anchor Node Pair Diverse Local Structure

1
College of Intelligence and Computing, Tianjin University, Tianjin 300350, China
2
Georgia Tech Shenzhen Institute, Tianjin University, Shenzhen 518055, China
3
School of New Media and Communication, Tianjin University, Tianjin 300350, China
*
Author to whom correspondence should be addressed.
Algorithms 2023, 16(5), 234; https://doi.org/10.3390/a16050234
Submission received: 14 March 2023 / Revised: 21 April 2023 / Accepted: 26 April 2023 / Published: 28 April 2023
(This article belongs to the Topic Complex Networks and Social Networks)

Abstract

:
Network alignment (NA) offers a comprehensive way to build associations between different networks by identifying shared nodes. While the majority of current NA methods rely on the topological consistency assumption, which posits that shared nodes across different networks typically have similar local structures or neighbors, we argue that anchor nodes, which play a pivotal role in NA, face a more challenging scenario that is often overlooked. In this paper, we conduct extensive statistical analysis across networks to investigate the connection status of labeled anchor node pairs and categorize them into four situations. Based on our analysis, we propose an end-to-end network alignment framework that uses node representations as a distribution rather than a point vector to better handle the structural diversity of networks. To mitigate the influence of specific nodes, we introduce a mask mechanism during the representation learning process. In addition, we utilize meta-learning to generalize the learned information on labeled anchor node pairs to other node pairs. Finally, we perform comprehensive experiments on both real-world and synthetic datasets to confirm the efficacy of our proposed method. The experimental results demonstrate that the proposed model outperforms the state-of-the-art methods significantly.

1. Introduction

Network analysis, particularly cross-network analysis, has recently been gaining attention in various study domains due to the exceptional rise of the diversified information that has produced a significant volume of networks. The key to transferring information across multiple networks is to identify hidden inter-network links (i.e., anchor links) [1,2,3], which connect nodes that are shared among different networks (i.e., anchor nodes) [4]. For example, a person’s account nodes in different social networks can be regarded as anchor nodes, and the corresponding relationship between these two accounts can be regarded as anchor links. The process of finding corresponding anchor nodes is also called network alignment (NA). Comparative studies of specific tasks, such as cross-network recommendation [5], mutual community detection [6], and genetic disease classification [7], can be conducted at the systems level with help of NA.
Various NA methods have been proposed and most of them are based on topological similarity, and sometimes the attribute similarity is fused to determine the corresponding relationship between nodes. Inspired by network embedding [8,9,10], which has the potent ability to represent network structures into a low-dimension embedding, numerous embedding-based network alignment approaches have been presented [11,12,13]. Recent embedding-based network alignment methods first, typically, learn node representations before learning mapping functions over latent representation spaces to decrease the disparity in node representations across different networks [14], whereas learning mapping functions usually use labeled anchor node pairs as supervision information [12,15,16,17,18]. Although there has been notable progress in the field of network alignment, current methods still have several deficiencies. One of the most significant limitations is that most methods tend to overlook the diverse local structure of anchor node pairs. Consequently, these approaches are often only suitable for specific alignment cases and fail to apply in some real-world scenarios.
Specifically, anchor node pairs’ local structure, i.e., the connection status of anchor node pairs across networks can be roughly divided into four situations according to labeled anchor nodes, as shown in Figure 1. Equivalence connection status. As shown in Figure 1a, anchor node v 1 “replicates” its interaction in network1 to network G 2 , i.e., v 1 tends to maintain a similar interaction with the same neighbors. This connection status demonstrates that an anchor node v 1 in different networks has a similar local topology structure (such as node degree) and connects to similar neighborhoods. Non-equivalence connection status. As shown in Figure 1b, the activity of anchor node v 1 in the two networks differs a lot, i.e., v 1 has different participation in the two networks and interacts with different neighbors in the two networks. This connection status demonstrates that anchor node v 1 has a different local topology structure and connects the different neighborhood nodes as well. Containment connection status. As shown in Figure 1c, anchor node v 1 chooses a part of the same neighbors in G 1 to interact in G 2 , i.e., v 1 only “replicates” part of the neighbors in G 1 to G 2 and follow some new friends in G 2 . This connection status demonstrates that anchor node v 1 in different networks has different local topology structures but connects similar neighborhood nodes. Non-containment connection status. As shown in Figure 1d, anchor node v 1 divides its time/interest equally between the two networks but interacts with a different neighborhood. This connection status demonstrates that anchor node v 1 has a similar local topology structure but connects the different neighborhood nodes. We present the analysis for labeled anchor node pairs’ diverse local structure in two real-world social network datasets collected from Twitter and Foursquare [3] in Figure 2. It is observed that the proportion of commonly labeled anchor node neighbors for anchor nodes in different networks is differential.
However, most embedding-based network alignment methods will result in node pairs that are more likely to present an equivalence connection status. Specifically, these methods generally hold the assumption that anchor node pairs have similar local structures and/or neighbors across different networks (i.e., the situation as shown in Figure 1a,c). For example, IONE [11] preserves the proximity of users that exhibit “similar” sets of followers and followees in the embedded space; FRUI-P [19] extracts the friend feature of each user in a social network, constructs a corresponding friend feature vector, and, subsequently, computes the similarities among all potential identical users between two social networks. In addition, employing network embedding techniques, such as DeepWalk and GCN, to represent each node as a point vector, and using labeled anchor nodes to learn mapping functions will lead to align most nodes in one network with the labeled anchor nodes in the other network. Furthermore, it is difficult to distinguish the labeled anchor nodes and their neighbors due to the neighboring nodes are embedded in closed forms in most network embedding. As shown in Figure 1c, if we use v 1 to learn the mapping function, v 2 , v 4 , and v 5 are more likely to be close to v 1 in G 2 . Since the representations of v 1 and v 2 are similar in G 2 , it is difficult for v 2 in G 1 to match corresponding nodes in G 2 .
To address the above problems, we propose a novel model, namely DCSNA, which adjusts to Diverse anchor nodes Connection Status for Network Alignment. Firstly, considering the different impacts of labeled anchor nodes and other nodes in the neighborhood among node pairs between different networks, we design a masked network encoder to learn node representations by removing some edges to mitigate the influence of some specific nodes. Not all neighboring nodes are equally informative for alignment, as some nodes interact with many nodes across networks. Our encoder selectively incorporates only the relevant neighbors to learn more effective representations. Secondly, to better distinguish a node and its neighbors, we represent each node as a Gaussian distribution instead of a point vector. Thus, we obtain node representations with mean and variance embeddings, where the mean embeddings present the position of the nodes and variance embeddings present the uncertainties of the representations. Meanwhile, compared to representing nodes as deterministic point vectors, using Gaussian distribution to represent nodes could tolerate the network’s structural diversity to a large extent which may be the reason for anchor node pairs’ diverse connection status, and benefit for network alignment. Thirdly, because of the diverse connection status of anchor node pairs, it is difficult to generalize the learned information on the labeled anchor node pairs to other node pairs. Motivated by recent progress in meta-learning that enables adaptation to new tasks and acquisition of transferable knowledge between tasks, we leverage meta-learning from labeled anchor nodes to derive latent priors for matching potential anchor nodes.
The main contributions of this paper are summarized as follows:
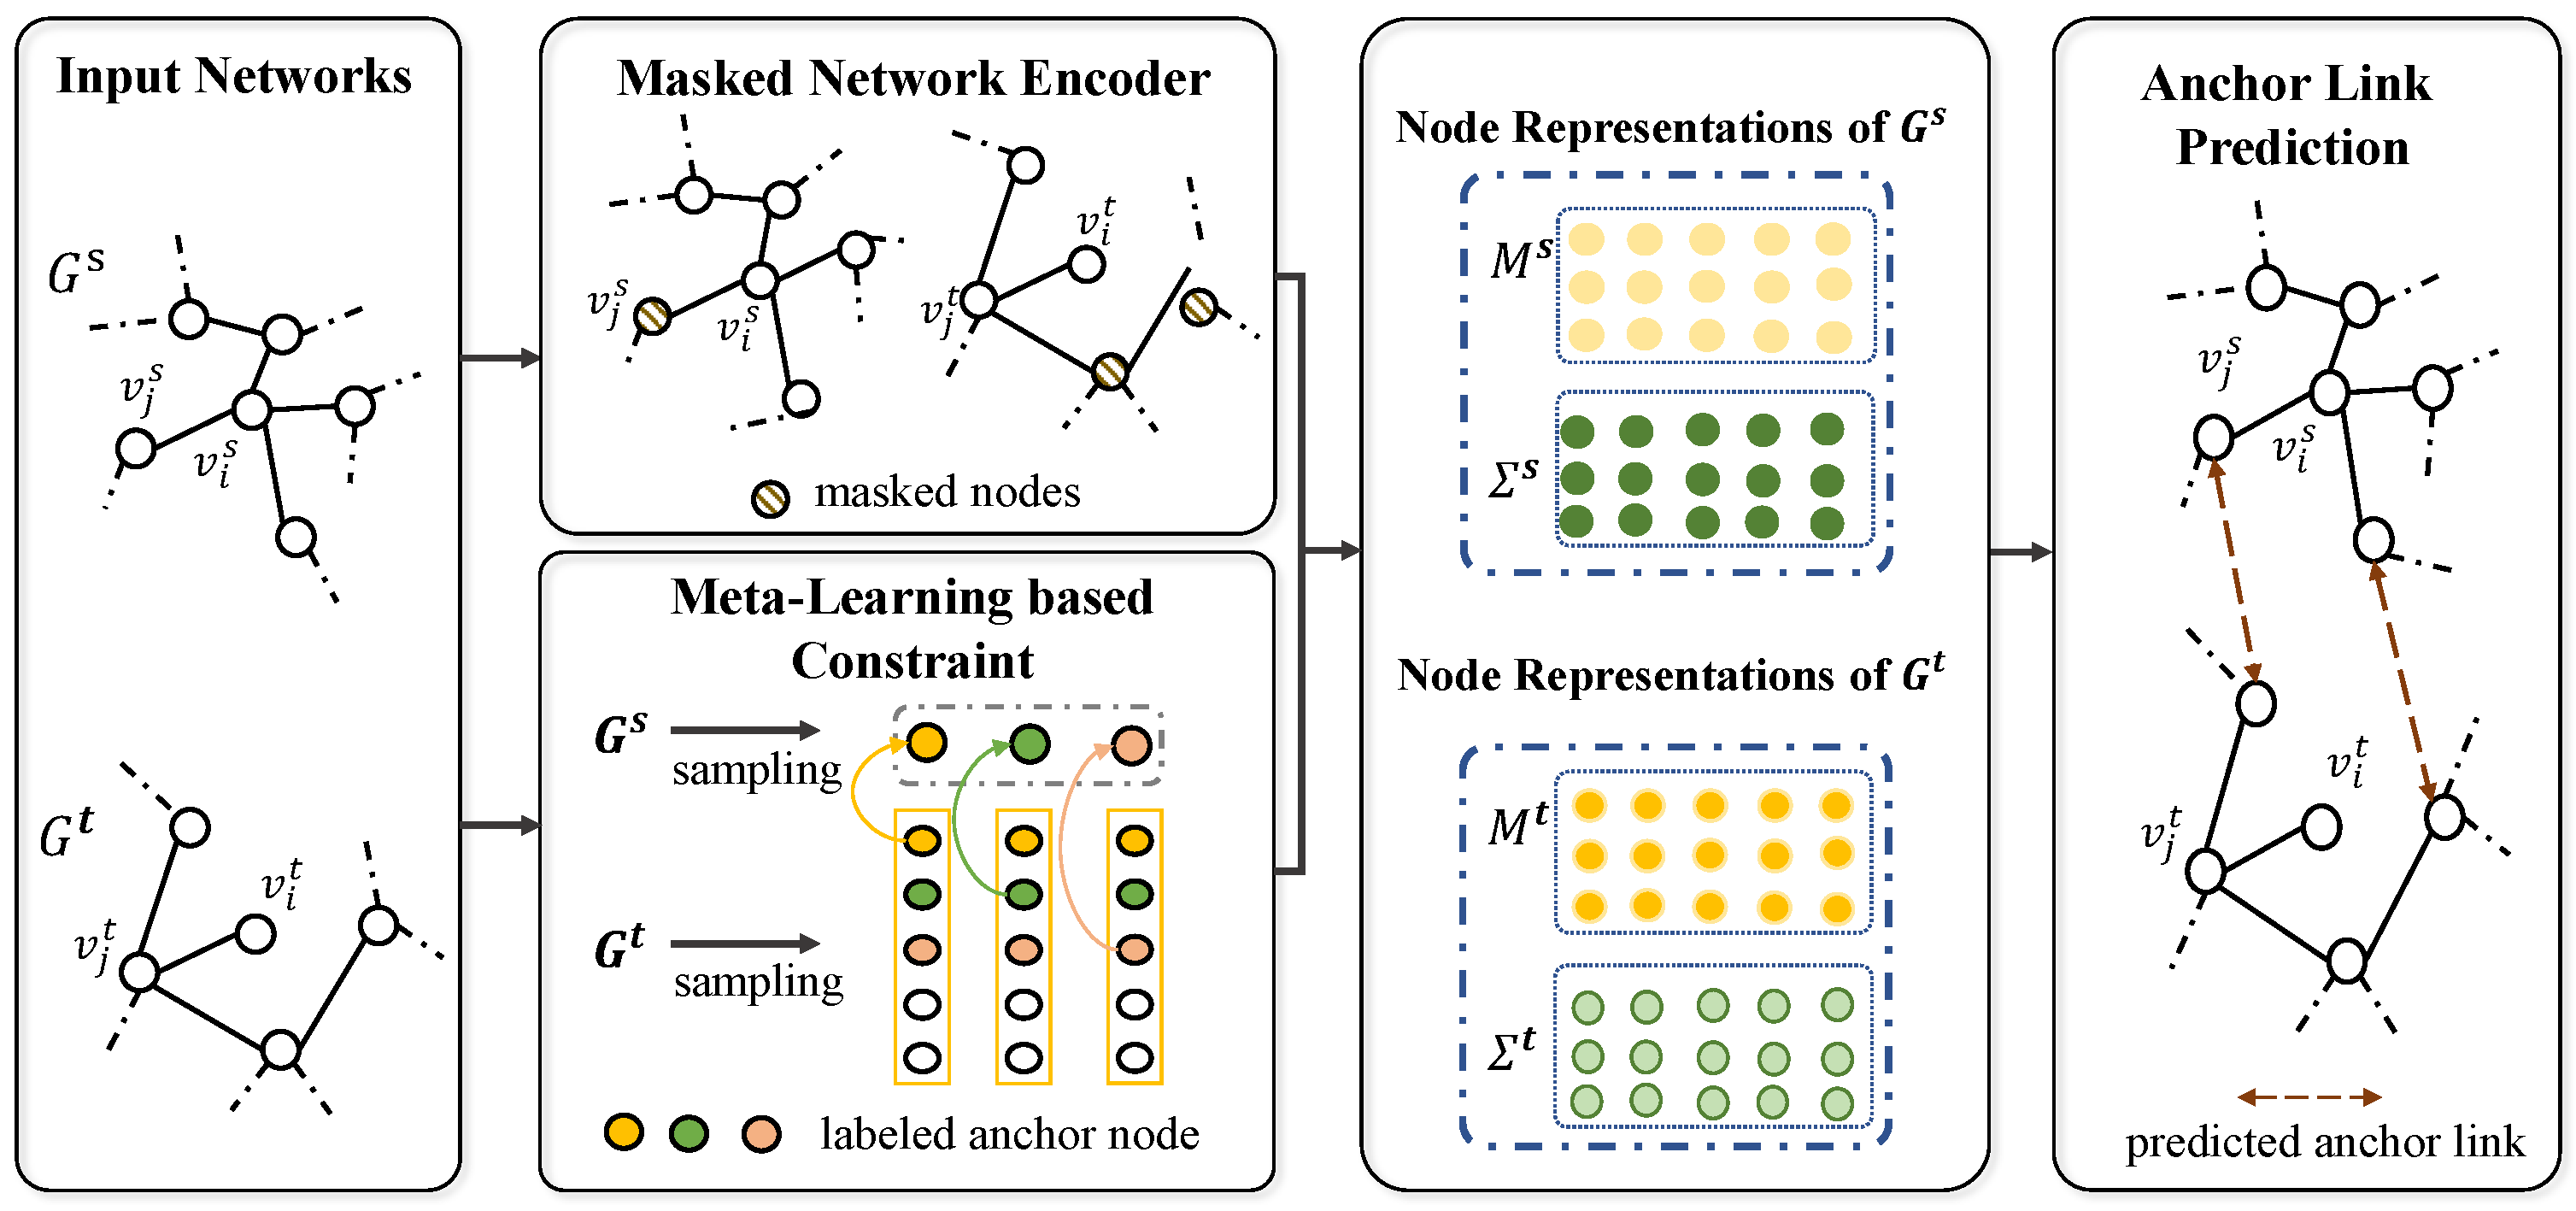
  • We present a masked network encoder to embed nodes in each network as a Gaussian distribution, which not only preserves the structural information but also obtains the uncertainty of node representations. Additionally, the mask mechanism could alleviate the impact of nodes that will confuse structural proximity in alignment.
  • We generalize the information of labeled anchor node pairs to other node pairs by utilizing meta-learning. Additionally, a method based on meta-learning can also reduce the dependence on the number of labeled anchor nodes, where it is time-consuming to collect labeled anchor nodes.
  • We propose an end-to-end framework based on a masked variational auto-encoder to address the NA task. Our solution works better than other NA methods, according to extensive experiments on both real-world and synthetic datasets.

2. Related Work

For cross-network data mining, network alignment is a crucial issue with numerous application scenarios, such as re-identification [20,21,22], bioinformatics [23,24,25,26], translation [27,28], and pattern recognition [29]. Recent embedding-based methods of network alignment can be broadly classified into structure-based methods and attributes–structure hybrid methods.
The structure-based methods only use network structural information to learn node representation [11,12,16,19,30,31]. For example, PALE [12] first learns the individual embeddings of two networks from existing single network embedding methods (e.g., LINE, node2vec). Then, it uses an MLP (Multi-Layer Perceptron) and labeled anchor nodes to match the latent space of the two networks. CrossMNA [16] simultaneously performs node representation learning and network alignment by introducing two type specific vectors. Specifically, the intra-vector keeps the unique structural feature for an anchor node in its chosen network, on the contrary, the inter-vector represents the shared characteristics of the anchor nodes in different networks. MC [30] uses a matrix factorization-based network representation learning method to obtain node embedding vectors to capture the local and global structural features of nodes. IDRGM [32] estimate the distribution of perturbed graphs and maximize the distances among the perturbed nodes within the same graphs, for separating the nodes in a narrow space into a wide space. DHNA [31] designs a VGAE-based network alignment model, and two carefully thought-out restrictions are used to incorporate anchor nodes’ degree differences across different networks into the encoder module.
The attributes–structure hybrid methods use both network structural information and node attribute information to learn node representation [13,15,33,34,35]. Take social networks as an example, node-attribute information consists of the user profile, such as user name [36,37], and other content generated through user activity on the social platform [4,38]. For example, Zhang et al. [33] proposed a GNN-based network alignment model, in which a convolutional neural network incorporates attribute embedding and structural embedding. Then they trained a classifier to predict whether two nodes are in alignment. CAMU [15] introduces an attributed social network embedding (ASNE) method that incorporates both topological and node attribute information in each network. Subsequently, a mapping function is learned to project the representation from the source network onto the target network. CoLink [34] consists of two distinct models, namely the attribute-based model and the relationship-based model, along with a co-training algorithm that reinforces them iteratively.
However, these methods are looking for the consistency of anchor nodes in different networks, but this situation is not always met in real networks. Therefore, this paper proposes a more general representation method to adapt to the different connection statuses of anchor nodes.

3. Method

In this section, we introduce our NA model DCSNA and show how to adjust to the diverse connection status of anchor nodes by a variational auto-encoder in detail.

3.1. Problem Formulation

We focus on undirected networks in this paper. In general, nodes in various networks do not relate to one other, hence not all nodes are shared by all networks. In this paper, we focus on aligning such partially aligned networks. In addition, a node in one network only has, at most, one corresponding node in another. For the NA task, we provide the following necessary definitions.
Let G s and G t denote the two networks to be aligned, respectively, where G s = ( V s , E s ) and G t = ( V t , E t ) . V s = v 1 s , v 2 s , , v n s s is the node set of G s , where n s = V s represents the node number of V s . E s = { ( v i s , v j s ) | i , j 1 , 2 , , n s } is the edge set among nodes in V s . V t , E t and n t have similar meanings.
Anchor Nodes/Anchor Links. Anchor nodes refer to nodes that exist in multiple networks and represent the same real-world entities. The set of anchor nodes is denoted as V a , while anchor links refer to the corresponding relations between anchor nodes. Anchor links set is defined as E a = { ( v i s , v i t ) | v i s , v i t V a } .
Network Alignment. Given two partially aligned networks G s , G t , and a few labeled anchor links E a , the goal of network alignment is to discover all potential anchor links, that is, we aim to learn a predictive function: f : ( G s , G t , E a ) Y , Y 0 , 1 V s × V t , Y i j = 1 if v i s and v j t are predicted to be a pair of potential anchor nodes across networks G s and G t , and 0 otherwise.

3.2. Network Embedding with the Diverse Local Structure of Anchor Node

We design a novel framework (DCSNA) for learning the uncertainty representation of each node in different networks in the low-dimension embedding space for network alignment, as shown in Figure 3. We will introduce each part of DCSNA in detail in the following.

3.2.1. Masked Network Encoder Based on Variational Graph Convolution

Due to their similar characteristics and connectedness, nearby nodes generally have more influence than distant ones when comparing nodes across networks [39,40]. To better use the network’s local structure while preserving the whole network structure in a low-dimension embedding space and learning the distribution of each node simultaneously, we perform convolution operations between Gaussian distributions parameterized by a two-layer convolutional network as an encoder. Without loss of generality, we denote the matrix with capital letters, and use A ( i , : ) to denote the i-th row of the matrix A . ⊙ is the Hadamard product. d is the dimension of each node embedding.
Notice that degree distributions are power-law in most cases, and nodes with lower degrees are less likely than nodes with higher degrees to be connected to neighbors who are classified as anchors. As a result, these low-degree nodes receive less information from labeled anchor nodes, which leads to unsatisfactory or even subpar alignment performance. Therefore, we randomly mask some edges of nodes whose degree is larger than the average degree of all nodes in the network.
For the network without attributes, we use the identity matrix I and the adjacency matrix A as the model input. Furthermore, we can also use the node-feature matrix as input if the network has the node attributes, which means our method can be extended easily to attribute networks. For each network, take G s as an example, we define a masked adjacency matrix A ¯ s . Specifically, we first collect the nodes whose degree is larger than the average degree of all nodes in G s , and for node v i s in the set
A ¯ s ( i , : ) = A s ( i , : ) m ,
where m 0 , 1 1 × n s is the masked vector for v i s and the sum of its elements is ( d ( v i s ) d a v g ) . d ( v i s ) and d a v g are the v i s ’s degree and the average degree of all nodes in G s , respectively; similarly for A ¯ t .
Instead of embedding each node as a point vector, we represent a node by Gaussian distributions, i.e., the mean and the variance, to incorporate the uncertainty [41]. We use M s R n s × d , M t R n t × d , Σ s R n s × d , and Σ t R n t × d to denote the matrix of means and variances for all nodes in the G s and G t , respectively, where each row represents the mean/variance vector for a node
M s = A s ˜ ( ρ ( A s ˜ I W 0 s ) ) W μ s M t = A t ˜ ( ρ ( A t ˜ I W 0 t ) ) W μ t ,
Σ s = A s ˜ ( ρ ( A s ˜ I W 0 s ) ) W σ s Σ t = A t ˜ ( ρ ( A t ˜ I W 0 t ) ) W σ t ,
where W 0 s R n s × F is parameter matrix shared by M s and Σ s , W μ s R F × d and W σ s R F × d are parameters for the M s and Σ s , respectively, and F is the number of neurons by hidden layer that usually be 2 d . Similar for W 0 t R n t × F , W μ t R F × d , and W σ t R F × d . ρ ( · ) is a non-linear activation function, such as ReLU. A ˜ s = D ( s ) 1 2 ( A ¯ s + I ) D ( s ) 1 2 is the symmetrically normalized adjacency matrix, and D ( s ) R n s × n s is a diagonal matrix containing each node’s degree in G s . The same is for A ˜ t .
Through the above masked network encoder, nodes in two different networks, G s and G t , are embedded into a low-dimension embedding space, and some labeled anchor nodes’ influence is ignored by using the masked adjacency matrix. We denote the Gaussian distribution N ( μ i s , σ i s ) of each node in G s as h i s , where μ i s represents the structural information of v i s and σ i s implies the possible uncertainty of μ i s . Similar for h i t . For each network we reconstruct the input adjacency matrix, which represents the network’s neighborhood structure, to maintain the network’s global structure,
L r e c = A ^ s ( A s + I ) 2 + A t ^ ( A t + I ) 2 ,
where A s ^ = Z s ( Z s ) T , A t ^ = Z t ( Z t ) T are the reconstructed adjacency matrix. Z s and Z t are the stochastic latent variables matrix, whose i-th row can be sampled from the Gaussian distribution h i s and h i t :
z i s = μ i s + ε σ i s , z i t = μ i t + ε σ t s , ε N ( 0 , I ) .
In addition, to ensure that the learned representations are indeed Gaussian distributions, we use the following regularization to constrain the latent representations:
L r e g = i = 1 n s K L N ( μ i s , σ i s ) N ( 0 , I ) + i = 1 n t K L N ( μ i t , σ i t ) N ( 0 , I ) .
K L q ( · ) p ( · ) is the Kullback–Leibler divergence between q ( · ) and p ( · ) , it quantifies the difference between two probability distributions q ( · ) and p ( · ) .
Therefore, we obtain the following training objective function to learn node representations:
L e n = L r e c + L r e g .

3.2.2. Meta-Learning-Based Constraint

The typical goal of network alignment is to identify potential anchor links. When labeled anchor links are available, we can use them as supervision information to learn the node relationship between the two networks. However, the number of labeled anchor links is often small, and the learned knowledge on the labeled anchor links should generalize to potential anchor links. To address this challenge, we leverage meta-learning to distinguish between anchor nodes and non-anchor nodes.
In general, the meta-learning methodology employs an episodic paradigm to train on numerous samples of related tasks in order to solve the few-shot learning problem. These related tasks are referred to as meta-training tasks, while the few-shot learning task is called the meta-testing task [42]. We treat a labeled anchor node as a meta-training class and a non-labeled node as a meta-testing class. Since we only consider aligning two networks in this paper, the NA task that finding potential anchor links is comparable to identifying nodes belonging to the same class between G s and G t . The number of samples in each meta-training class and meta-testing class is limited to two, which correspond to whether a pair of nodes is an anchor node pair or not. Thus, the network alignment (NA) task can be viewed as a one-shot classification problem. In the meta-learning scenario, our training tasks are for different tasks, and each task is a randomly drawn dataset, which contains k samples drawn from two classes. For each task, 2 k samples are its training data (i.e., the support dataset), and the prediction task of each task is to classify a new sample belonging to these two classes (i.e., the task test is performed on the query dataset).
Meta-training. We denote the meta-training classes set and the meta-testing classes set are L and N, respectively. The following is a description of how the meta-training tasks are generated:
(1) C i RANDOMSAMPLE(L, C ),
(2) S i GET( C i , G s ),
(3) Q i GET( C i , G t ),
(4) T i = S i Q i ,
(5) Repeat steps (1)–(4) for K times.
To be more precise, we first randomly select C classes from meta-training classes L, designated as C i , at random. The support set S i is then formed by taking the nodes from G s that belong to class C i . To obtain the query set Q i , the same process is used with G t . A meta-training task T i = S i Q i is created using both S i and Q i . The foregoing processes can be repeated K times to produce K meta-training tasks.
Through meta-training, we constrain nodes of the same class (from G s and G t , respectively) to be close and far away from other nodes. Specifically, for each node v j t in Q = v 1 t , v 2 t , , v j t , , v c t , we traverse all nodes in S = v 1 s , v 2 s , , v i s , , v c s , and calculate the loss function L as follows,
L = L e n + d ( v i s , v j t ) if v i s and v j t are belonging to the same class L e n + l o g e x p ( d ( v i s , v j t ) ) otherwise
where d ( · , · ) measures the similarity between two nodes. Since the representation of each node is a Gaussian distribution, we use the second Wasserstein distance to calculate d ( · , · ) , which can be computed as
d ( v i s , v j t ) = W 2 ( h i s , h j t ) 2 = μ i s μ j t 2 2 + T r σ i s + σ j t 2 ( σ i s 1 / 2 σ j t σ i s 1 / 2 ) 1 / 2 ,
where σ i s σ j t = σ j t σ i s because the covariance matrices are diagonal. Thus, Equation (9) can be simplified to
d ( v i s , v j t ) = μ i s μ j t 2 2 + σ i s 1 / 2 σ j t 1 / 2 F 2 ,
where · F is the Frobenius norm.

3.3. Network Alignment Based on Node Representations

After acquiring the final distribution representation of each node in G s and G t , we predict the potential anchor nodes. As introduced in Section 3.1, we aim to learn a predictive function f : ( G s , G t , E a ) Y , Y 0 , 1 V s × V t , Y i j = 1 if v i s and v j t are predicted to be a pair of potential anchor nodes across networks G s and G t , and 0 otherwise. Thus, for a pair of nodes ( v i s , v j t ) , v i s G s , v j t G t , to build a predictive function, we use a fully connected network
f ( v i s , v j t ) Y | h i s , h j t = R e L U ( W [ μ i s σ i s d v i s N a ( v i s ) μ j t σ j t d v j t N a ( v j t ) ] + b ) ,
where · · denotes the concatenation of embeddings, W and b are trainable parameters. d v i s and d v j t are the degree of v i s and v j t , respectively. N a ( v i s ) and N a ( v j t ) are the number of labeled anchor nodes in the neighborhood of v i s and v j t , respectively. Intuitively, node degree can reflect its local topology to some extent, and the number of neighborhood labeled anchor nodes can reflect the ability to receive labeled anchor node information. The final result of the prediction is then obtained using the labeled anchor links set E a to calculate the cross-entropy as the loss function.
In general, only a small portion of the entire network is made up of labeled anchor nodes. The following guidelines can be used to build some pseudo-anchor links in order to effectively train the prediction function mentioned above
s i m v i s , v j t = N a ( v i s ) N a ( v j t ) N ( v i s ) N ( v j t ) N a ( v i s ) N a ( v j t ) e d ( v i s ) d ( v j t ) ,
where N a ( v i s ) and N a ( v j t ) are the labeled anchor nodes in the neighborhood of v i s and v j t , respectively. N ( v i s ) and N ( v j t ) are the neighbors of v i s and v j t , respectively. As a result, if two nodes in separate networks have more neighbors who are designated anchor nodes and their node degree differences are lower, they have a high likelihood of being possible anchor node pairs.
Then, we construct a pseudo-anchor link generator by using pairs of labeled anchor nodes:
f g v i s , v j t = 1 if s i m v i s , v j t 1 E a v i s , v i t E a s i m v i s , v i t 0 otherwise
Pseudo-anchor links generated by the generator are easier to find the anchor node pairs that satisfy the equivalence connection status and containment connection status as introduced in Section 1.

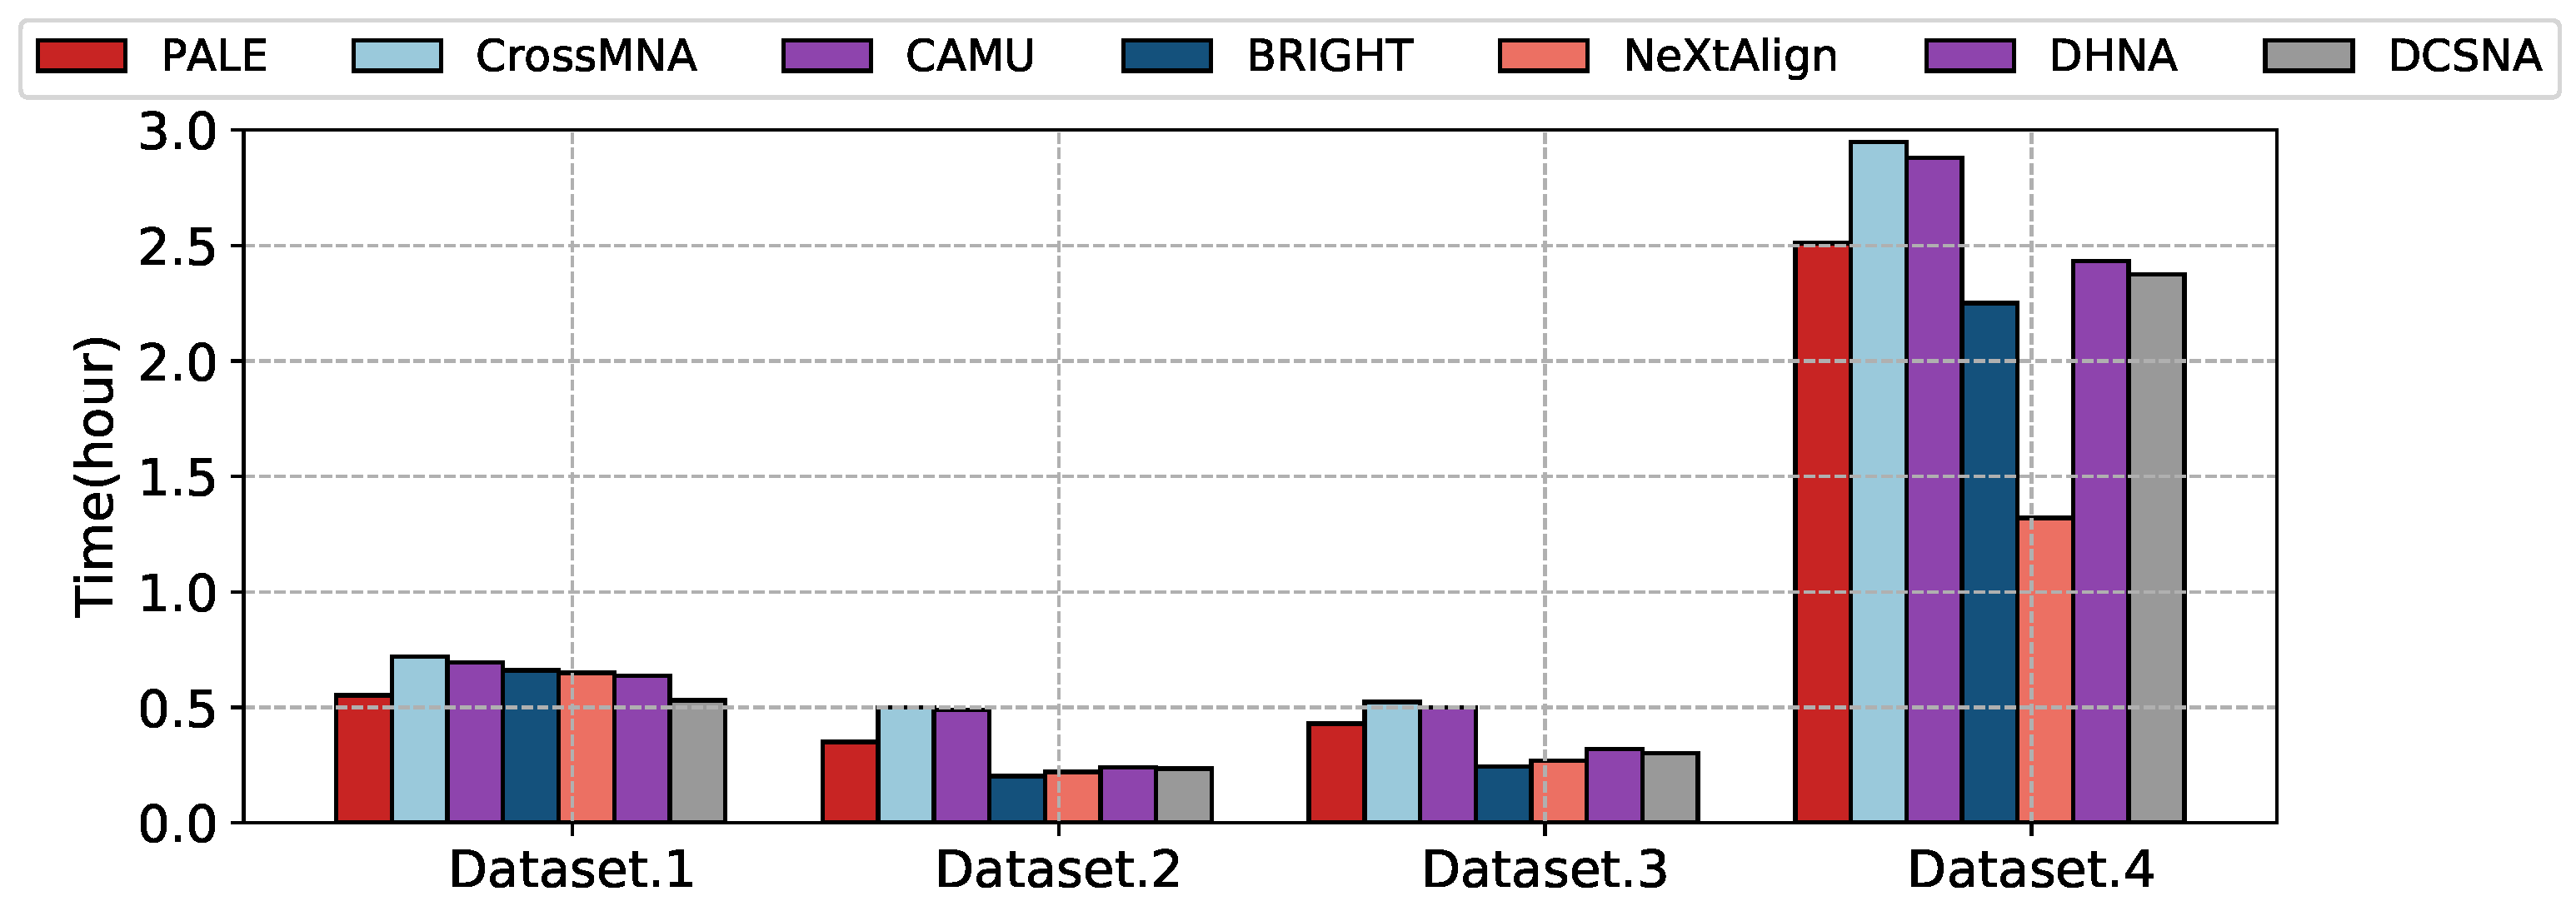
3.4. Time Complexity

There are two steps to the analyses: Masked Network Encoder. The time complexity for calculating A ¯ is O ( n d ) . The encoder uses graph convolutional network that takes in the input network and outputs the mean and variance of the latent representation for each node, takes in the sampled latent representations and reconstructs the input network and uses a variational lower bound on the log-likelihood of the input network as its objective function. Its time complexity is O ( 4 n e d + n 2 d ) , where n and e are the number of nodes and edges of the input network, respectively, d is the node representation dimension. Meta-Learning-Based Constraint. The time complexity of meta-Learning based constraint is O ( K ( N C + C 2 ) d ) , where N = m a x ( n s , n t ) , C is the sampled number of classes from meta-training classes, K is the number of meta-training tasks.

4. Experiment

In this section, we perform experiments to validate the proposed DCSNA on both real-world datasets and the synthetic dataset. We first compare it with the existing baseline models on the NA task. Then we perform a parameter sensitivity analysis of DCSNA to prove the effectiveness of considering anchor node diverse local structures.

4.1. Datasets

We validate the effectiveness of DCSNA on both real-world datasets and the synthetic datasets.
  • Real-world dataset. There are three datasets in it, ACM-DBLP(Dataset.1) [43], arXiv dataset(Dataset.2) [44], and Twitter–Foursquare(Dataset.3) [3].
  • The synthetic dataset. It is constructed based on Facebook [45]. We remove nodes with degrees of less than 10 and sample two networks in accordance with the methodology described in [12], resulting in 38,344 nodes and 1,183,080 edges. It uses a distribution p U ( 0 , 1 ) to determine which network each edge belongs to. Whenever p 1 2 α s + α s α c , the edge is thrown away; if the edge is only preserved in the first network, 1 2 α s + α s α c < p 1 α s ; if 1 α s < p 1 α s α c , only the other network retains the edge; otherwise, both networks maintain the edge. We set α s = α c = 0.5 and denote the synthetic dataset as Dataset.4.
The statistics of datasets are summarized in Table 1 (The datasets can be found at https://github.com/tjuwangyinghui/DCSNA (accessed on 26 April 2023)). As shown in Figure 2, we use the anchor node neighbors to their neighbors r as the analysis index. Specifically, if r in each network less than 0.5 means that about half of the local structures between anchor pairs are inconsistent. p r is the proportion of anchor node pairs in each dataset whose r is less than 0.5 in both networks.

4.2. Baseline Methods

We choose six network alignment methods as baselines to validate the effectiveness of our method. The comparison methods are listed as follows:
  • PALE [12] first learns the individual embeddings of two networks by existing single network embedding methods LINE. Then, it learns a mapping function to match the latent space of the two networks and predicts anchor node pairs by calculating the distance of embeddings.
  • CrossMNA [16] uses two vectors to preserve the common features of the anchor nodes in different networks (inter-vector) and the specific structural feature for a node in its selected network (intra-vector) respectively. Additionally, it uses the inter-vector to align nodes in different networks.
  • CAMU [15] learns network embedding by considering network structure and node attribute information. Additionally, then it learns a mapping function to decrease the representation distribution discrepancy of different networks.
  • BRIGHT [35] builds a specific unified space using labeled anchor links as landmarks using random walk with restart (RWR), and then employs a common linear layer to determine the significance of the RWR scores at various dimensions.
  • NeXtAlign [46] uses a special relational graph convolutional network (RelGCN) to encode the alignment consistency.
  • DHNA [31] uses a variational autoencoder to learn node embeddings, and considers the different anchor nodes’ degrees across networks.

4.3. Experimental Settings

This part mainly introduces the evaluation of network alignment and parameter settings in the experiment.

4.3.1. Evaluation Metrics

For the alignment of social networks, we randomly divided the labeled anchor links into two parts, the training set and the test set. As introduced in Section 3.3, with a pair of node ( v i s , v j t ) as input, DCSNA aims to predict whether they are a pair of potential anchor nodes in two networks or not. In the context of our testing, each pair of anchor nodes ( v i s , v j t ) can be classified into one of three categories based on its prediction status, true positive (TP), false positive (FP), or false negative (FN).
A pair of anchor nodes ( v i s , v j t ) is classified as TP if it is predicted as a pair of anchor nodes in the test and is indeed a pair of anchor nodes. On the other hand, if ( v i s , v j t ) is not a pair of anchor nodes in the test but it is predicted as a pair of anchor nodes, it is classified as FP. Lastly, a pair of anchor nodes ( v i s , v j t ) are classified as FN if it is a pair of anchor nodes in the test but it is not predicted as such.
Under this prediction status, we have the following indicator, Precision = TP/(TP + FP), Recall = TP/(TP + FN), F1 = 2 ∗ (Precision ∗ Recall)/(Precision + Recall). Since each pair of anchor nodes can be seen as a class, we use three frequently used metrics, Macro Precision, Macro Recall, and Macro F1, as measurement, that is, the arithmetic mean of each statistical indicator value across all classes.

4.3.2. Parameter Settings

To quantify the NA task, we apportioned labeled anchor nodes at random into a training set and a test set at a ratio of 9:1. We set the learning rate to 0.001 in our model training, and use about 30% labeled anchor nodes for meta-learning-based constraint. We randomly select nodes in both networks for negative sampling to train the predictive function, and the number of negative samples is 0.5 times the number of labeled anchor node pairs. With the exception of CrossMNA which we set the dimensions of the inter-vector and intra-vector to 200 and 100, respectively, and the embedding dimension d = 200 for all other methods. We have used the optimal parameter settings for each approach for the remaining parameters.

4.4. Performance Analysis

Accuracy. The experimental results of network alignment on real-world datasets and synthetic dataset are presented in Table 2, we can draw the following observations.
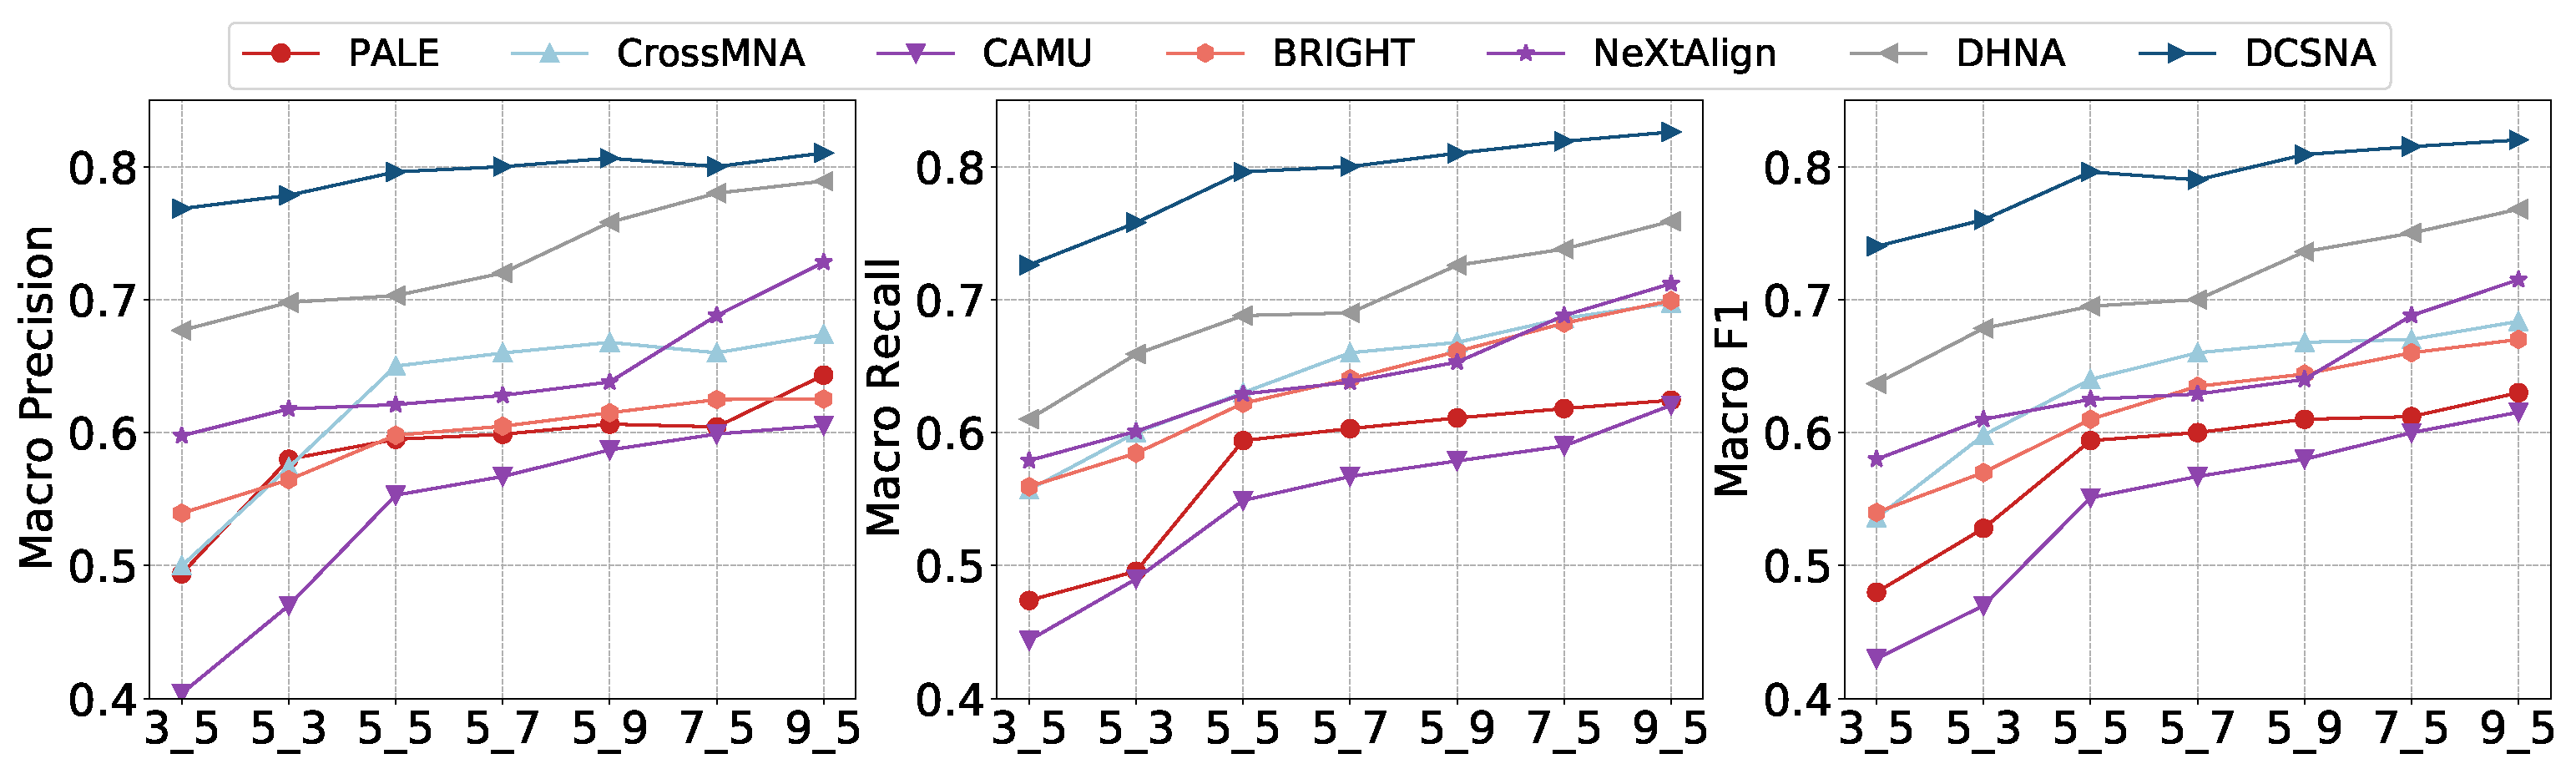
  • Based on the experimental results, we find that our method DCSNA can perform better than other baseline methods in most cases, especially under the metric Macro Precision. These results demonstrate DCSNA’s superiority, which learns each node representation as a distribution and masks the nodes with a larger degree. Representing nodes as distributions let us distinguish the nodes from their neighbor nodes and reduce confusion during network alignment. This is also why embedding-based methods, such as PALE and CrossMNA, perform slightly worse, as they overly preserve the neighbor structure of nodes, making nodes and their neighbors indistinguishable. Since CAMU is to reduce the node representation distribution between two networks, it performs better than methods that only learn node representations.
  • Although BRIGHT and NeXtAlign consciously distinguish anchor node pairs from their neighbors through mechanisms, such as sampling or using anchor links as landmarks, the key idea is still keeping the consistency of anchor node pairs. Therefore, they are more suitable for the situation where most anchor nodes satisfy equivalence connection status across networks.
  • It is worth noting that the performance of DHNA is second only to our model in most cases. DHNA considers the degree discrepancy across nodes, i.e., non-equivalence connection status, and makes a balance between consistency and such connection status. However, it ignores another connection status.
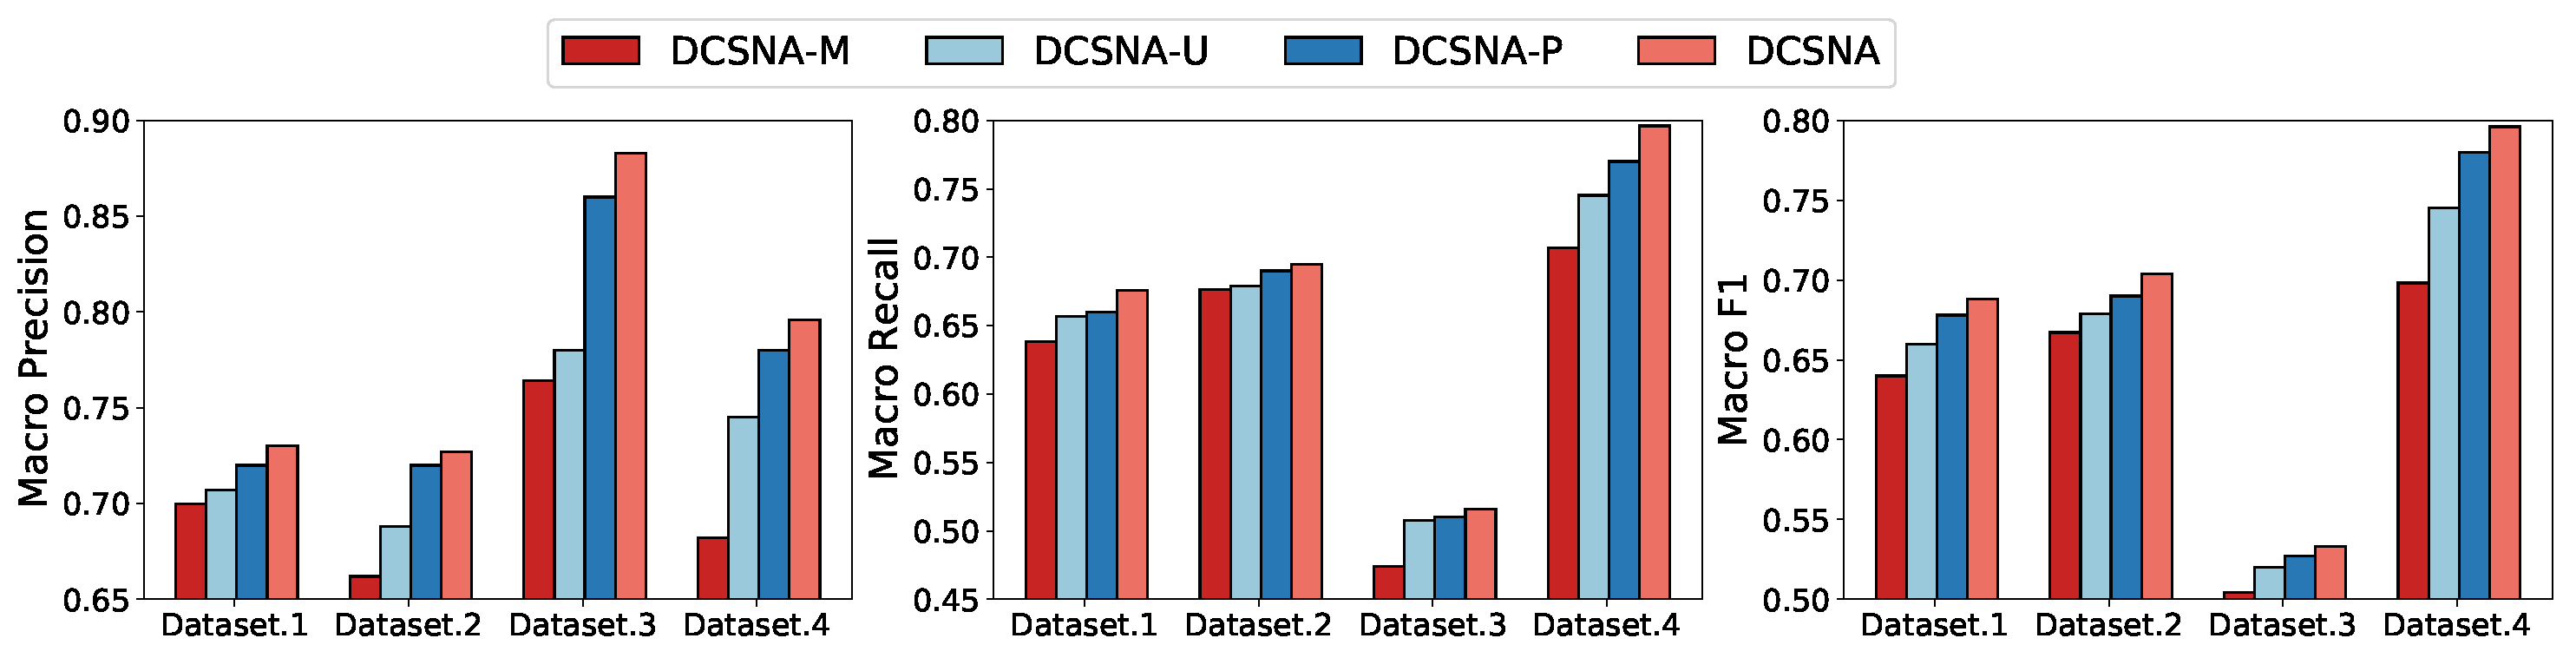
Overall, our results highlight the effectiveness of DCSNA in addressing the diverse connection status of anchor nodes and demonstrate its superiority over other state-of-the-art network alignment methods.
In addition, we conduct experiments on the synthetic data, to analyze the impact of edge insertions/deletions of networks on network alignment. The result is presented in Figure 4, we compare the three metrics on combinations of different overlap levels α c and sparsity level α s . For example, “3_5” on the horizontal axis means the combination of α c = 0.3 and α s = 0.5 . It is obvious that performance becomes better when α c and α s increase. This is because as α c and α s increase, the network becomes denser and the two networks share more edges, which is beneficial for network alignment. It is worth noting that the results of DCSNA on various combinations are not very different, which means that our model is not sensitive to the insertions/deletions of edges in the networks.
Efficiency. In Figure 5, we compare the running time of DCSNA and baselines on different datasets. Although DCSNA is not the fastest, its running time is competitive. It spends most of its time in the process of masking some edges according to the filtering conditions, and we will optimize this process in further work.

4.5. Ablation Study

We compare our proposed method with the following variants, (1) DCSNA-U, which represents nodes by a single node embedding according to Equation (5), and replaces the second Wasserstein distance with Euclidean distance in Equation (8); (2) DCSNA-M, which learns node representations without masking any nodes; and (3) DCSNA-P, which does not use the pseudo-anchor links generated by Equation (13) during model training. The results are shown in Figure 6. As we can see, the proposed DCSNA performs the best, validating the necessities of all components in the whole model.

4.6. Parameter Sensitivity

In this part, we explore how the hyperparameters of the proposed DCSNA model affect performance. We conduct several experiments to analyze the results by varying the hyperparameters. There are three main parameters in the proposed DCSNA, the dimension d of node embeddings, the negative sample ratio r n (i.e., the number of labeled anchor nodes used in the training set divided by the number of node pairs we obtain from the negative sampling for training predictive function), and sampling ratio r a (i.e., the number of labeled anchor nodes used in the meta-learning constraint divided by the number of labeled anchor nodes used in the training set). To investigate the impact of these parameters on model performance, we set the default values of d = 200 , r n = 0.5 , and r a = 0.3 . We then vary one parameter at a time while keeping the other parameters constant and assess its effect on network alignment tasks using the three evaluation metrics on four datasets.
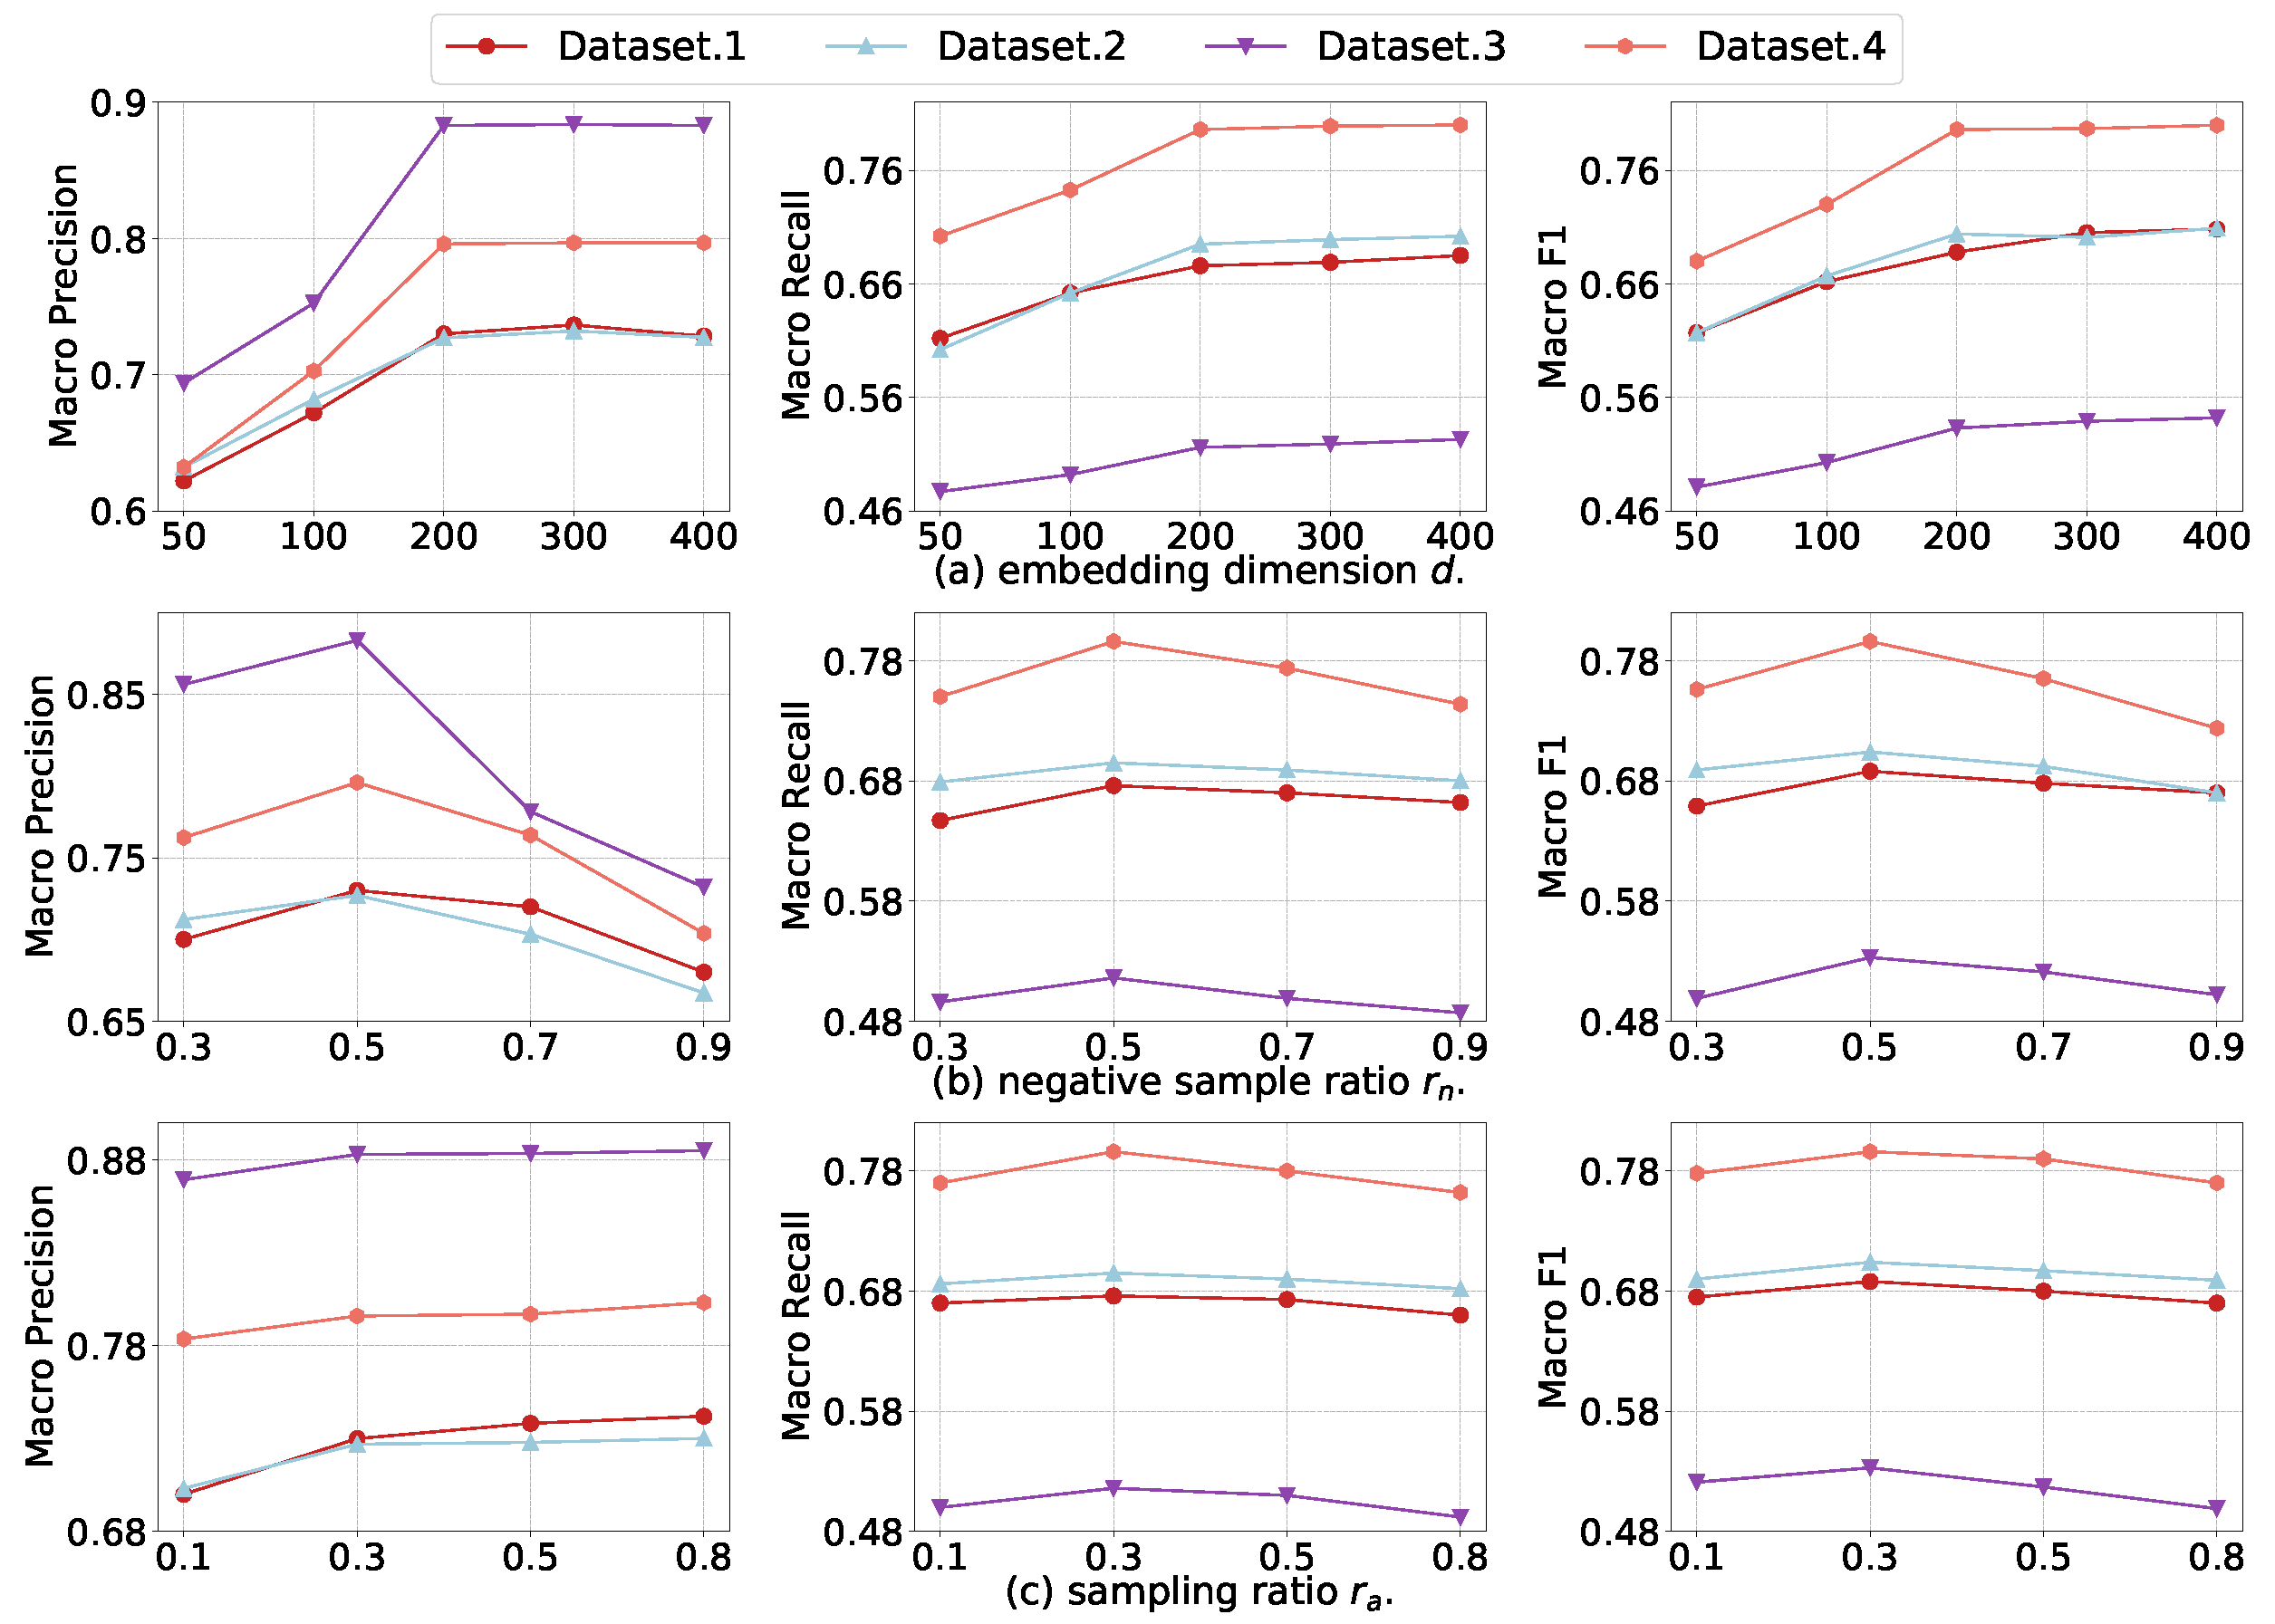
  • Figure 7a shows that performance improves with increasing node size d, but performance degrades when d is more than 200. The reason is that we represent each node as a distribution containing both mean and variance embedding, as the dimension d increases, the uncertainty (i.e., the information of variance embedding) will accumulate and result in the poor performance of matching potential anchor nodes.
  • From Figure 7b, we can observe that our model could achieve competitive performance on different r n . It indicates that although the negative sampling mechanism is helpful for better training of the model, it plays a limited role. Improper determination of the number of negative samples may even reduce the accuracy of the model.
  • From Figure 7c, we can observe our model can achieve competitive performance by using fewer labeled anchor nodes, which demonstrates the effectiveness of meta-learning constraint and the robustness of our model. Since the number of labeled anchor nodes is usually small in the real task, the robustness of the model can guarantee the model to be applied to the alignment task well.

5. Conclusions

The network alignment problem has numerous applications in various fields, including social and natural sciences. In this paper, we study the network alignment problem and analyze the characteristic of anchor node pairs’ connection status across different networks in the real world. Our analysis reveals that the diversity of anchor node pairs exists in many standard datasets.
To let the alignment method have a good performance at different connection statuses of anchor node pairs, we design a masked network encoder to alleviate the impact of nodes with a high degree. These nodes have a higher probability link to labeled anchor nodes and will pass confusing information in the alignment process. Moreover, we learn the node representations as distribution with mean embedding and variance embedding instead of single node embedding to represent the distinctive character and uncertainty in the network. Additionally, we use a meta-learning mechanism to better generalize the information of labeled anchor nodes, which could ignore the influence of anchor node pairs’ diverse connection status in network alignment to a certain extent. We assess the proposed method’s validity using three real and one synthetic dataset. The analytical performance of the proposed DSCNA can exceed other current baselines, according to extensive experiments. In future work, we consider making our method more explicable in theory.

Author Contributions

Conceptualization, Y.W.; methodology, Y.W.; software, M.S.; formal analysis, Y.W.; investigation, M.S.; resources, validation, writing—review and editing, visualization, Y.S.; data curation, M.S.; writing—original draft preparation, Y.W.; supervision, W.W.; project administration, W.W.; funding acquisition, W.W. All authors have read and agreed to the published version of the manuscript.

Funding

This work was supported by the Sustainable Development Project of Shenzhen (KCXFZ2020 1221173013036).

Data Availability Statement

Data are available in https://github.com/tjuwangyinghui/DCSNA (accessed on 26 April 2023).

Conflicts of Interest

The authors declare no conflict of interest.

References

  1. Shu, K.; Wang, S.; Tang, J.; Zafarani, R.; Liu, H. User identity linkage across online social networks: A review. ACM Sigkdd Explor. Newsl. 2017, 18, 5–17. [Google Scholar] [CrossRef]
  2. Shi, C.; Li, Y.; Zhang, J.; Sun, Y.; Philip, S.Y. A survey of heterogeneous information network analysis. IEEE Trans. Knowl. Data Eng. 2016, 29, 17–37. [Google Scholar] [CrossRef]
  3. Zhang, J.; Philip, S.Y. Integrated anchor and social link predictions across social networks. Knowl. Inf. Syst. 2019, 60, 303–326. [Google Scholar] [CrossRef]
  4. Kong, X.; Zhang, J.; Yu, P.S. Inferring Anchor Links across Multiple Heterogeneous Social Networks. In Proceedings of the 22nd ACM International Conference on Information & Knowledge Management (CIKM’13), Francisco, CA, USA, 27 October 2013; ACM: New York, NY, USA, 2013; pp. 179–188. [Google Scholar]
  5. Chen, L.J.; Gao, J. A trust-based recommendation method using network diffusion processes. Phys. A Stat. Mech. Appl. 2018, 506, 679–691. [Google Scholar] [CrossRef]
  6. Wang, B.; Gu, Y.; Zheng, D. Community detection in error-prone environments based on particle cooperation and competition with distance dynamics. Phys. A Stat. Mech. Appl. 2022, 607, 128178. [Google Scholar] [CrossRef]
  7. Wang, Q.; Xiao, Y.; Meng, D. Identification of structural key genes of mutual information gene networks of brain tumor. Phys. A Stat. Mech. Appl. 2022, 608, 128322. [Google Scholar] [CrossRef]
  8. Liang, B.; Wang, L.; Wang, X. OLMNE+FT: Multiplex network embedding based on overlapping links. Phys. A Stat. Mech. Appl. 2022, 596, 127116. [Google Scholar] [CrossRef]
  9. Jiao, P.; Tang, M.; Liu, H.; Wang, Y.; Lu, C.; Wu, H. Variational autoencoder based bipartite network embedding by integrating local and global structure. Inf. Sci. 2020, 519, 9–21. [Google Scholar] [CrossRef]
  10. Wu, H.; Wolter, K.; Jiao, P.; Deng, Y.; Zhao, Y.; Xu, M. EEDTO: An Energy-Efficient Dynamic Task Offloading Algorithm for Blockchain-Enabled IoT-Edge-Cloud Orchestrated Computing. IEEE Internet Things J. 2021, 8, 2163–2176. [Google Scholar] [CrossRef]
  11. Liu, L.; Cheung, W.K.; Li, X.; Liao, L. Aligning Users across Social Networks Using Network Embedding. In Proceedings of the Twenty-Fifth International Joint Conference on Artificial Intelligence (IJCAI’16), New York, NY, USA, 9–15 July 2016; pp. 1774–1780. [Google Scholar]
  12. Man, T.; Shen, H.; Liu, S.; Jin, X.; Cheng, X. Predict Anchor Links across Social Networks via an Embedding Approach. In Proceedings of the Twenty-Fifth International Joint Conference on Artificial Intelligence (IJCAI’16), New York, NY, USA, 9–15 July 2016; pp. 1823–1829. [Google Scholar]
  13. Chen, H.; YIN, H.; Sun, X.; Chen, T.; Gabrys, B.; Musial, K. Multi-Level Graph Convolutional Networks for Cross-Platform Anchor Link Prediction. In Proceedings of the 26th ACM SIGKDD International Conference on Knowledge Discovery & Data Mining (KDD’20), Long Beach, CA, USA, 6–10 July 2020; ACM: New York, NY, USA, 2020; pp. 1503–1511. [Google Scholar]
  14. Trung, H.T.; Toan, N.T.; Vinh, T.V.; Dat, H.T.; Thang, D.C.; Hung, N.Q.V.; Sattar, A. A comparative study on network alignment techniques. Expert Syst. Appl. 2020, 140, 112883. [Google Scholar] [CrossRef]
  15. Zheng, C.; Pan, L.; Wu, P. CAMU: Cycle-Consistent Adversarial Mapping Model for User Alignment across Social Networks. IEEE Trans. Cybern. 2021, 52, 10709–10720. [Google Scholar] [CrossRef]
  16. Chu, X.; Fan, X.; Yao, D.; Zhu, Z.; Huang, J.; Bi, J. Cross-Network Embedding for Multi-Network Alignment. In Proceedings of the The World Wide Web Conference (WWW’19), San Francisco, CA, USA, 13–17 May 2019; ACM: New York, NY, USA, 2019; pp. 273–284. [Google Scholar]
  17. Trung, H.T.; Van Vinh, T.; Tam, N.T.; Yin, H.; Weidlich, M.; Hung, N.Q.V. Adaptive network alignment with unsupervised and multi-order convolutional networks. In Proceedings of the 2020 IEEE 36th International Conference on Data Engineering (ICDE), Dallas, TX, USA, 20–24 April 2020; pp. 85–96. [Google Scholar]
  18. Nicolau, M.; McDermott, J. Learning neural representations for network anomaly detection. IEEE Trans. Cybern. 2018, 49, 3074–3087. [Google Scholar] [CrossRef]
  19. Zhou, X.; Liang, X.; Du, X.; Zhao, J. Structure Based User Identification across Social Networks. IEEE Trans. Knowl. Data Eng. 2018, 30, 1178–1191. [Google Scholar] [CrossRef]
  20. Bayati, M.; Gleich, D.F.; Saberi, A.; Wang, Y. Message-passing algorithms for sparse network alignment. ACM Trans. Knowl. Discov. Data (TKDD) 2013, 7, 1–31. [Google Scholar] [CrossRef]
  21. Zhang, S.; Tong, H. Final: Fast attributed network alignment. In Proceedings of the 22nd ACM SIGKDD International Conference on Knowledge Discovery and Data Mining, San Francisco, CA, USA, 13–17 August 2016; pp. 1345–1354. [Google Scholar]
  22. Koutra, D.; Tong, H.; Lubensky, D. Big-align: Fast bipartite graph alignment. In Proceedings of the 2013 IEEE 13th International Conference on Data Mining, Dallas, TX, USA, 7–10 December 2013; pp. 389–398. [Google Scholar]
  23. Vijayan, V.; Milenković, T. Multiple network alignment via multiMAGNA++. IEEE/ACM Trans. Comput. Biol. Bioinform. 2017, 15, 1669–1682. [Google Scholar] [CrossRef]
  24. Ge, R.; Wu, Q.; Xu, J. Computational methods for protein–protein interaction network alignment. In Recent Advances in Biological Network Analysis; Springer: Berlin/Heidelberg, Germany, 2021; pp. 45–63. [Google Scholar]
  25. Menor-Flores, M.; Vega-Rodríguez, M.A. Decomposition-based multi-objective optimization approach for PPI network alignment. Knowl.-Based Syst. 2022, 243, 108527. [Google Scholar] [CrossRef]
  26. Lanrezac, A.; Laurent, B.; Santuz, H.; Férey, N.; Baaden, M. Fast and Interactive Positioning of Proteins within Membranes. Algorithms 2022, 15, 415. [Google Scholar] [CrossRef]
  27. Sun, M.; Zhu, H.; Xie, R.; Liu, Z. Iterative Entity Alignment Via Joint Knowledge Embeddings. In Proceedings of the International Joint Conference on Artificial Intelligence, Melbourne, Australia, 19–25 August 2017; pp. 4258–4264. [Google Scholar] [CrossRef]
  28. Chen, M.; Tian, Y.; Yang, M.; Zaniolo, C. Multilingual Knowledge Graph Embeddings for Cross-Lingual Knowledge Alignment. In Proceedings of the 26th International Joint Conference on Artificial Intelligence (IJCAI’17), Melbourne, Australia, 19–25 August 2017; pp. 1511–1517. [Google Scholar]
  29. Zaslavskiy, M.; Bach, F.; Vert, J.P. A path following algorithm for the graph matching problem. IEEE Trans. Pattern Anal. Mach. Intell. 2008, 31, 2227–2242. [Google Scholar] [CrossRef]
  30. Yang, Y.; Wang, L.; Liu, D. Anchor link prediction across social networks based on multiple consistency. Knowl.-Based Syst. 2022, 257, 109939. [Google Scholar] [CrossRef]
  31. Wang, Y.; Peng, Q.; Wang, W.; Guo, X.; Shao, M.; Liu, H.; Liang, W.; Pan, L. Network Alignment enhanced via modeling heterogeneity of anchor nodes. Knowl.-Based Syst. 2022, 250, 109116. [Google Scholar] [CrossRef]
  32. Ren, J.; Zhang, Z.; Jin, J.; Zhao, X.; Wu, S.; Zhou, Y.; Shen, Y.; Che, T.; Jin, R.; Dou, D. Integrated Defense for Resilient Graph Matching. In Proceedings of the 38th International Conference on Machine Learning, Virtual, 18–24 July 2021; Meila, M., Zhang, T., Eds.; Volume 139, pp. 8982–8997. [Google Scholar]
  33. Zhang, J.; Chen, B.; Wang, X.; Chen, H.; Li, C.; Jin, F.; Song, G.; Zhang, Y. MEgo2Vec: Embedding Matched Ego Networks for User Alignment Across Social Networks. In Proceedings of the 27th ACM International Conference on Information and Knowledge Management (CIKM’18), Turin, Italy, 22–26 October 2018; Association for Computing Machinery: New York, NY, USA, 2018; pp. 327–336. [Google Scholar] [CrossRef]
  34. Zhong, Z.; Cao, Y.; Guo, M.; Nie, Z. Colink: An Unsupervised Framework for User Identity Linkage. In Proceedings of the Thirty-Second AAAI Conference on Artificial Intelligence, New Orleans, LA, USA, 2–7 February 2018; Volume 32, pp. 5714–5721. [Google Scholar]
  35. Yan, Y.; Zhang, S.; Tong, H. BRIGHT: A Bridging Algorithm for Network Alignment. In Proceedings of the Web Conference (WWW’21), Ljubljana, Slovenia, 19–23 April 2021; Association for Computing Machinery: New York, NY, USA, 2021; pp. 3907–3917. [Google Scholar] [CrossRef]
  36. Liu, J.; Zhang, F.; Song, X.; Song, Y.I.; Lin, C.Y.; Hon, H.W. What’s in a Name? An Unsupervised Approach to Link Users across Communities. In Proceedings of the Sixth ACM International Conference on Web Search and Data Mining (WSDM’13), Rome, Italy, 4–8 February 2013; ACM: New York, NY, USA, 2013; pp. 495–504. [Google Scholar]
  37. Liu, S.; Wang, S.; Zhu, F.; Zhang, J.; Krishnan, R. HYDRA: Large-Scale Social Identity Linkage via Heterogeneous Behavior Modeling. In Proceedings of the 2014 ACM SIGMOD International Conference on Management of Data (SIGMOD’14), Snowbird, UT, USA, 22–27 June 2014; ACM: New York, NY, USA, 2014; pp. 51–62. [Google Scholar]
  38. Riederer, C.; Kim, Y.; Chaintreau, A.; Korula, N.; Lattanzi, S. Linking users across domains with location data: Theory and validation. In Proceedings of the 25th International Conference on World Wide Web, Montreal, QC, Canada, 11–15 April 2016; pp. 707–719. [Google Scholar]
  39. Wang, Z.; Lv, Q.; Lan, X.; Zhang, Y. Cross-lingual Knowledge Graph Alignment via Graph Convolutional Networks. In Proceedings of the 2018 Conference on Empirical Methods in Natural Language Processing, Brussels, Belgium, 31 October–4 November 2018; pp. 349–357. [Google Scholar]
  40. Wang, Y.; Wang, W.; Zhen, Z.; Peng, Q.; Jiao, P.; Liang, W.; Shao, M.; Sun, Y. Geometry interaction network alignment. Neurocomputing 2022, 501, 618–628. [Google Scholar] [CrossRef]
  41. Zhu, D.; Cui, P.; Wang, D.; Zhu, W. Deep Variational Network Embedding in Wasserstein Space. In Proceedings of the 24th ACM SIGKDD International Conference on Knowledge Discovery and Data Mining, London, UK, 19–23 August 2018; pp. 2827–2836. [Google Scholar]
  42. Zhou, F.; Cao, C.; Zhang, K.; Trajcevski, G.; Zhong, T.; Geng, J. Meta-GNN: On Few-Shot Node Classification in Graph Meta-Learning. In Proceedings of the 28th ACM International Conference on Information and Knowledge Management (CIKM’19), Beijing China, 3–7 November 2019; pp. 2357–2360. [Google Scholar]
  43. Zhang, S.; Tong, H. Attributed Network Alignment: Problem Definitions and Fast Solutions. IEEE Trans. Knowl. Data Eng. 2019, 31, 1680–1692. [Google Scholar] [CrossRef]
  44. De Domenico, M.; Lancichinetti, A.; Arenas, A.; Rosvall, M. Identifying modular flows on multilayer networks reveals highly overlapping organization in interconnected systems. Phys. Rev. X 2015, 5, 011027. [Google Scholar] [CrossRef]
  45. Viswanath, B.; Mislove, A.; Cha, M.; Gummadi, K.P. On the Evolution of User Interaction in Facebook. In Proceedings of the 2nd ACM Workshop on Online Social Networks, Barcelona, Spain, 17 August 2009; pp. 37–42. [Google Scholar]
  46. Zhang, S.; Tong, H.; Jin, L.; Xia, Y.; Guo, Y. Balancing Consistency and Disparity in Network Alignment. In Proceedings of the 27th ACM SIGKDD Conference on Knowledge Discovery and Data Mining (KDD’21), Washington, DC, USA, 24–28 August 2021; Association for Computing Machinery: New York, NY, USA, 2021; pp. 2212–2222. [Google Scholar]
Figure 1. An example of anchor node pairs’ diverse connection status. Given two networks, the relationships between users within each network are represented by solid black lines, while the yellow dashed line connects the common users (i.e., anchor nodes) across the networks. (a) Equivalence connection status. (b) Non-equivalence connection status. (c) Containment connection status. (d) Non-containment connection status.
Algorithms 16 00234 g001
Figure 2. The common neighbors’ analysis of anchor node pairs in real social networks (Twitter–Foursquare). For a given pair of anchor nodes ( v , u ) , r is the ration of their common labeled anchor node neighbors to v/u’s neighbors. The abscissa represents the r in Twitter, and the ordinate represents r in Foursquare.
Algorithms 16 00234 g002
Figure 3. The overall process of DCSNA contains three parts: Masked Network Encoder that learns the node representations in G s and G t in a low-dimension embedding space; Meta-Learning based Constraint that learns the information of corresponding labeled anchor nodes between G s and G t ; Anchor Link Prediction that predicts the potential anchor links based on the learned node representations.
Algorithms 16 00234 g003
Figure 4. Results of varying edges on Dataset.4.
Algorithms 16 00234 g004
Figure 5. Running time on all datasets.
Algorithms 16 00234 g005
Figure 6. Result of ablation study.
Algorithms 16 00234 g006
Figure 7. Results of parameters study.
Algorithms 16 00234 g007
Table 1. Statistics details of the datasets.
Dataset# Nodes# Edges# Anchor Links p r
Dataset.1987239,56163520.86
991644,808
Dataset.2358314,4859850.80
19056097
Dataset.35120164,91916090.73
531376,972
Dataset.438,310591,12438,2870.82
38,310591,694
Table 2. Experimental results of DCSNA and other methods.
MetricDatasetPALECrossMNACAMUBRIGHTNeXtAlignDHNADCSNA
Macro PrecisionDataset.10.6170.6300.6630.6020.7100.7190.730
Dataset.20.5890.6290.6540.6170.6490.6720.727
Dataset.30.5960.6160.6350.6160.6510.7500.883
Dataset.40.5950.6500.5530.5980.6210.7030.796
Macro RecallDataset.10.5540.6200.6460.6260.6970.6620.676
Dataset.20.5860.6180.6860.5540.6930.6770.695
Dataset.30.5850.6160.6290.6140.6960.7060.516
Dataset.40.5940.6300.5490.6220.6290.6880.796
Macro F1Dataset.10.5830.6180.6550.6190.7030.6750.688
Dataset.20.5850.6190.6700.5840.6700.6730.704
Dataset.30.5840.6160.6700.6160.6740.7210.533
Dataset.40.5940.6400.5510.6100.6250.6950.796
Disclaimer/Publisher’s Note: The statements, opinions and data contained in all publications are solely those of the individual author(s) and contributor(s) and not of MDPI and/or the editor(s). MDPI and/or the editor(s) disclaim responsibility for any injury to people or property resulting from any ideas, methods, instructions or products referred to in the content.

