
Evolutionary Algorithms in a Bacterial Consortium of Synthetic Bacteria

Abstract
1. Introduction
2. Materials and Methods
2.1. Microbial Community or Consortium Meta-Model
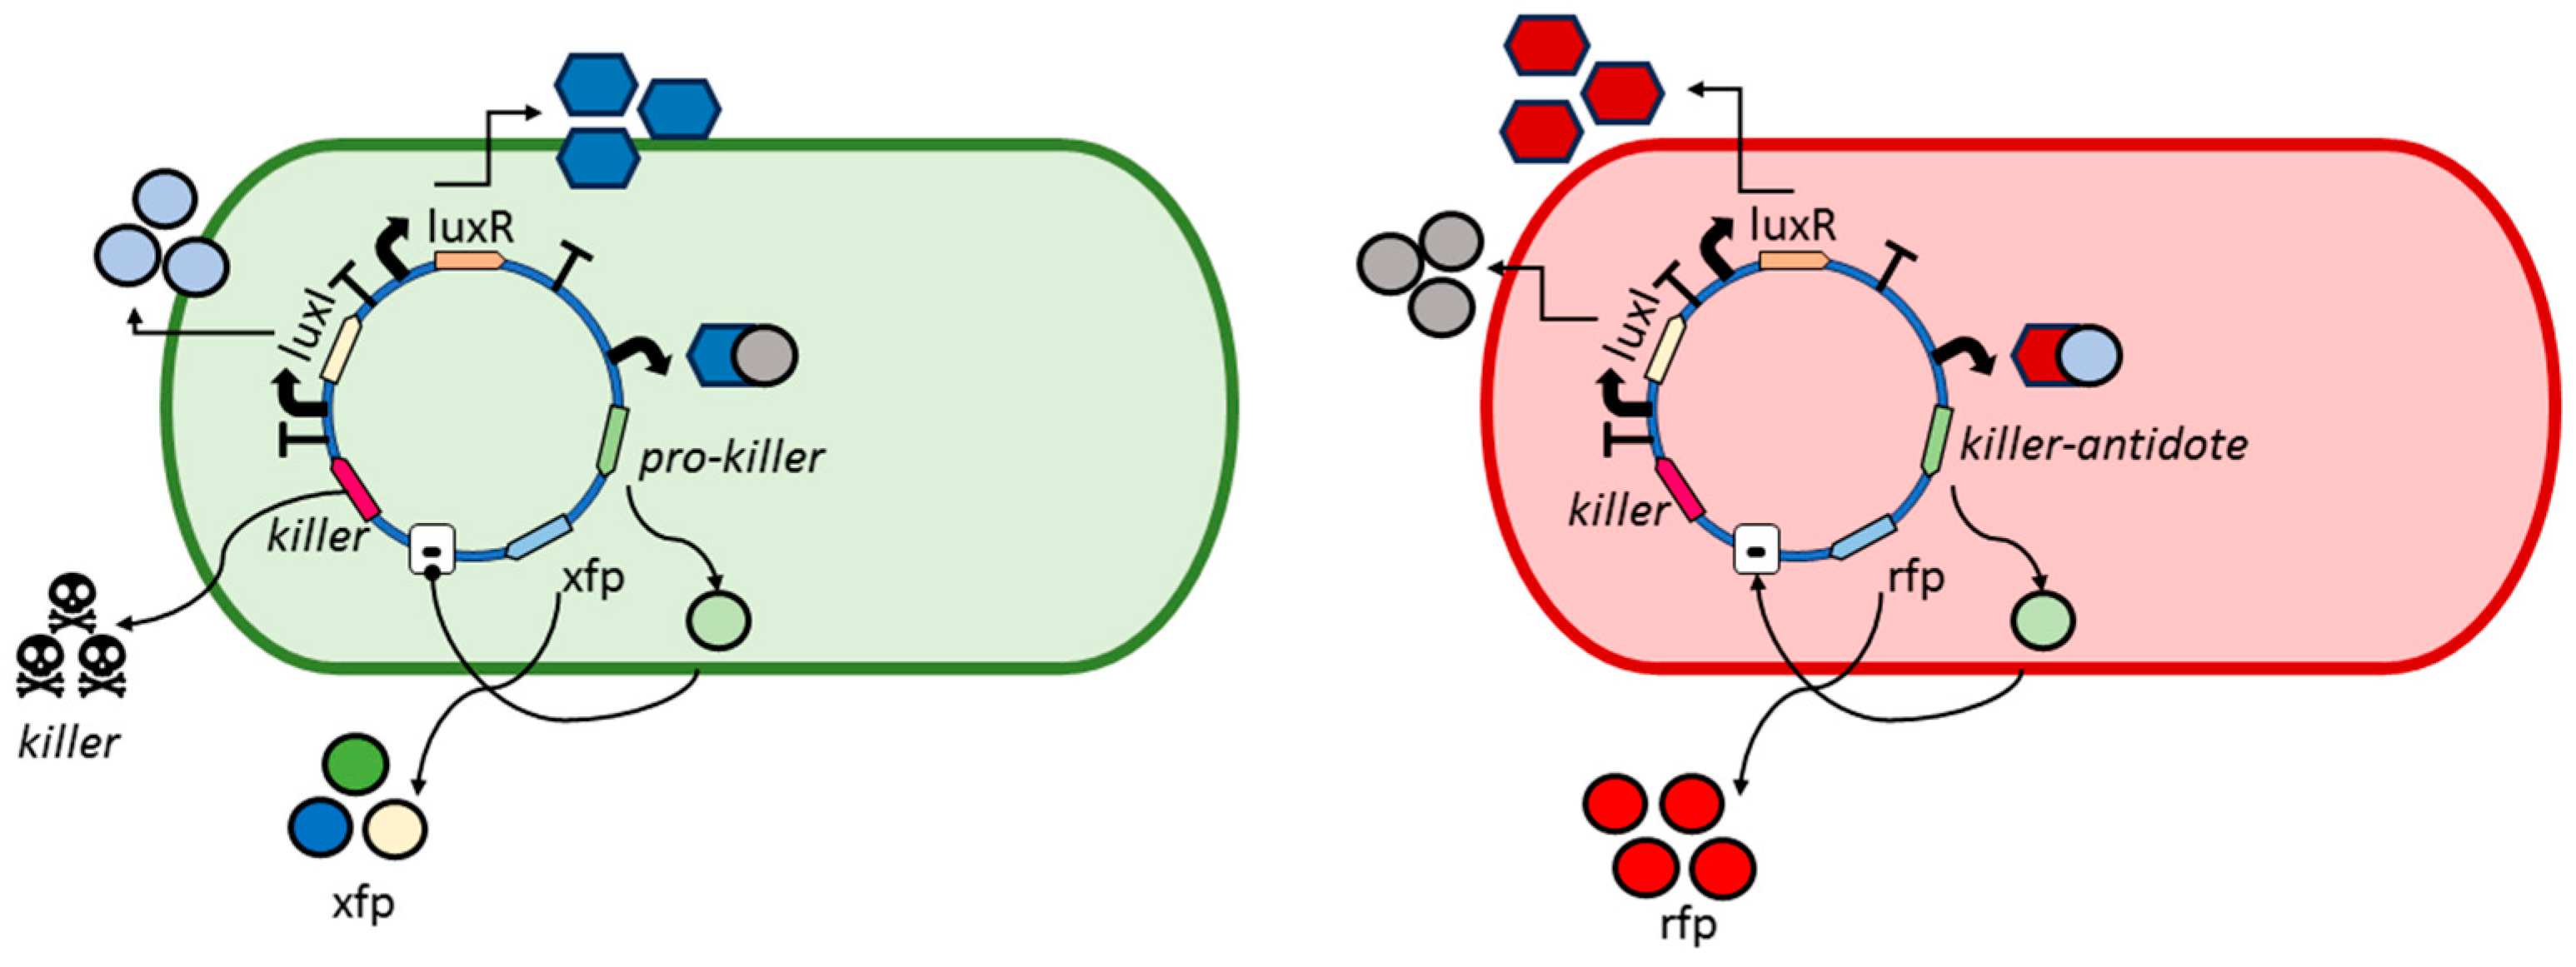
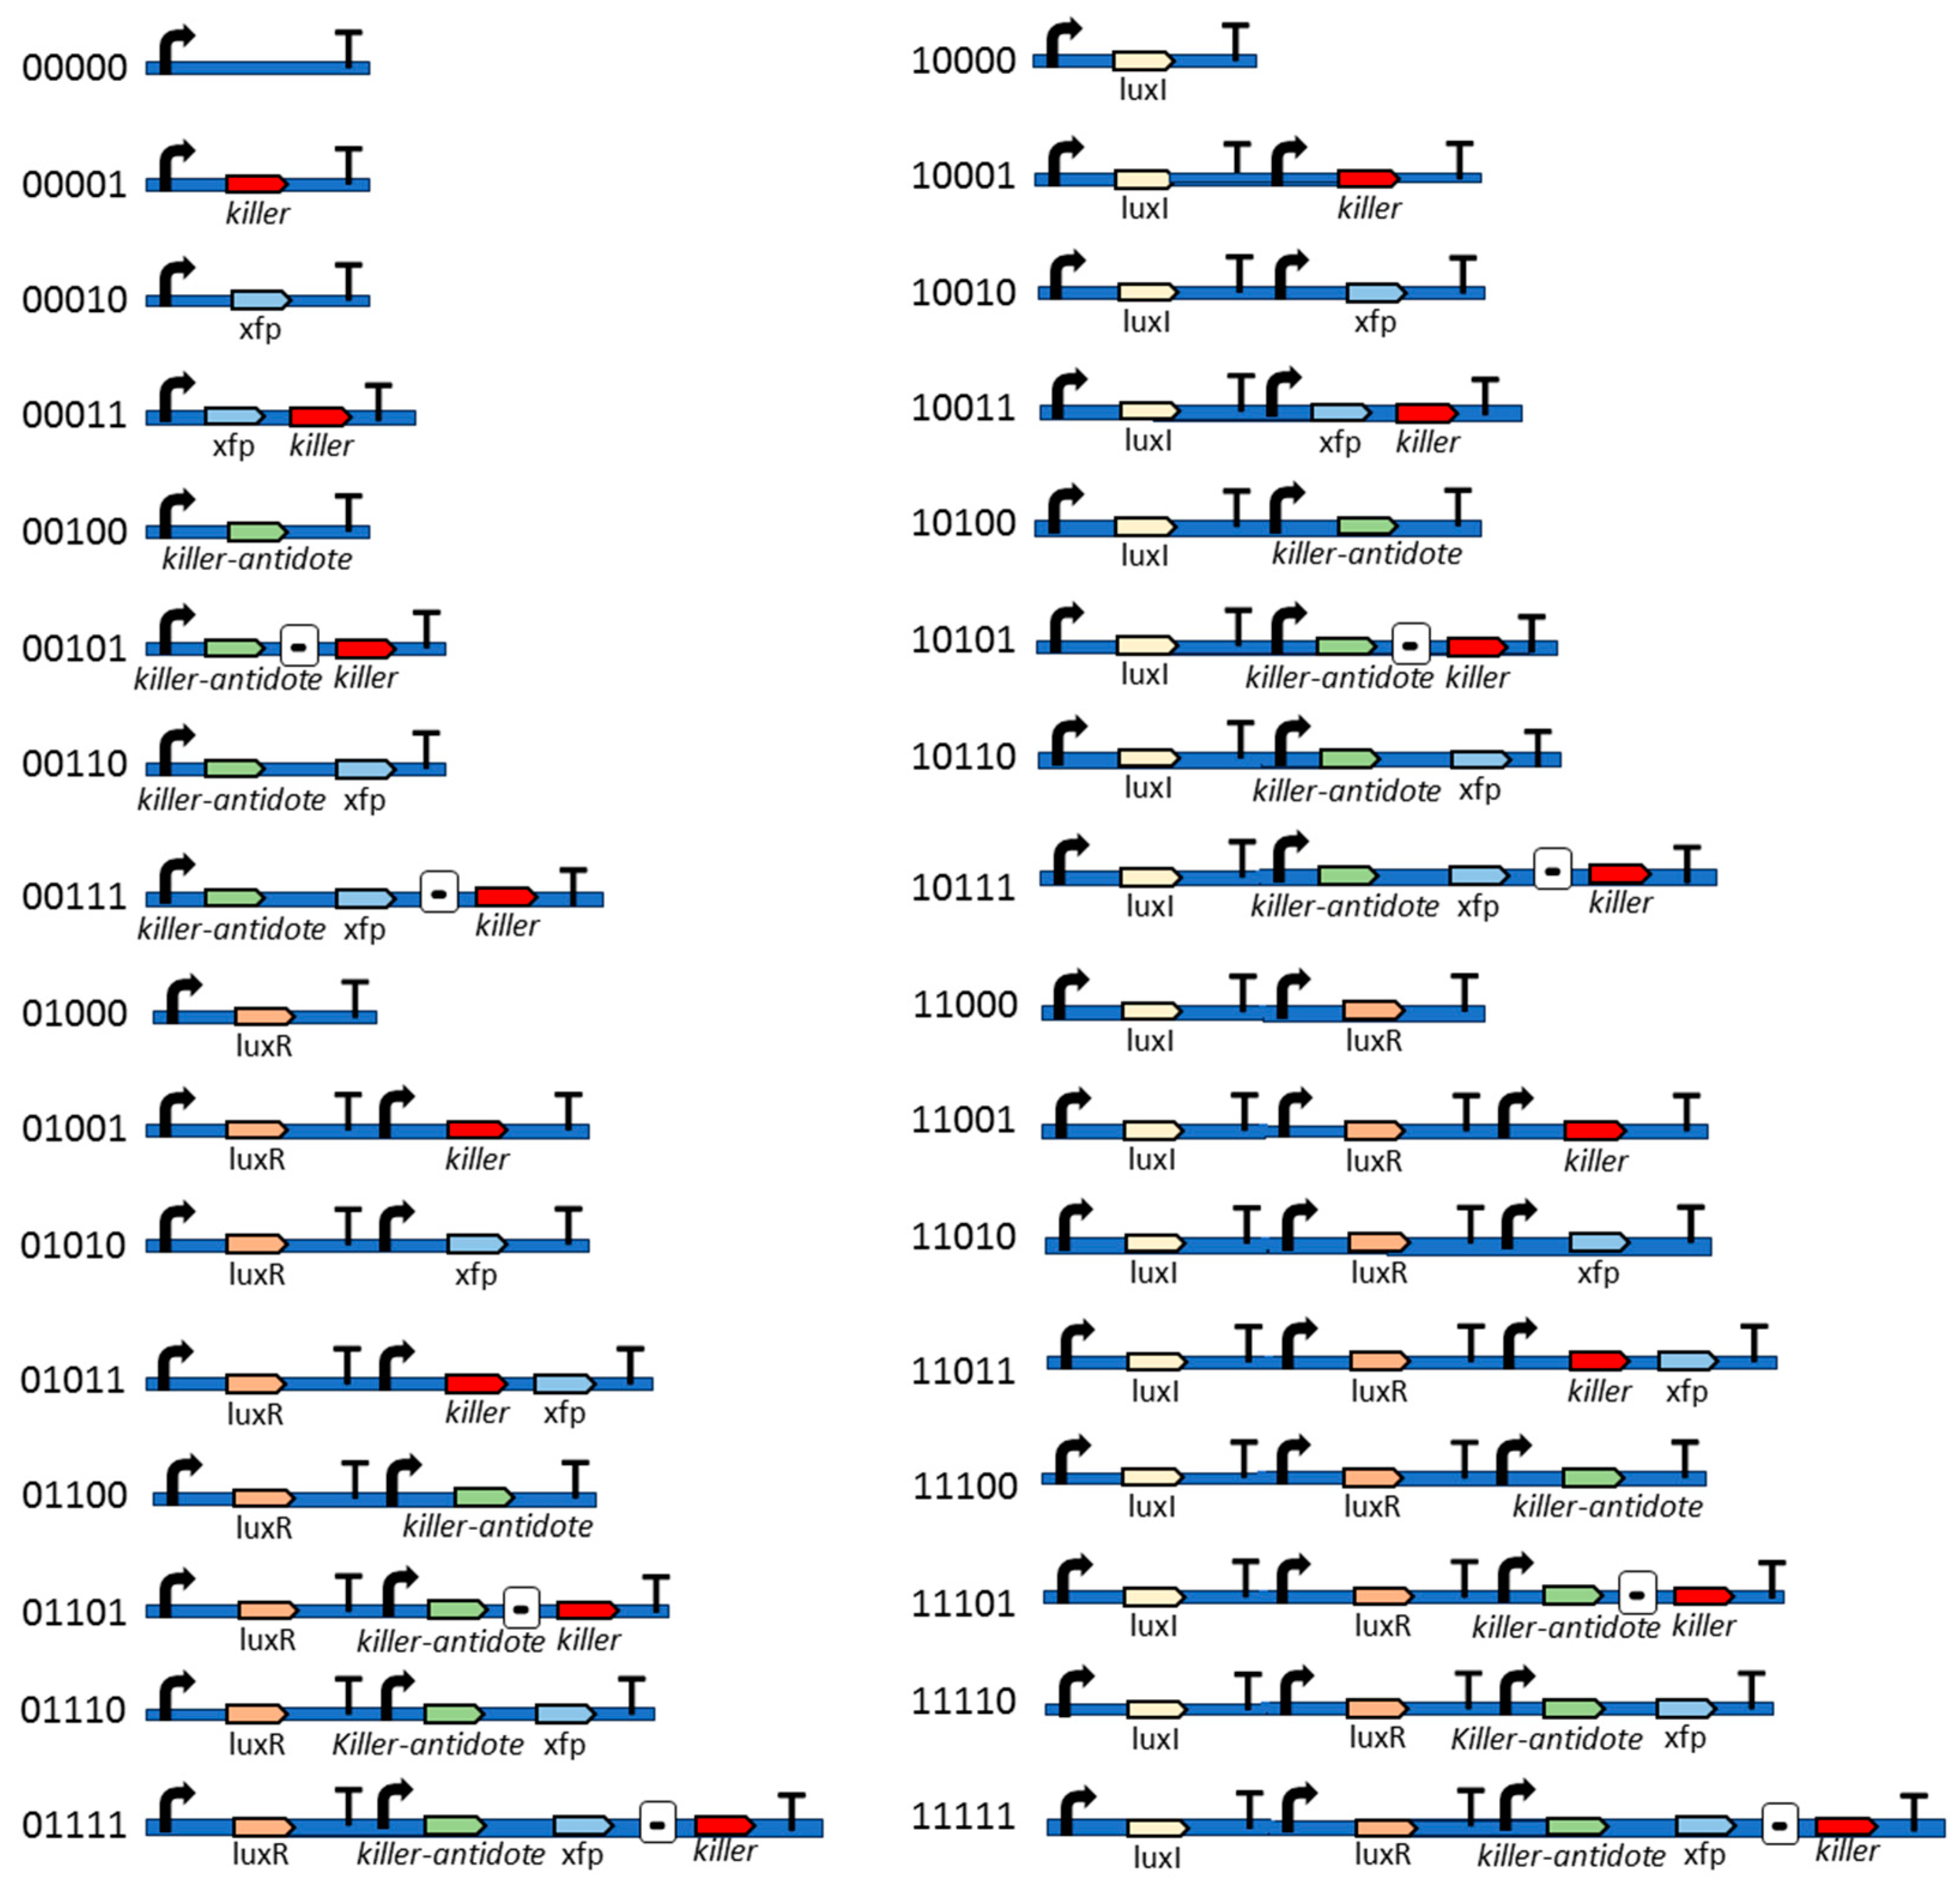
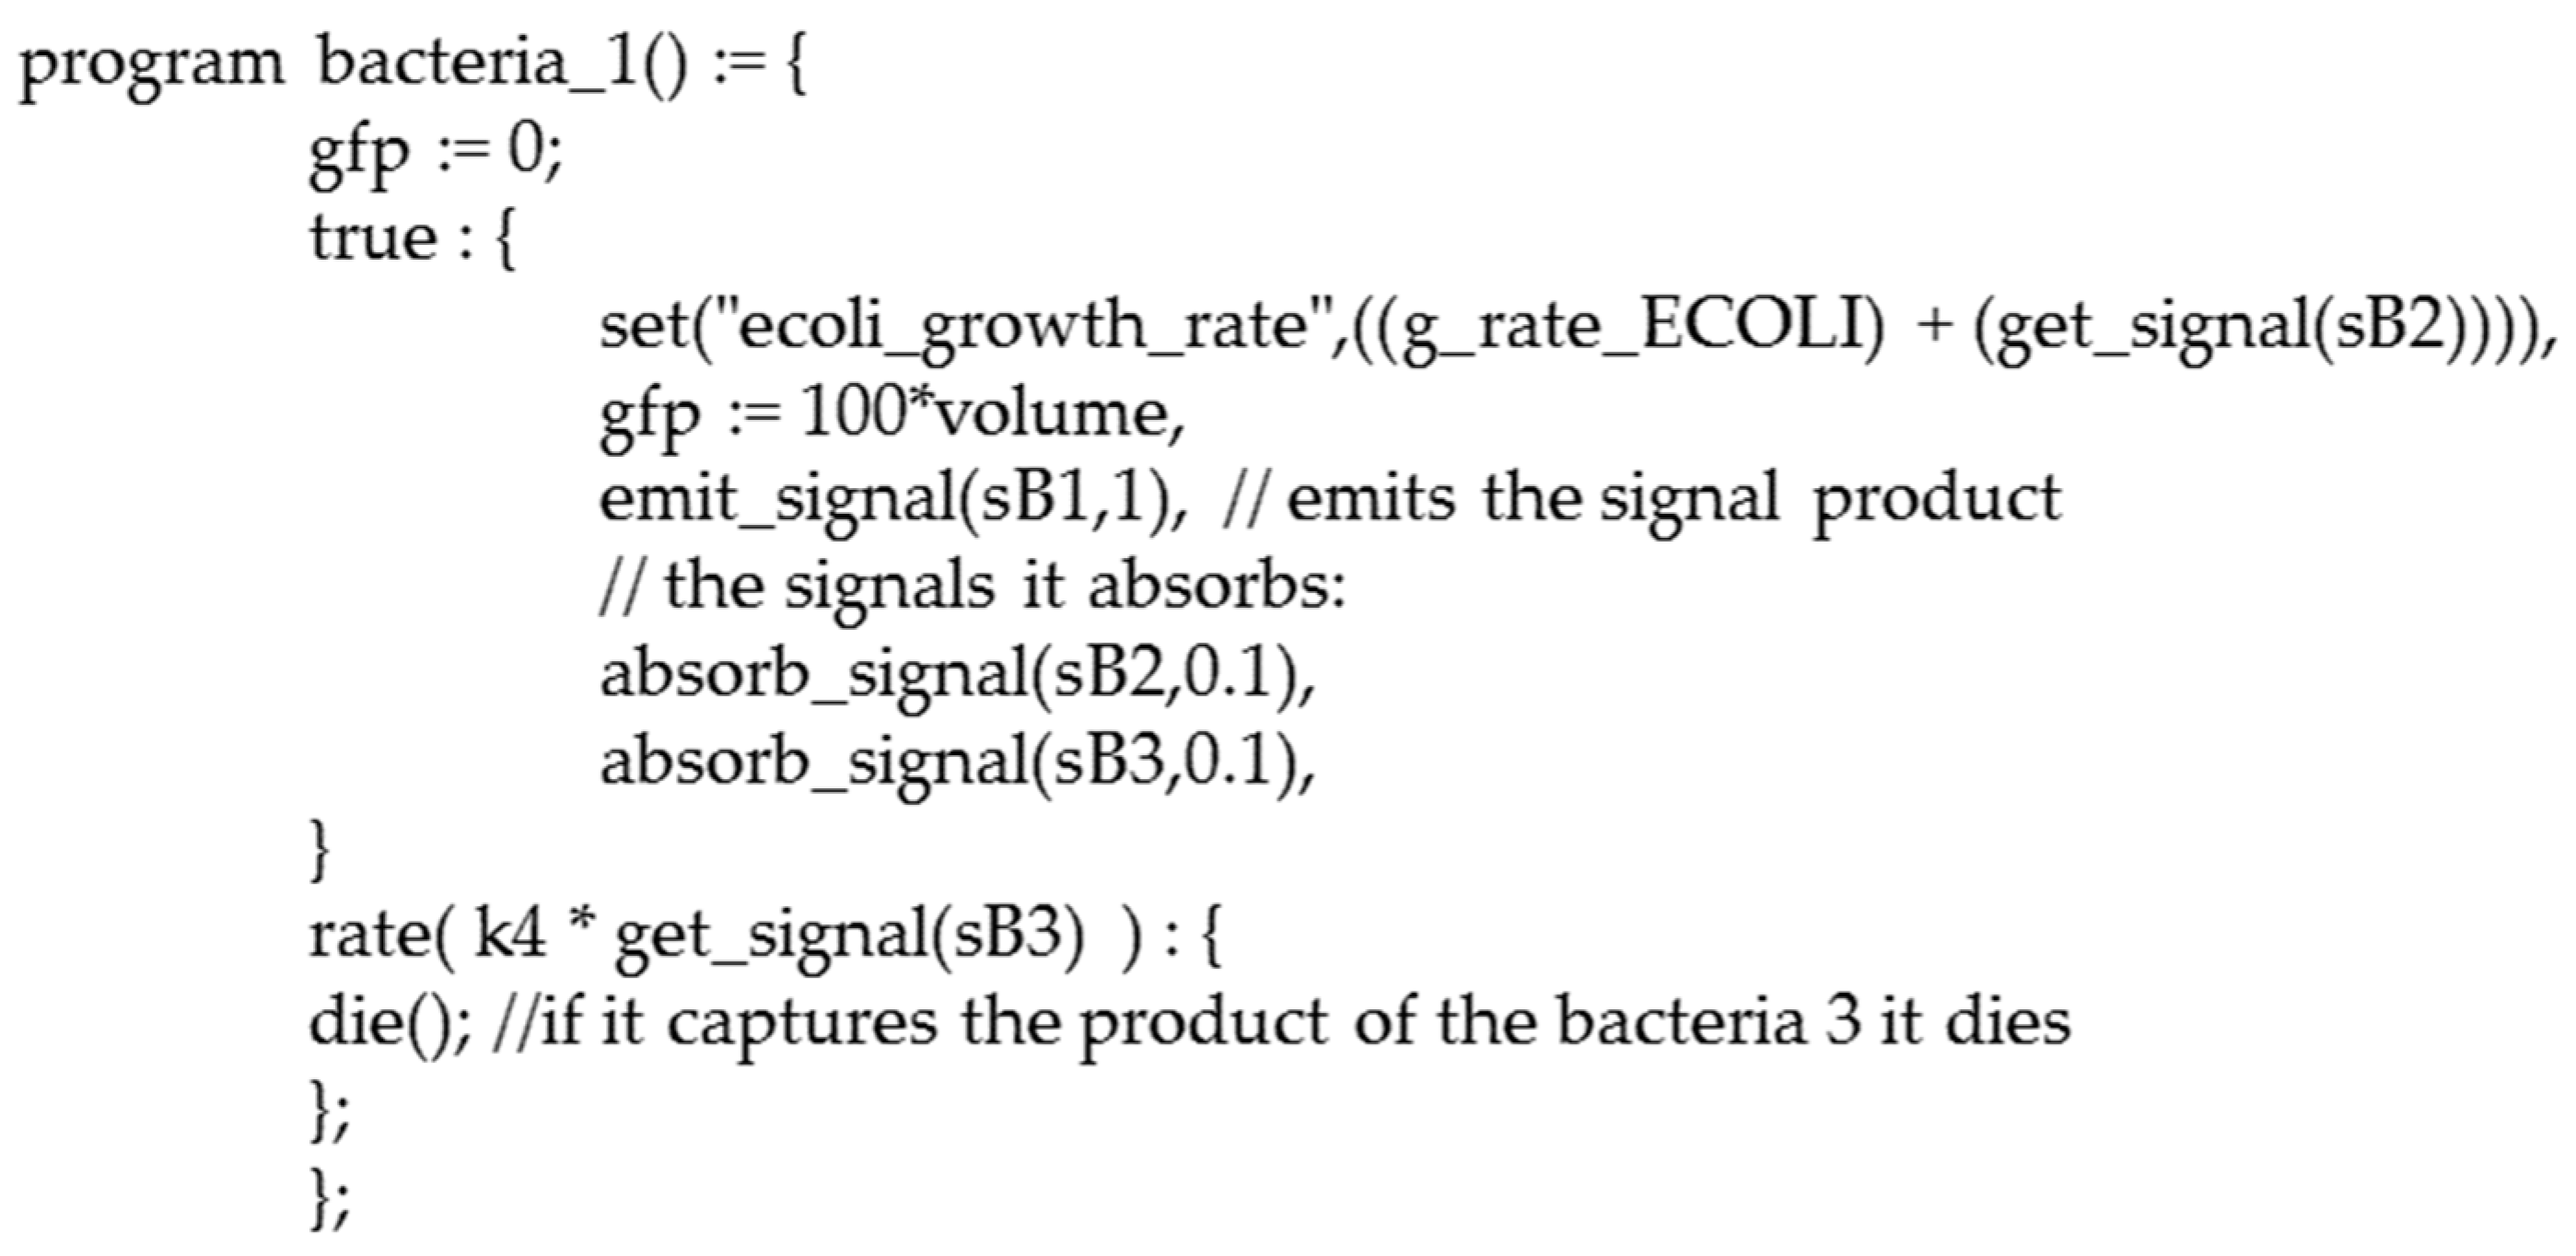
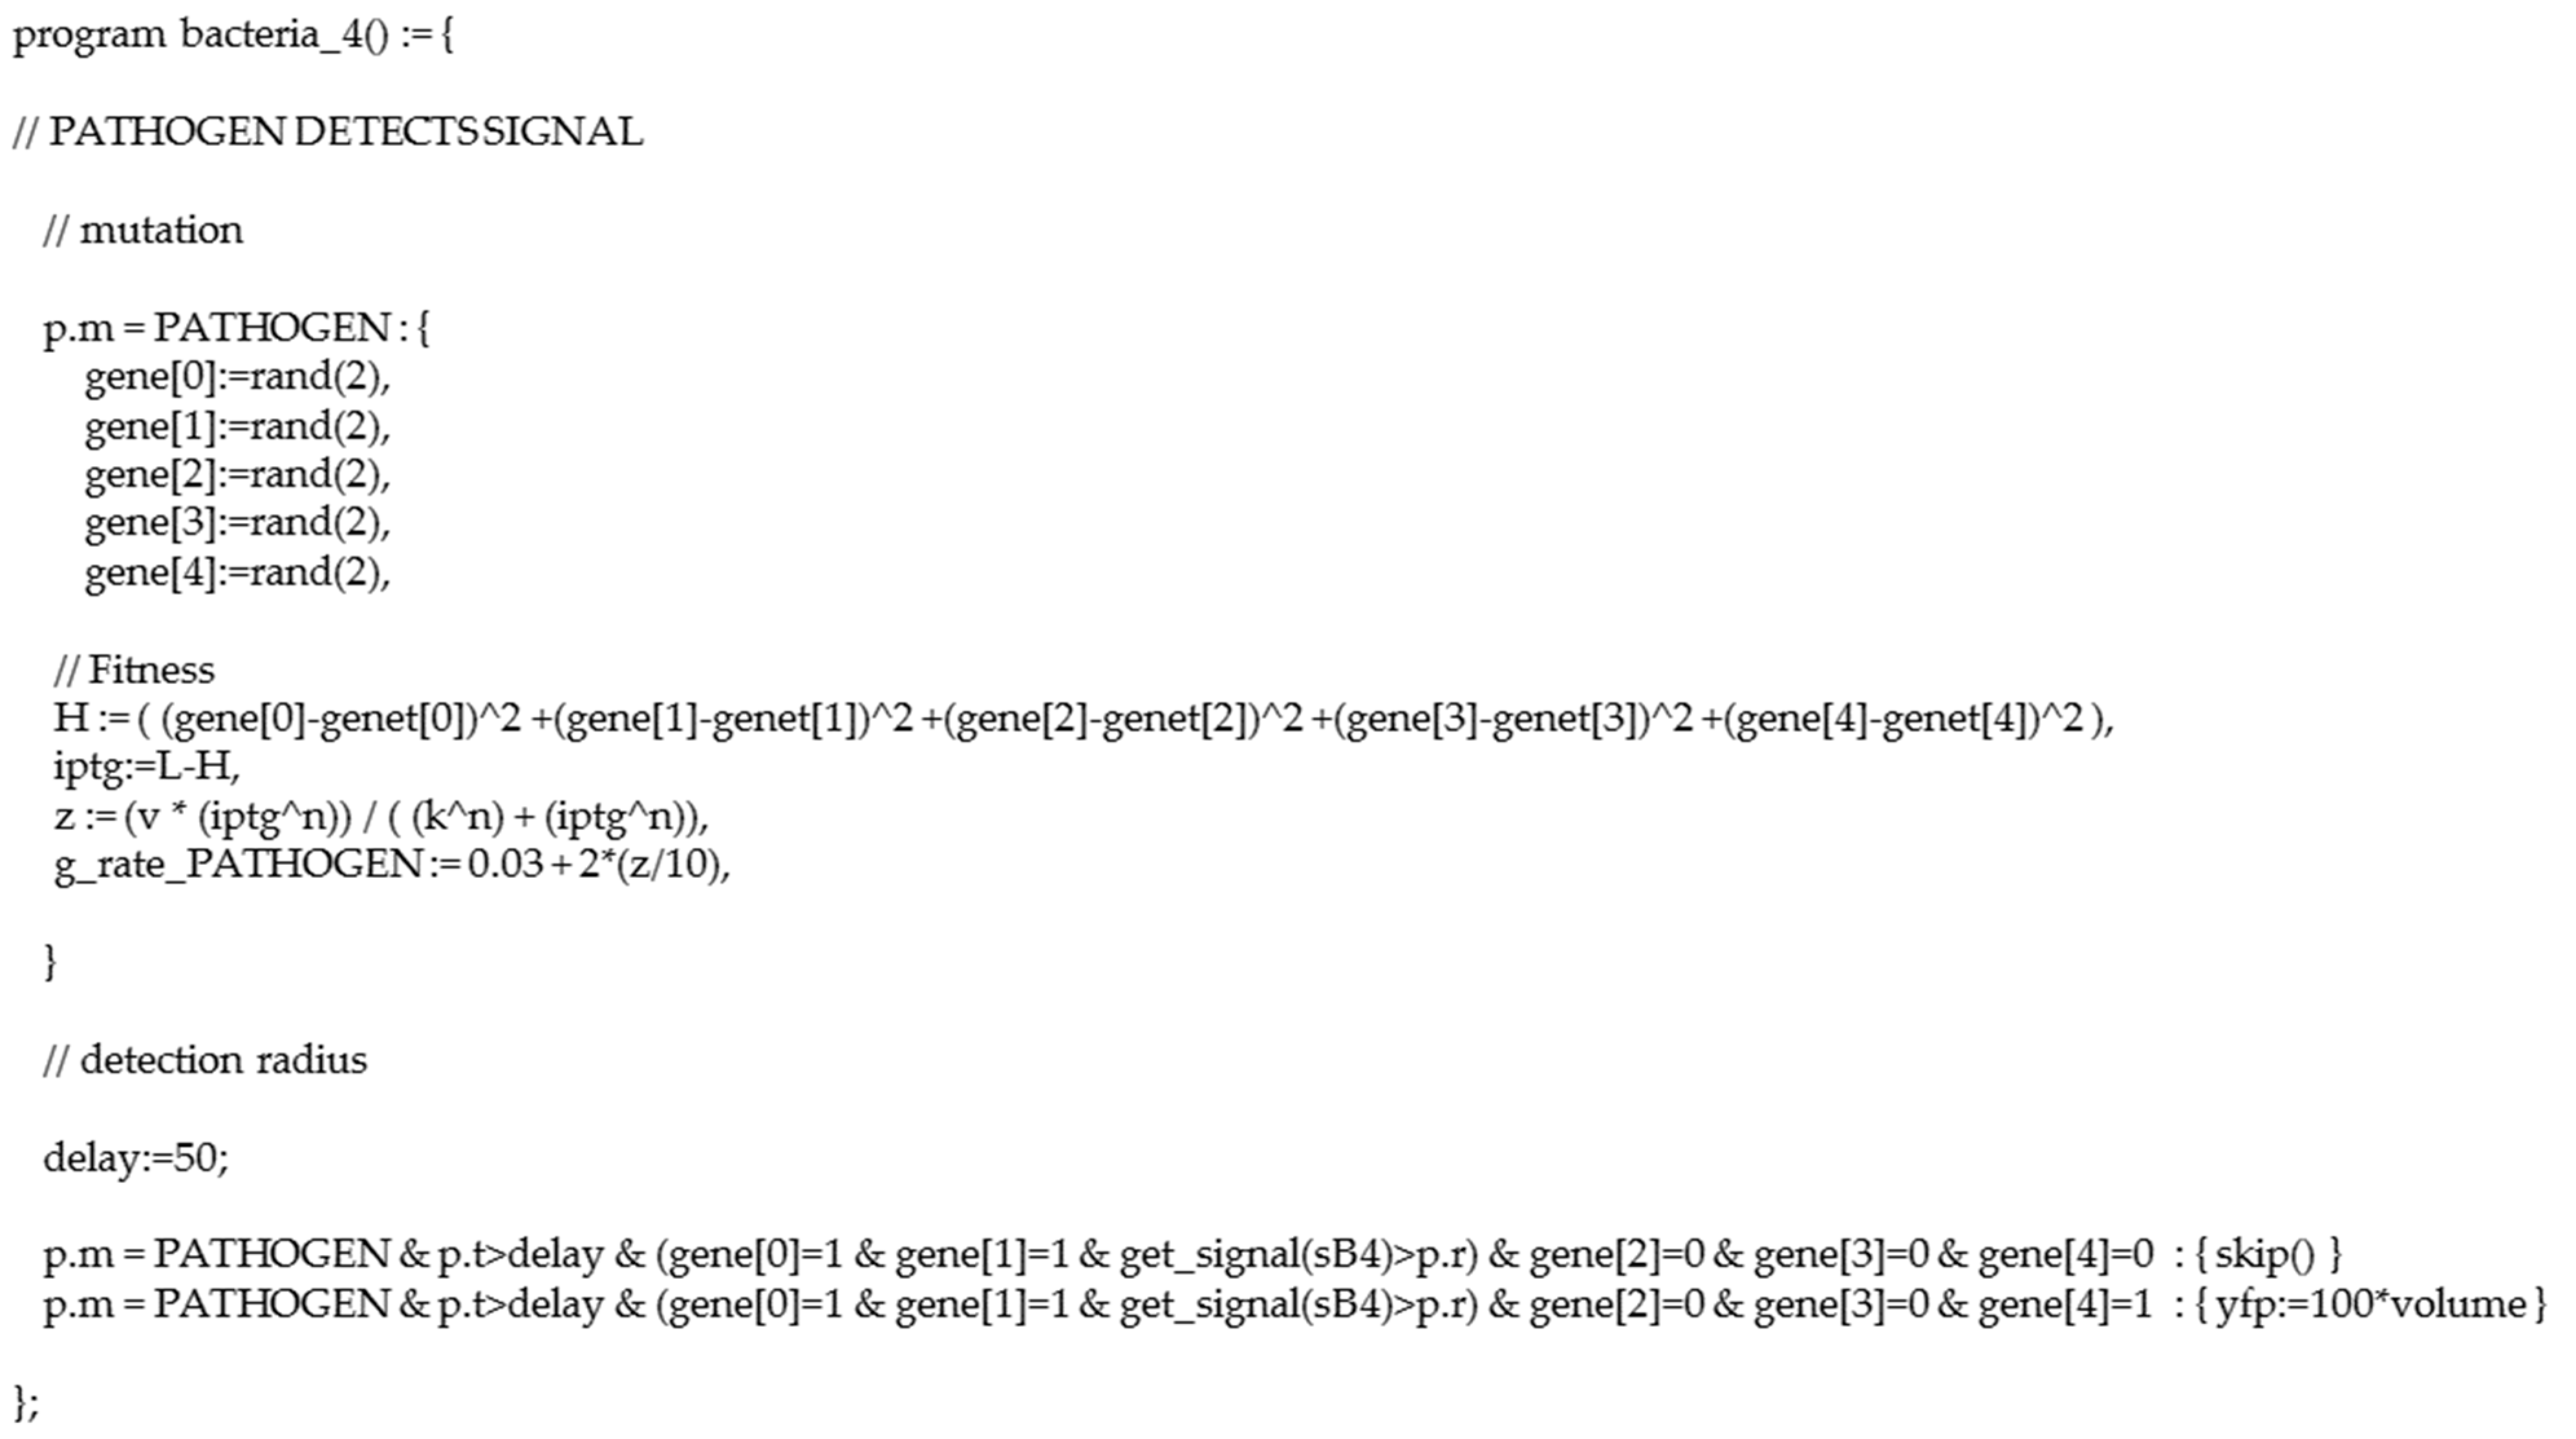
2.2. Synthetic Bacteria Programming
2.3. A Preliminary Experiment for Bottom-Up Design of Synthetic Bacteria: GADY
2.4. BAGA Evolutionary Algorithm
- (i)
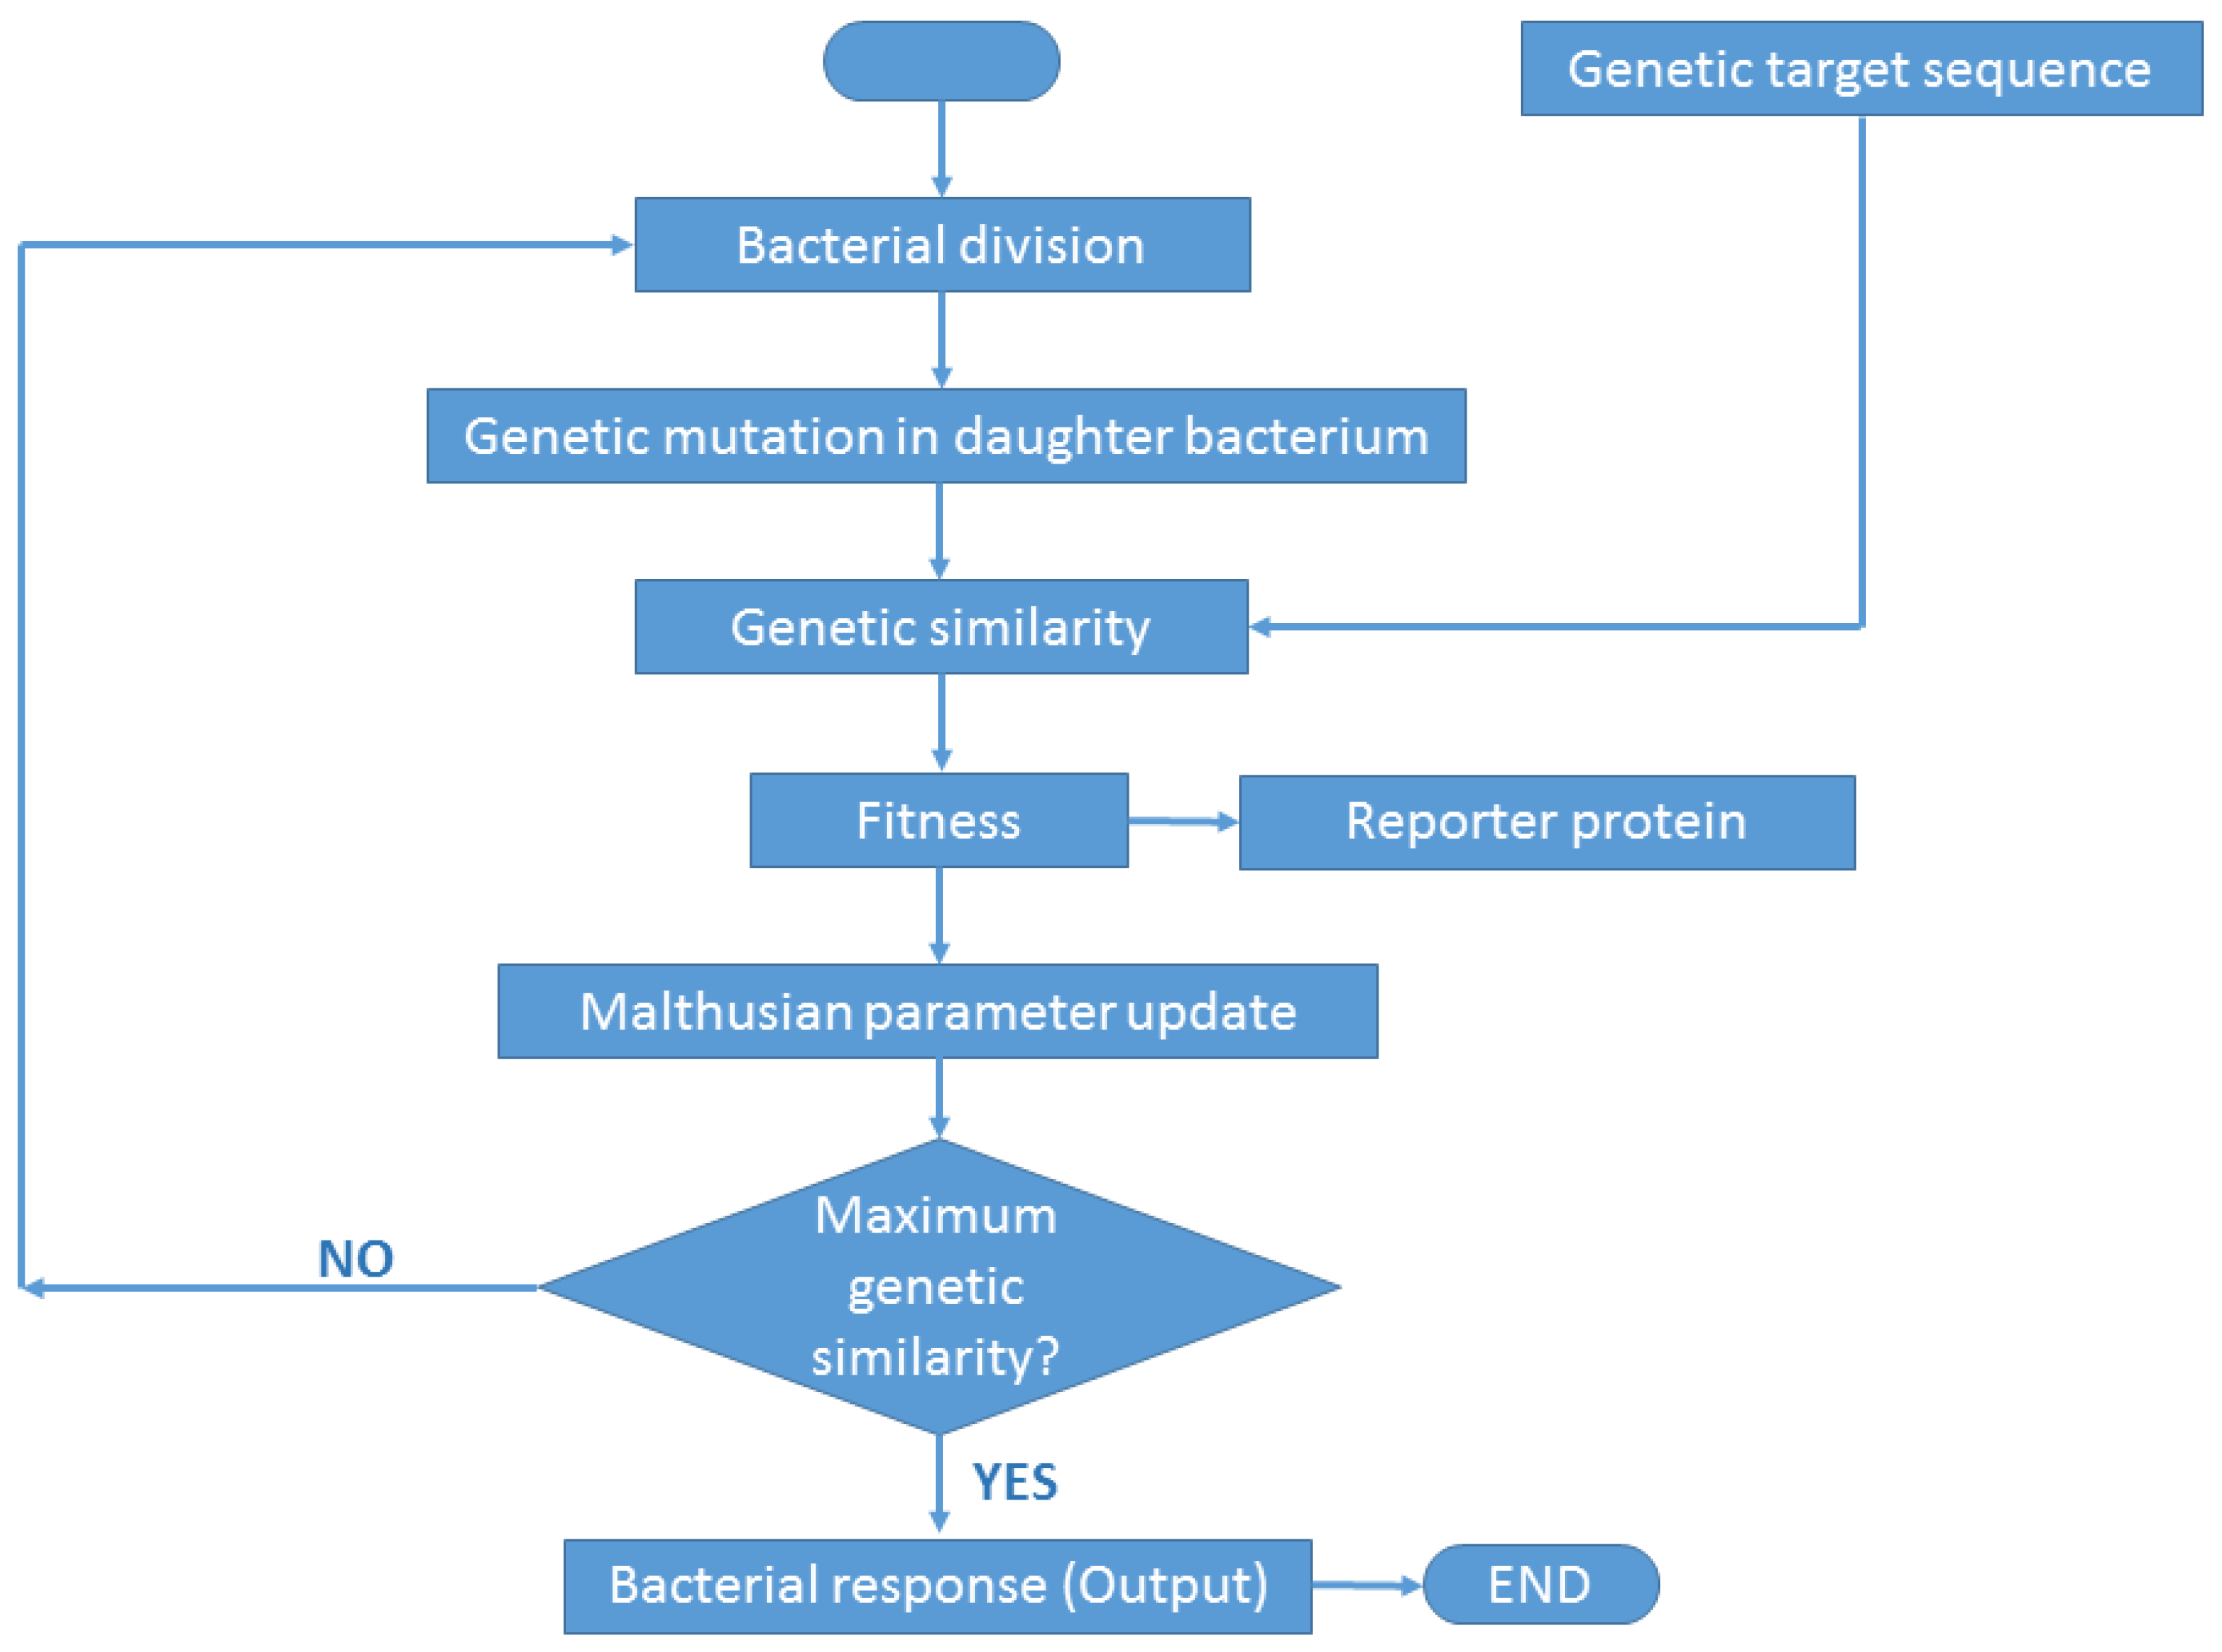
- Genetic target sequence. In the first step, we set the target sequence. For instance, suppose the problem is of finding the sequence 110. In this instance, the target sequence is declared in Gro language as a list: {1,1,0}.
- (ii)
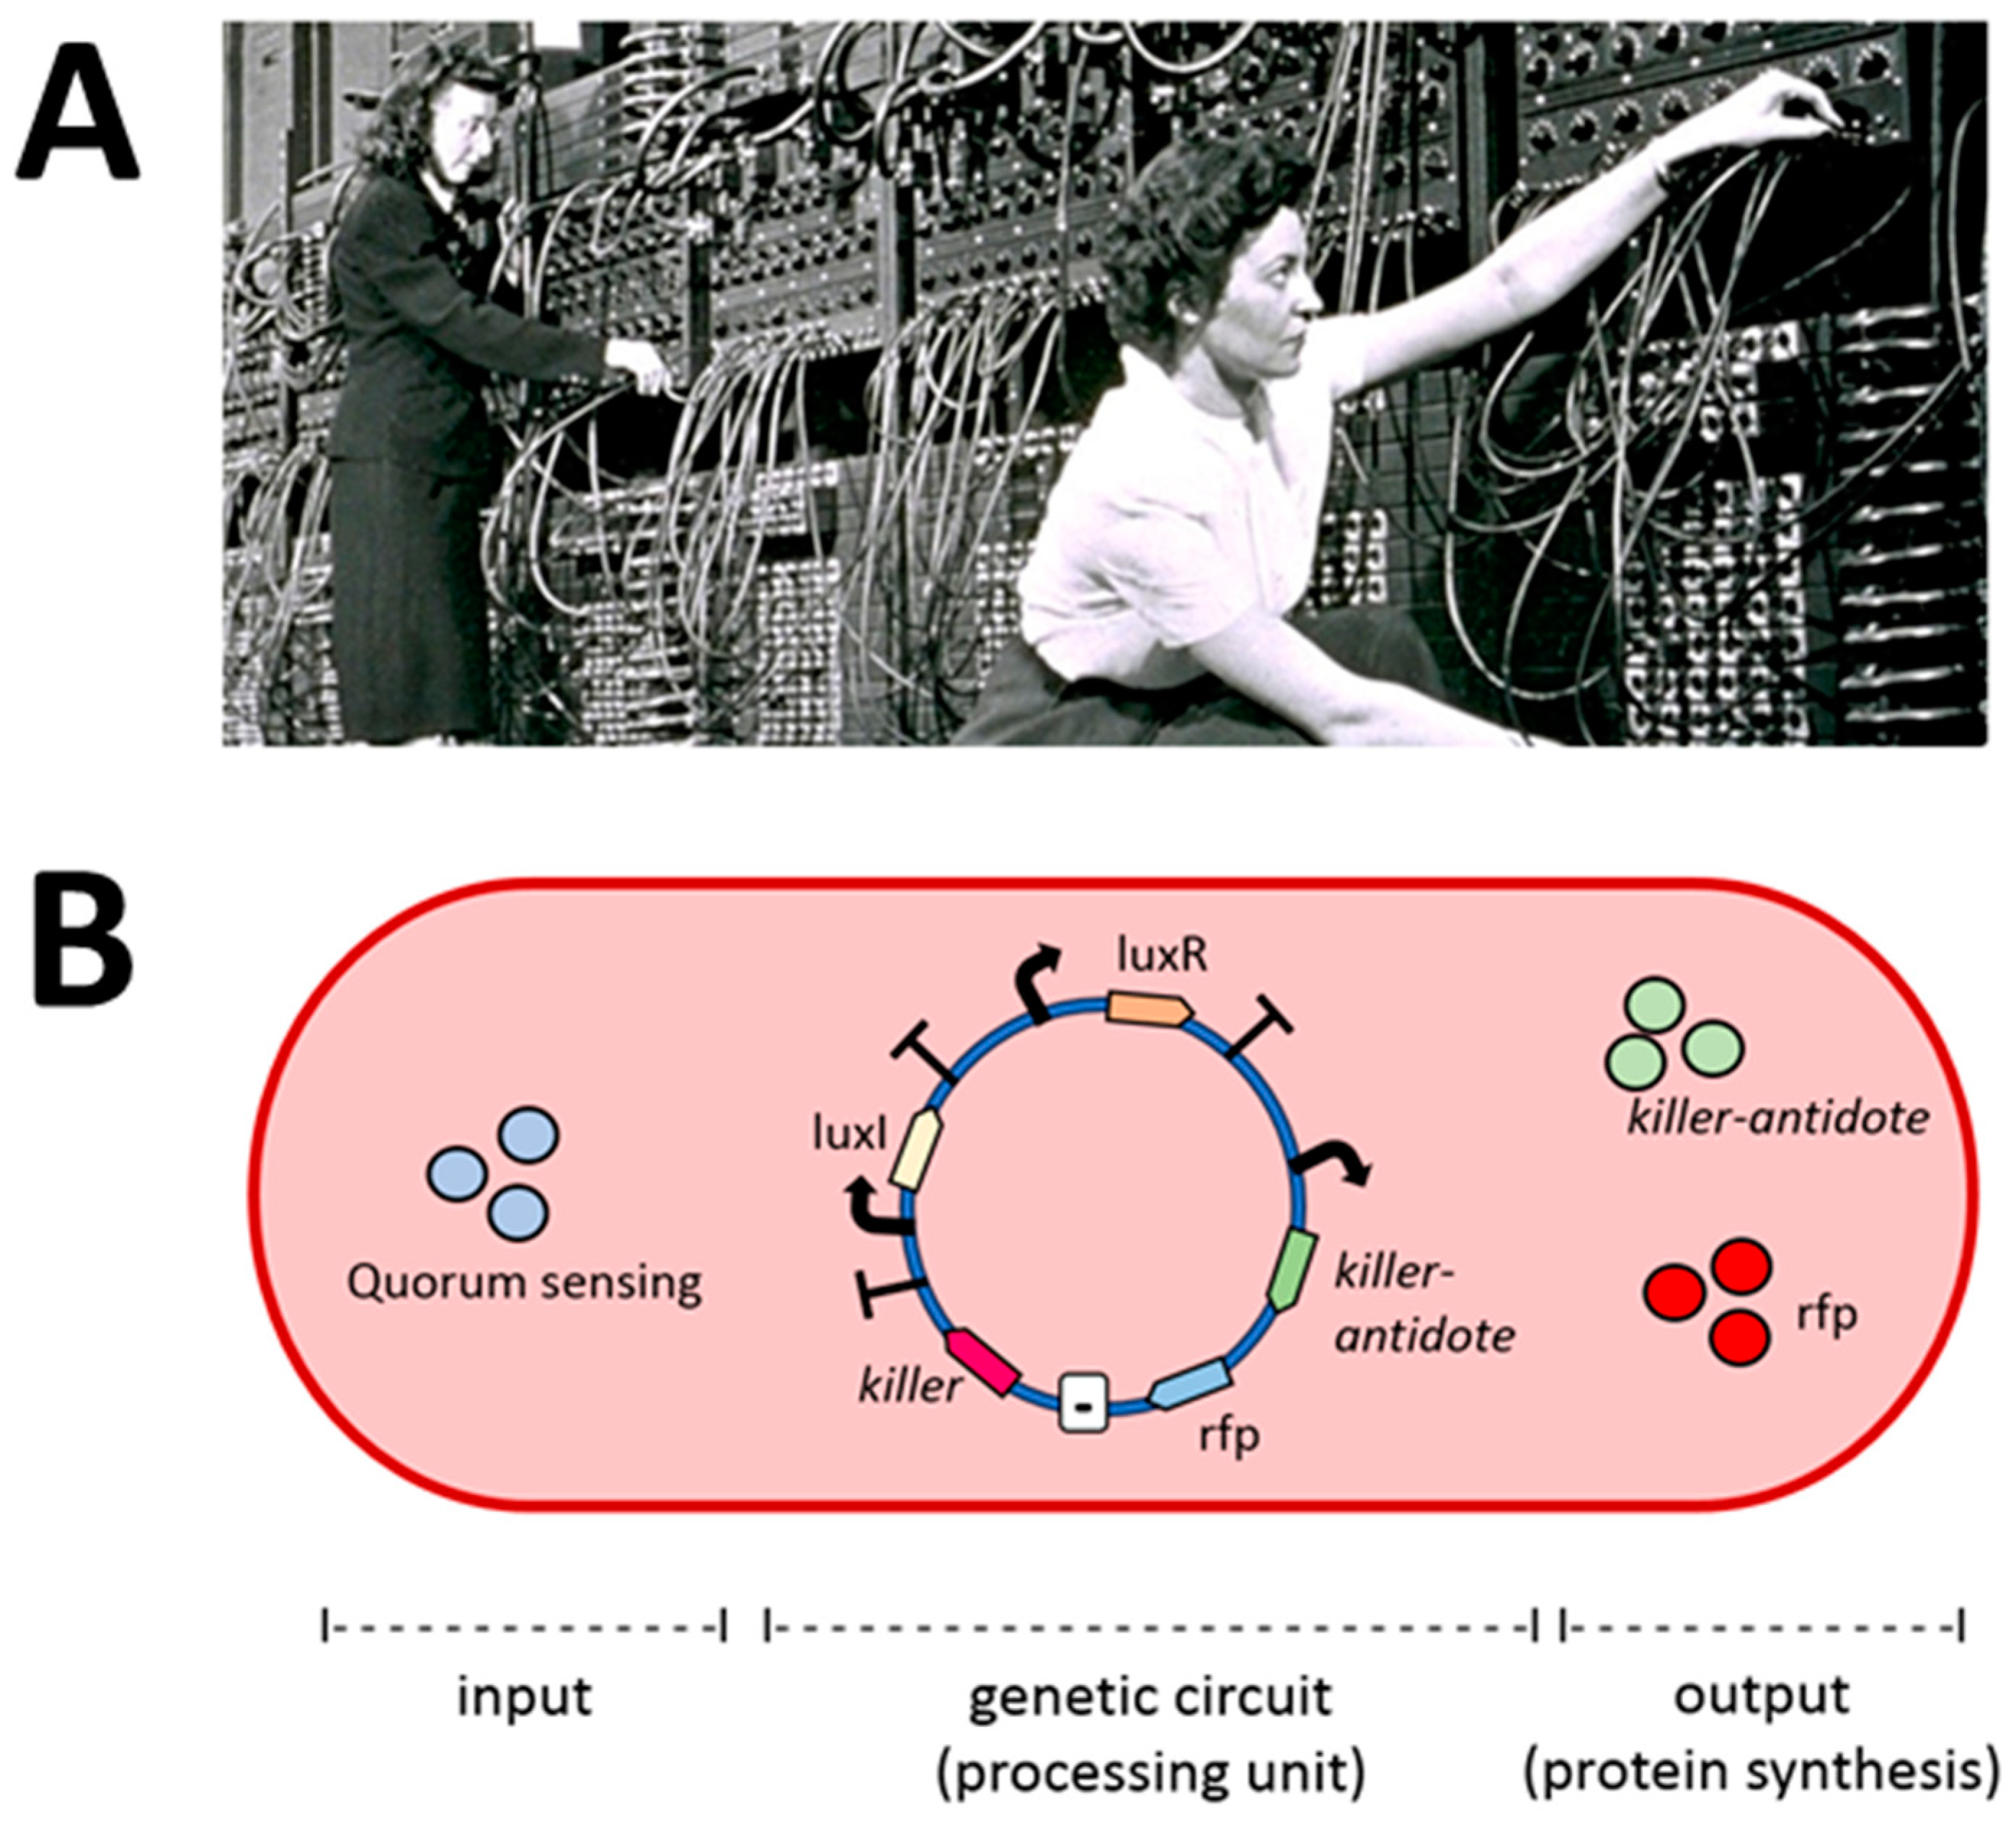
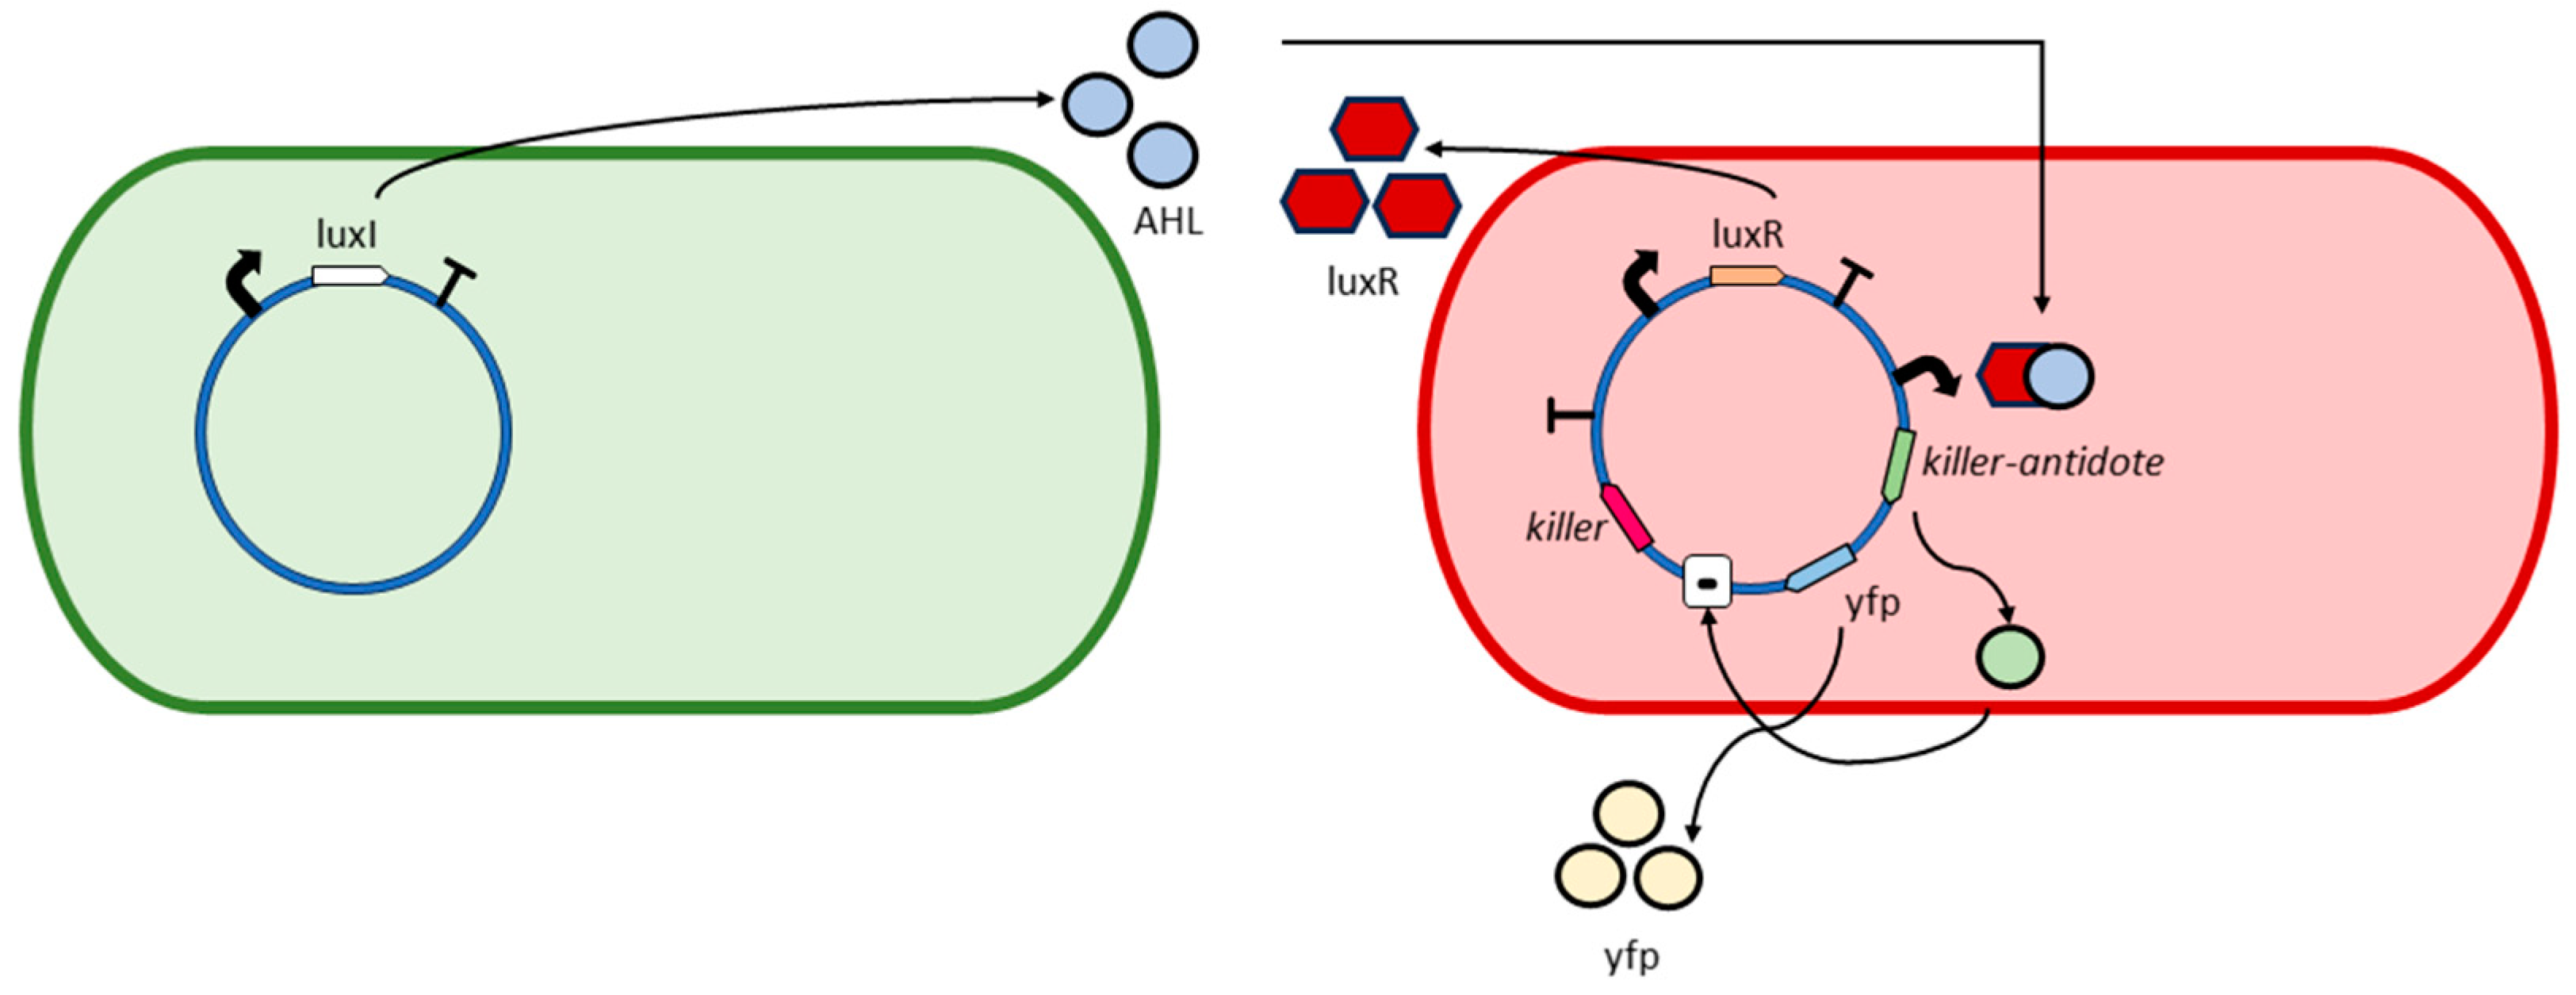
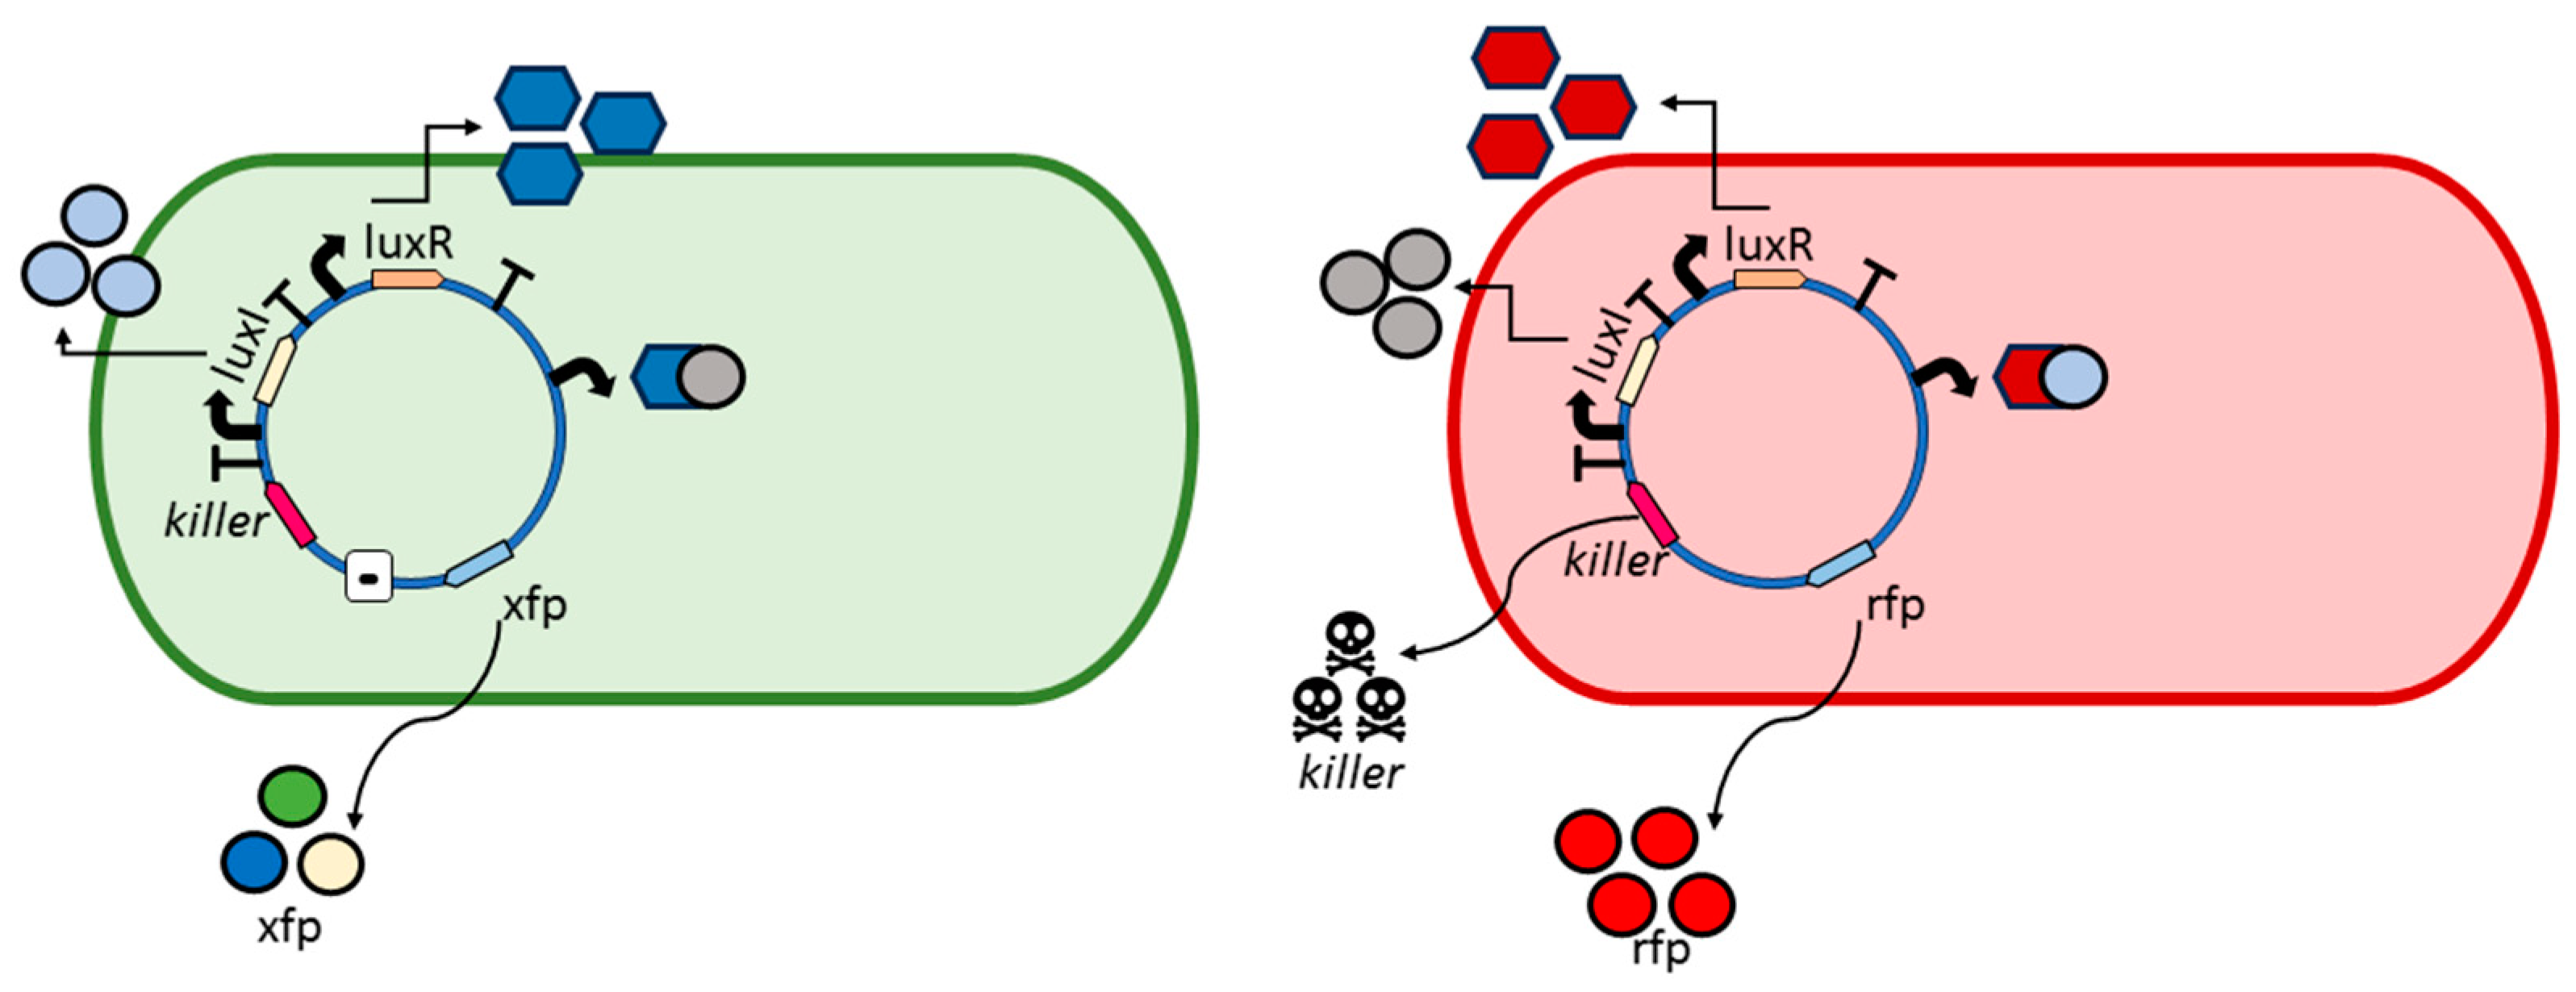
- Bacterial division. The algorithm assumes a bacterial colony growing according to an exponential or Malthusian growth model. This model does not take into account whether the culture is in a Petri dish, chemostat, or any other container. Each time a bacterium divides into two daughter bacteria, one bacterium retains the parental genes, while the other daughter bacterium undergoes mutations. For example, in the GADY experiment (Figure 2), the non-pathogenic daughter bacterium preserves the parental genes, while the pathogenic daughter bacterium undergoes mutations in its genes. It is also possible for both cells to undergo mutation. In the present version of the algorithm, this is an option to set since it affects the evolution of the bacterial colony.
- (iii)
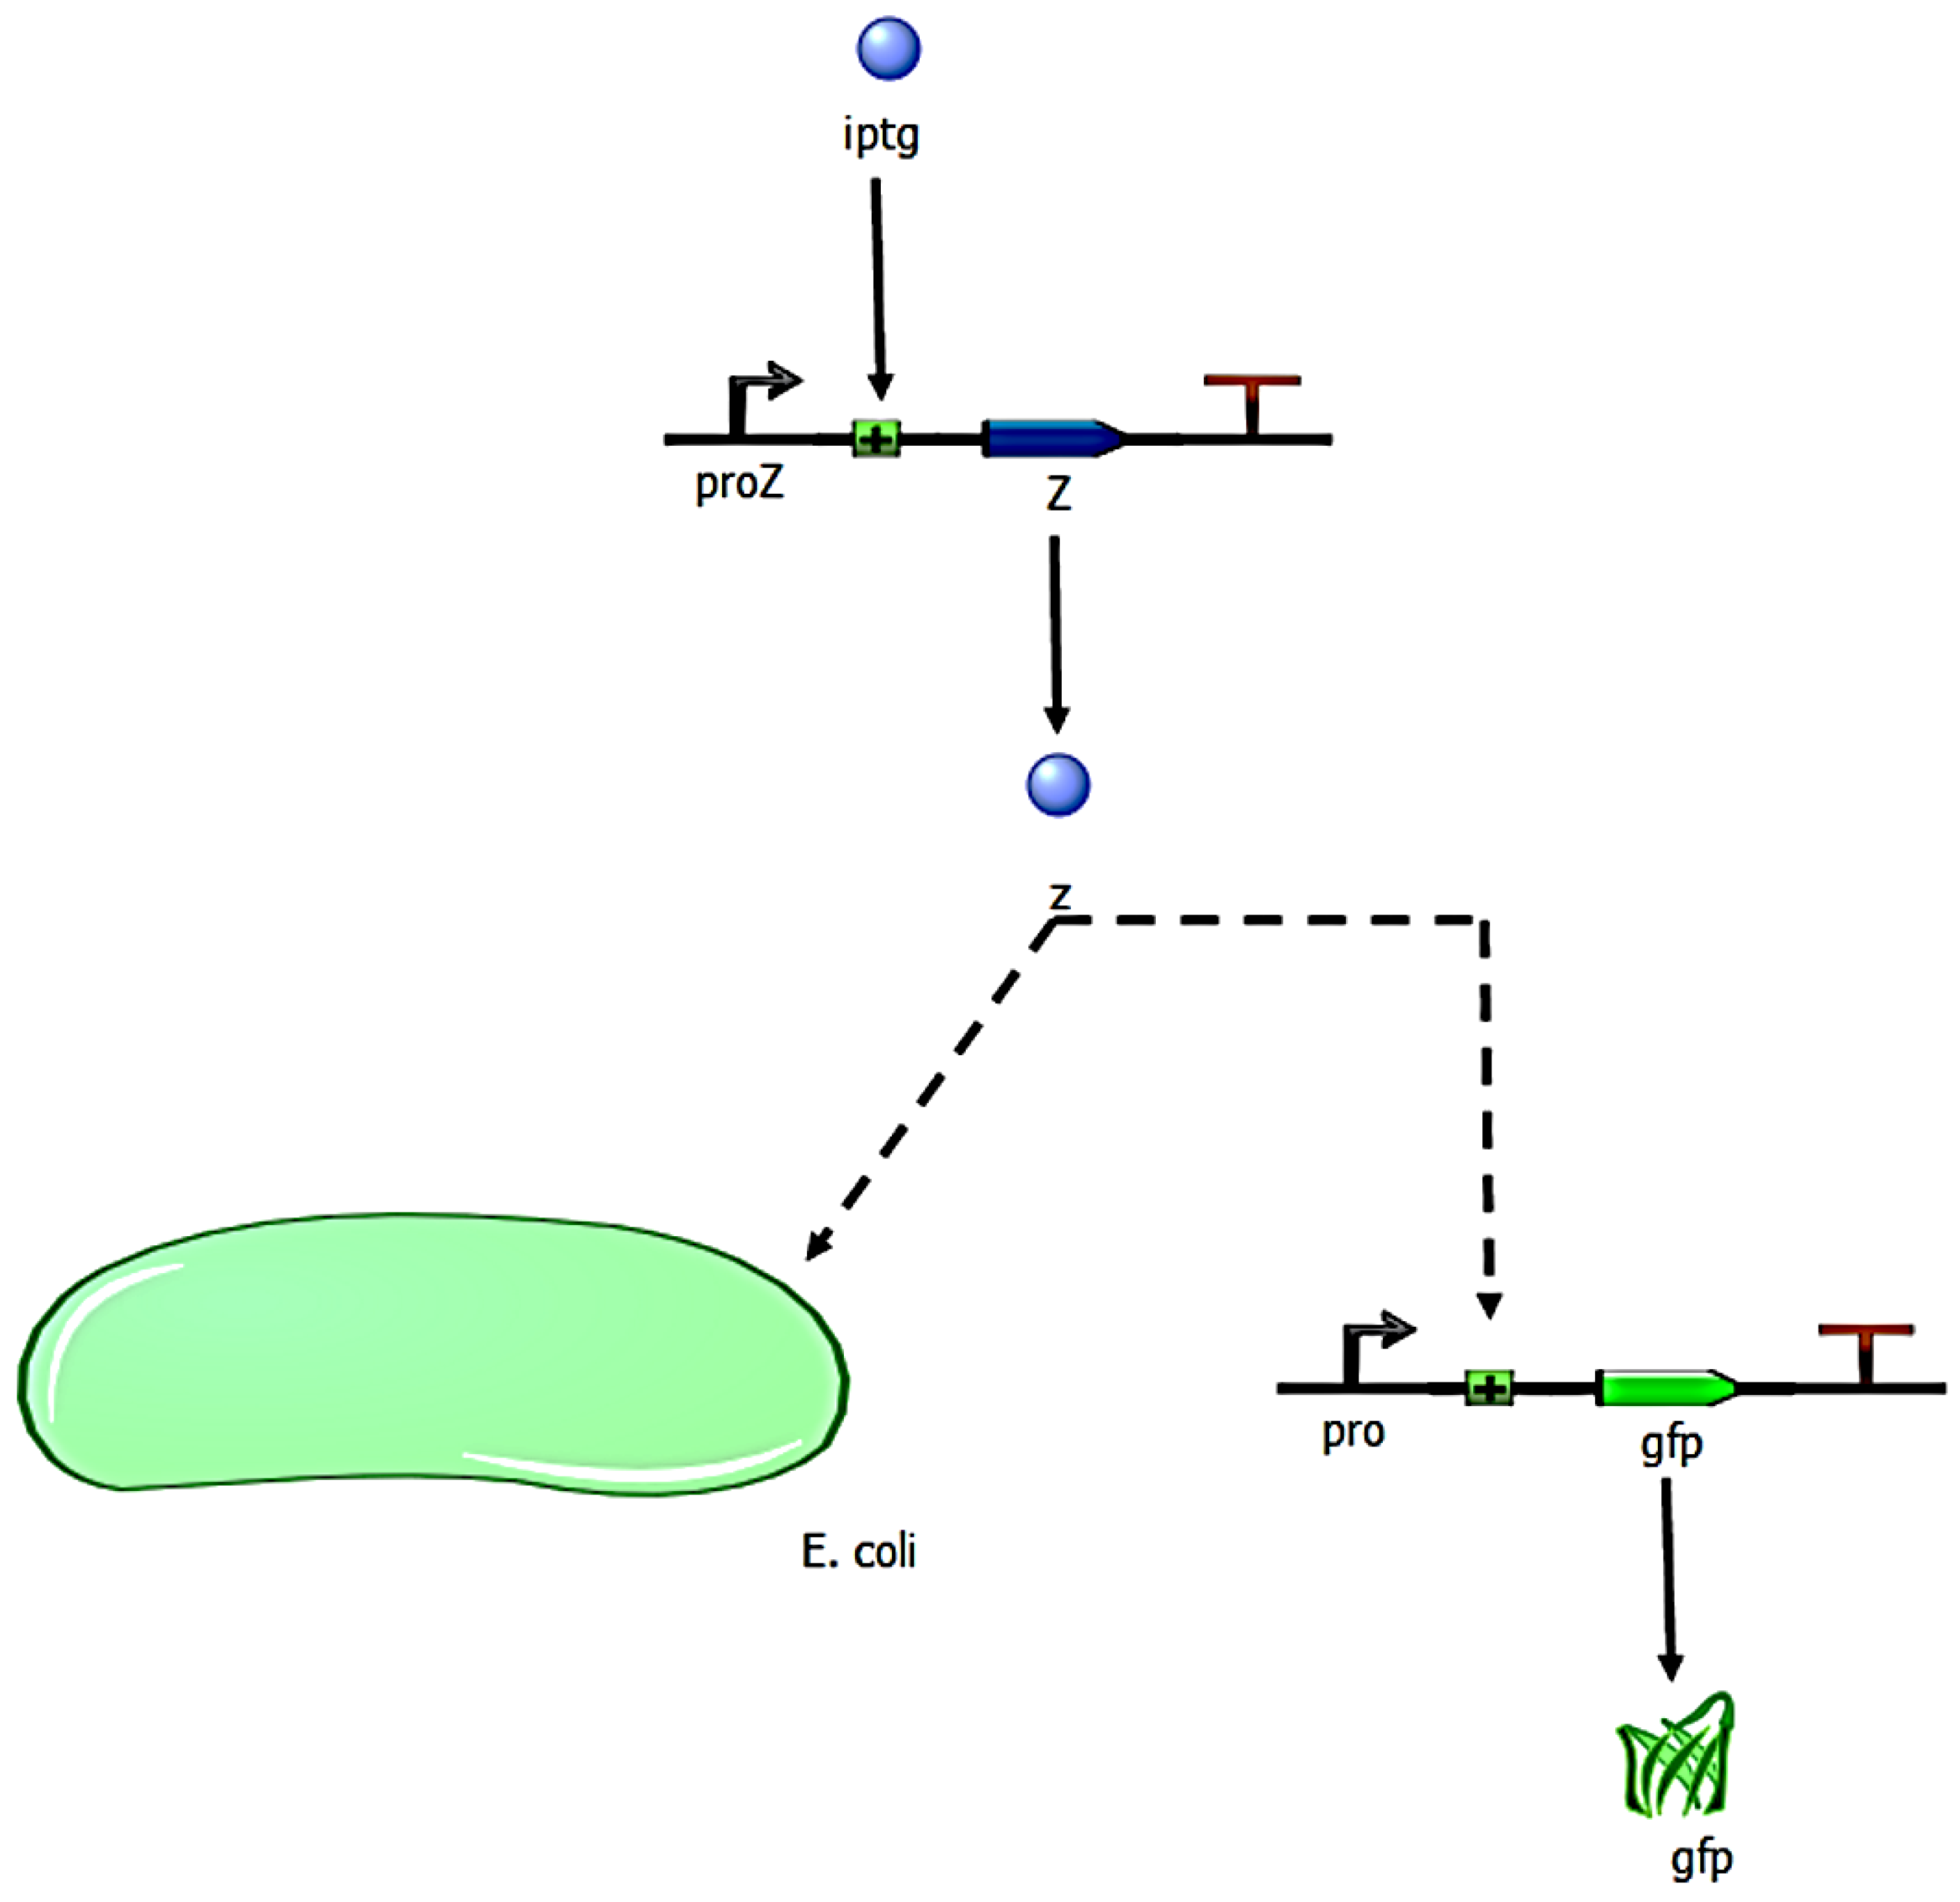
- Genetic similarity. Once a bacterium divides into two daughter bacteria, the concentration of a hypothetical operon activator (protein with positive control over gene expression) is calculated. An operon is defined in our simulation experiments as a functional unit of DNA containing one or more genes under the control of a promoter [23]. The algorithm calculates the Hamming distance between the gene sequence inherited by the daughter bacterium and the target sequence. Once the Hamming distance is calculated, its value is translated to a given concentration of iptg (isopropyl β-D-1-thiogalactopyranoside), i.e., an allolactose emulator that activates the lactose operon (operon involved in the metabolism of lactose in E. coli and many other bacteria).The algorithm considers iptg molecules as an activator of a hypothetical Z operon (Figure 4), referring to this operon as the ‘optimization operon’.
- (iv)
- Fitness. The goodness of the ‘solution’, i.e., the genetic sequence in the daughter bacterium, is calculated by means of the optimizing operon Z. This operon expresses a Z gene whose transcription product is a Z protein. The concentration z of product Z, i.e., the fitness value, is expressed according to the Hill function:whose parameters v, k, and n are set empirically depending on the optimization problem. Thus, in our case, the optimization problem is to find the target sequence. Applying this function, we normalize the value of fitness z between 0 and 1.In the above z function (2), the concentration of iptg was calculated as the difference between L, i.e., the length of the target gene sequence, and the Hamming distance H between the target and the genetic sequence in the daughter bacterium (sequence inserted in the plasmid):[iptg] = L − H
- (v)
- Reporter protein. As the evolutionary algorithm governs the evolution of the synthetic bacteria, the bacteria report their fitness. That is, the fitness z of each bacterium is observed by the researcher thanks to the transcription of fluorescent proteins, e.g., gfp, yfp, rfp. The higher the fitness, the better the ‘solution’ and consequently the more fluorescence the bacterium will emit. That is, Z plays the role of activator for a reporter operon (Figure 4) that expresses a fluorescent protein, e.g., gfp.
- (vi)
- Malthusian parameter update. The Darwinian selection of the bacteria is simulated as follows. Z not only influences the fluorescence emitted by a bacterium but also affects the Malthusian parameter or bacterial growth rate (r), according to the following expression:where r0 is the growth rate of bacteria at t = 0, and , are two parameters for adjusting the r values in simulation experiments. Indeed, the higher the value of r, the larger the term in the exponential Equation (1). As time t goes on, the number of bacteria y(t) with optimum solutions increase, which is detectable through the screening of those bacteria emitting fluorescence. For instance, in the GADY model, the optimum solution is the target sequence representing the genetic circuit of the plasmid that induces cell suicide of the pathogenic bacteria.
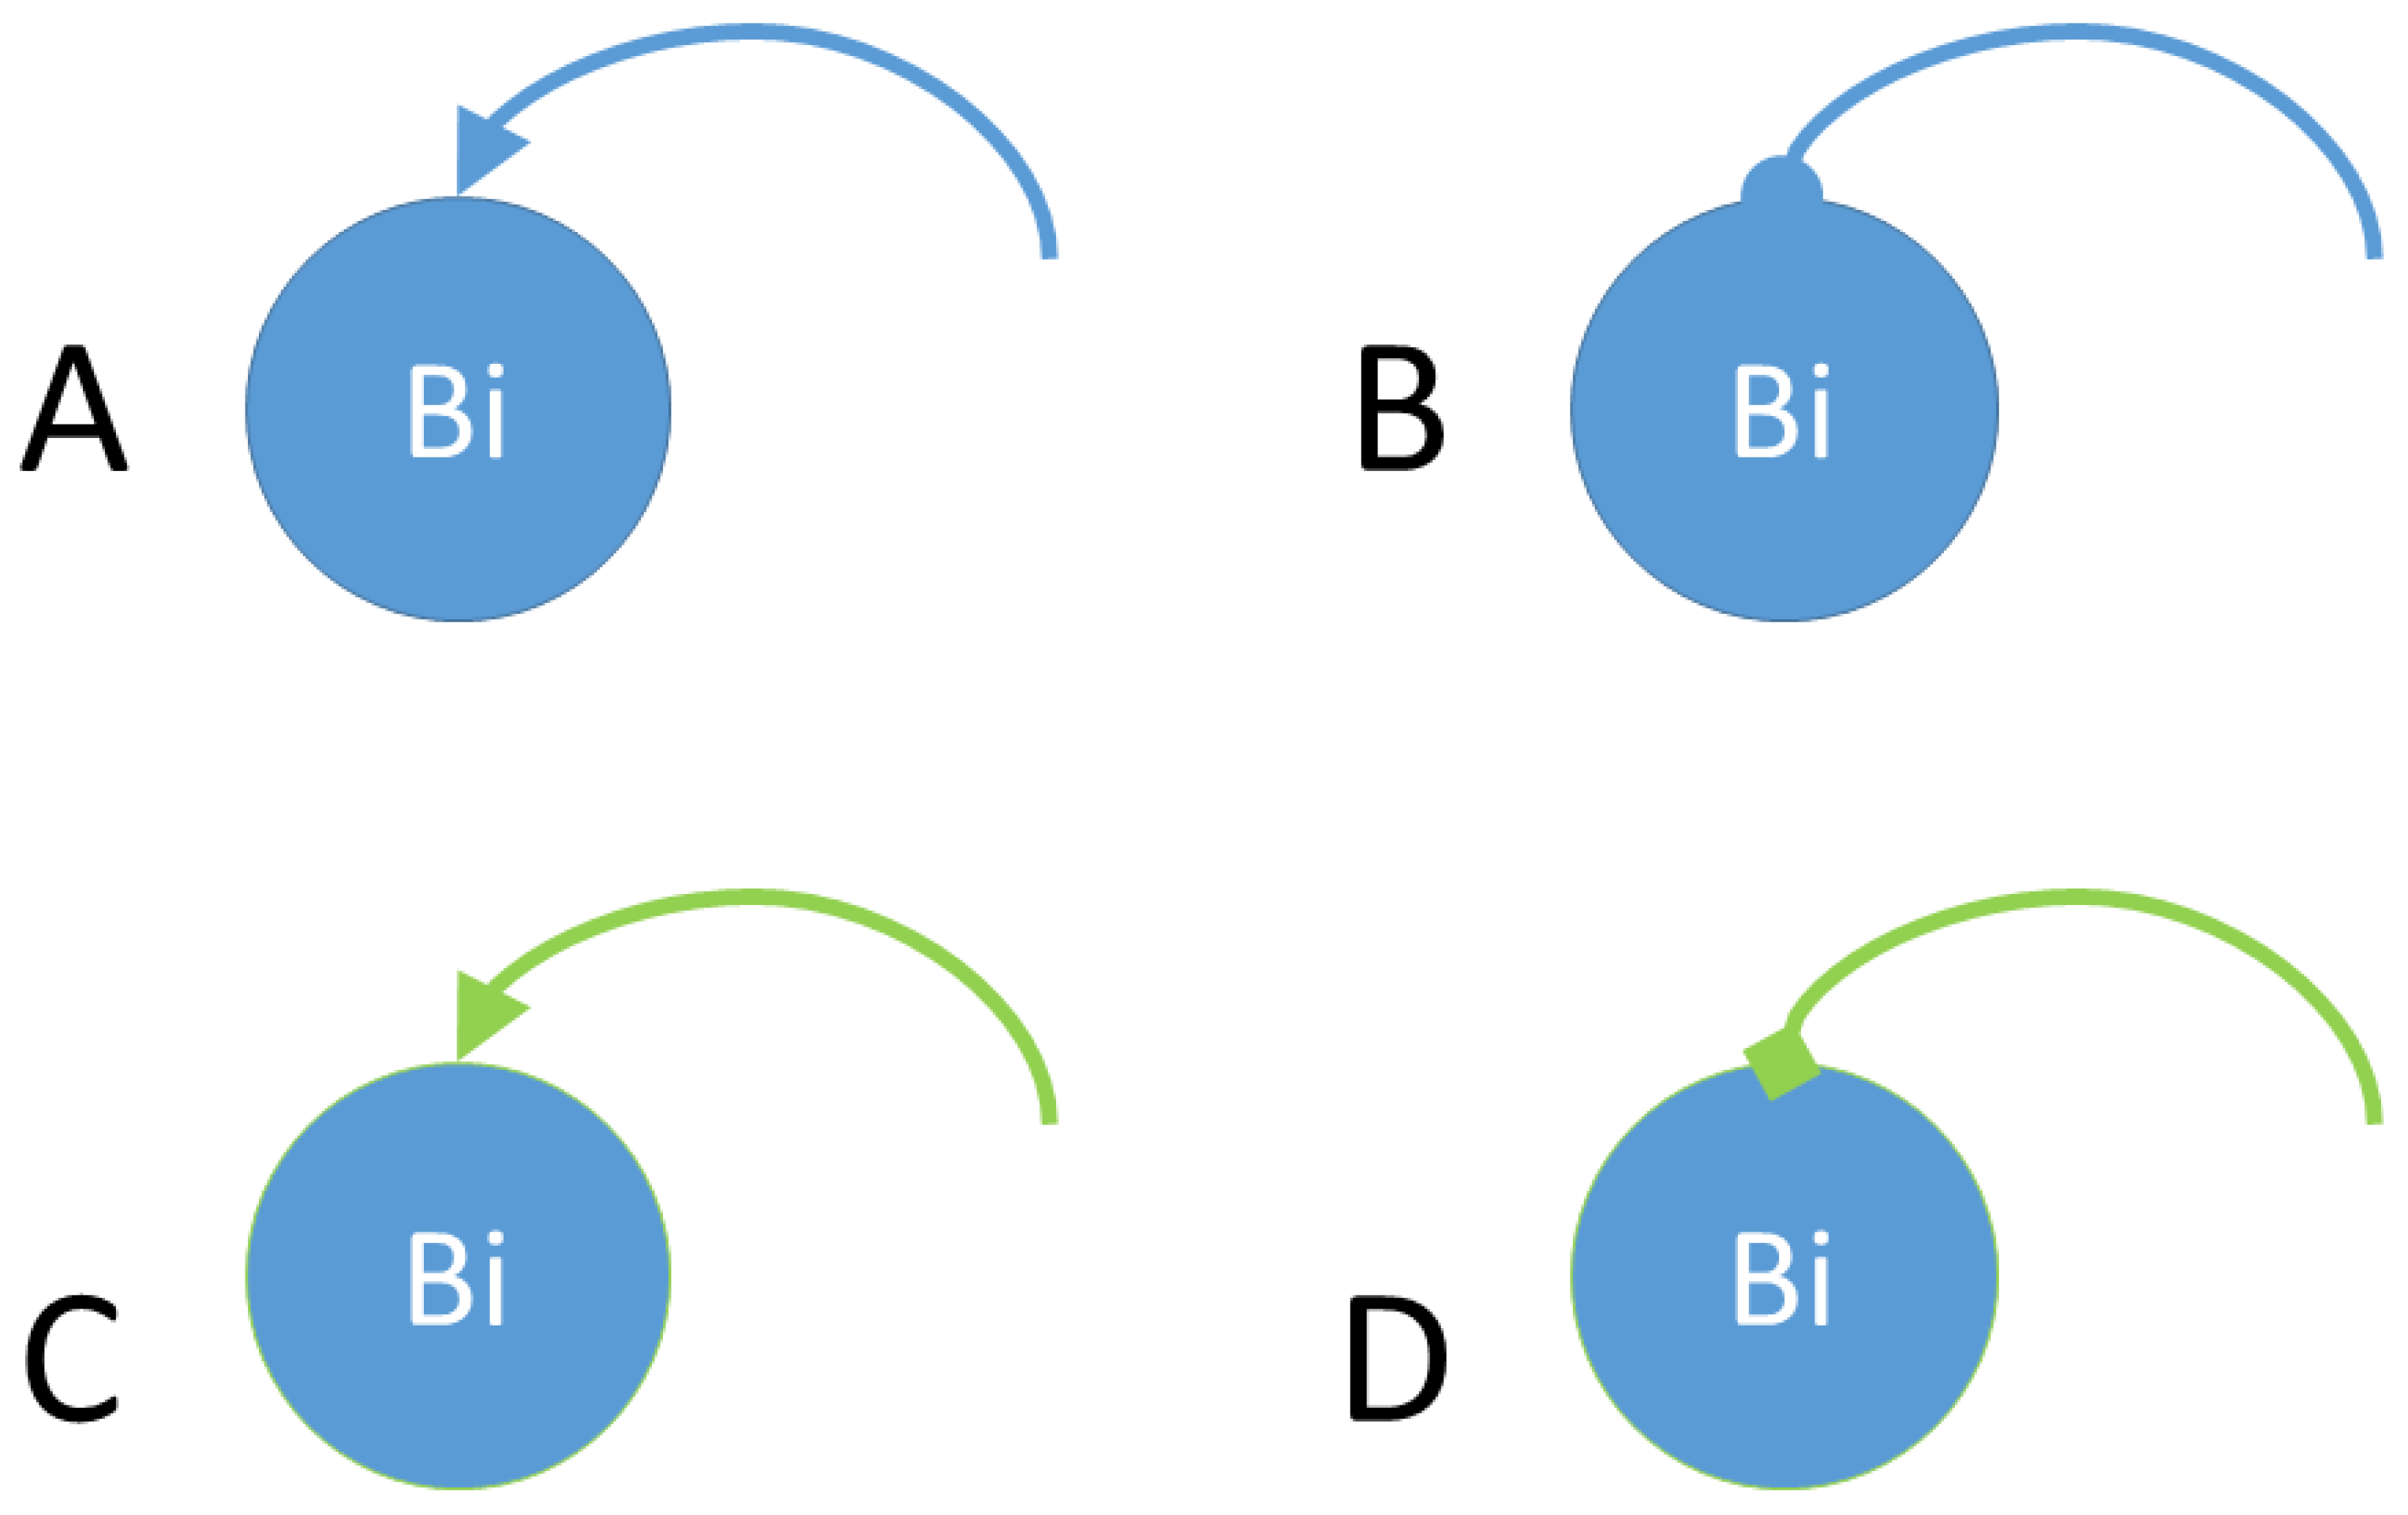
2.5. Social Interactions Algorithm between Bacterial Agents
3. Modeling and Simulation of Bacterial Consortia
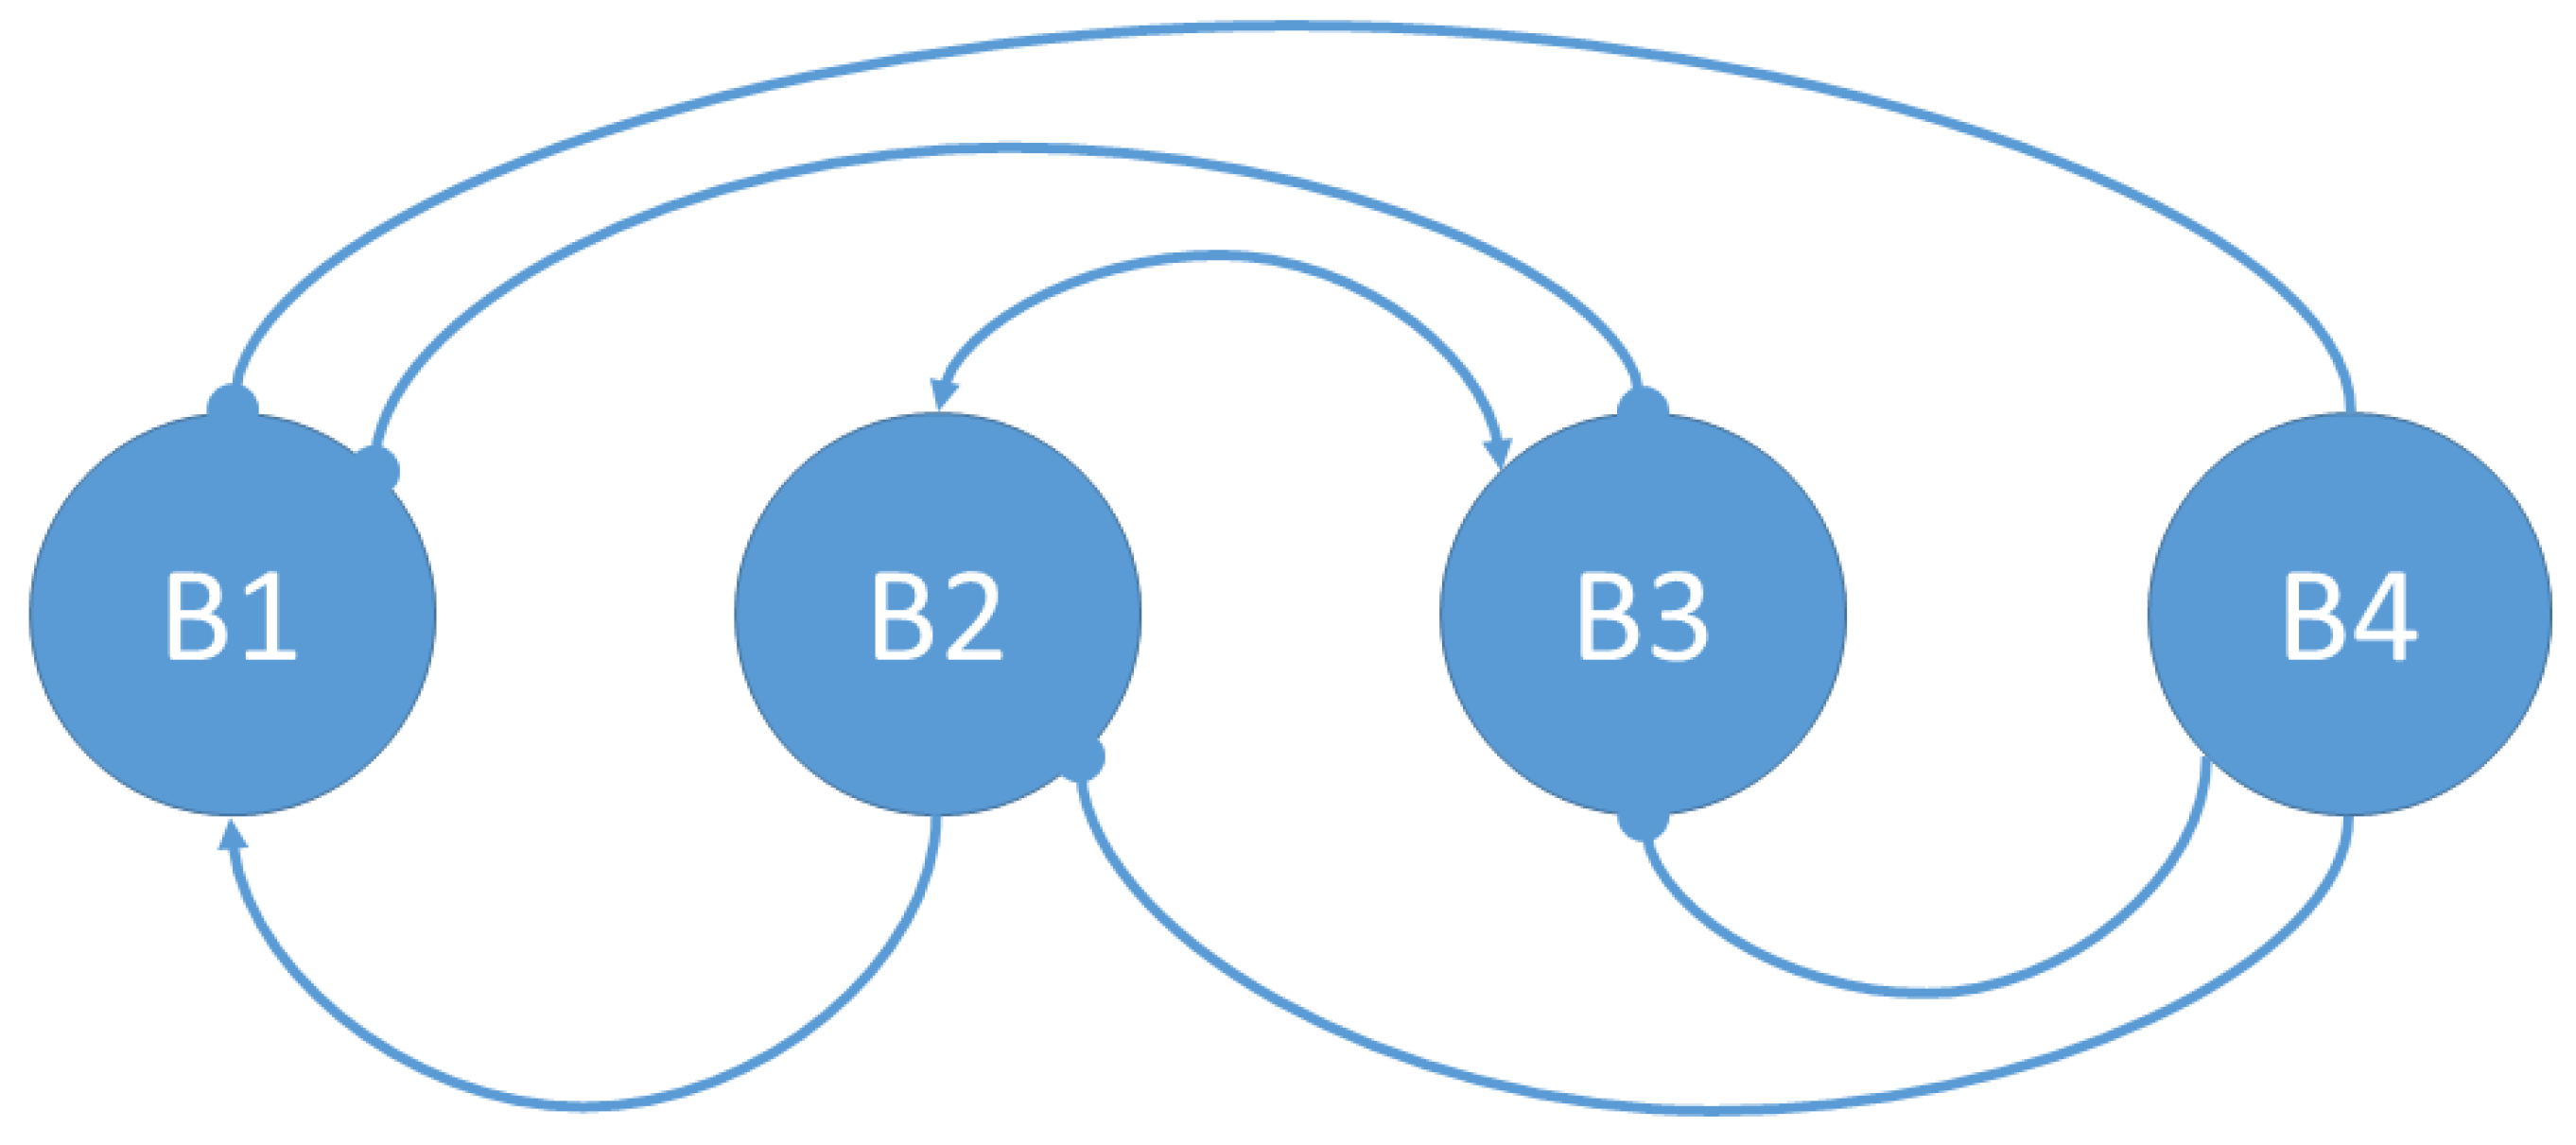
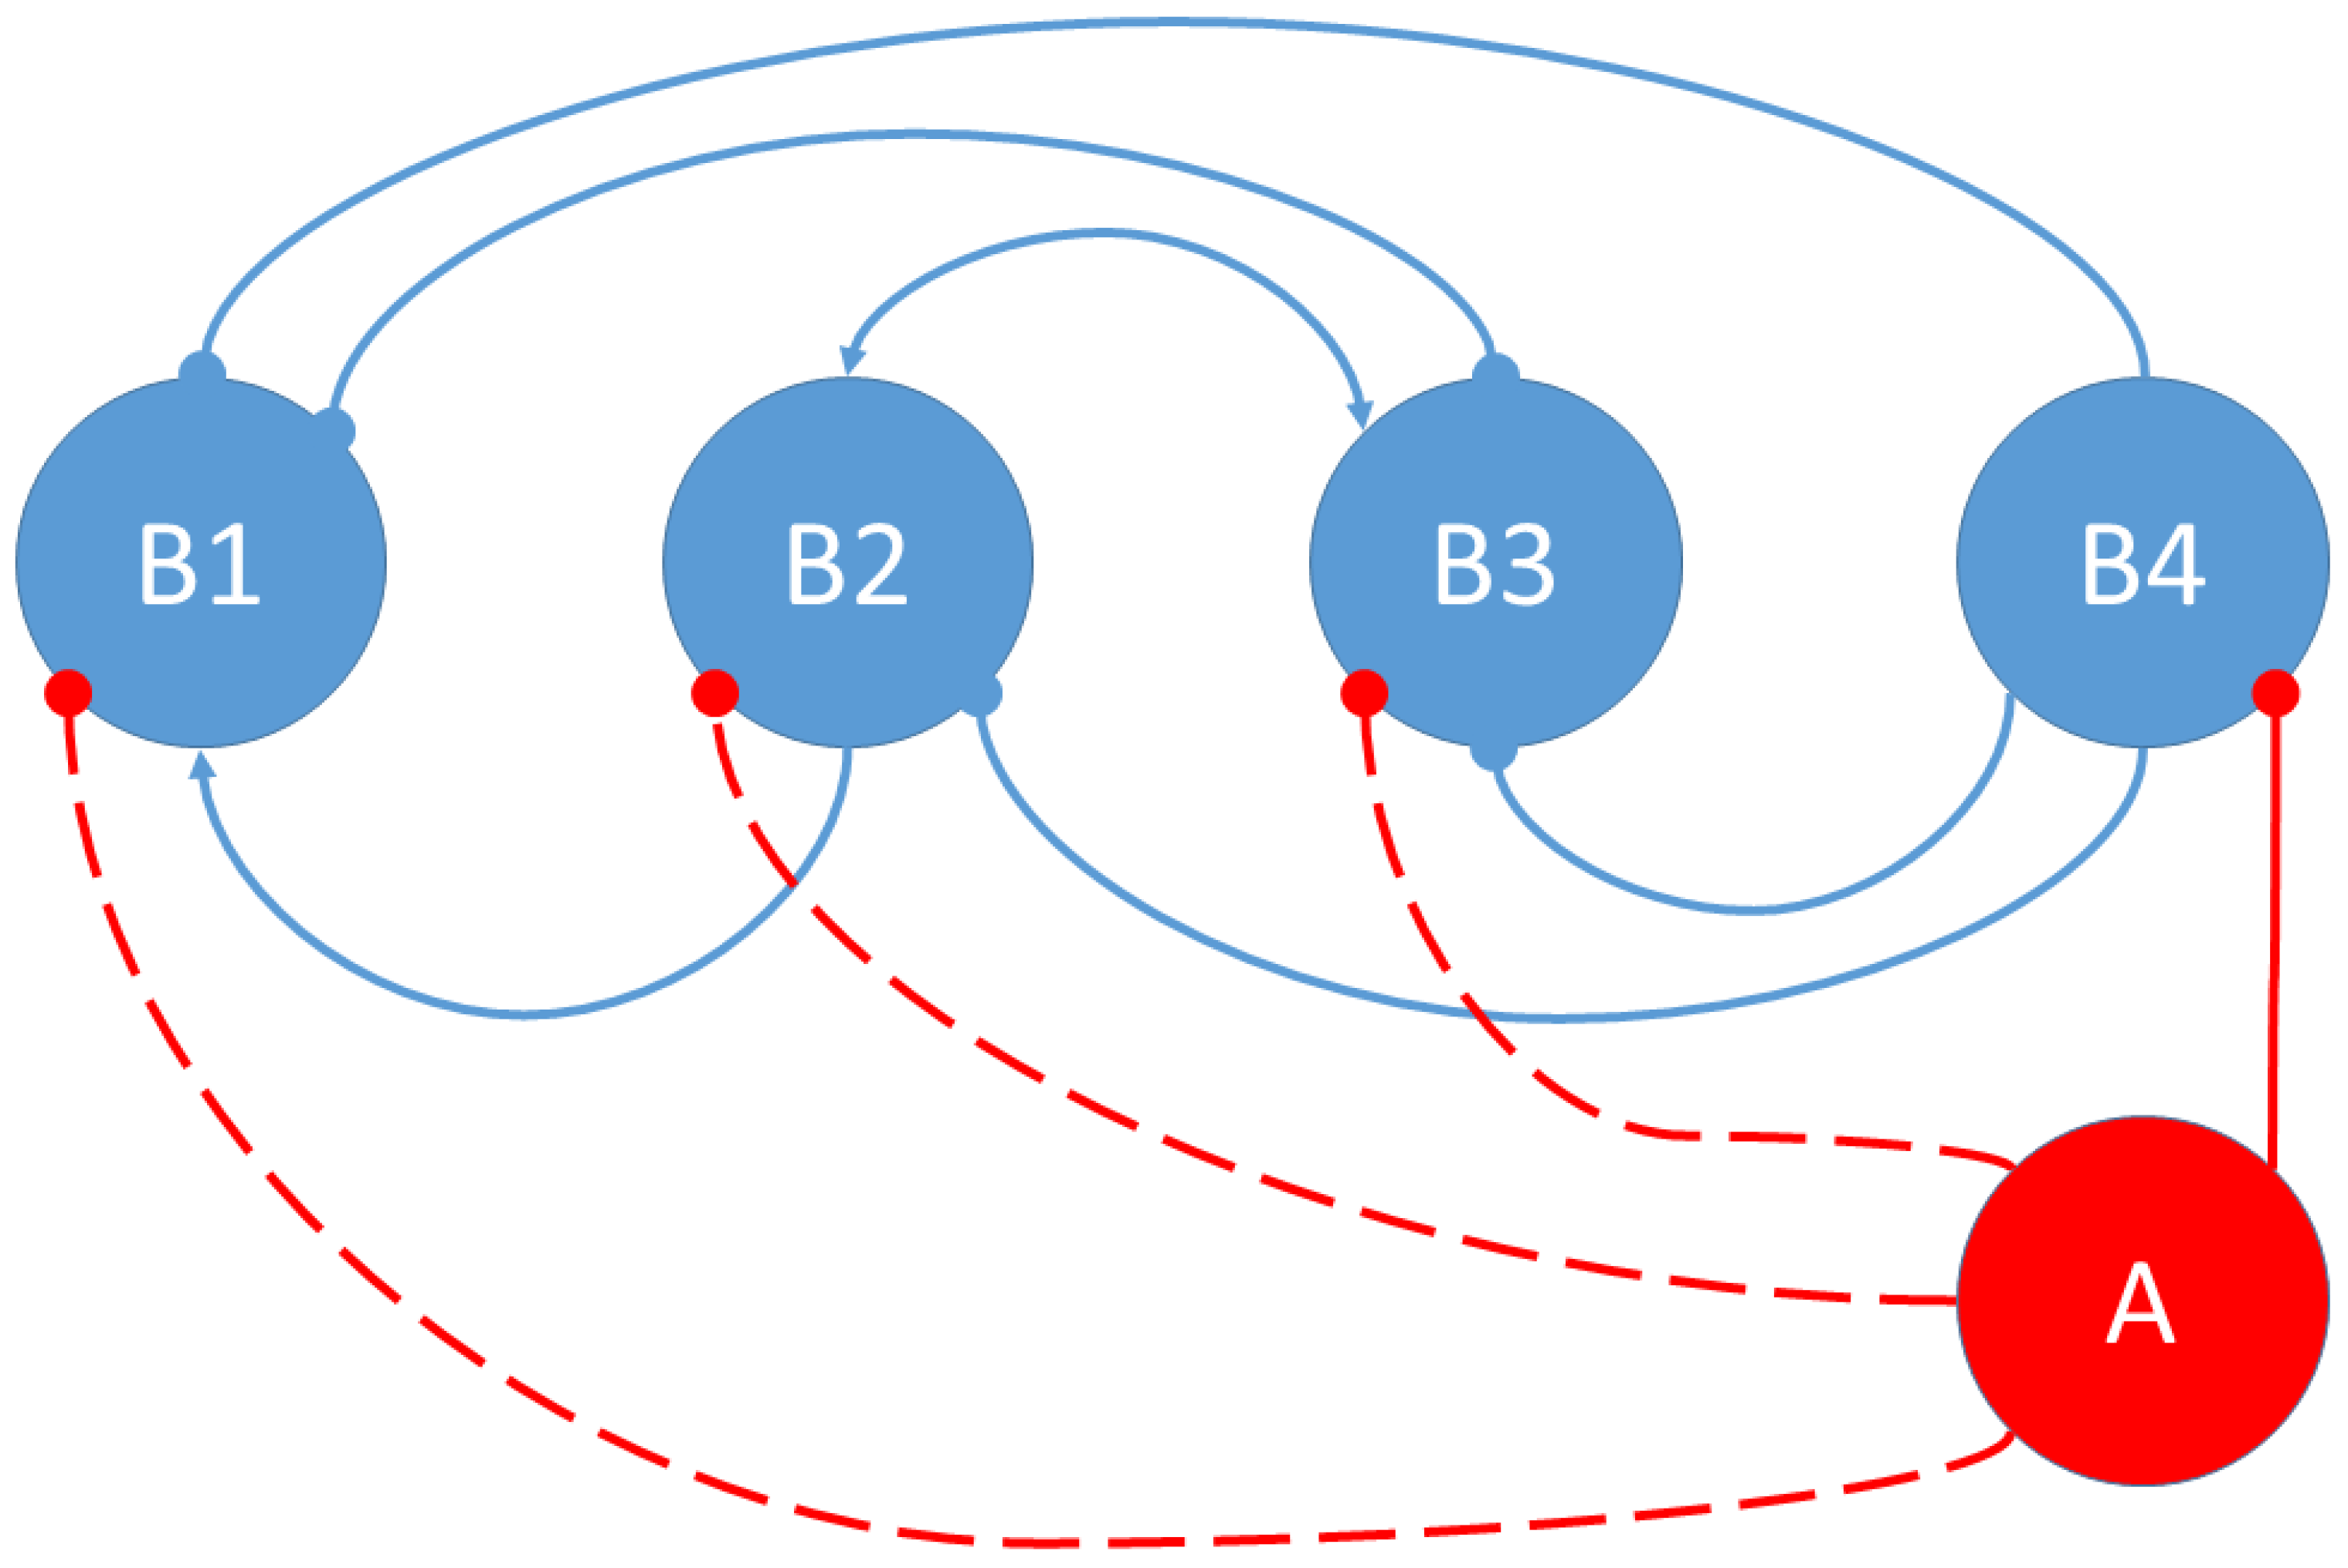
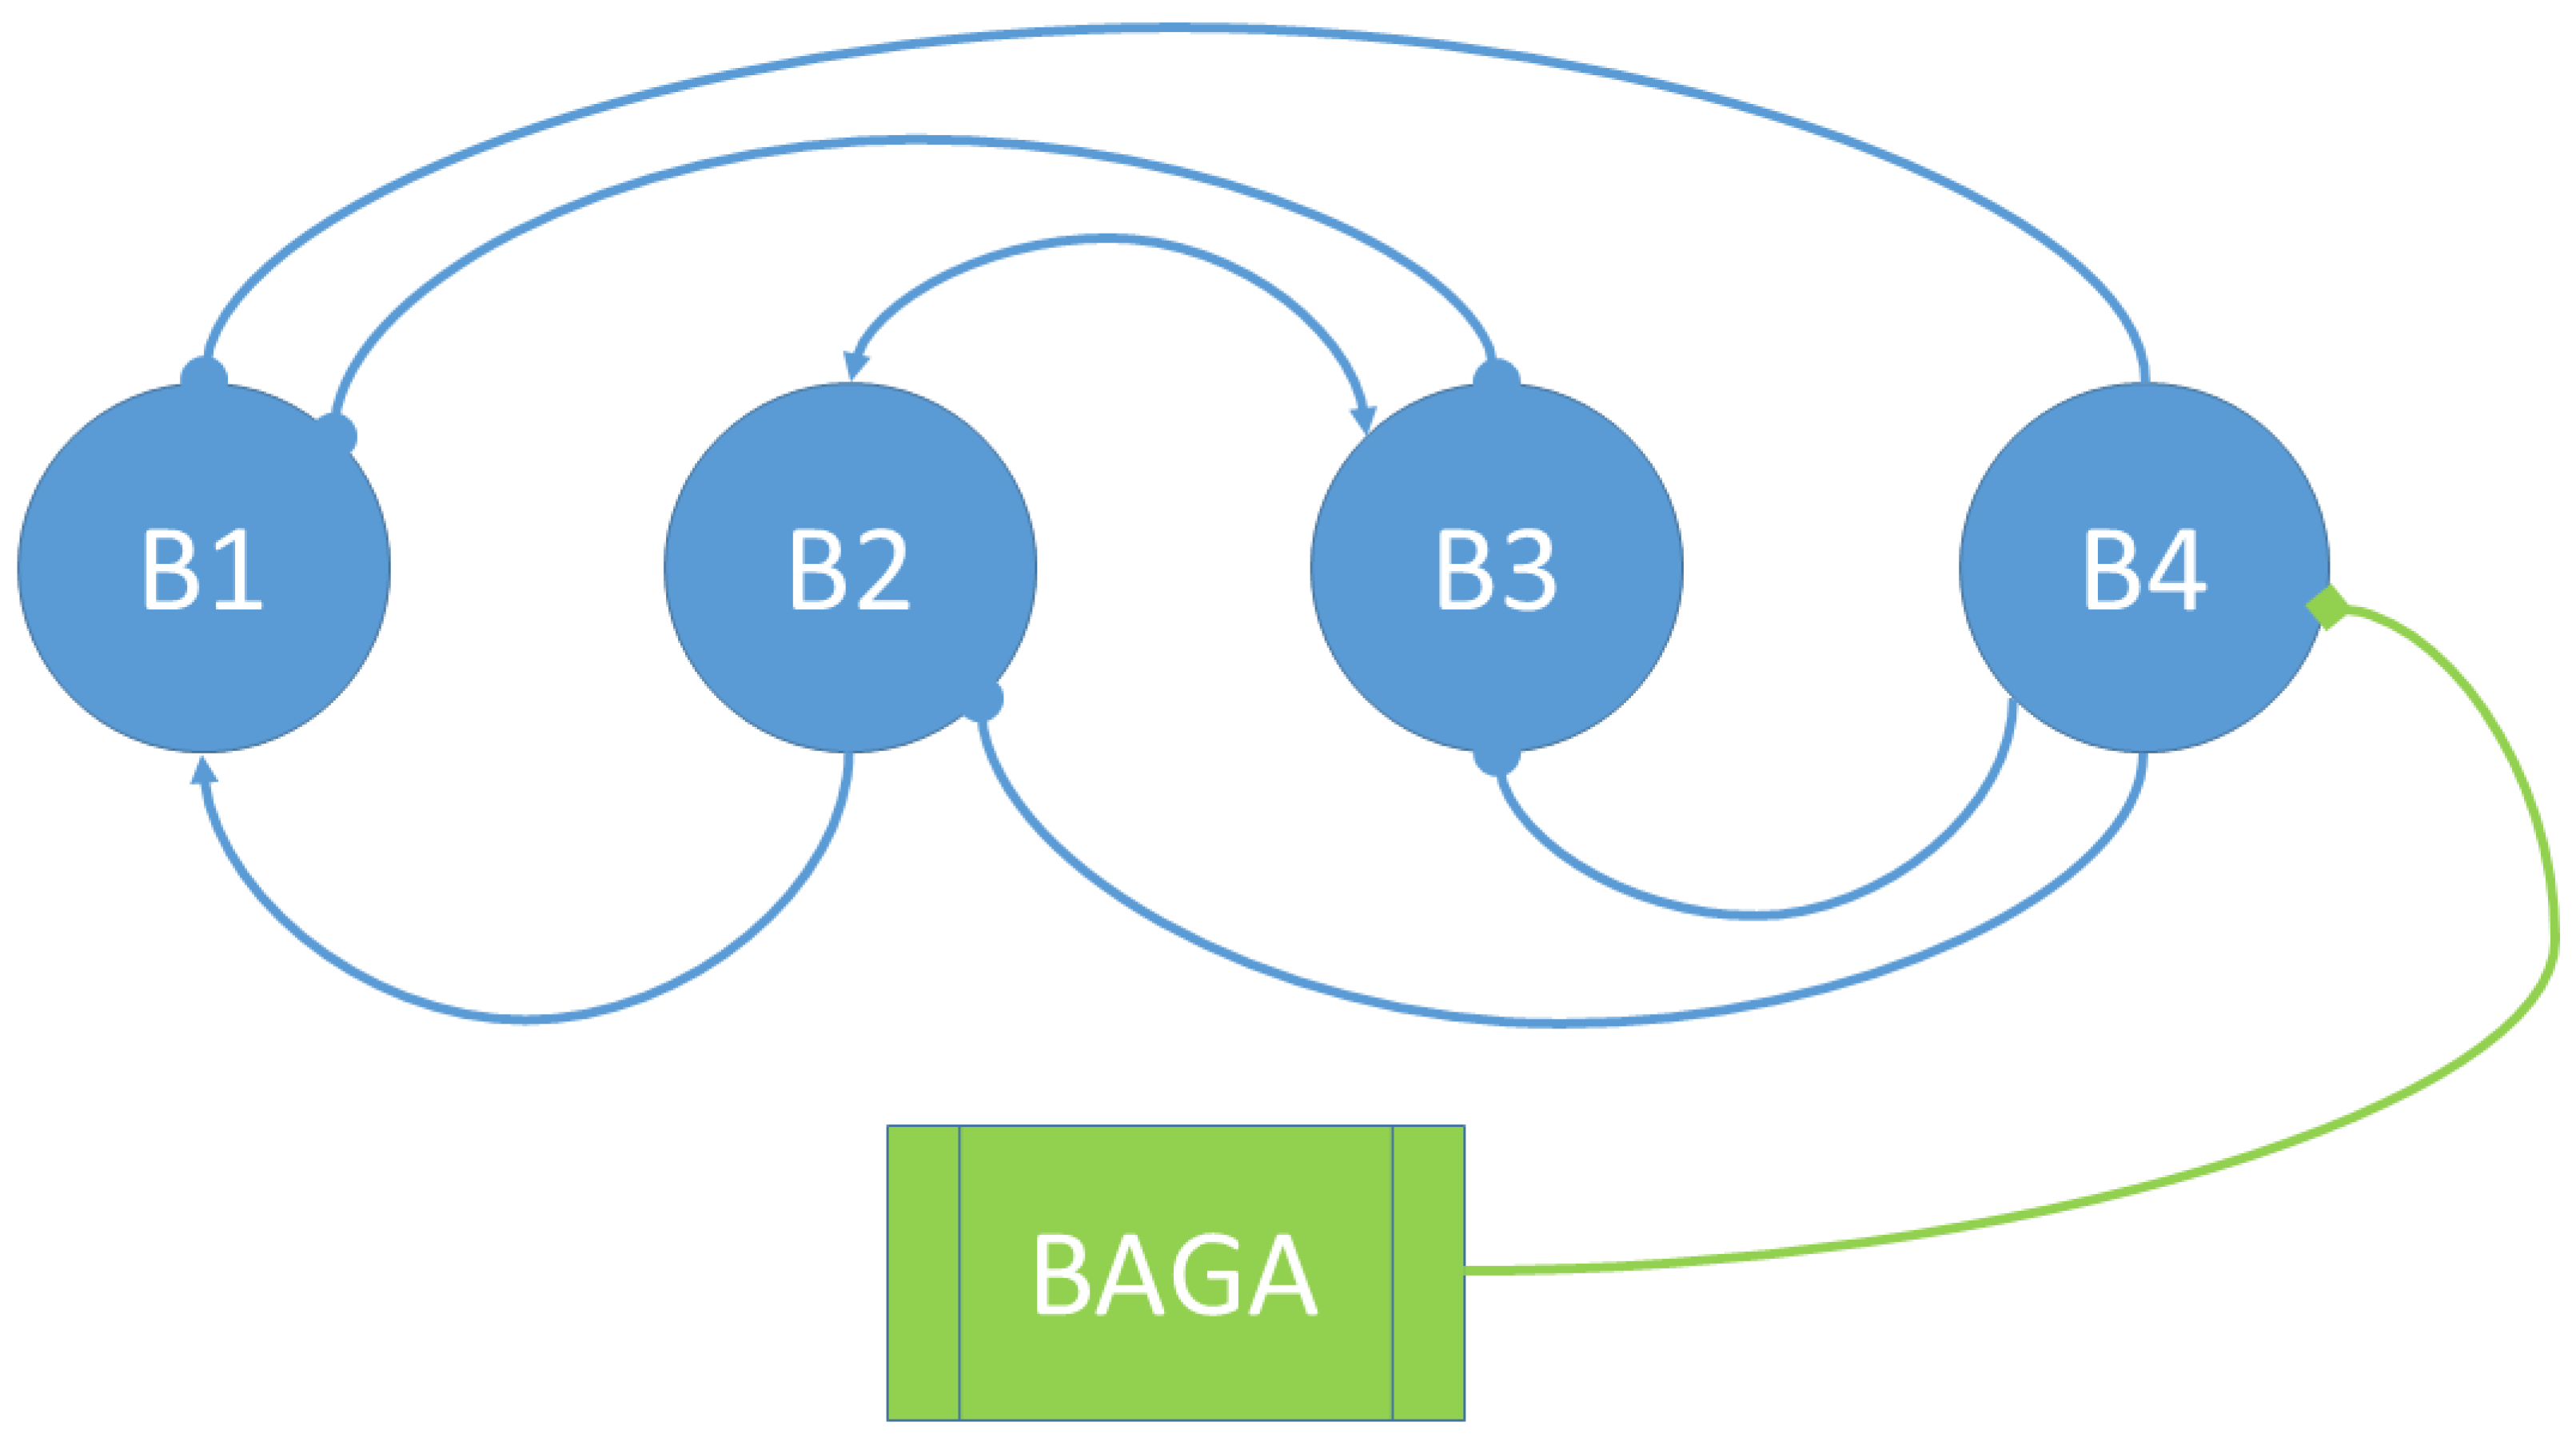
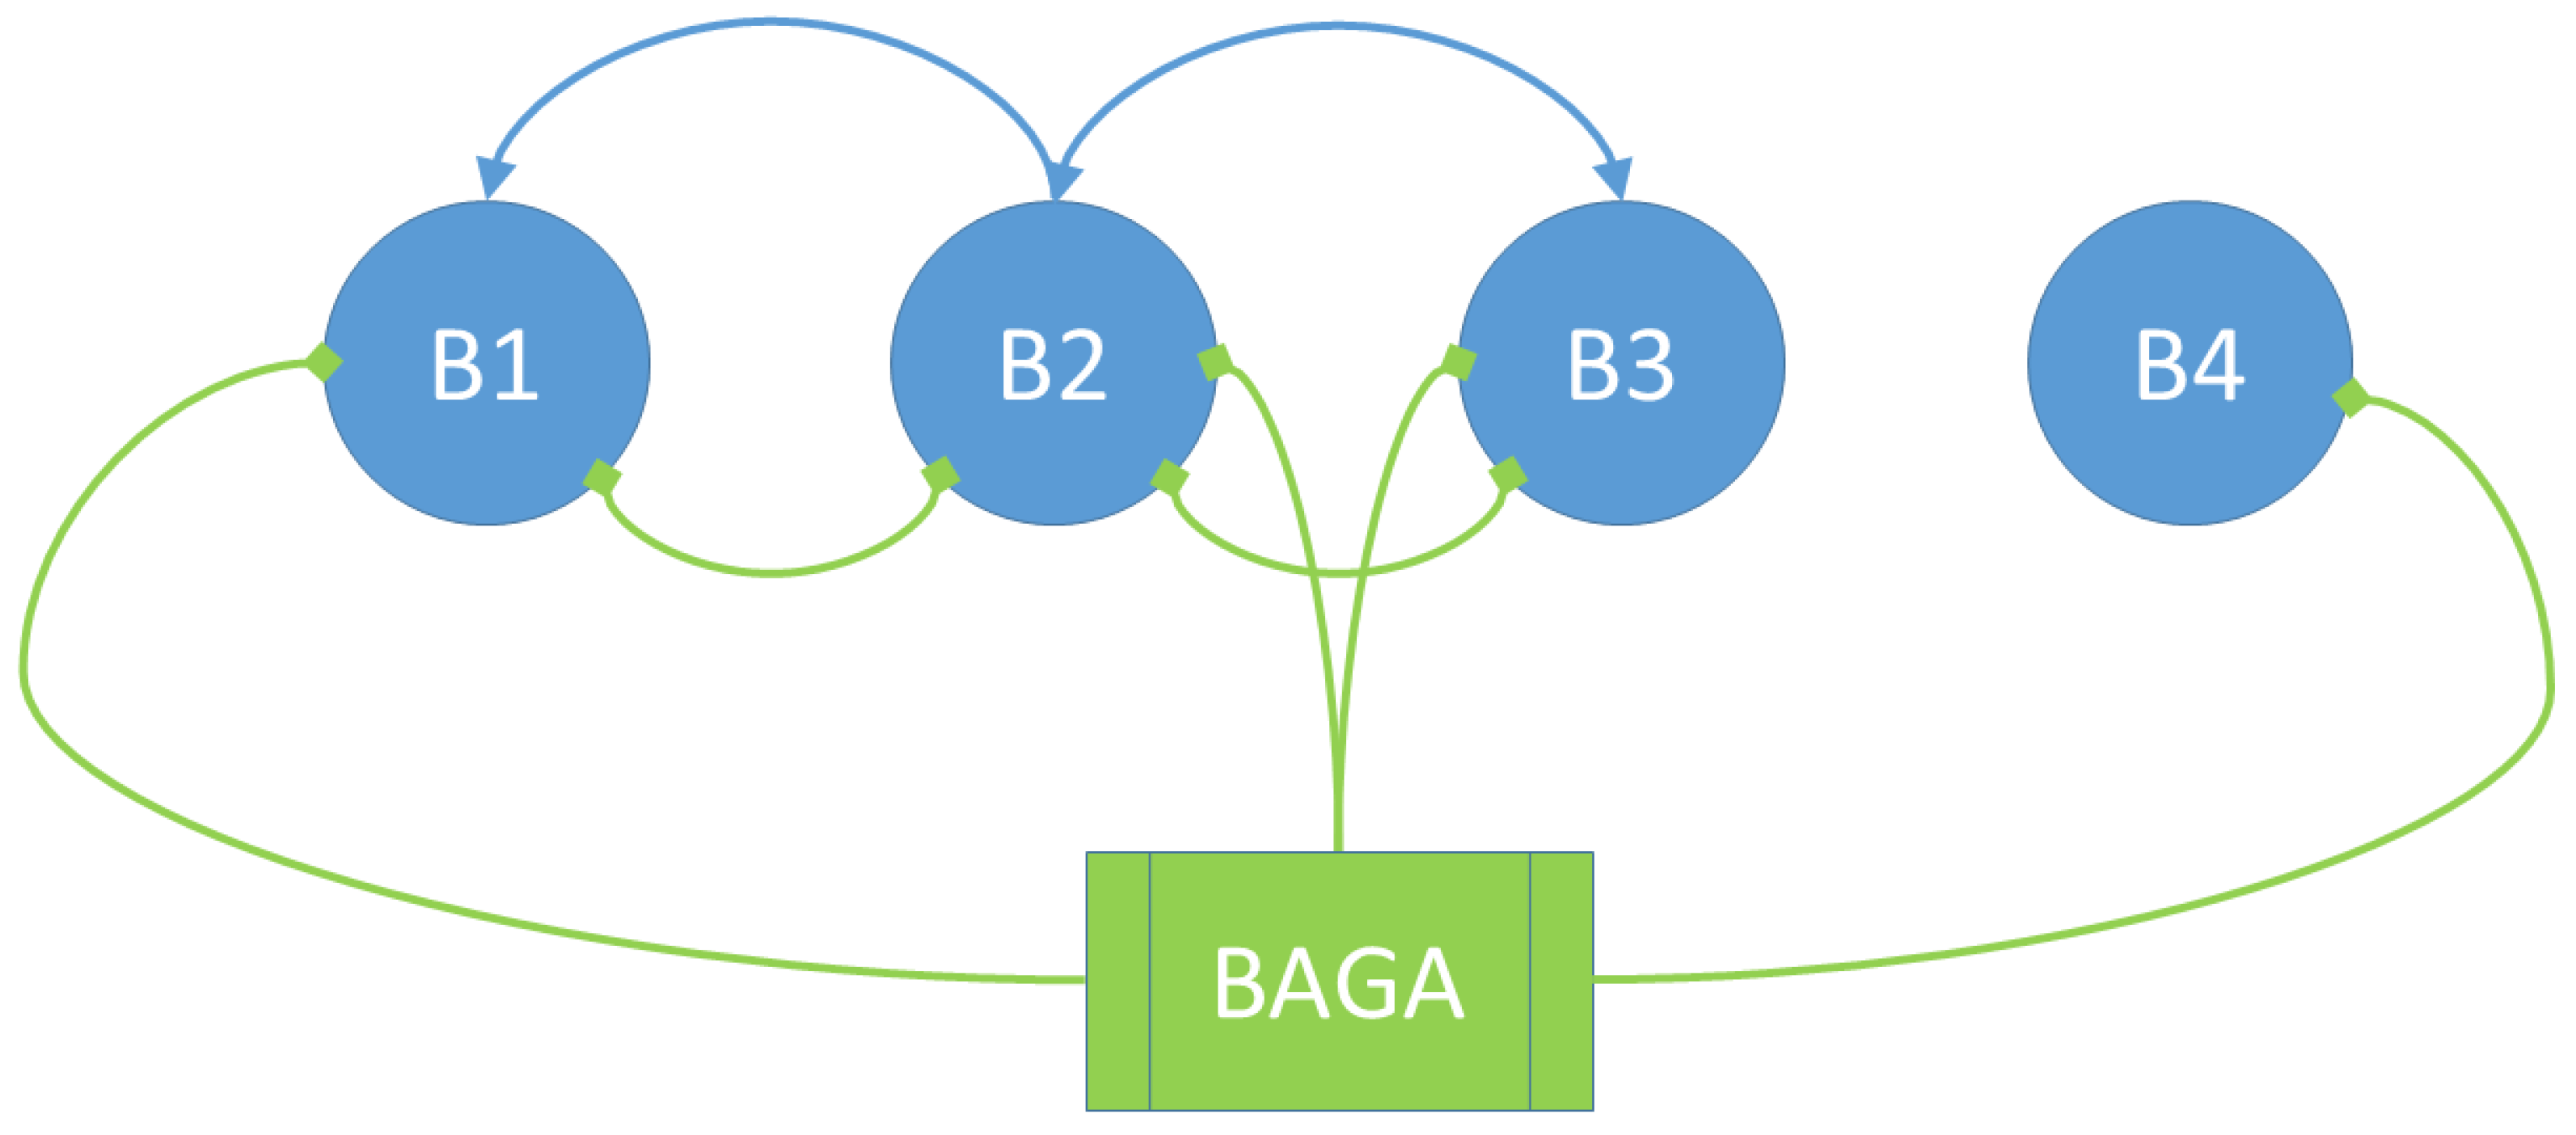
3.1. Social Interactions Model
- The bacterium B1 is positively affected by the B2 bacteria that contribute to its growth, while the products synthesized and released into the medium by the B3 and B4 bacteria are detrimental to the growth of B1.
- The growth of the B2 bacteria is favored by the product eliminated by the B3 bacteria, to the detriment of the product synthesized by the B4 strain.
- Bacteria B3 receive a positive effect on their growth from the product released by bacteria B2, while bacteria of strains B1 and B4 are detrimental to their growth.
- Bacteria B4 are pathogenic, and their growth is not affected by the products released into the medium by the other bacteria.
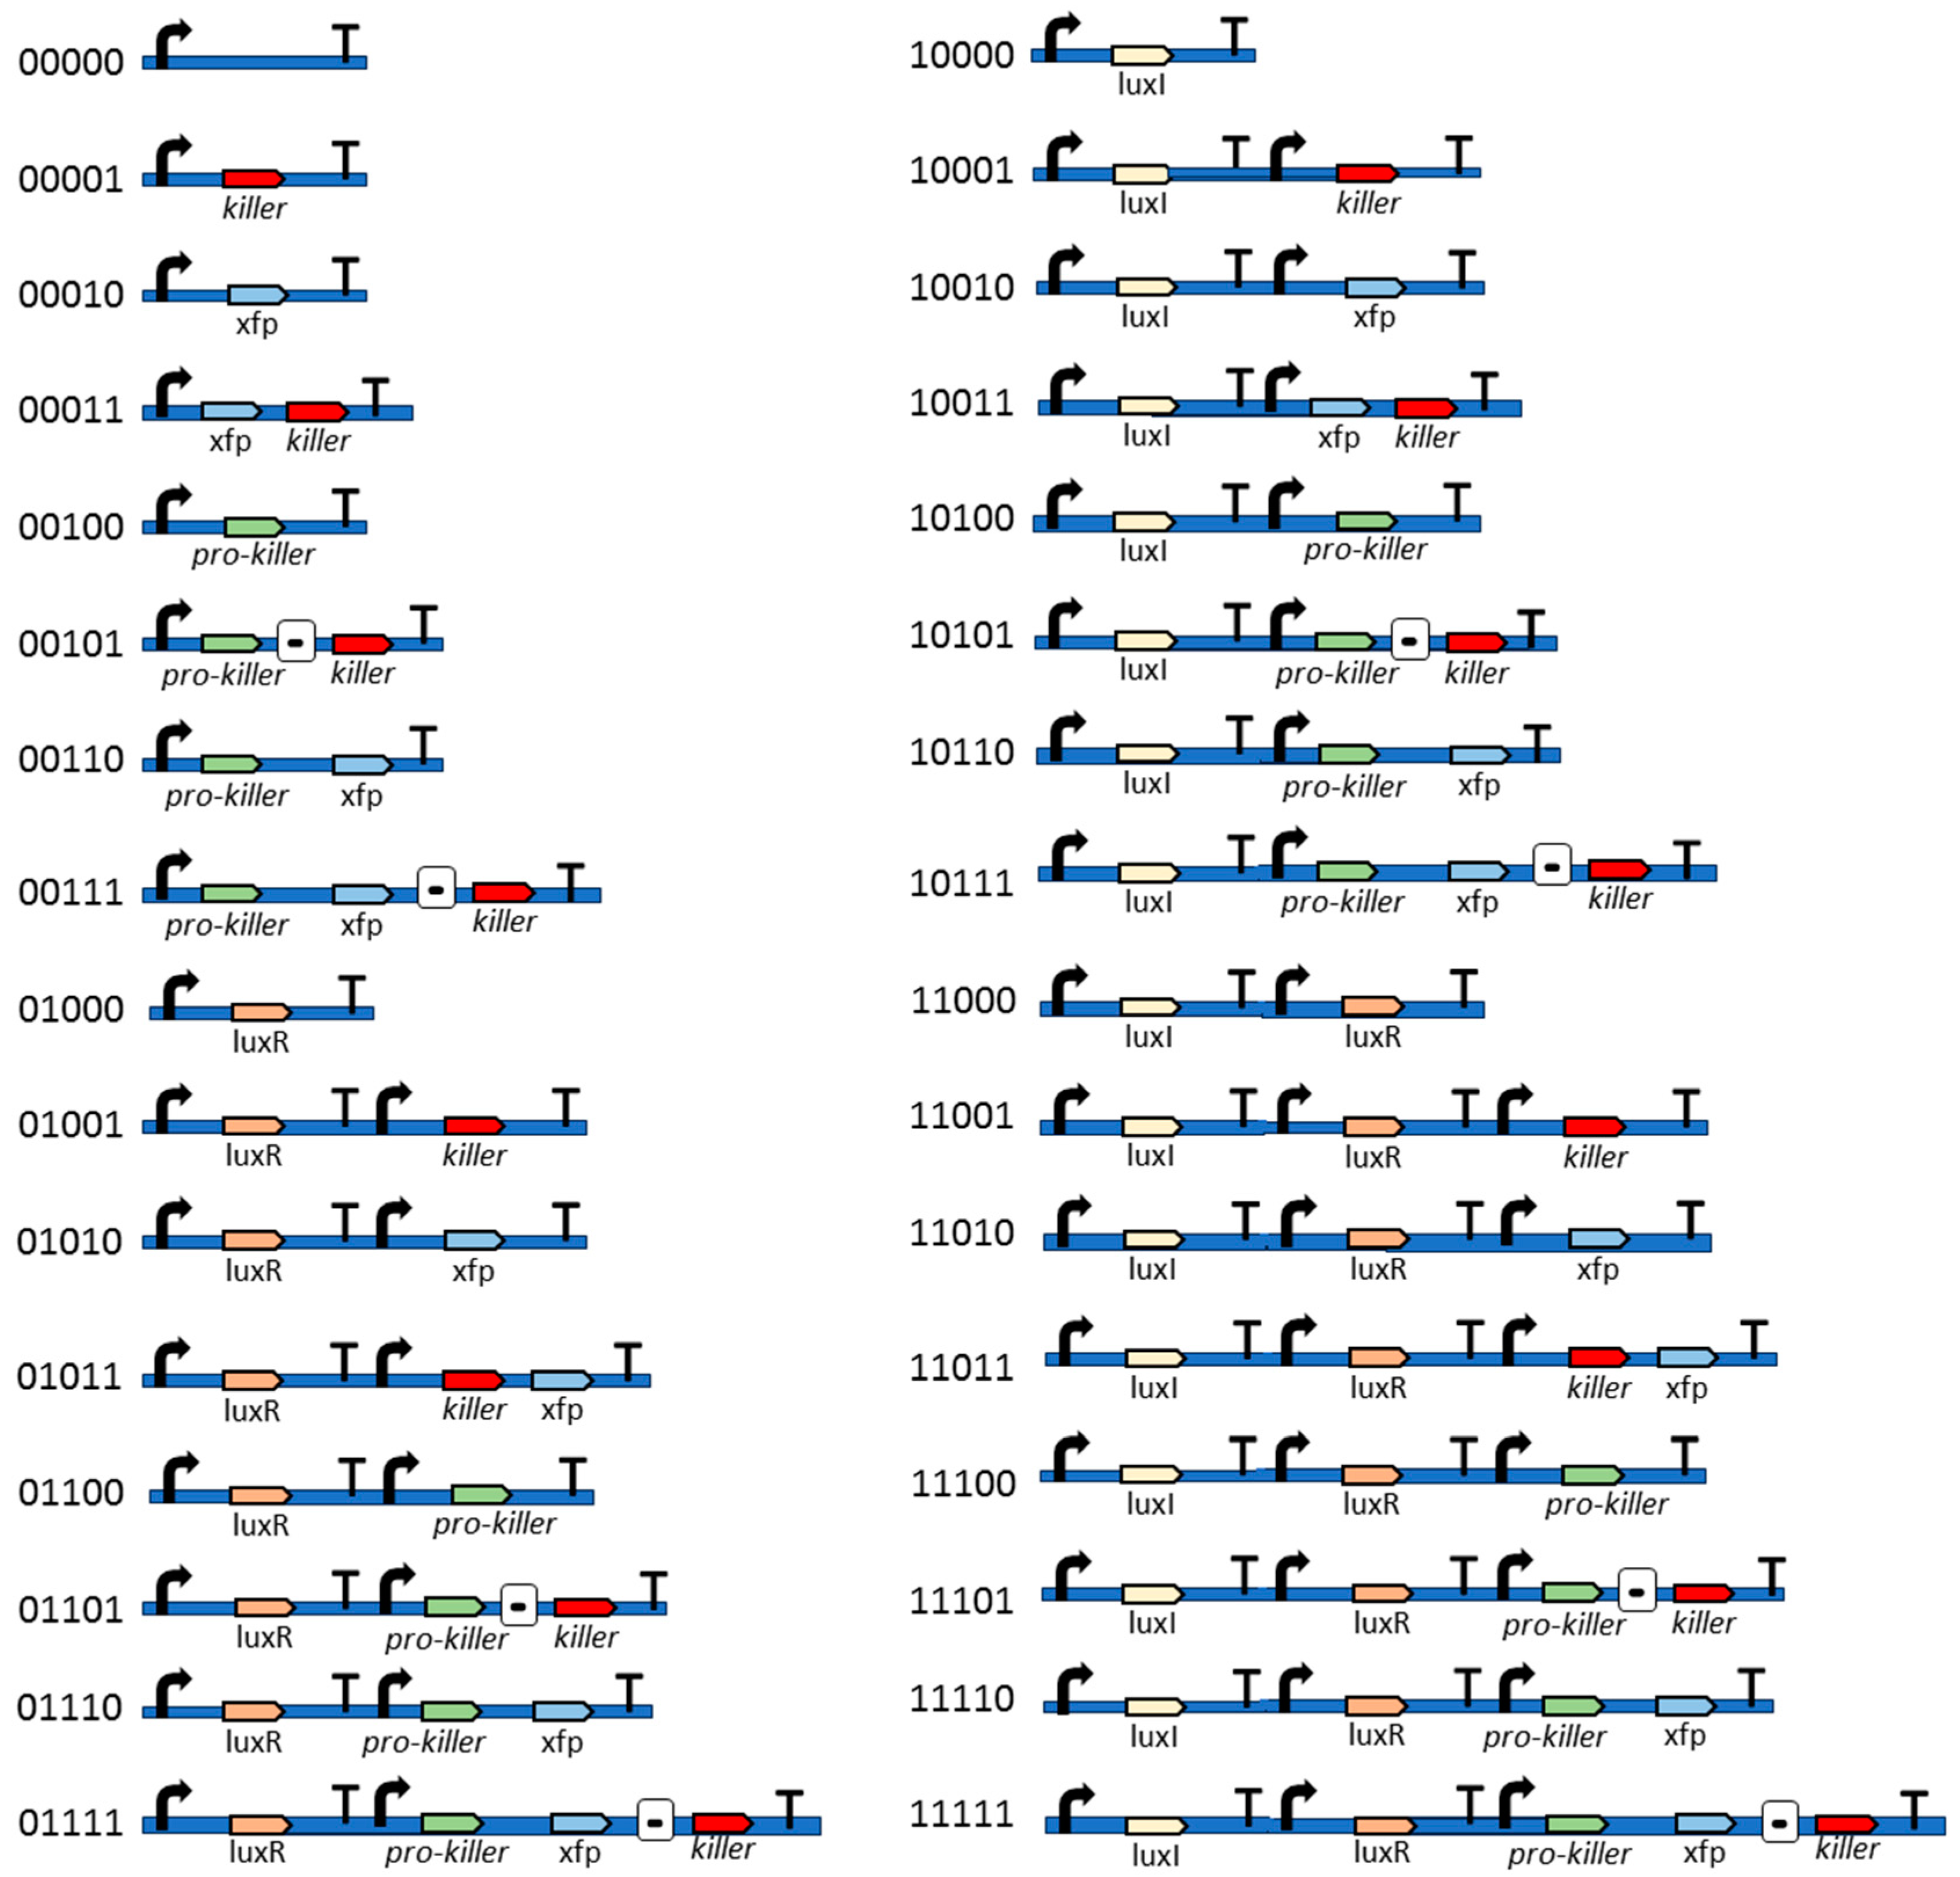
3.2. Model of Bacterial Genetic Circuit
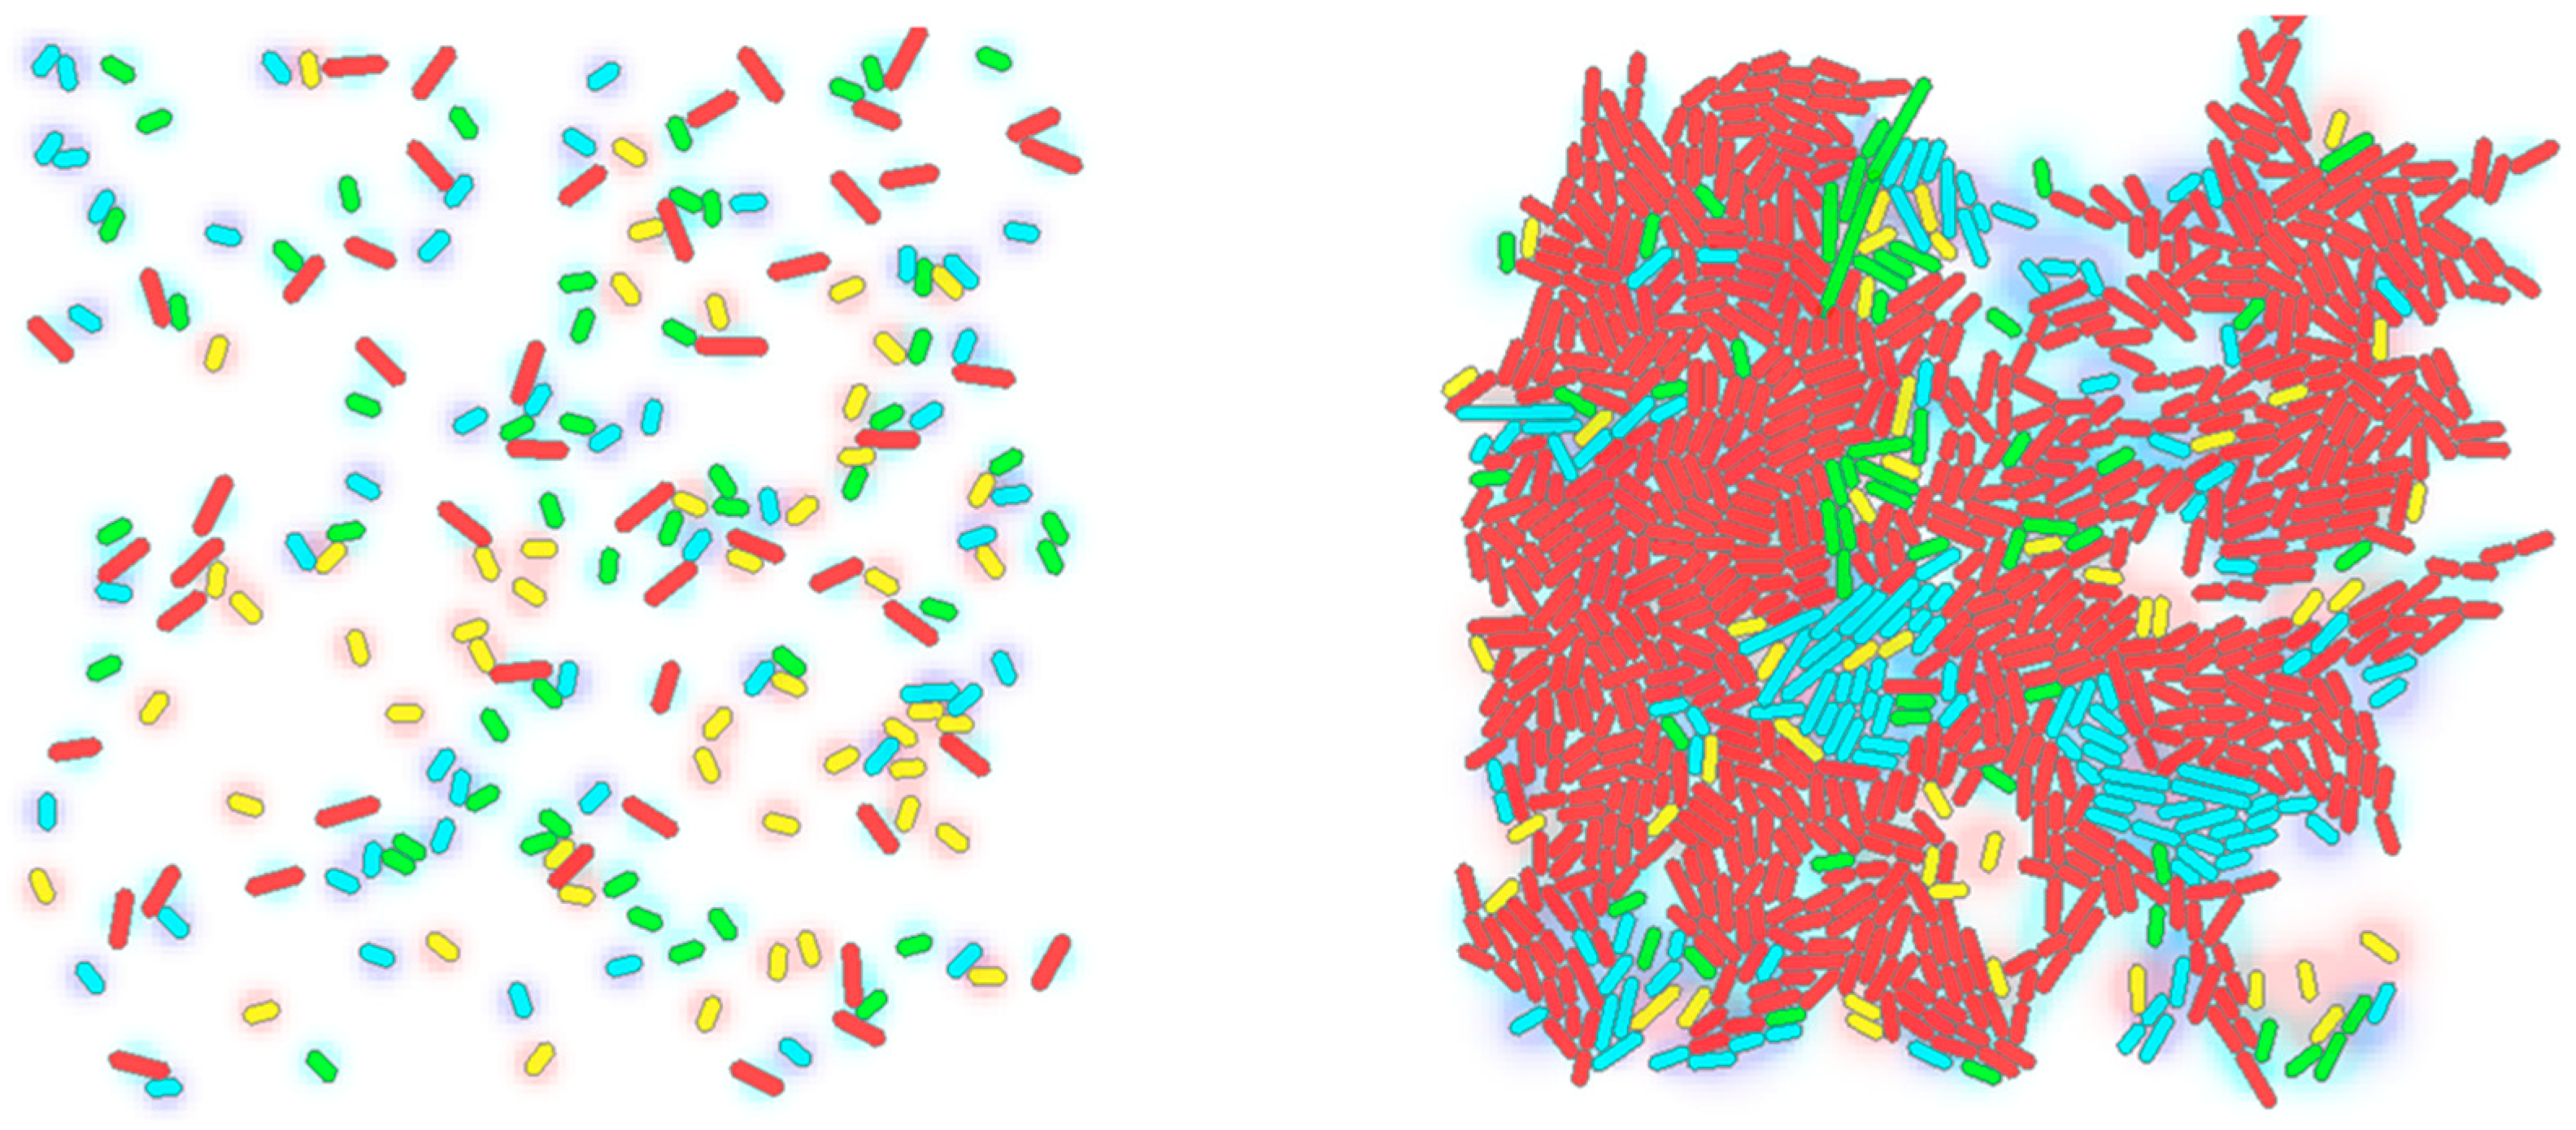
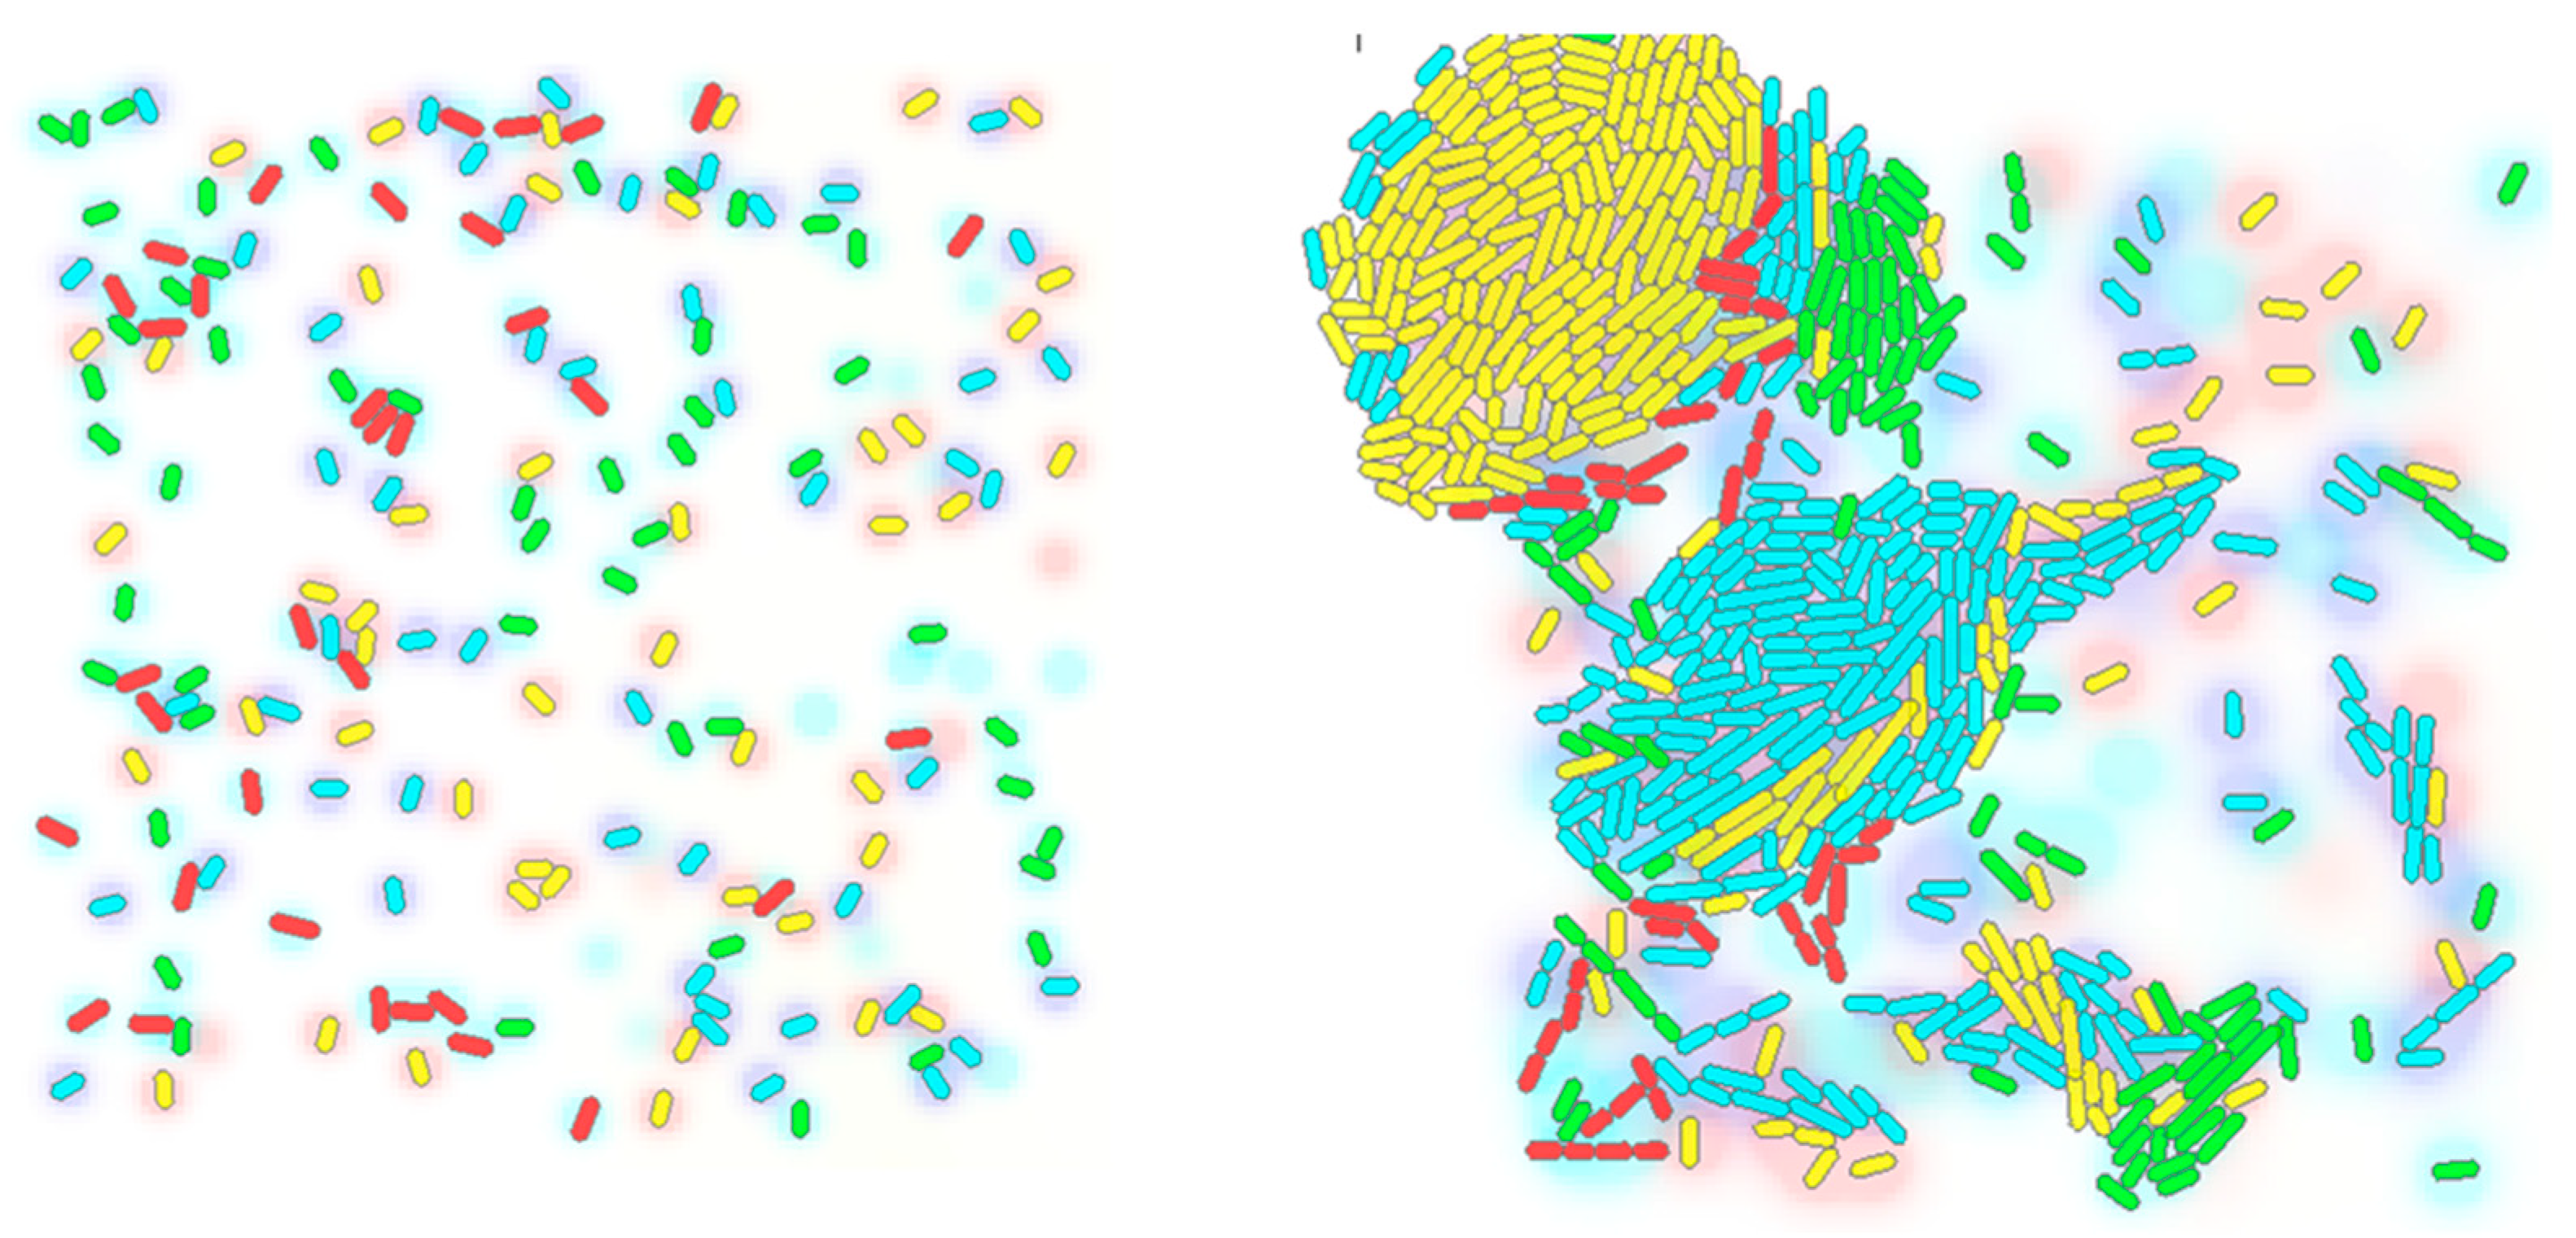
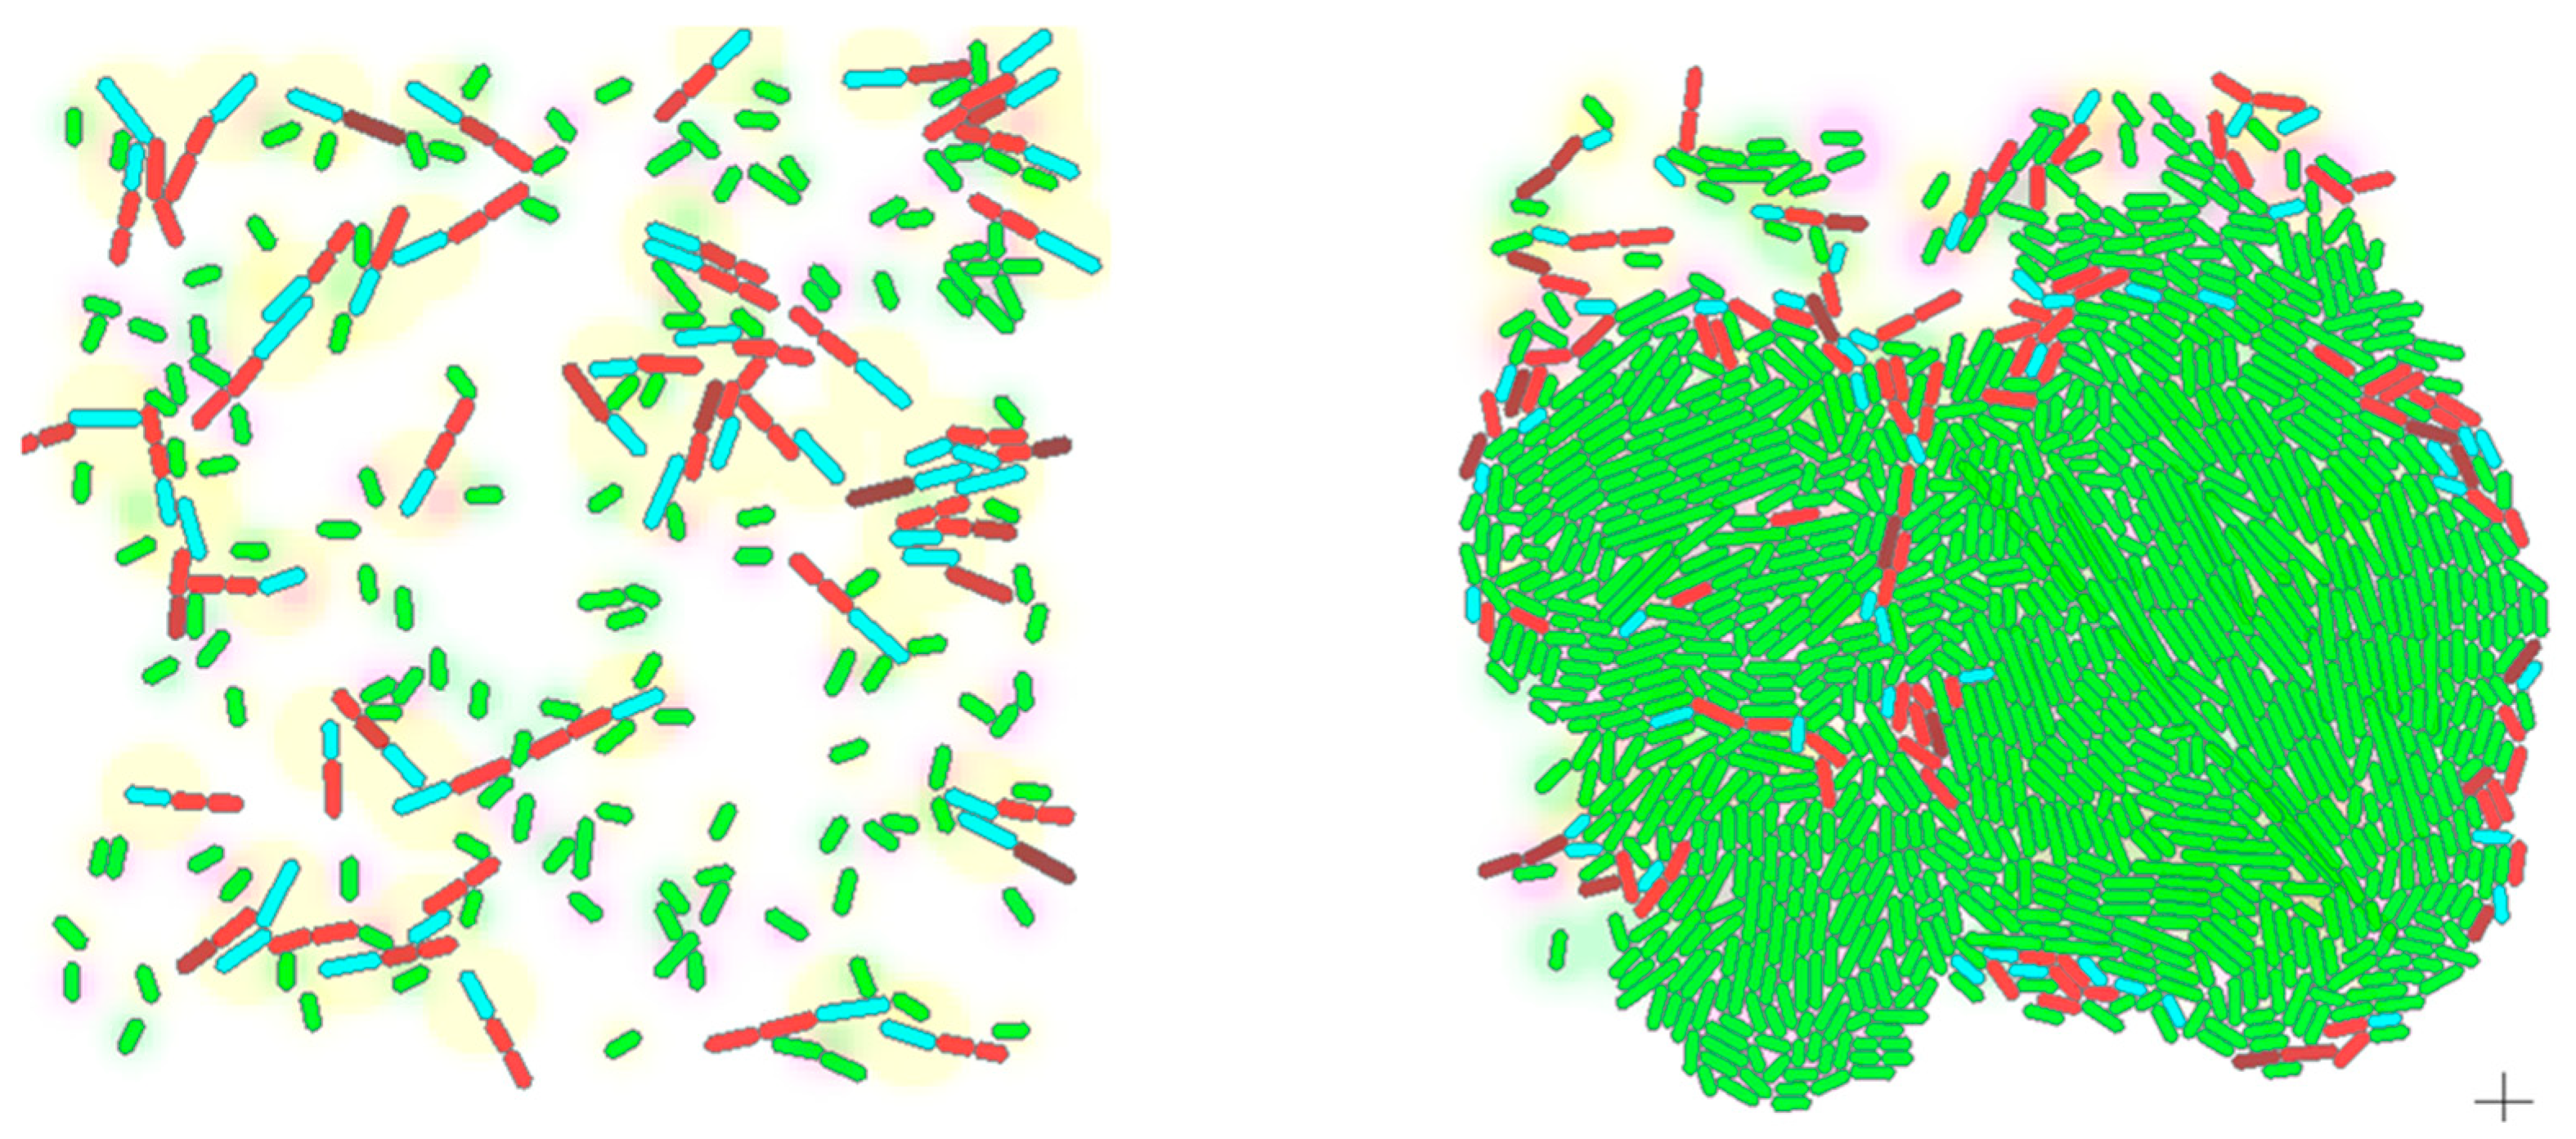
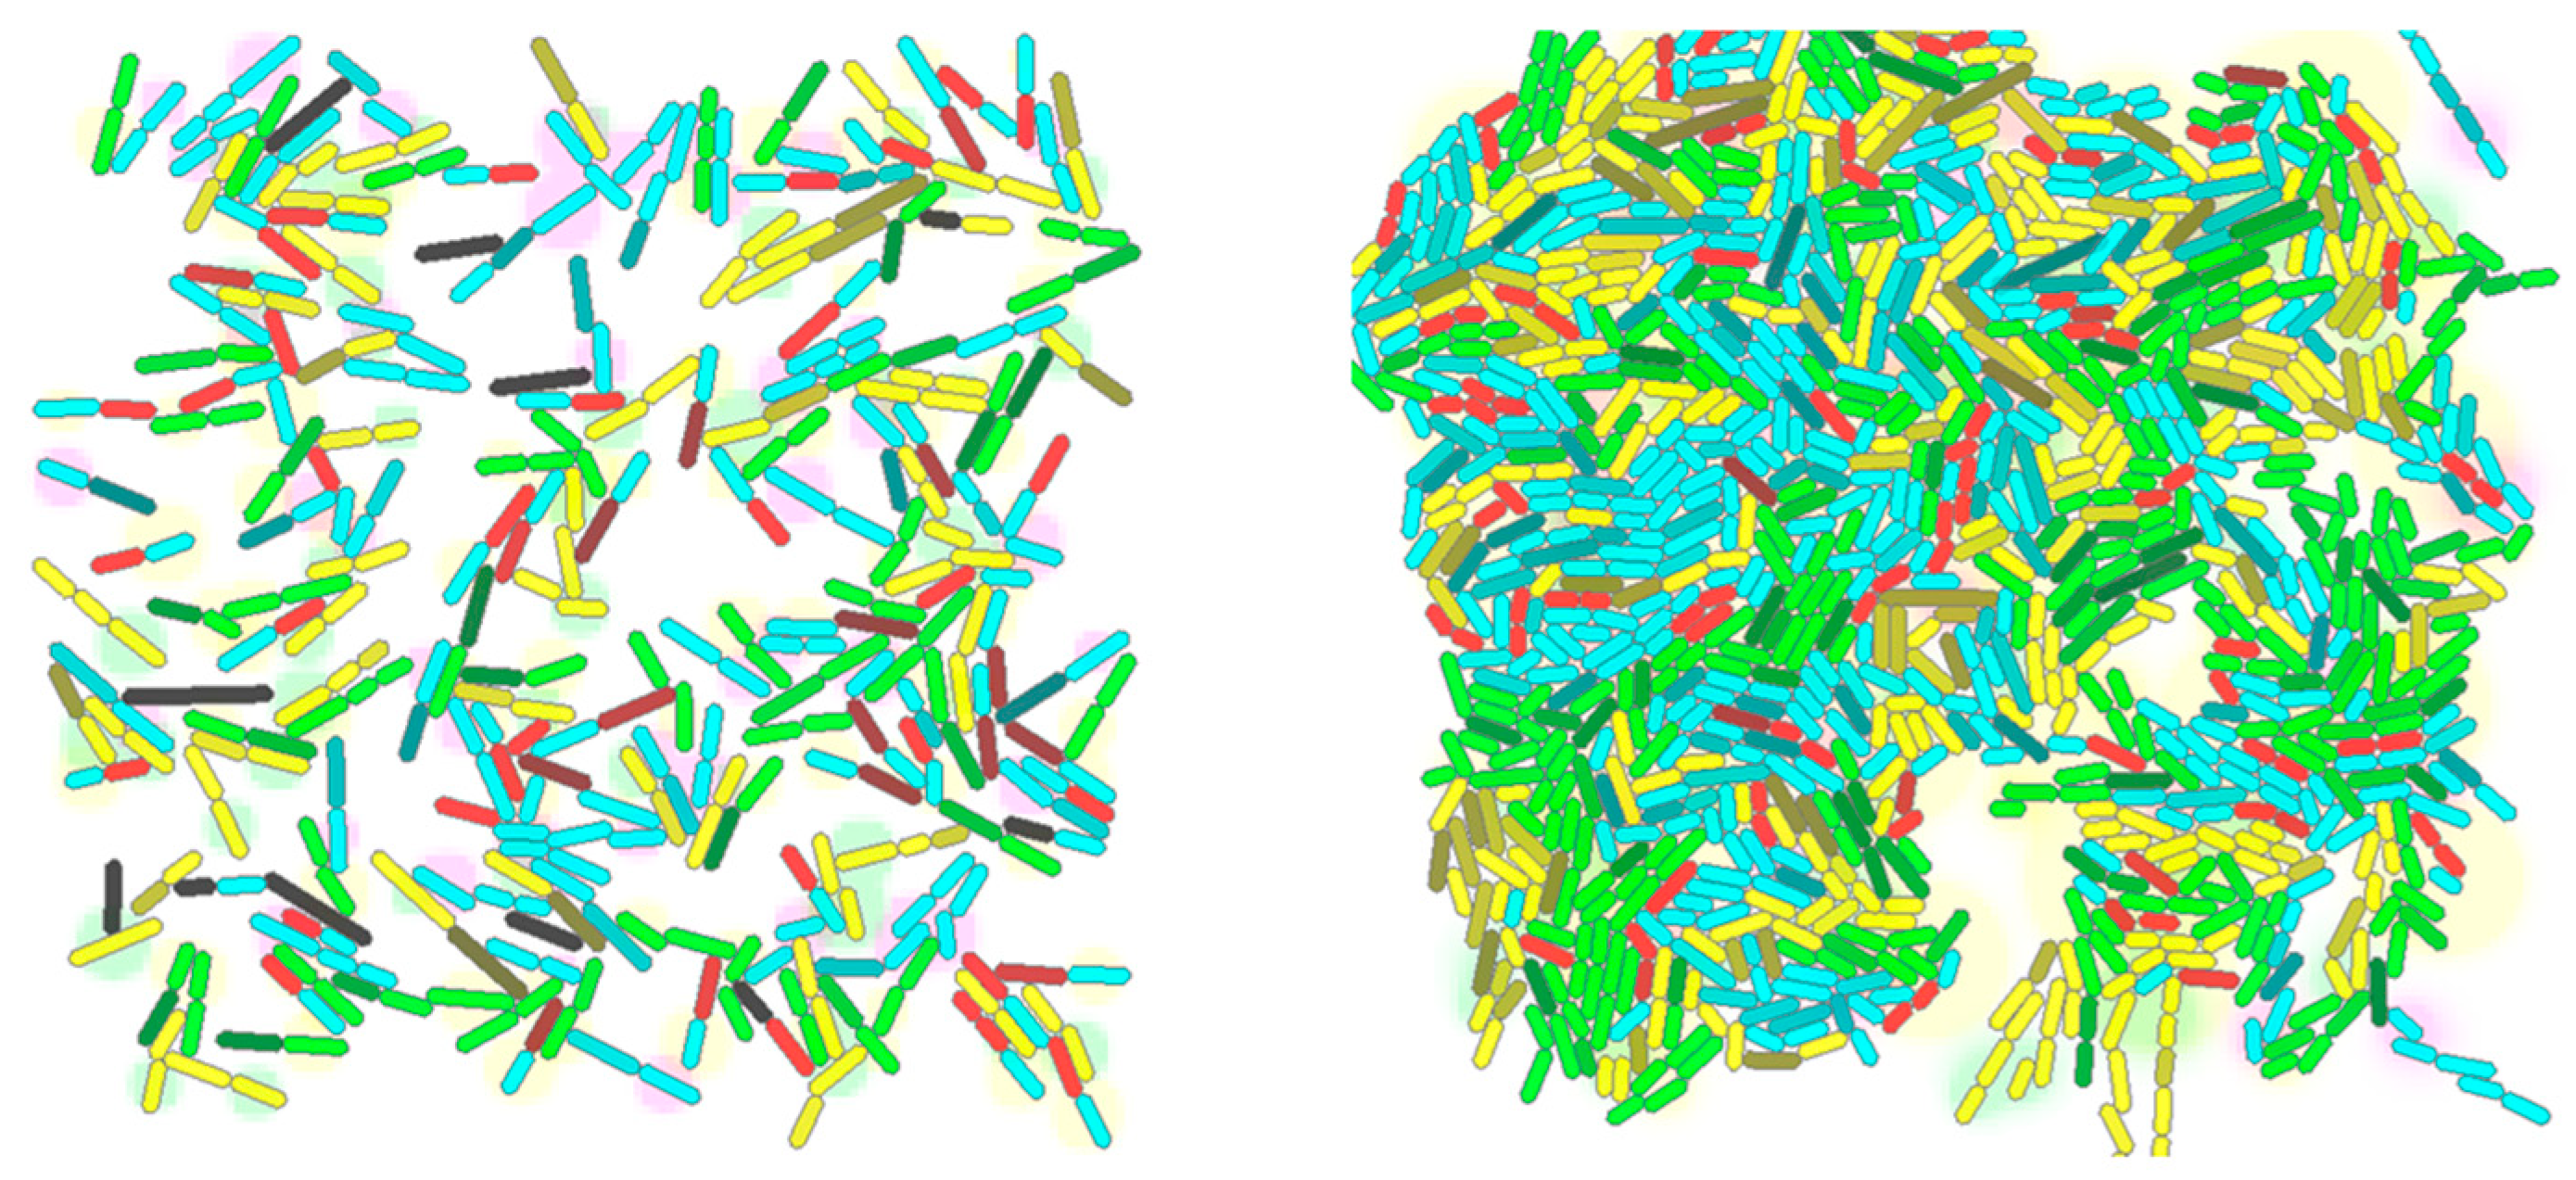
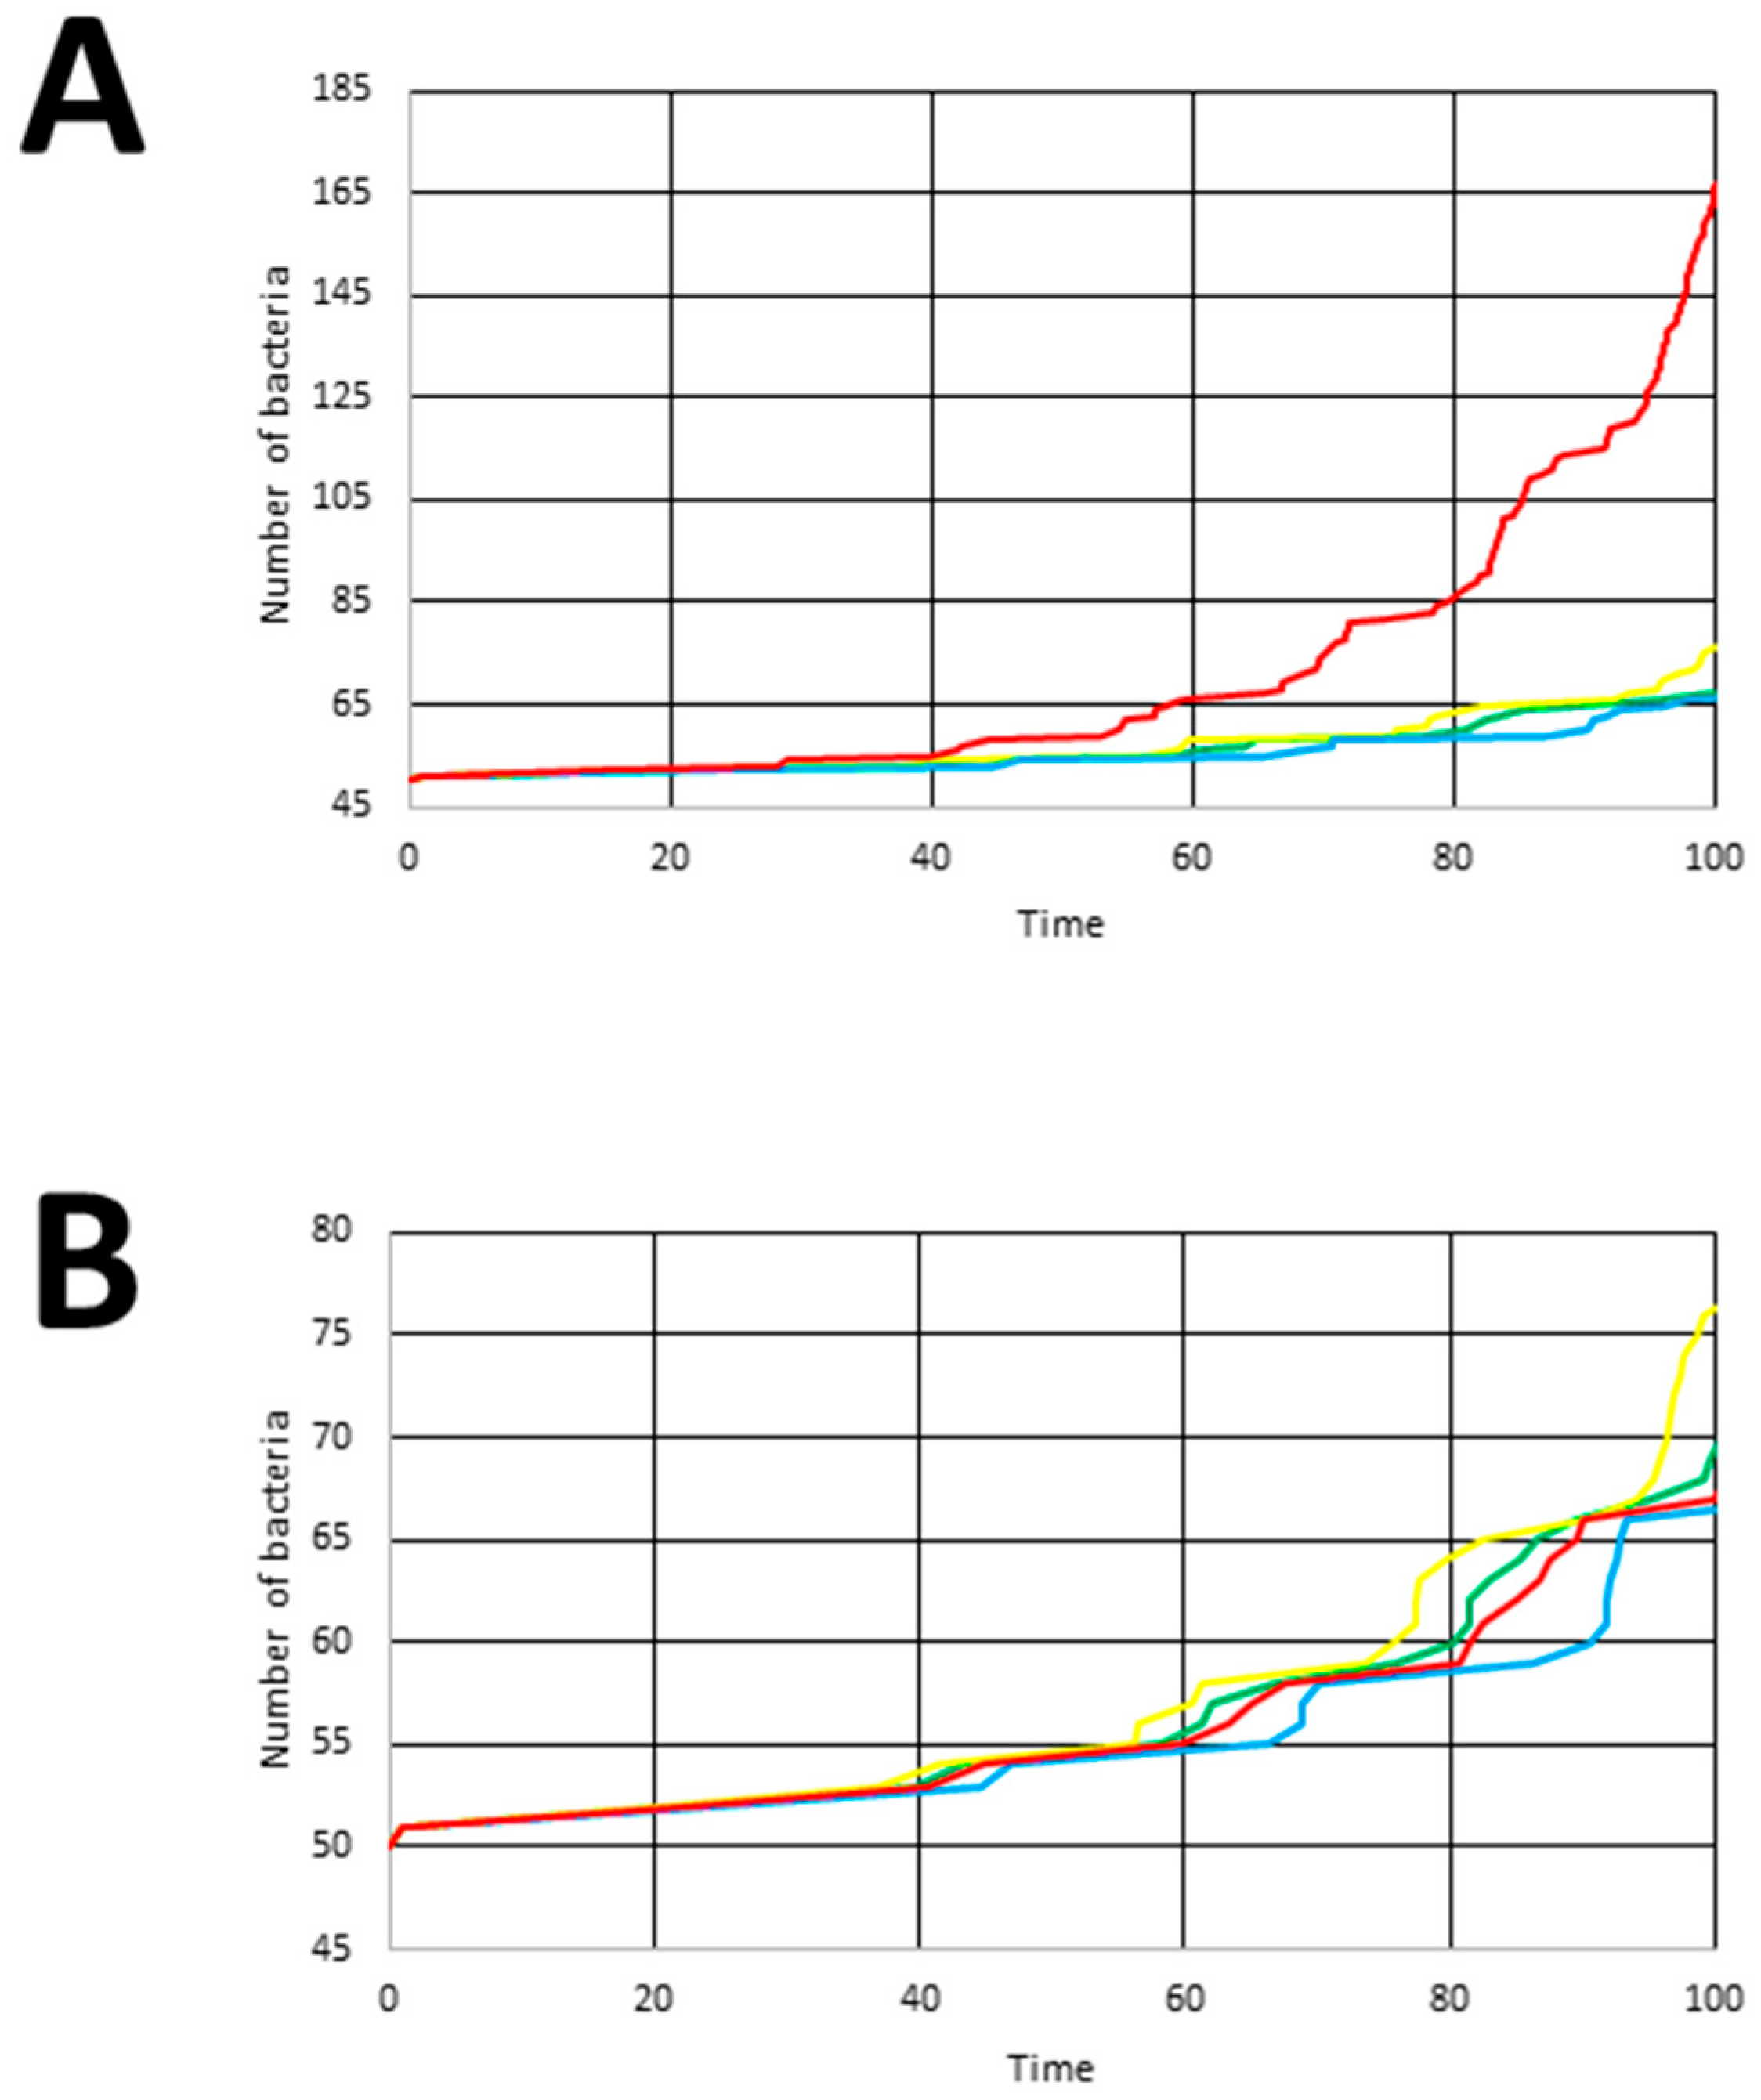
3.3. Simulation Experiments
3.3.1. Experiment 1
3.3.2. Experiment 2
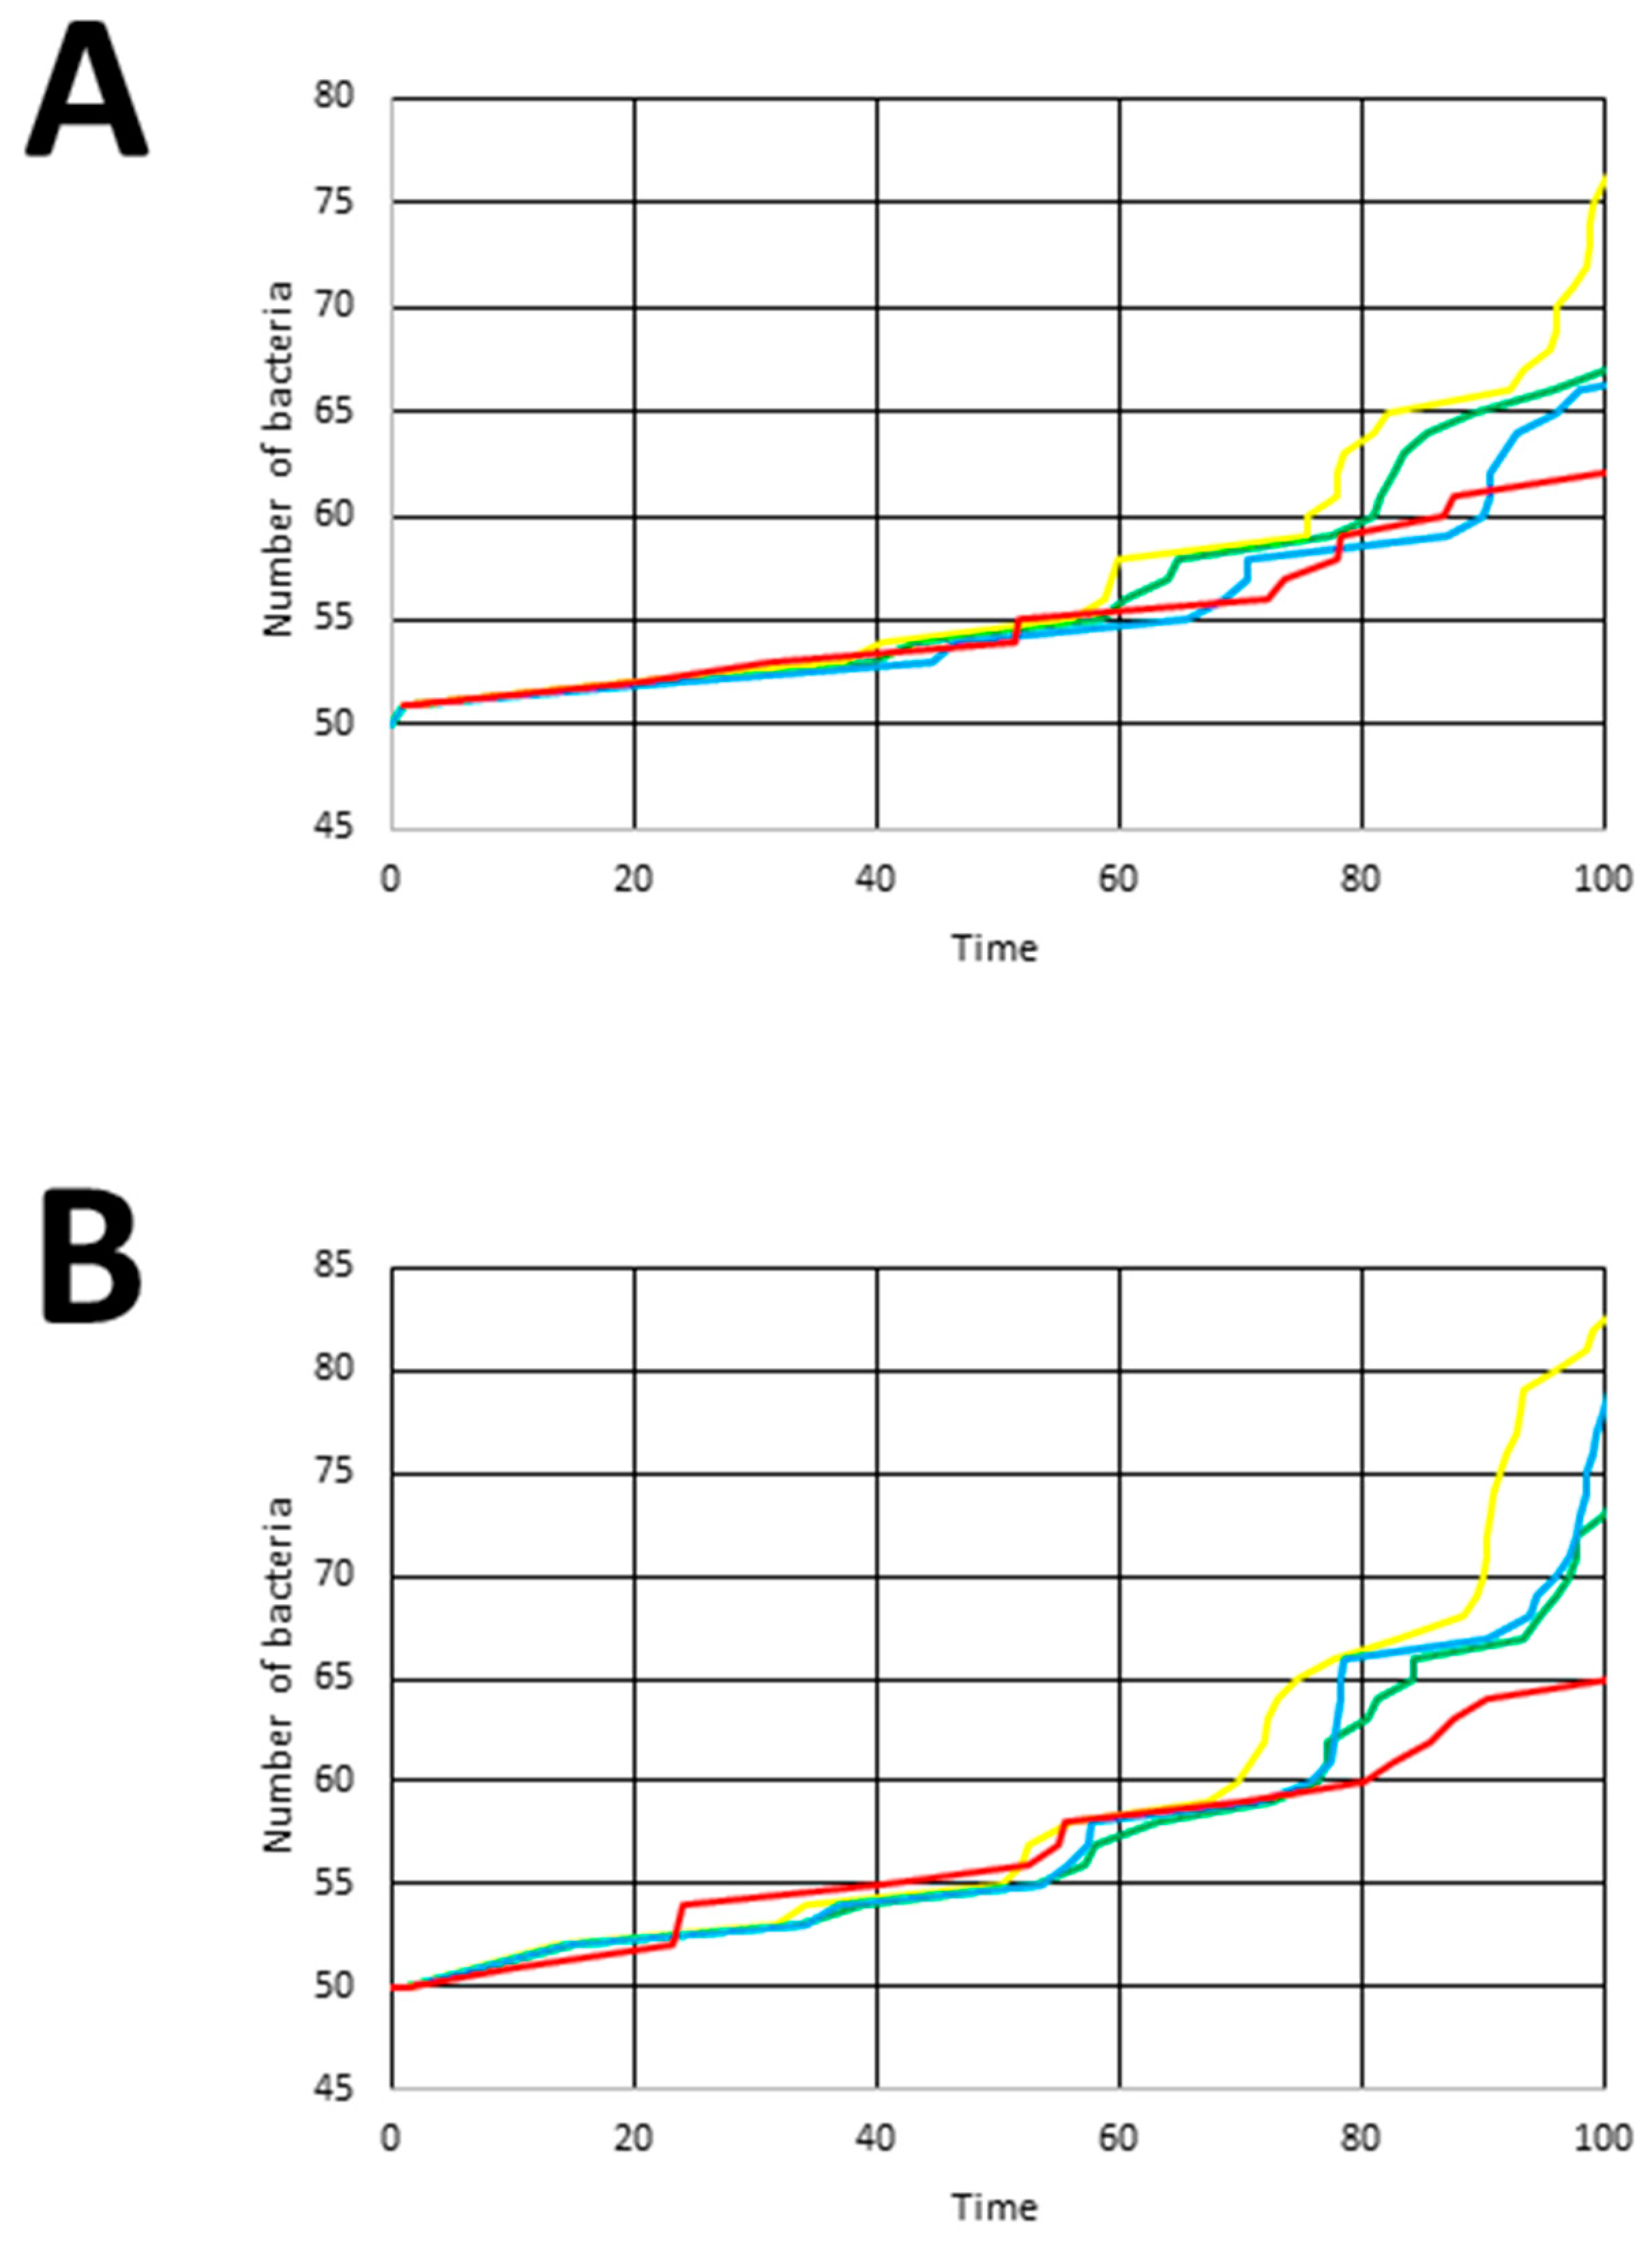
3.3.3. Experiment 3
3.3.4. Experiment 4
4. Results
5. Discussion
Author Contributions
Funding
Data Availability Statement
Acknowledgments
Conflicts of Interest
Appendix A


References
- Liu, Y.; Feng, J.; Pan, H.; Zhang, X.; Zhang, Y. Genetically engineered bacterium: Principles, practices, and prospects. Front. Microbiol. 2022, 13, 997587. [Google Scholar] [CrossRef]
- Lahoz-Beltra, R. Turing: Del Primer Ordenador a la Inteligencia Artificial; Nivola: Madrid, Spain, 2005. [Google Scholar]
- Gargantilla Becerra, A.; Gutiérrez, M.; Lahoz-Beltra, R. A synthetic biology approach for the design of genetic algorithms with bacterial agents. Int. J. Parallel Emergent Distrib. Syst. 2021, 36, 275–292. [Google Scholar] [CrossRef]
- Gargantilla Becerra, A.; Gutiérrez, M.; Lahoz-Beltra, R. Computing within bacteria: Programming of bacterial behavior by means of a plasmid encoding a perceptron neural network. BioSystems 2022, 213, 104608. [Google Scholar] [CrossRef]
- Kriegman, S.; Blackiston, D.; Levin, M.; Bongard, J. A scalable pipeline for designing reconfigurable organisms. Proc. Natl. Acad. Sci. USA 2020, 117, 1853–1859. [Google Scholar] [CrossRef]
- English, M.A.; Gayet, R.V.; Collins, J.J. Designing biological circuits: Synthetic biology within the operon model and beyond. Annu. Rev. Biochem. 2021, 90, 221–244. [Google Scholar] [CrossRef]
- Singh, V. Recent advances and opportunities in synthetic logic gates engineering in living cells. Syst. Synth. Biol. 2014, 8, 271–282. [Google Scholar] [CrossRef]
- Xia, P.F.; Ling, H.; Foo, J.L.; Chang, M.W. Synthetic genetic circuits for programmable biological functionalities. Biotechnol. Adv. 2019, 37, 107393. [Google Scholar] [CrossRef]
- Abil, Z.; Xiong, X.; Zhao, H. Synthetic biology for therapeutic applications. Mol. Pharm. 2015, 12, 322–331. [Google Scholar] [CrossRef]
- McCarty, N.S.; Ledesma-Amaro, R. Synthetic biology tools to engineer microbial communities for biotechnology. Trends Biotechnol. 2019, 37, 181–197. [Google Scholar] [CrossRef]
- Naseri, G.; Koffas, M.A.G. Application of combinatorial optimization strategies in synthetic biology. Nat. Commun. 2020, 11, 2446. [Google Scholar] [CrossRef]
- Jeschek, M.; Gerngross, D.; Panke, S. Combinatorial pathway optimization for streamlined metabolic engineering. Curr. Opin. Biotechnol. 2017, 47, 142–151. [Google Scholar] [CrossRef]
- Schreiber, J.; Arter, M.; Lapique, N.; Haefliger, B.; Benenson, Y. Model-guided combinatorial optimization of complex synthetic gene networks. Mol. Syst. Biol. 2016, 12, 899. [Google Scholar] [CrossRef]
- Chen, B.S.; Chen, P.W. GA-based design algorithms for the robust synthetic genetic oscillators with prescribed amplitude, period and phase. Gene Regul. Syst. Biol. 2010, 4, 35–52. [Google Scholar] [CrossRef]
- Chuang, C.H.; Lin, C.L.; Chang, Y.C.; Jennawasin, T.; Chen, P.K. Design of synthetic biological logic circuits based on evolutionary algorithm. IET Syst. Biol. 2013, 7, 89–105. [Google Scholar] [CrossRef]
- Currin, A.; Parker, S.; Robinson, C.J.; Takano, E.; Scrutton, N.S.; Breitling, R. The evolving art of creating genetic diversity: From directed evolution to synthetic biology. Biotechnol. Adv. 2021, 50, 107762. [Google Scholar] [CrossRef]
- Jang, S.S.; Oishi, K.T.; Egbert, R.G.; Klavins, E. Specification and simulation of multicelled behaviors. ACS Synth. Biol. 2012, 1, 365–374. [Google Scholar] [CrossRef][Green Version]
- Oishi, K.; Klavins, E. A framework for implementing finite state machines in gene regulatory networks. ACS Synth. Biol. 2014, 3, 652–665. [Google Scholar] [CrossRef]
- Gutiérrez, M.; Gregorio-Godoy, P.; Pérez Del Pulgar, G.; Muñoz, L.; Sáez, S.; Rodríguez-Patón, A. A new improved and extended version of the multicell bacterial simulator gro. ACS Synth. Biol. 2017, 6, 1496–1508. [Google Scholar] [CrossRef]
- Sanchez Iñiguez, U.; Lledo Villaescusa, S.; Lahoz-Beltra, R. GADY algorithm: Towards an evolutionary protocol for bottom-up design of synthetic bacteria. bioRxiv 2023. [Google Scholar] [CrossRef]
- Dekel, E.; Alon, U. Optimality and evolutionary tuning of the expression level of a protein. Nature 2005, 436, 588–592. [Google Scholar] [CrossRef]
- Klavins, E. gro. The Cell Programming Language. Available online: http://depts.washington.edu/soslab/gro/index.html (accessed on 6 November 2023).
- Sadava, D.E.; Hillis, D.M.; Heller, H.C.; Berenbaum, M. Life: The Science of Biology, 9th ed.; W. H. Freeman: New York, NY, USA, 2009; p. 349. [Google Scholar]
- Marino, S.; Baxter, N.T.; Huffnagle, G.B.; Petrosino, J.F.; Schloss, P.D. Mathematical modeling of primary succession of murine intestinal microbiota. Proc. Natl. Acad. Sci. USA 2014, 111, 439–444. [Google Scholar] [CrossRef]
- Li, B.; Wang, J.; Wang, B.; Wenhan, L.; Wu, Z. Computer simulations of bacterial-colony formation. Europhys. Lett. 1995, 30, 239–243. [Google Scholar] [CrossRef]
- Kreft, J.U.; Booth, G.; Wimpenny, J.W.T. BacSim, a simulator for individual-based modelling of bacterial colony growth. Microbiology 1998, 144, 3275–3287. [Google Scholar] [CrossRef]
- Thai Dam, D.; Lahoz-Beltra, R. MICRORAM: A simulation model of a colony of bacteria evolving inside an artificial world. Int. J. Inf. Theor. Appl. 2014, 21, 328–338. Available online: http://www.foibg.com/ijita/vol21/ijita21-04-p04.pdf (accessed on 5 December 2023).
- Wimpenny, J.W.T.; Colasanti, R. A unifying hypothesis for the structure of microbial biofilms based on cellular automaton models. FEMS Microbiol. Ecol. 1997, 22, 1–16. [Google Scholar] [CrossRef]
- Ghosh, P.; Mondal, J.; Ben-Jacob, E.; Levine, H. Mechanically-driven phase separation in a growing bacterial colony. Proc. Natl. Acad. Sci. USA 2015, 112, E2166–E2173. [Google Scholar] [CrossRef]
- Rudge, T.J.; Steiner, P.J.; Phillips, A.; Haseloff, J. Computational modeling of synthetic microbial biofilms. ACS Synth. Biol. 2012, 1, 345–352. [Google Scholar] [CrossRef]
- Ben Jacob, E.; Becker, I.; Shapira, Y.; Levine, H. Bacterial linguistic communication and social intelligence. Trends Microbiol. 2004, 12, 366–372. [Google Scholar] [CrossRef]
- Mitchell, R.J.; Lee, S.K.; Kim, T.; Ghim, C.M. Microbial linguistics: Perspectives and applications of microbial cell-to-cell communication. BMB Rep. 2011, 44, 1–10. [Google Scholar] [CrossRef]
- Fellermann, H.; Markovitch, O.; Gilfellon, O.; Madsen, C.; Phillips, A. Toward programmable biology. ACS Synth. Biol. 2016, 5, 793–794. [Google Scholar] [CrossRef][Green Version]
- Gao, C.; Xu, P.; Ye, C.; Chen, X.; Liu, L. Genetic Circuit-Assisted Smart Microbial Engineering. Trends Microbiol. 2019, 27, 1011–1024. [Google Scholar] [CrossRef]
- Han, Y.H.; Kim, G.; Seo, S.W. Programmable synthetic biology tools for developing microbial cell factories. Curr. Opin. Biotechnol. 2023, 79, 102874. [Google Scholar] [CrossRef]
- Pedrolli, D.B.; Ribeiro, N.V.; Squizato, P.N.; de Jesus, V.N.; Cozetto, D.A.; Team AQA Unesp at iGEM 2017. Engineering microbial living therapeutics: The synthetic biology toolbox. Trends Biotechnol. 2019, 37, 100–115. [Google Scholar] [CrossRef]
- Xiang, L.; Li, G.; Wen, L.; Su, C.; Liu, Y.; Tang, H.; Dai, J. Biodegradation of aromatic pollutants meets synthetic biology. Synth. Syst. Biotechnol. 2021, 6, 153–162. [Google Scholar] [CrossRef]
- Lebovich, M.; Zeng, M.; Andrews, L.B. Algorithmic programming of sequential logic and genetic circuits for recording biochemical concentration in a probiotic bacterium. ACS Synth. Biol. 2023, 12, 2632–2649. [Google Scholar] [CrossRef]
- Chowdhury, S.; Castro, S.; Coker, C.; Hinchliffe, T.E.; Arpaia, N.; Danino, T. Programmable bacteria induce durable tumor regression and systemic antitumor immunity. Nat. Med. 2019, 25, 1057–1063. [Google Scholar] [CrossRef]
- Brennan, A.M. Development of synthetic biotics as treatment for human diseases. Synth. Biol. 2022, 7, ysac001. [Google Scholar] [CrossRef]
- Schmidt, M.; Ganguli-Mitra, A.; Torgersen, H.; Kelle, A.; Deplazes, A.; Biller-Andorno, N. A priority paper for the societal and ethical aspects of synthetic biology. Syst. Synth. Biol. 2009, 3, 3–7. [Google Scholar] [CrossRef][Green Version]
- Concepción-Acevedo, J.; Weiss, H.N.; Chaudhry, W.N.; Levin, B.R. Malthusian parameters as estimators of the fitness of microbes: A cautionary tale about the low side of high throughput. PLoS ONE 2015, 10, e0126915. [Google Scholar] [CrossRef]
- Granato, E.T.; Foster, K.R. The evolution of mass cell suicide in bacterial warfare. Curr. Biol. 2020, 30, 2836–2843.e3. [Google Scholar] [CrossRef]
- Rottinghaus, A.G.; Ferreiro, A.; Fishbein, S.R.S.; Dantas, G.; Moon, T.S. Genetically stable CRISPR-based kill switches for engineered microbes. Nat. Commun. 2022, 13, 672. [Google Scholar] [CrossRef]
- Wang, G.; Kong, Q.; Wang, D.; Asmi, F. Ethical and social insights into synthetic biology: Predicting research fronts in the post-COVID-19 era. Front. Bioeng. Biotechnol. 2023, 11, 1085797. [Google Scholar] [CrossRef]


| B1 | B2 | B3 | B4 | |
|---|---|---|---|---|
| B1 | + | − | − | |
| B2 | 0 | + | − | |
| B3 | − | + | − | |
| B4 | 0 | 0 | 0 |
Disclaimer/Publisher’s Note: The statements, opinions and data contained in all publications are solely those of the individual author(s) and contributor(s) and not of MDPI and/or the editor(s). MDPI and/or the editor(s) disclaim responsibility for any injury to people or property resulting from any ideas, methods, instructions or products referred to in the content. |
© 2023 by the authors. Licensee MDPI, Basel, Switzerland. This article is an open access article distributed under the terms and conditions of the Creative Commons Attribution (CC BY) license (https://creativecommons.org/licenses/by/4.0/).
Share and Cite
Villaescusa, S.L.; Lahoz-Beltra, R. Evolutionary Algorithms in a Bacterial Consortium of Synthetic Bacteria. Algorithms 2023, 16, 571. https://doi.org/10.3390/a16120571
Villaescusa SL, Lahoz-Beltra R. Evolutionary Algorithms in a Bacterial Consortium of Synthetic Bacteria. Algorithms. 2023; 16(12):571. https://doi.org/10.3390/a16120571
Chicago/Turabian StyleVillaescusa, Sara Lledó, and Rafael Lahoz-Beltra. 2023. "Evolutionary Algorithms in a Bacterial Consortium of Synthetic Bacteria" Algorithms 16, no. 12: 571. https://doi.org/10.3390/a16120571
APA StyleVillaescusa, S. L., & Lahoz-Beltra, R. (2023). Evolutionary Algorithms in a Bacterial Consortium of Synthetic Bacteria. Algorithms, 16(12), 571. https://doi.org/10.3390/a16120571