Abstract
This paper proposes a novel prediction model termed the social and spatial attentive generative adversarial network (SSA-GAN). The SSA-GAN framework utilizes a generative approach, where the generator employs social attention mechanisms to accurately model social interactions among pedestrians. Unlike previous methodologies, our model utilizes comprehensive motion features as query vectors, significantly enhancing predictive performance. Additionally, spatial attention is integrated to encapsulate the interactions between pedestrians and their spatial context through semantic spatial features. Moreover, we present a novel approach for generating simulated multi-trajectory datasets using the CARLA simulator. This method circumvents the limitations inherent in existing public datasets such as UCY and ETH, particularly when evaluating multi-trajectory metrics. Our experimental findings substantiate the efficacy of the proposed SSA-GAN model in capturing the nuances of pedestrian interactions and providing accurate multimodal trajectory predictions.
1. Introduction
As intelligent interactive systems continue to advance, it is becoming increasingly critical for machines to understand human behavior and provide reliable human–machine interactions. In many applications, such as a mobile social robot [1,2] in a crowded area, an autonomous vehicle [3,4] navigating complicated roadways, or a mobile agent [5] in an unstructured setting, pedestrian trajectory prediction is a critical process. These machines must avoid collisions with pedestrians or other obstacles to accomplish their tasks. Hence, accurately predicting pedestrian trajectories has become an urgent requirement.
Trajectory prediction is essentially a challenge involving sequence generation [6], forecasting future paths for a specific time period using observed data like previous trajectories. The future trajectory of a pedestrian, however, differs from other sequence prediction tasks in that it presents various possible future options and is strongly influenced by the surrounding people and environment. Figure 1 shows a pedestrian’s future paths of movement on a sidewalk, which are influenced by other nearby pedestrians, vehicles on the road, and adjacent buildings, resulting in multiple potential routes. Hence, a wide range of influences that affect future trajectories [7] must be thoroughly taken into account, including the pedestrian’s relative location, destination, spatial circumstances, and social norms. The complexity and variability of human behavior, especially in crowded situations, make it difficult to model all these aspects together.
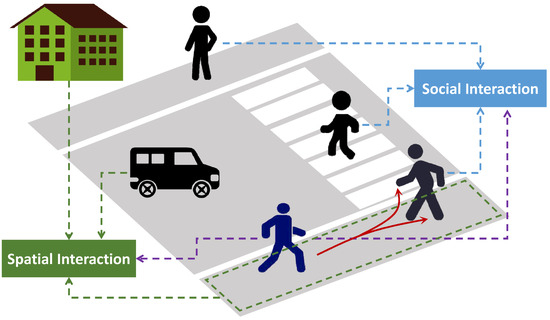
Figure 1.
Illustration of a pedestrian’s trajectory, which is influenced by the surrounding people and environment, depicting multiple future possibilities.
Pioneering works, such as the Social Forces Model [8], use model-based handcrafted rules to predict pedestrian trajectories and simulate interactions between people and their surroundings. Although dynamic model-based methods provide a theoretical grasp of pedestrian dynamics [9], they may struggle to capture complex and latent interactions in crowded situations. Nowadays, data-driven approaches, which can learn sophisticated interactions among pedestrians and predict future trajectories, have become increasingly popular [10]. Recurrent Neural Networks (RNNs), especially Long Short-Term Memory (LSTM), are inherently suitable for temporal sequence predictions. Social LSTM [6], which incorporates a social pooling module to enable neighboring LSTM sequences to share their hidden information, is one of the most well-known early efforts employing an RNN to predict pedestrian trajectories, and it has become a baseline. In addition to RNNs [11,12,13,14,15,16,17,18,19], generative networks [20,21,22,23,24] are utilized to learn the distribution of observed pedestrian trajectories and predict a variety of feasible future trajectories. Regardless of which network is used, social interactions among pedestrians and spatial interactions with the environment should be considered. Social interaction modules embed different motion features of pedestrians and then aggregate them through different methods such as social pooling [6], social attention [22], graph neural network [11,25], and direct concatenation [26]. Spatial attributes, such as obstacles and pedestrian paths, influence the pedestrian’s route selection and can improve trajectory prediction accuracy through spatial semantic representation.
SoPhie [22] was the first approach to unitize generative networks and jointly model social and physical attentions. Deep learning-based pedestrian trajectory methods employ social attention modules to simulate interactions among pedestrians. Kothari et al. [26] emphasized the importance of designing the input state for these modules. Previous works have considered different inputs, such as relative positions [6,11,17], relative velocities [27,28,29], and LSTM hidden states [22,30,31,32]. Evidently, the comprehensive motion features of pedestrians are pivotal for trajectory prediction. Despite the fact that deep learning methods often aim for end-to-end solutions, directly predicting trajectories from observed coordinates, we argue that extracting pedestrians’ comprehensive motion features and using them as inputs for social interaction modules can more effectively capture motion-related pedestrian behaviors, such as following, collision avoidance, and walking in parallel. Although this approach may not be purely end-to-end, this paper also demonstrates that incorporating feature engineering can enhance the performance of artificial neural networks in tasks where features are explicitly defined.
In this paper, we propose a Social and Spatial Attentive Generative Adversarial Network (SSA-GAN) for predicting pedestrian trajectories. This model can be integrated into the controllers of mobile robots, enhancing route planning efficiency by taking into account the movement of surrounding individuals. Our proposed prediction neural network comprises a social interaction module with neighboring pedestrians and a spatial interaction module with the scene, similar to SoPhie [22]. However, we extract comprehensive pedestrian motion features and model social interactions among pedestrians using a social attention mechanism. To represent human–space interactions, we employ a Visual Geometry Group (VGG) network pretrained on a semantic segmentation task to extract semantic features of the space as the input for the space attention module. Finally, we use an LSTM-based generative adversarial network to produce a diversified range of future trajectories. We assess the model’s performance using both public single ground-truth trajectory datasets and our own multi-trajectory datasets. This paper’s main contributions are as follows:
- A comprehensive motion feature extraction method, which includes the relative distance, speed, and velocity angle, is used as the query for an attention mechanism-based social interaction module.
- A generative network, which is aware of social and spatial interactions, generates more socially and physically feasible trajectories.
- The novel idea of using the CARLA simulator and manual annotations to create multi-trajectory datasets can enable the evaluation of metrics across multiple predicted trajectories.
The remainder of this paper is organized as follows. Section 2 provides an overview of related works, and Section 3 introduces the problem definition along with our proposed prediction model. In Section 4, we present both the qualitative and quantitative results, comparing them with baselines and providing corresponding discussions. Finally, Section 5 concludes the paper.
2. Related Works
2.1. Social Interactions
Pedestrian trajectories are greatly influenced by nearby pedestrians, especially in congested areas, making the modeling of pedestrian social interactions crucial in forecasting pedestrian trajectories. One technique is to utilize a grid-based algorithm, such as social pooling [6], which builds a grid around the domain space of the target pedestrian and calculates the social hidden-state tensor in each cell using a process similar to average pooling. Many other works have also adopted this method [14,17,18,20,33], including the improved circular occupancy map [16] and angular grid [33]. Another non-grid method [24,26] embeds the relative position of other pedestrians with respect to the target pedestrian, similar to transformer position encoding [34,35], and then concatenates the relative position embeddings with the LSTM hidden states. The Multi-Layer Perceptron (MLP) and pooling layers then process the resulting vector to obtain the social vector. Attention-based approaches [22,23,36,37] acquire the influence weights of surrounding pedestrians on the target pedestrian in real time, while spatio-temporal graphs [11,21,25] consider each pedestrian as a node and encode spatio-temporal features using spatial-edge RNNs and temporal-edge RNNs. More complex, cross-spatio-temporal correlation features are learned and adaptively integrated into the spatial and temporal features [38]. Kothari et al. [26] summarized the design choices of social interaction modules and demonstrated equivalence between graph-based and LSTM-based pipelines. However, most of these methods only consider simple motion features as the factors influencing social interactions.
2.2. Spatial Interactions
Pedestrian trajectory prediction requires considering the effects of physical space and obstacles, which should be incorporated into the prediction network. To extract or represent the space features, three techniques are primarily used. The basic idea is to calculate the relative location of obstacles with respect to the target pedestrian [11,17] and incorporate this information, as well as the social hidden states, into the prediction network. For fixed obstacles, a grid-based technique [15] is employed that divides the scene into grid cells of equal size and labels the cells occupied by obstacles as 1 and those unoccupied as 0. A more sophisticated grid-based technique associates each cell with a crossing or reaching probability [14] or a semantic description [18], producing a reachability or navigation map. Another method is to use Convolutional Neural Networks (CNNs) to derive space features. For example, SoPhie [22] extracts visual features using a pre-trained VGG network, whereas Social-BiGAT [23] uses a top-down image perspective of the scenario through a CNN to obtain physical features. Our approach is similar to that of SoPhie, where we extract spatial characteristics via a CNN and employ scaled dot-product attention to process them, similar to Transformer [34].
2.3. Multimodality
Pedestrians can have multiple possible future trajectories. For instance, if a pedestrian walking straight encounters an obstacle, they may deviate either to the left or the right. One solution is to consider the pedestrian’s future trajectory as a probability distribution. The hidden state of the decoder LSTM is given to an MLP in LSTM-based algorithms to retrieve the mean, standard deviation, and covariance of a bivariate Gaussian distribution. Then, the predicted trajectory points are sampled from this distribution [6,14,25,26]. Additionally, the probability distribution of the trajectory endpoint can be modeled using a Gaussian mixture model [37,39,40]. Another approach is to use generative models [3,20,21,22,24] for future trajectory prediction. Generative models can learn the data distributions and map input noise vectors to multiple plausible future trajectories. Inspired by multimodal image-to-image translation, new GAN architectures like BicycleGAN [41] and Info-GAN [42] have been developed to increase the multimodality of predicted trajectories and prevent mode collapse [23,36]. However, previous studies have only evaluated their models’ performance on publicly available datasets like UCY and ETH, which contain only one ground-truth trajectory per pedestrian.
3. Problem Definition and Methods
3.1. Problem Definition
The goal of this paper is to predict short-term trajectory sequences for multiple pedestrians in a crowded environment. We observe the trajectory coordinates of N pedestrians for time steps in a video stream, which is denoted as for . Then, the future trajectory of pedestrian i is predicted as for the next time steps, while their ground-true trajectory is denoted as .
3.2. The Proposed SSA-GAN Model
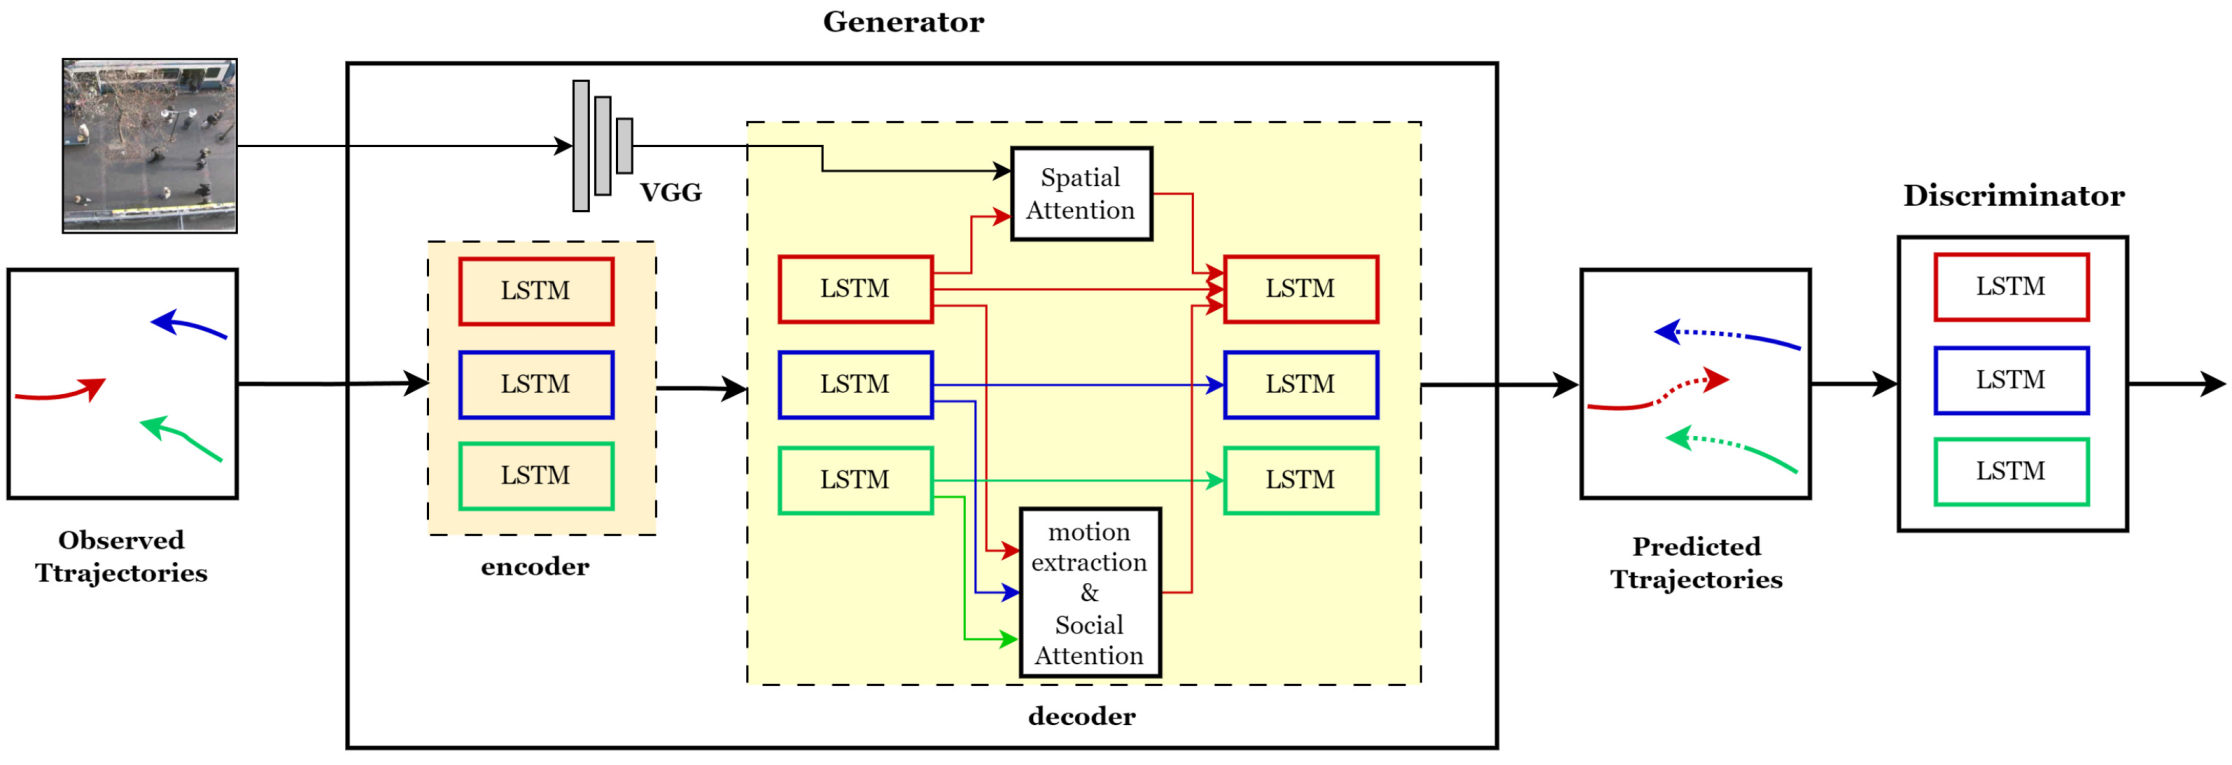
As shown in Figure 2, our model is an LSTM-based generative adversarial network consisting of a generator and a discriminator. The generator employs an encoder–decoder architecture. Based on the social force concept, the decoder uses several inputs to estimate pedestrian positions at each time step, including the features generated from the social and spatial interaction modules, the hidden states from the LSTM cells representing pedestrian intent, and random noise samples to emulate uncertain fluctuations and enhance the diversity of future trajectory generation. The discriminator, as in a typical GAN, evaluates the realism of the generated trajectory, motivating the generator to generate plausible future trajectories.

Figure 2.
The overall architecture of the proposed Social and Spatial Attentive Generative Adversarial Network (SSA-GAN), which is an Long Short-Term Memory (LSTM) based GAN. The generator’s decoder receives historical trajectory encodings from the encoder, features from the social attention and spatial attention modules, and randomly sampled noise to generate sequence predictions of pedestrian trajectories. Different colors represent the trajectories of different pedestrians and their LSTM flows.
3.3. Modeling Pedestrian Intent with LSTM
Important information about a pedestrian’s future direction and intent is encoded in the pedestrian trajectories over a short period of time. Thus, the features extracted from past trajectories can be considered as walking intent. The LSTM encoder is responsible for encoding the observed temporal trajectory, and its hidden state represents the pedestrian’s intention feature, as follows
where is the hidden state of the LSTM at time step t for pedestrian i, and is an embedding function parameterized by . represents the parameters of the LSTM. During the decoding process, the hidden state of the decoder LSTM is also considered as the pedestrian intent. records past trajectory information and is considered as the pedestrian intent.
3.4. Social Attention with Motion Features as the Query
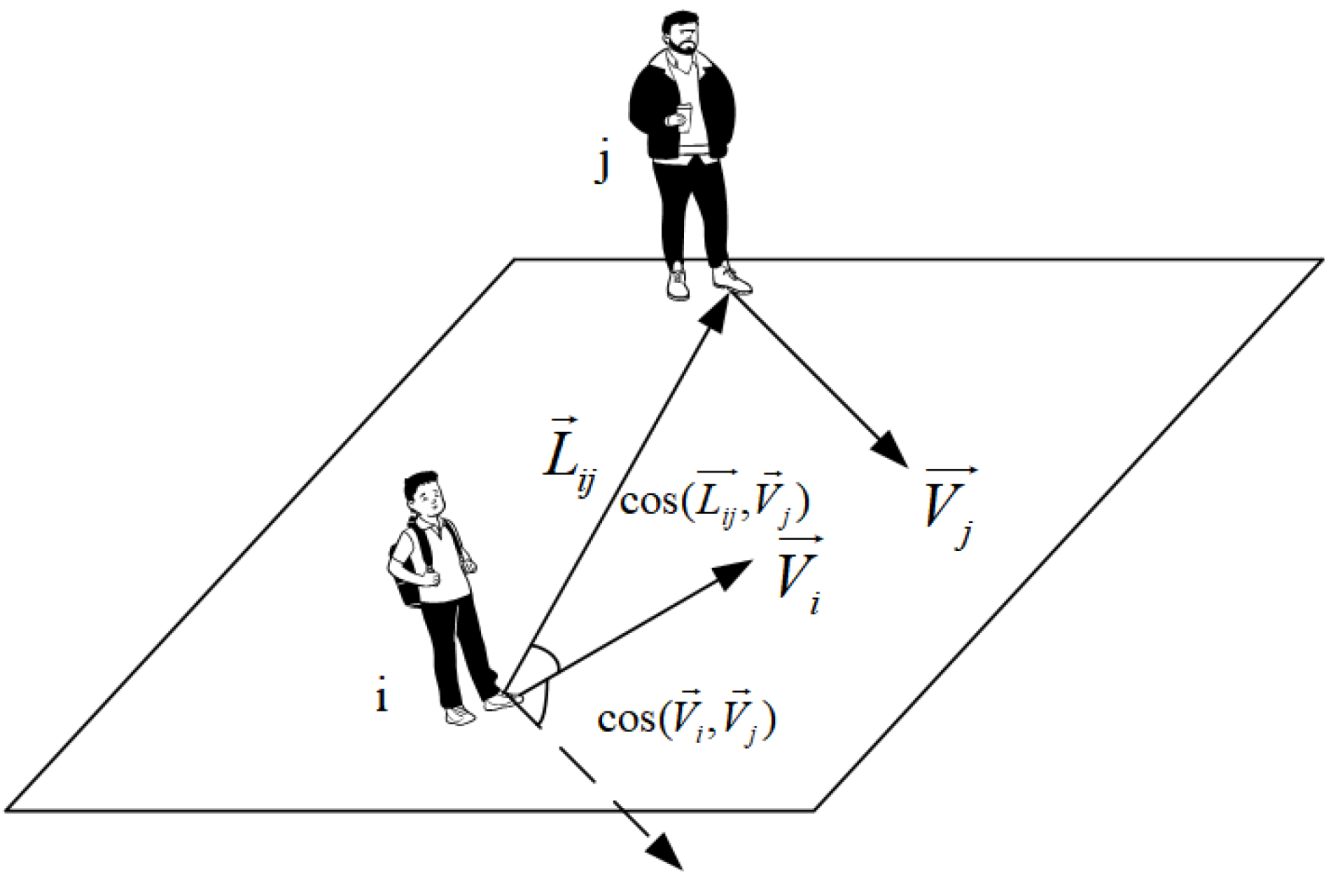
This paper models social interactions among pedestrians using an attention mechanism. The construction of a query is a crucial aspect that involves identifying the influential features of pedestrian social interactions. Prior research has mostly relied on the relative positions between pedestrians as the sole feature to model social interaction. To improve the model’s ability to accurately capture social interactions, this paper comprehensively extracts the motion features of pedestrians. For instance, considering target pedestrian i, the impact of pedestrian j is greater when the distance between them is shorter. Additionally, the speed of pedestrian j also has a significant impact, with running having a greater impact than walking. Moreover, the direction of pedestrian j is another key feature, with an approaching head-on motion having a greater impact than moving in the same direction. As a result, as shown in Figure 3, this paper chooses the distance between pedestrians, the speed of surrounding pedestrians, and the velocity angle as motion features to construct a query.
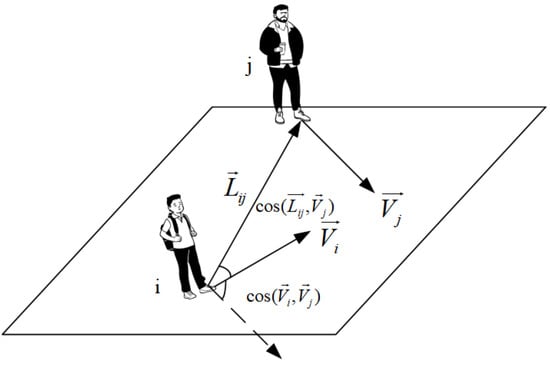
Figure 3.
Illustration of relative distance, speed, and velocity angle as the motion features.
The relative position vector and pedestrian velocity vector are calculated as
and the distance, speed, and velocity angle are derived as
The pedestrian’s motion feature is constructed and then concatenated as
Then, the motion feature is embedded via an MLP with a Rectified Linear Unit (ReLU)-type nonlinearity to obtain the motion vector as
The social attention module employs “Scaled Dot-Product Attention”, as presented in [34]. This module takes the pedestrian’s motion vector and the hidden states collection of every LSTM decoder and outputs the social interaction vector as follows
3.5. Spatial Attention with Semantic Spatial Features
The spatial layout of a scene can influence a pedestrian’s choice of route. We employ a VGG-19 model pretrained on ImageNet as the backbone network to extract spatial features, following the method outlined in [22]. To incorporate semantic information into the extracted features, we fine-tune the network on semantic segmentation tasks by slightly modifying the task head and employing a Full Convolutional Network (FCN) framework [43]. In our segmentation task, we classify the scene into 14 categories, including pedestrians, vehicles, sidewalks, buildings, grassland, and others. Ultimately, the semantic representation vector for the scene images is derived through the fine-tuned VGG network as
where represents the video frame at time step . Based on the scene feature vector , the spatial attention module receives the hidden state of pedestrian i at time step t and outputs the spatial interaction vector , as expressed by
3.6. GAN
Our approach uses the generative adversarial architecture [44] to facilitate multimodal trajectory prediction. The generator and discriminator are trained concurrently until the generator learns the distribution of pedestrian trajectories and can output diverse feasible future trajectories.
Our generator employs an LSTM as a decoder. At each time step, a noise vector z is sampled from a multivariate normal distribution representing uncertain fluctuations and embedded with the social interaction vector and spatial interaction vector to generate the input for the decoder LSTM. Then, the decoder LSTM processes this input and generates the hidden state at each time step. Subsequently, an MLP processes the hidden state to obtain the predicted trajectory coordinates as
The discriminator consists of an LSTM and an MLP. The LSTM combines the observed trajectory with a random sample of a future trajectory from either a predicted path or a ground-truth path as input. The corresponding input sequences are then encoded by the LSTM. At the final time step, a classification score is obtained by applying an MLP on the LSTM’s final hidden state as
with a score of 1 indicating a true trajectory and a score of 0 indicating a false trajectory.
The model’s loss function comprises two components: an adversarial min-max loss , which trains the GAN network, and an loss, which reflects the deviation from the real value. The total loss is determined as
where is a hyperparameter used to balance the two losses. The follows the typical GAN loss formulation [44],
To promote diverse predictions, the loss adopts a minimum-over-N-like loss, which entails sampling the random noise z for k times to generate k predicted samples [21]. Subsequently, the loss is computed as the minimum deviation from the true trajectory among the k predicted samples, that is,
Here, k is a hyperparameter that represents a trade-off between prediction accuracy and prediction diversity.
4. Experiments
The model’s performance is evaluated on two publicly accessible datasets, ETH [45] and UCY [46], as well as our self-created multi-trajectory datasets. We monitor pedestrian trajectories at 0.4 s intervals for 8 time steps and then utilize our model and other baselines to forecast the trajectories for the next 12 time steps. The qualitative and quantitative results comparing the accuracy and diversity capabilities of the proposed model with other baseline models are presented.
4.1. Experimental Setup
4.1.1. Datasets
The experiments were first conducted on two public datasets: ETH [45] and UCY [46]. The ETH dataset comprises two scenarios: Eth and Hotel. These scenarios contain a total of 650 tracks over 25 min. The UCY dataset includes three scenarios: Zara1, Zara2, and Univ. The Zara1 and Zara2 scenarios contain a total of 343 trajectories, and the Univ scenario contains 434 trajectories. These scenarios involve complex pedestrian behaviors, including walking in groups, avoiding collisions, and standing still.
We preprocessed the ETH and UCY datasets by eliminating pedestrian trajectories that did not satisfy the observation and prediction time length requirements, which need a trajectory containing more than 20 time steps. We then labeled the remaining valid trajectories with the pedestrian’s ID number, frame number, and two-dimensional coordinates at different time intervals. Following prior works [22,40], we used leave-one-out cross-validation to evaluate our model, i.e., training on four scenarios and testing on the remaining one.
Existing datasets such as ETH and UCY provide only a single ground-truth future pedestrian trajectory and do not offer multiple possible trajectories. To address this limitation, we used the CARLA simulator [47] to create the simulated multi-trajectory datasets (SMTD), which consist of two scenarios: Crossroad and Plaza. In the Crossroad scenario, 100 vehicles and 200 pedestrians move autonomously and randomly, following the default behavior of the CARLA simulator. In the Plaza scenario, 50 vehicles and 150 pedestrians are generated. We preprocessed the simulated trajectories using the same method used for the public datasets. Next, we manually labeled the multiple possible trajectories for the last 12 time steps of the pedestrian trajectories. Figure 4 shows an example of multi-trajectory labeling for one pedestrian. The red trajectory refers to the path simulated by the CARLA simulator, whereas the green trajectories represent all possible paths that the pedestrian could follow in the last 12 time steps. The simulated datasets are only used for evaluating multi-trajectory metrics.
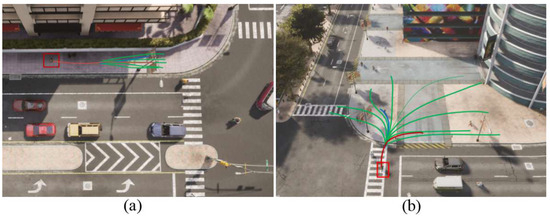
Figure 4.
Views of the two simulated scenarios, namely Crossroad (a) and Plaza (b). The red line in each scenario represents the trajectory of a pedestrian (enclosed in a red box) generated by the CARLA simulator. The green lines indicate the manually labeled possible paths for the last 12 time steps, covering all the potential paths the pedestrian could take. The blue line represents one of the generated predictions.
4.1.2. Baselines
The proposed SSA-GAN was compared to four baseline models to assess its performance: (1) Liner, a simple linear regressor; (2) S-LSTM [6], which features LSTMs with social pooling modules; (3) S-GAN [24], which utilizes social LSTMs under the adversarial nets framework; and (4) SoPhie [22], which incorporates social and physical attention into the S-GAN model.
4.1.3. Evaluation Metrics
Commonly, evaluation metrics based on a pedestrian’s single ground-truth trajectory are used. These metrics include [6]:
- The Average Displacement Error (ADE): The mean Euclidean distance between the predicted and ground-truth trajectories across all time steps.
- The Final Displacement Error (FDE): The distance between the last predicted point and the corresponding actual point at the final time step.
To assess the performance of the multimodal predictions, metrics that consider multiple possible trajectories were adopted, including:
- The Minimum Average Displacement Error (minADE): The minimum ADE of the predicted trajectories between all possible real trajectories.
- The Minimum Final Displacement Error (minFDE): The minimum FDE of the predicted endpoint over all possible real endpoints.
4.1.4. Implementation Details
Both the generator and discriminator were trained for 8000 epochs with a batch size of 64 using the Adam optimizer [48]. The learning rate was initially set to 0.001 and reduced by 0.9 every 2000 epochs. The in the loss function was set to 1, and the generator used 20 trajectory samples during training.
4.2. Quantitative Results
4.2.1. Comparison with Baselines
We compared our proposed model with four baseline models using the ADE and FED metrics on the ETH and UCY datasets, and the results are listed in Table 1. Our model achieved the best predictive performance with the lowest average ADE and FED errors across all five scenarios, indicating its superiority over the other models.

Table 1.
Comparison of our model with the four baselines on the ETH and UCY datasets. The prediction error metrics are the ADE and FDE in meters.
The linear model demonstrated poor predictive performance, except in the Hotel scenario, where pedestrian movement was predominantly linear with minimal interactions. In contrast, S-LSTM tended to predict the average value of future trajectories and performed poorly in multimodal trajectory prediction. In the Eth scenario, where pedestrians often entered sidewalks with high degrees of uncertainty, S-LSTM’s prediction error was considerably larger, as it could not generate diverse predictions. In contrast, generative adversarial networks could generate more plausible paths, leading to a greater diversity of predictions and better results.
While S-GAN and SoPhie considered the effects of neighboring pedestrians and the relative position of pedestrians in social interactions, our model considered all pedestrians in the scene and extracted not only the relative position but also the movement speed and velocity angle as motion features. Therefore, our model demonstrated better performance compared to S-GAN and SoPhie on the UCY datasets, where pedestrians have complex social interactions. For example, in the Zara2 scenario, our model demonstrated a 5.3% and 14.3% decrease in the ADE and FDE, respectively, compared to S-GAN and SoPhie.
4.2.2. Ablation Study
The roles of motion feature extraction and the social attention module were evaluated through ablation experiments. To validate the effectiveness of pedestrian motion features, we conducted two experiments. In the first experiment, we replaced the comprehensive motion features with only the relative positions of pedestrians as inputs into the social attention module. In the second experiment, we tested the effectiveness of the social attention module by replacing it with a social pooling module. The experimental results are listed in Table 2. After introducing the pedestrian motion features, the average ADE and FDE across all five scenarios decreased by 3.7% and 2.6%, respectively. This demonstrates that comprehensively considering the relative distance, speed, and velocity angle between pedestrians can more accurately capture the social interaction factors among them. However, in the Hotel scenario, where pedestrian movement is mostly linear and social interaction is weak, the introduction of motion feature extraction led to an increase in the ADE. After introducing social attention, compared to social pooling, the average ADE and FDE decreased by 5.4% and 2.6%, respectively, indicating that the attention mechanism is better suited to modeling complex pedestrian social interaction behavior.
Table 2.
Results of the ablation study. The three compared models are the full SSA-GAN, the SSA-GAN without comprehensive motion features, and the SSA-GAN without social attention. The prediction error metrics are the ADE and FDE in meters.
4.2.3. Evaluation on Multi-Trajectory Datasets
In addition to the ETH and UCY datasets, we evaluated the miniADE and minFDE metrics on the simulated multi-trajectory datasets. In this experiment, we utilized two models, SSA-GAN and S-GAN, to generate 25 predicted trajectories for each pedestrian. Next, we calculated the minADE and minFDE metrics. These metrics require identifying the trajectory with the smallest average ADE/FDE among the 25 trajectories generated by the models pertaining to multiple labeled trajectories in the simulated dataset. The benchmark used for this metric was the multiple feasible future trajectories. The computation involved determining the average error between the predicted trajectories and the multiple benchmark trajectories and identifying the minimum value in the process. Table 3 shows the results of both metrics for S-GAN and the proposed SSA-GAN. It can be seen that the SSA-GAN performed better on diverse trajectories, despite both methods having similar diversity loss functions. This can be attributed to the social attention and spatial attention mechanisms that we introduced into our model, which facilitate the exploration of more feasible trajectories.
Table 3.
Comparison of our model with S-GAN on the SMTD. The prediction error metrics are the minADE and minFDE in meters.
4.3. Qualitative Results
4.3.1. Social Attention with Motion Features
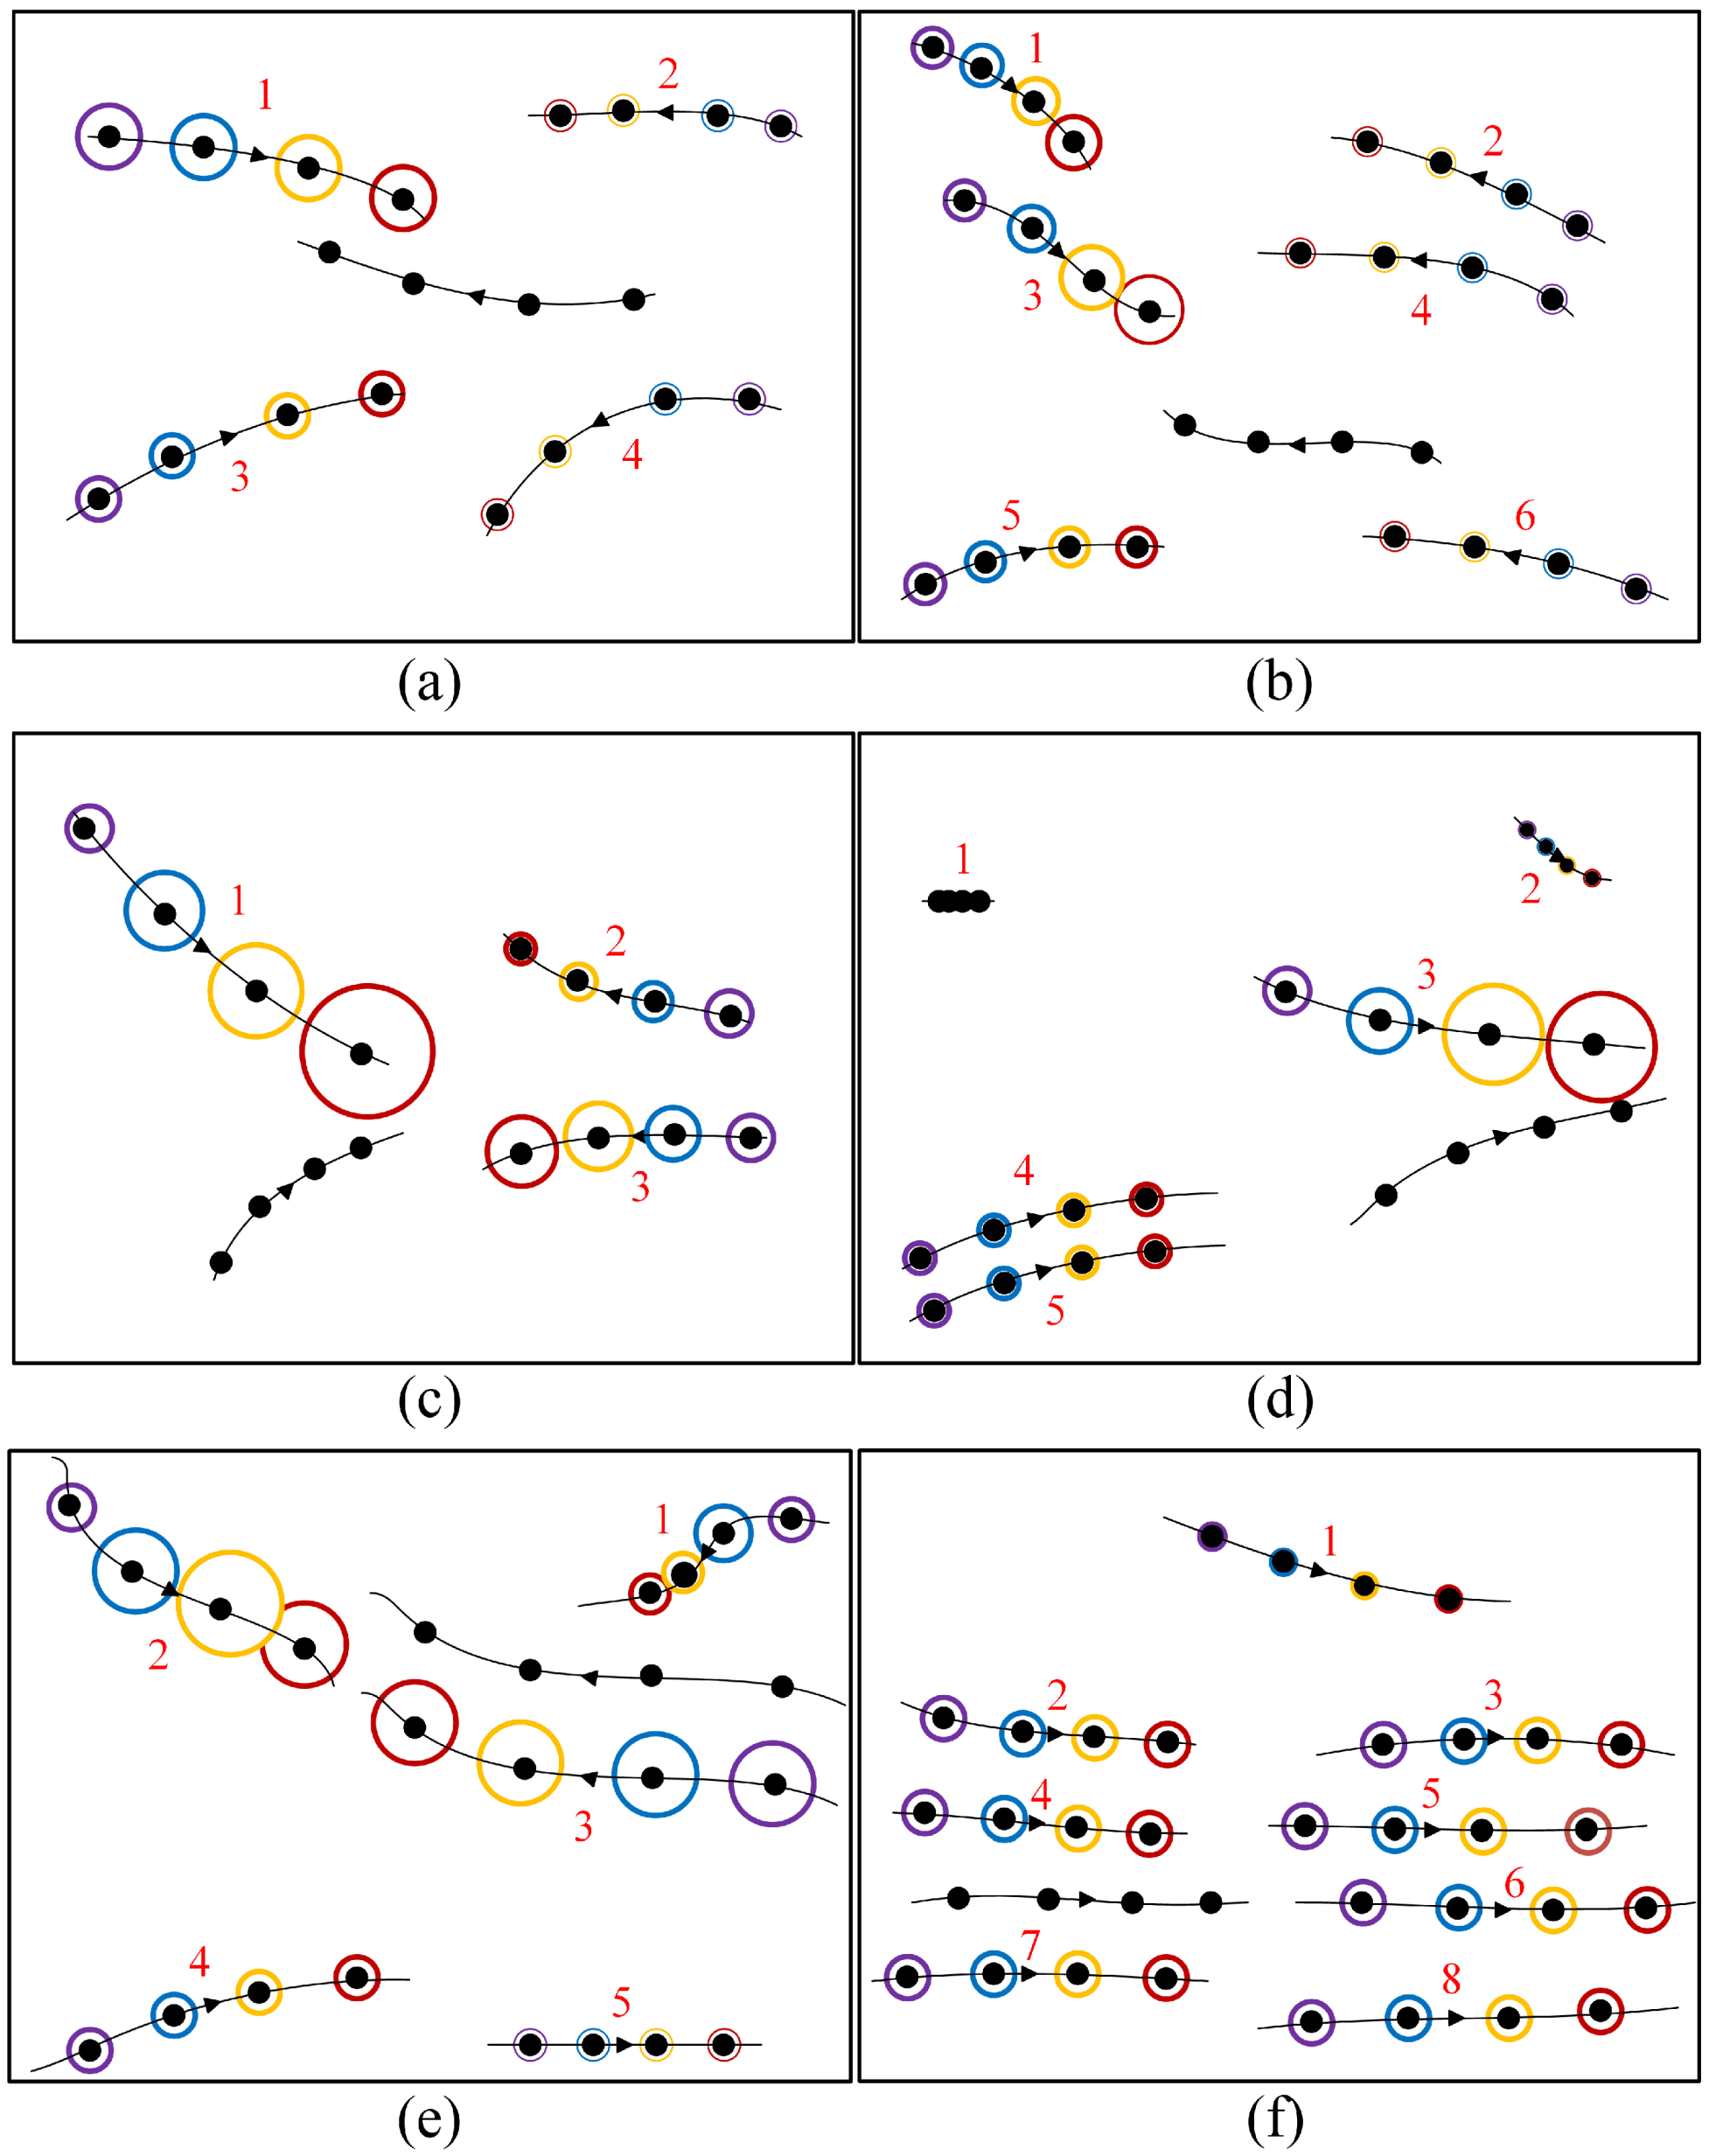
The role of the social attention module is demonstrated in Figure 5 through a visualization of the attention weights at various time steps. The target pedestrian trajectory is depicted by lines without numeric labels and circles, with the arrow indicating the forward direction. At each time step, the pedestrian’s position is denoted by black dots, and the distance traveled during a time step is illustrated by the length of the line segment between two consecutive dots, thereby reflecting the pedestrian’s speed. The remaining trajectories of the neighboring pedestrians are indicated using colored circles and numeric labels. The size of each circle reflects the social attention weight at that moment. The weights of the first to fourth time steps are represented using purple, blue, orange, and red circles, respectively.
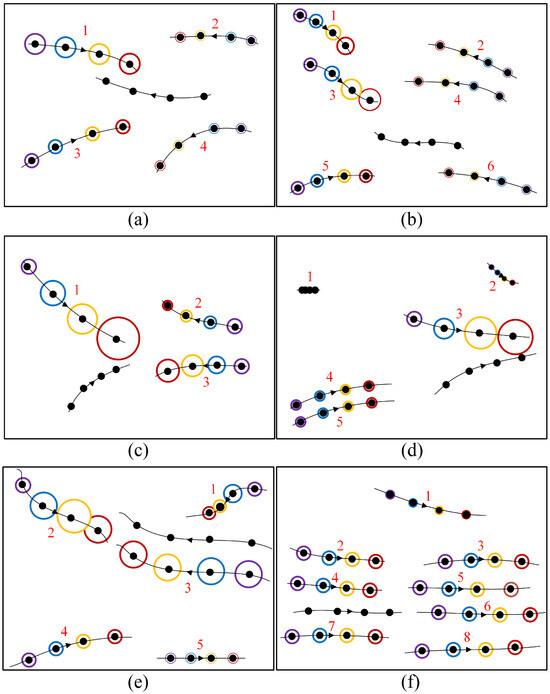
Figure 5.
Visualization of social attention weights for various pedestrian interactions: (a) Head-on walking; (b) head-on walking in denser crowds; (c) head-on walking with collision avoidance; (d) collision avoidance; (e) side-by-side walking with collision avoidance; (f) following and walking side by side. Each trajectory contains four positions (black dots) over four consecutive time steps, with arrows indicating the forward directions. Social attention weights for each time step are represented by purple, blue, orange, and red circles, respectively. The circle size corresponds to the social attention weight.
Figure 5a illustrates that pedestrians 1 and 3 move toward the target pedestrian head-on, while pedestrians 2 and 4 move in the same direction. Therefore, pedestrians 1 and 3 are assigned higher weights. As pedestrian 1 is the closest to the target pedestrian, it is assigned the highest attention weight. Figure 5b shows a similar attention-weight distribution in a denser crowd, where pedestrians moving head-on are assigned larger weights, and the closer the distance, the higher the weight. In Figure 5c, it can be seen that although pedestrian 3 moves in a head-on direction, pedestrian 1 moves quickly and is assigned larger weights at time steps 3 and 4. In Figure 5d, it can be seen that pedestrians 1 and 2 move slowly and are far from the target pedestrian, making their influence negligible. Pedestrian 3, being the closest to the target pedestrian and gradually approaching it, is assigned the highest weight. On the other hand, pedestrians 4 and 5 have a similar impact on the target pedestrian since they walk side by side. In Figure 5e, it can be seen that pedestrians 1 and 3 have a greater influence on the target pedestrian. Due to the possibility of a head-on collision, pedestrian 1 is assigned a larger attention weight at time step 3. In Figure 5f, it can be seen that pedestrians 2–8 walk along with the target pedestrian, maintaining their relative positions. Their relative speed is nearly zero, and the attention mechanism assigns them similar weights. These findings suggest that our proposed social attention mechanism based on comprehensive pedestrian motion features can effectively model social behaviors such as collision avoidance, parallelism, and accompaniment.
4.3.2. Multi-Trajectory Prediction Performance
Figure 6 showcases the SSA-GAN’s multi-trajectory prediction performance on simulated multi-trajectory datasets. In the figure, the red lines represent the target pedestrian’s trajectory obtained from the CARLA simulator, whereas the green lines represent manually annotated trajectories adhering to social norms. The purple area represents an envelope diagram containing the 25 predicted trajectories generated by the SSA-GAN, all of which fall within this area. The figure reveals that the SSA-GAN has a robust ability to generate diverse trajectories covering a range of plausible future trajectories across all four scenarios.
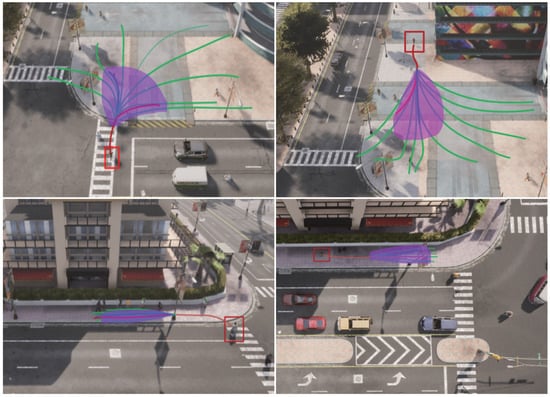
Figure 6.
Visualization of multi-trajectory prediction by our model in the Plaza and the Crossroad scenarios. The red line in each scenario represents the trajectory of a pedestrian (enclosed in a red box) generated by the CARLA simulator. The green lines indicate the manually labeled possible paths. The purple envelope diagrams indicate the ranges of the 25 predicted trajectories.
5. Conclusions
To more accurately model the influence of surrounding pedestrians and space on individual pedestrian behavior and generate diverse predicted future trajectories, this paper proposes a social and spatial attentive GAN. The social attention module uses comprehensive motion features, including a pedestrian’s relative distance, speed, and velocity angle, as key factors in social interactions, whereas the spatial attention module utilizes spatial features with semantic segmentation information. We also propose a method for utilizing the CARLA simulator to generate multi-trajectory datasets and better evaluate multimodal prediction performance. The effectiveness of our proposed model in modeling complex pedestrian interactions is demonstrated through experiments conducted on both single and simulated multi-trajectory datasets.
Similar to prior studies, our work is based on simulating pedestrian interactions through a fixed architecture network. As indicated in experiments, complex models can underperform in some simple scenarios, such as linear walking. Therefore, to further improve prediction accuracy, future research can explore networks with adaptive interaction modeling capacity.
Author Contributions
Conceptualization, P.C.; methodology, D.D.; software, D.D.; formal analysis, L.L.; investigation, L.L.; writing—original draft preparation, L.L.; writing—review and editing, P.C.; project administration, P.C.; funding acquisition, P.C. All authors have read and agreed to the published version of the manuscript.
Funding
This work is supported by grants from the National Natural Science Foundation of China (No. 62163014).
Data Availability Statement
The datasets generated and analyzed during the current study are available from the corresponding author upon reasonable request.
Conflicts of Interest
The authors declare no conflict of interest.
References
- Yang, C.T.; Zhang, T.; Chen, L.P.; Fu, L.C. Socially-Aware Navigation of Omnidirectional Mobile Robot with Extended Social Force Model in Multi-Human Environment. In Proceedings of the 2019 IEEE International Conference on Systems, Man and Cybernetics (SMC), Bari, Italy, 6–9 October 2019; pp. 1963–1968. [Google Scholar] [CrossRef]
- Haarslev, F.; Juel, W.K.; Kollakidou, A.; Krüger, N.; Bodenhagen, L. Context-aware Social Robot Navigation. In Proceedings of the 18th International Conference on Informatics in Control, Automation and Robotics, Paris, France, 6–8 July 2021; pp. 426–433. [Google Scholar] [CrossRef]
- Li, K.; Shan, M.; Narula, K.; Worrall, S.; Nebot, E. Socially Aware Crowd Navigation with Multimodal Pedestrian Trajectory Prediction for Autonomous Vehicles. In Proceedings of the IEEE 23rd International Conference on Intelligent Transportation Systems, Rhodes, Greece, 20–23 September 2020; pp. 1–8. [Google Scholar] [CrossRef]
- Uhlemann, N.; Fent, F.; Lienkamp, M. Evaluating Pedestrian Trajectory Prediction Methods for the Application in Autonomous Driving. arXiv 2023, arXiv:2308.05194. [Google Scholar]
- Rhinehart, N.; Mcallister, R.; Kitani, K.; Levine, S. PRECOG: PREdiction Conditioned on Goals in Visual Multi-Agent Settings. In Proceedings of the 2019 IEEE/CVF International Conference on Computer Vision (ICCV), Seoul, Republic of Korea, 27 October–2 November 2019; pp. 2821–2830. [Google Scholar] [CrossRef]
- Alahi, A.; Goel, K.; Ramanathan, V.; Robicquet, A.; Fei-Fei, L.; Savarese, S. Social LSTM: Human Trajectory Prediction in Crowded Spaces. In Proceedings of the 2016 IEEE Conference on Computer Vision and Pattern Recognition (CVPR), Las Vegas, NV, USA, 27–30 June 2016; pp. 961–971. [Google Scholar] [CrossRef]
- Rudenko, A.; Palmieri, L.; Herman, M.; Kitani, K.M.; Gavrila, D.M.; Arras, K.O. Human motion trajectory prediction: A survey. Int. J. Robot. Res. 2020, 39, 895–935. [Google Scholar] [CrossRef]
- Helbing, D.; Molnár, P. Social force model for pedestrian dynamics. Phys. Rev. E 1995, 51, 4282–4286. [Google Scholar] [CrossRef] [PubMed]
- Korbmacher, R.; Tordeux, A. Review of Pedestrian Trajectory Prediction Methods: Comparing Deep Learning and Knowledge-Based Approaches. IEEE Trans. Intell. Transp. Syst. 2022, 23, 24126–24144. [Google Scholar] [CrossRef]
- Golchoubian, M.; Ghafurian, M.; Dautenhahn, K.; Azad, N.L. Pedestrian Trajectory Prediction in Pedestrian-Vehicle Mixed Environments: A Systematic Review. IEEE Trans. Intell. Transp. Syst. 2023, 24, 11544–11567. [Google Scholar] [CrossRef]
- Haddad, S.; Wu, M.; Wei, H. Situation-Aware Pedestrian Trajectory Prediction with Spatio-Temporal Attention Model. arXiv 2019, arXiv:1902.05437. [Google Scholar]
- Xue, H.; Huynh, D.; Reynolds, M. Location-Velocity Attention for Pedestrian Trajectory Prediction. In Proceedings of the 2019 IEEE Winter Conference on Applications of Computer Vision (WACV), Waikoloa, HI, USA, 7–11 January 2019; pp. 2038–2047. [Google Scholar] [CrossRef]
- Zhang, P.; Ouyang, W.; Zhang, P.; Xue, J.; Zheng, N. SR-LSTM: State Refinement for LSTM Towards Pedestrian Trajectory Prediction. In Proceedings of the 2019 IEEE/CVF Conference on Computer Vision and Pattern Recognition (CVPR), Long Beach, CA, USA, 15–20 June 2019; pp. 12077–12086. [Google Scholar] [CrossRef]
- Varshneya, D.; Srinivasaraghavan, G. Human Trajectory Prediction using Spatially aware Deep Attention Models. arXiv 2017, arXiv:1705.09436. [Google Scholar]
- Song, X.; Chen, K.; Li, X.; Sun, J.; Hou, B.; Cui, Y.; Zhang, B.; Xiong, G.; Wang, Z. Pedestrian Trajectory Prediction Based on Deep Convolutional LSTM Network. IEEE Trans. Intell. Transp. Syst. 2021, 22, 3285–3302. [Google Scholar] [CrossRef]
- Xue, H.; Huynh, D.Q.; Reynolds, M. SS-LSTM: A Hierarchical LSTM Model for Pedestrian Trajectory Prediction. In Proceedings of the 2018 IEEE Winter Conference on Applications of Computer Vision (WACV), Lake Tahoe, NV, USA, 12–15 March 2018; pp. 1186–1194. [Google Scholar] [CrossRef]
- Bartoli, F.; Lisanti, G.; Ballan, L.; Del Bimbo, A. Context-Aware Trajectory Prediction. In Proceedings of the 2018 24th International Conference on Pattern Recognition (ICPR), Beijing, China, 20–24 August 2018; pp. 1941–1946. [Google Scholar] [CrossRef]
- Lisotto, M.; Coscia, P.; Ballan, L. Social and Scene-Aware Trajectory Prediction in Crowded Spaces. In Proceedings of the 2019 IEEE/CVF International Conference on Computer Vision Workshop (ICCVW), Seoul, Republic of Korea, 27–28 October 2019; pp. 2567–2574. [Google Scholar] [CrossRef]
- Zhang, P.; Xue, J.; Zhang, P.; Zheng, N.; Ouyang, W. Social-aware Pedestrian Trajectory Prediction via States Refinement LSTM. IEEE Trans. Pattern Anal. Mach. Intell. 2020, 44, 2742–2759. [Google Scholar] [CrossRef] [PubMed]
- Lee, N.; Choi, W.; Vernaza, P.; Choy, C.B.; Torr, P.H.S.; Chandraker, M. DESIRE: Distant Future Prediction in Dynamic Scenes with Interacting Agents. In Proceedings of the 2017 IEEE Conference on Computer Vision and Pattern Recognition (CVPR), Honolulu, HI, USA, 21–26 July 2017; pp. 2165–2174. [Google Scholar] [CrossRef]
- Huang, L.; Zhuang, J.; Cheng, X.; Xu, R.; Ma, H. STI-GAN: Multimodal Pedestrian Trajectory Prediction Using Spatiotemporal Interactions and a Generative Adversarial Network. IEEE Access 2021, 9, 50846–50856. [Google Scholar] [CrossRef]
- Sadeghian, A.; Kosaraju, V.; Sadeghian, A.; Hirose, N.; Rezatofighi, H.; Savarese, S. SoPhie: An Attentive GAN for Predicting Paths Compliant to Social and Physical Constraints. In Proceedings of the 2019 IEEE/CVF Conference on Computer Vision and Pattern Recognition (CVPR), Long Beach, CA, USA, 15–20 June 2019; pp. 1349–1358. [Google Scholar] [CrossRef]
- Kosaraju, V.; Sadeghian, A.; Roberto, M.M.; Reid, I.; Rezatofighi, S.H.; Savarese, S. Social-BiGAT: Multimodal Trajectory Forecasting using Bicycle-GAN and Graph Attention Networks. In Proceedings of the 33rd International Conference on Neural Information Processing Systems, Vancouver, BC, Canada, 8–14 December 2019; pp. 137–146. [Google Scholar]
- Gupta, A.; Johnson, J.; Fei-Fei, L.; Savarese, S.; Alahi, A. Social GAN: Socially Acceptable Trajectories with Generative Adversarial Networks. In Proceedings of the 2018 IEEE/CVF Conference on Computer Vision and Pattern Recognition, Salt Lake City, UT, USA, 18–23 June 2018; pp. 2255–2264. [Google Scholar] [CrossRef]
- Vemula, A.; Muelling, K.; Oh, J. Social Attention: Modeling Attention in Human Crowds. In Proceedings of the 2018 IEEE International Conference on Robotics and Automation (ICRA), Brisbane, QLD, Australia, 21–25 May 2018; pp. 1–7. [Google Scholar] [CrossRef]
- Kothari, P.; Kreiss, S.; Alahi, A. Human Trajectory Forecasting in Crowds: A Deep Learning Perspective. IEEE Trans. Intell. Transp. Syst. 2022, 23, 7386–7400. [Google Scholar] [CrossRef]
- Ma, Y.; Lee, E.W.M.; Yuen, R.K.K. An Artificial Intelligence-Based Approach for Simulating Pedestrian Movement. IEEE Trans. Intell. Transp. Systs. 2016, 17, 3159–3170. [Google Scholar] [CrossRef]
- Shi, X.; Shao, X.; Guo, Z.; Wu, G.; Zhang, H.; Shibasaki, R. Pedestrian Trajectory Prediction in Extremely Crowded Scenarios. Sensors 2019, 19, 1223. [Google Scholar] [CrossRef] [PubMed]
- Tordeux, A.; Chraibi, M.; Seyfried, A.; Schadschneider, A. Prediction of pedestrian dynamics in complex architectures with artificial neural networks. J. Intell. Transp. Syst. 2019, 24, 556–568. [Google Scholar] [CrossRef]
- Li, J.; Ma, H.; Zhang, Z.; Tomizuka, M. Social-WaGDAT: Interaction-aware Trajectory Prediction via Wasserstein Graph Double-Attention Network. arXiv 2020, arXiv:2002.06241. [Google Scholar]
- Fernando, T.; Denman, S.; Sridharan, S.; Fookes, C. Soft + Hardwired attention: An LSTM framework for human trajectory prediction and abnormal event detection. Neural Netw. 2018, 108, 466–478. [Google Scholar] [CrossRef] [PubMed]
- Yu, C.; Ma, X.; Ren, J.; Zhao, H.; Yi, S. Spatio-Temporal Graph Transformer Networks for Pedestrian Trajectory Prediction. In Proceedings of the Computer Vision—ECCV 2020, Glasgow, UK, 23–28 August 2020; pp. 507–523. [Google Scholar] [CrossRef]
- Zamboni, S.; Kefato, Z.T.; Girdzijauskas, S.; Norén, C.; Dal Col, L. Pedestrian trajectory prediction with convolutional neural networks. Pattern Recognit. 2022, 121, 108252. [Google Scholar] [CrossRef]
- Vaswani, A.; Shazeer, N.M.; Parmar, N.; Uszkoreit, J.; Jones, L.; Gomez, A.N.; Kaiser, L.; Polosukhin, I. Attention is All you Need. In Proceedings of the 31st International Conference on Neural Information Processing Systems, Long Beach, CA, USA, 4–9 December 2017; pp. 6000–6010. [Google Scholar]
- Liu, D.; Li, Q.; Li, S.; Kong, J.; Qi, M. Non-Autoregressive Sparse Transformer Networks for Pedestrian Trajectory Prediction. Appl. Sci. 2023, 13, 3296. [Google Scholar] [CrossRef]
- Amirian, J.; Hayet, J.B.; Pettre, J. Social Ways: Learning Multi-Modal Distributions of Pedestrian Trajectories With GANs. In Proceedings of the 2019 IEEE/CVF Conference on Computer Vision and Pattern Recognition Workshops (CVPRW), Long Beach, CA, USA, 16–17 June 2019; pp. 2964–2972. [Google Scholar] [CrossRef]
- Duan, J.; Wang, L.; Long, C.; Zhou, S.; Zheng, F.; Shi, L.; Hua, G. Complementary Attention Gated Network for Pedestrian Trajectory Prediction. In Proceedings of the AAAI Conference on Artificial Intelligence, Virtual, 22 February–1 March 2022; pp. 542–550. [Google Scholar] [CrossRef]
- Wu, Y.; Wang, L.; Zhou, S.; Duan, J.; Hua, G.; Tang, W. Multi-Stream Representation Learning for Pedestrian Trajectory Prediction. In Proceedings of the AAAI Conference on Artificial Intelligence, Washington DC, USA, 7–14 February 2023; pp. 2875–2882. [Google Scholar] [CrossRef]
- Zheng, F.; Wang, L.; Zhou, S.; Tang, W.; Niu, Z.; Zheng, N.; Hua, G. Unlimited Neighborhood Interaction for Heterogeneous Trajectory Prediction. In Proceedings of the 2021 IEEE/CVF International Conference on Computer Vision (ICCV), Montreal, QC, Canada, 10–17 October 2021; pp. 13148–13157. [Google Scholar] [CrossRef]
- Shi, L.; Wang, L.; Long, C.; Zhou, S.; Tang, W.; Zheng, N.; Hua, G. Representing Multimodal Behaviors With Mean Location for Pedestrian Trajectory Prediction. IEEE Trans. Pattern Anal. Mach. Intell. 2023, 45, 11184–11202. [Google Scholar] [CrossRef] [PubMed]
- Zhu, J.; Zhang, R.; Pathak, D.; Darrell, T.; Efros, A.A.; Wang, O.; Shechtman, E. Toward Multimodal Image-to-Image Translation. In Proceedings of the 31st International Conference on Neural Information Processing Systems, Long Beach, CA, USA, 4–9 December 2017; pp. 465–476. [Google Scholar]
- Chen, X.; Duan, Y.; Houthooft, R.; Schulman, J.; Sutskever, I.; Abbeel, P. InfoGAN: Interpretable Representation Learning by Information Maximizing Generative Adversarial Nets. In Proceedings of the 30th International Conference on Neural Information Processing Systems, Barcelona, Spain, 5–10 December 2016; pp. 2180–2188. [Google Scholar]
- Shelhamer, E.; Long, J.; Darrell, T. Fully convolutional networks for semantic segmentation. In Proceedings of the 2015 IEEE Conference on Computer Vision and Pattern Recognition (CVPR), Boston, MA, USA, 7–12 June 2015; pp. 3431–3440. [Google Scholar] [CrossRef]
- Goodfellow, I.J.; Pouget-Abadie, J.; Mirza, M.; Xu, B.; Warde-Farley, D.; Ozair, S.; Courville, A.C.; Bengio, Y. Generative Adversarial Nets. In Proceedings of the 27th International Conference on Neural Information Processing Systems, Montreal, QC, Canada, 8–13 December 2014; pp. 2672–2680. [Google Scholar]
- Pellegrini, S.; Ess, A.; Schindler, K.; van Gool, L. You’ll never walk alone: Modeling social behavior for multi-target tracking. In Proceedings of the IEEE 12th International Conference on Computer Vision, Kyoto, Japan, 29 September–2 October 2009; pp. 261–268. [Google Scholar] [CrossRef]
- Lerner, A.; Chrysanthou, Y.; Lischinski, D. Crowds by Example. Comput. Graph. Forum 2007, 26, 655–664. [Google Scholar] [CrossRef]
- Dosovitskiy, A.; Ros, G.; Codevilla, F.; Lopez, A.; Koltun, V. CARLA: An Open Urban Driving Simulator. In Proceedings of the 1st Annual Conference on Robot Learning, Mountain View, CA, USA, 13–15 November 2017; pp. 1–16. [Google Scholar]
- Kingma, D.P.; Ba, J. Adam: A Method for Stochastic Optimization. arXiv 2014, arXiv:1412.6980. [Google Scholar]


Disclaimer/Publisher’s Note: The statements, opinions and data contained in all publications are solely those of the individual author(s) and contributor(s) and not of MDPI and/or the editor(s). MDPI and/or the editor(s) disclaim responsibility for any injury to people or property resulting from any ideas, methods, instructions or products referred to in the content. |
© 2023 by the authors. Licensee MDPI, Basel, Switzerland. This article is an open access article distributed under the terms and conditions of the Creative Commons Attribution (CC BY) license (https://creativecommons.org/licenses/by/4.0/).