1. Introduction
Hematopoiesis, the remarkable process responsible for blood cell formation, is orchestrated by a hierarchy of specialized cells. At its core are hematopoietic stem cells, the ultimate architects of this symphony. These versatile cells possess the unique ability to self-renew and differentiate into various lineages. From them, progenitor cells emerge, committed to specific blood cell types like red blood cells, white blood cells, and platelets. Progenitor cells then give rise to precursor cells, which exhibit more specialized traits and characteristics. Finally, precursor cells mature into fully functional blood cells, capable of carrying out their vital roles in oxygen transport, immune defense, and clotting. The presence of precursor cells in the bloodstream is essential to maintain a dynamic reservoir, ready to respond to the body’s ever-changing demands for blood cells, ensuring a constant supply to sustain life and preserve health [
1].
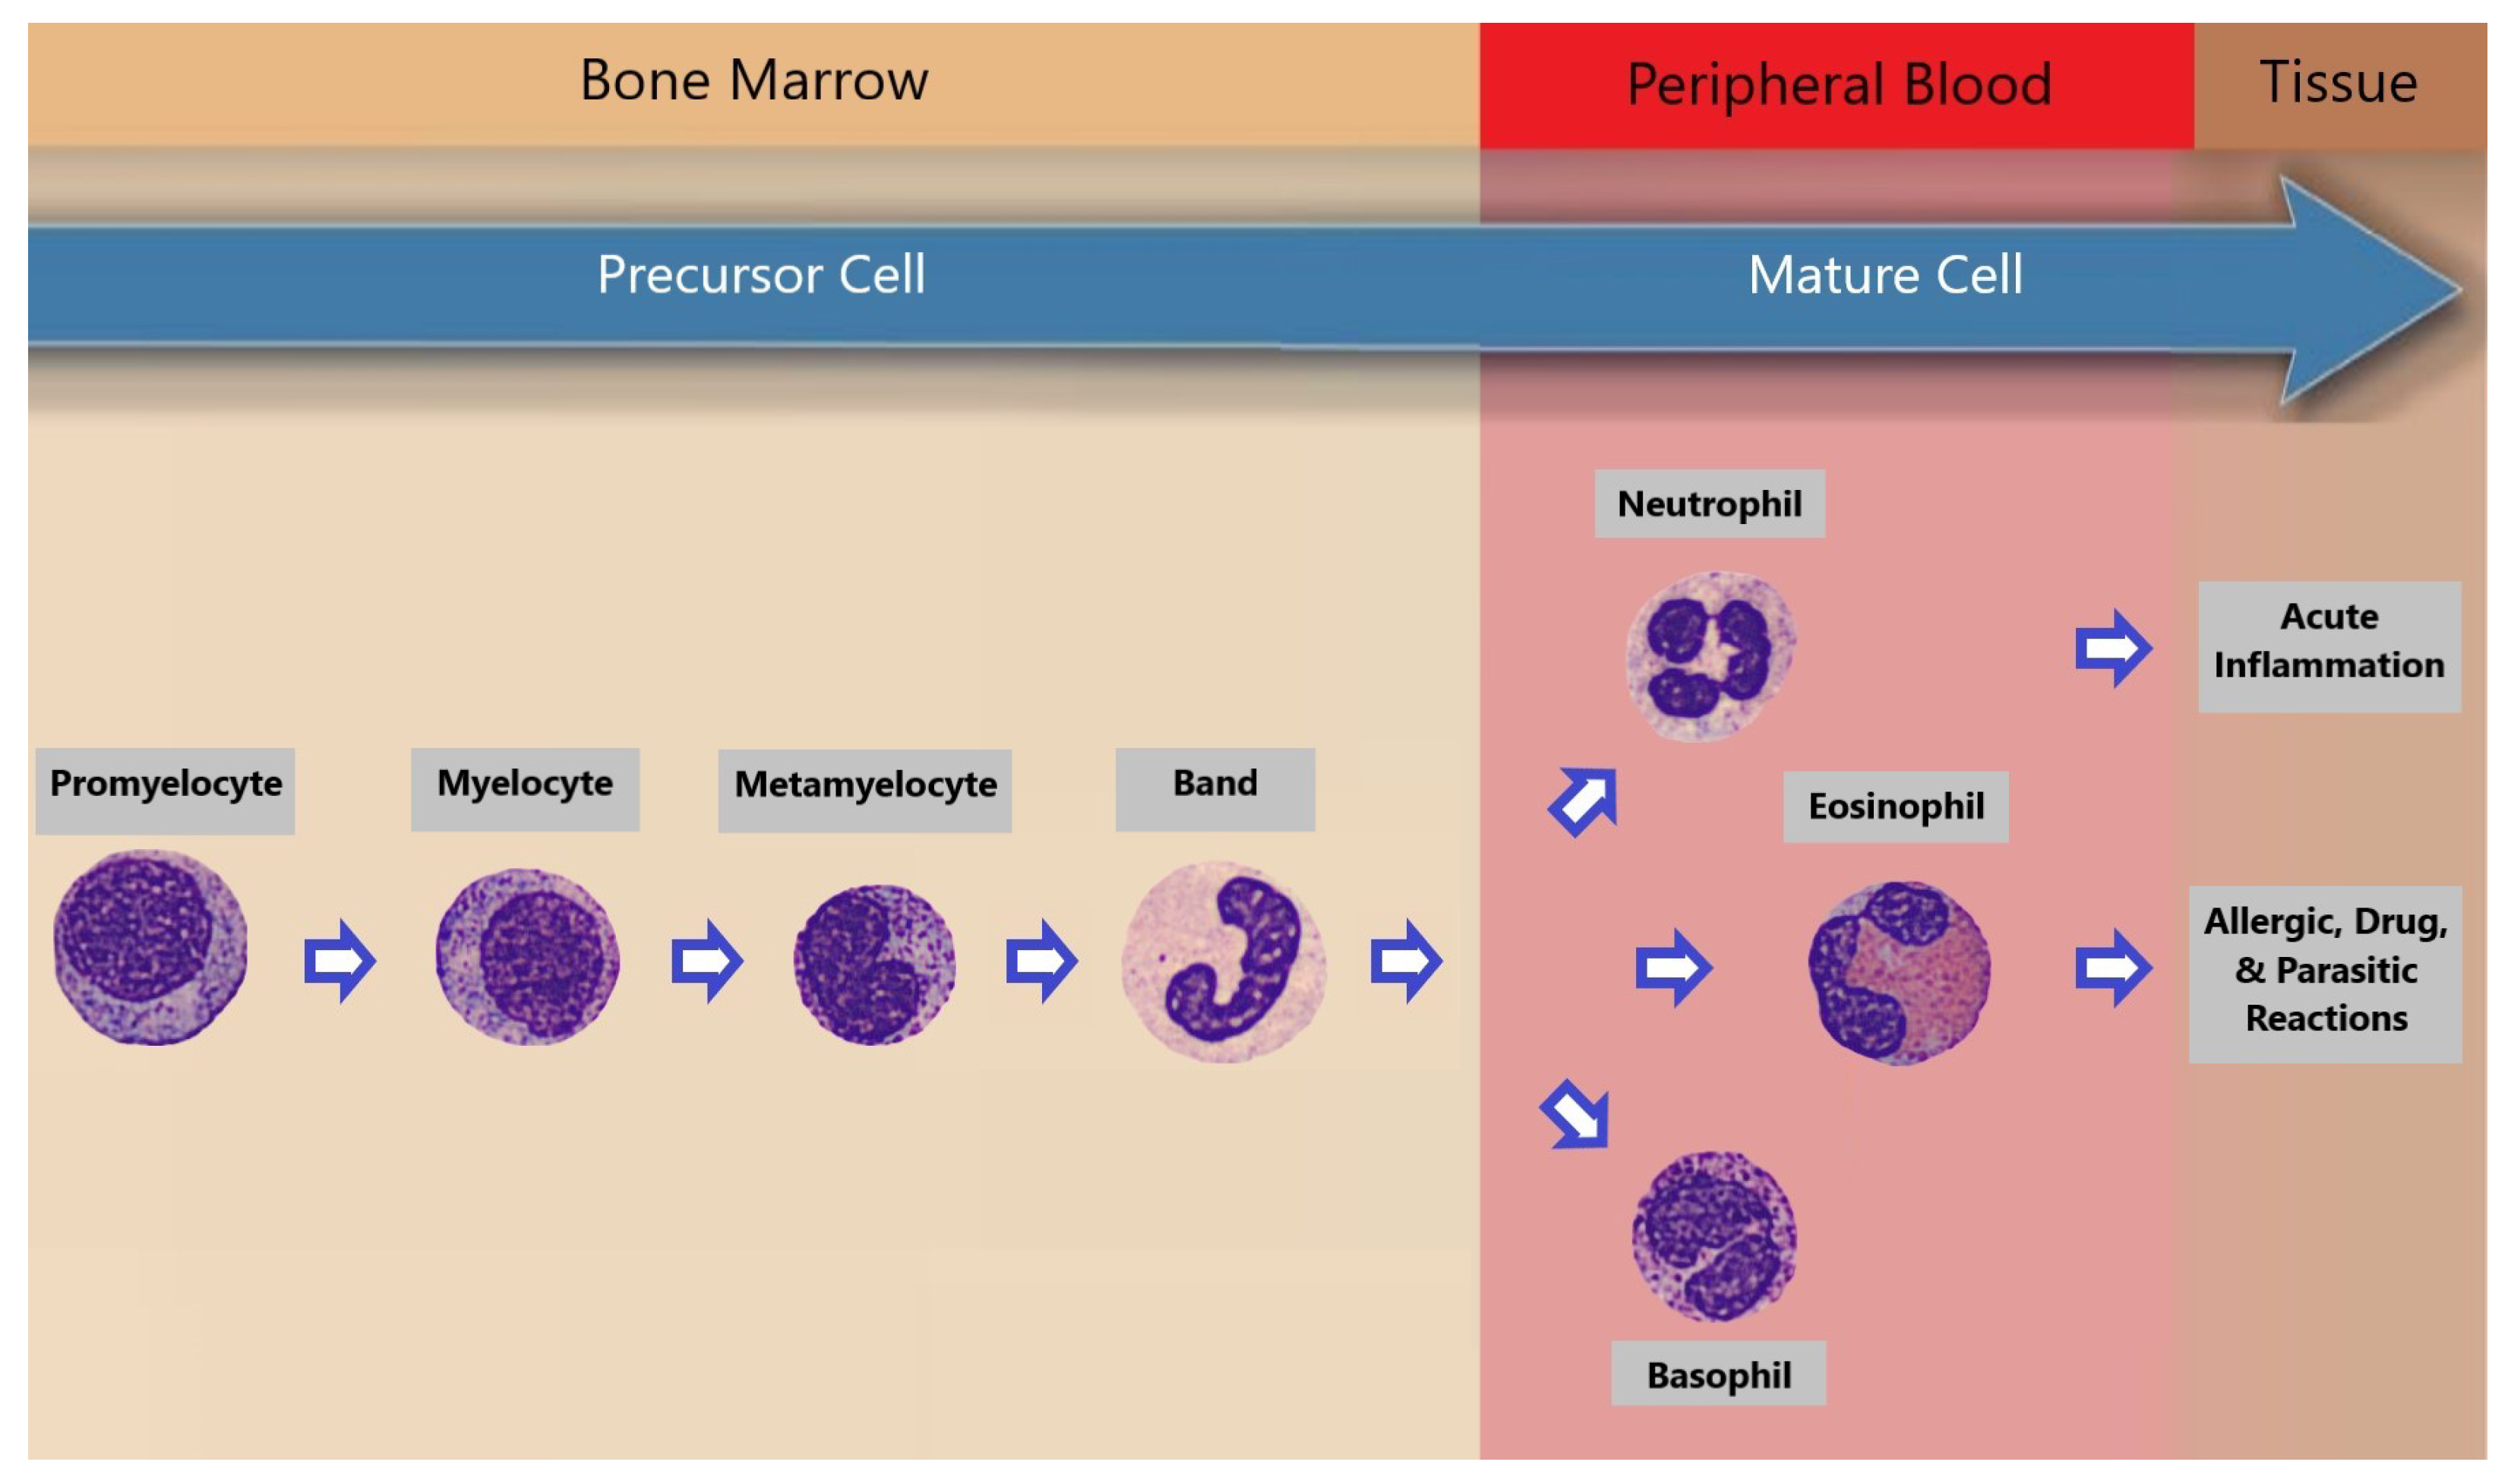
The transition from promyelocyte to the differentiated granulocytes—neutrophils, eosinophils, and basophils—constitutes a pivotal and intricately regulated process in hematopoiesis. This maturation journey encompasses distinct phases, each characterized by unique morphological and functional features. Following the promyelocyte stage, myelocytes emerge as granule-containing precursors, evolving into metamyelocytes, which display a progressive transformation in nuclear morphology. Subsequently, the cells progress to the band cell stage, marked by a characteristic U-shaped or horseshoe-shaped nucleus. Finally, the culmination of this finely orchestrated process results in the development of fully mature neutrophils, eosinophils, and basophils, each armed with specialized functions crucial for immune surveillance and response. This sequential progression underscores the intricacy of granulopoiesis [
1], contributing to the generation of a diverse and highly specialized cellular arsenal essential for the maintenance of immune homeostasis.
Granulopoiesis [
1] refers to the process of formation and maturation of granulocytes, which are a type of white blood cell characterized by the presence of granules in their cytoplasm. Granulocytes include neutrophils, eosinophils, and basophils, each playing a distinct role in the immune system. Granulopoiesis takes place in the bone marrow, where hematopoietic stem cells differentiate and undergo a series of stages to give rise to mature granulocytes. The process involves the development and specialization of cells through various stages, such as myeloblasts, promyelocytes, myelocytes, metamyelocytes, and finally, the release of mature granulocytes into the bloodstream. Granulocytes play a crucial role in the body’s defense against infections, allergic reactions, and other immune responses.
Figure 1 offers a visually compelling depiction of granulopoiesis, showcasing the remarkable progression from promyelocyte to the ultimate maturation of neutrophils, eosinophils, and basophils. This visual narrative not only illuminates the intricacies of their development in the bone marrow but also underscores their subsequent presence in the peripheral blood and various tissues. The orchestrated journey depicted underscores the dynamic nature of these immune sentinels as they transition from the confines of the bone marrow into the bloodstream and tissues, where they play pivotal roles in safeguarding the body against infections and maintaining immune homeostasis.
A peripheral blood smear is a microscopic window into hematopoiesis, offering a quick and insightful view of blood cell types and any abnormalities, crucial for diagnosing and monitoring hematological conditions [
2].
In the realm of hematology, the meticulous examination of peripheral blood smears is vital for diagnosing blood disorders and guiding treatment Hematologists shoulder the burden of this labor-intensive manual process, scrutinizing countless blood cells with unwavering attention amidst a high workload and constant distractions. Their dedication is essential for precise diagnostics and patient care, given the criticality of the results they deliver [
2].
However, the field of hematology has witnessed a transformative evolution through deep learning, a subset of artificial intelligence. This advancement automates peripheral blood smear analysis, alleviating the challenges faced by hematologists. Deep learning algorithms swiftly process blood cells, identifying subtle abnormalities and providing rapid, consistent results. This automation eases the workload, reduces human error, and empowers healthcare experts to focus on intricate cases [
3].
As technology continues to advance, the fusion of deep learning and peripheral blood smear analysis promises to revolutionize blood disorder diagnosis and management, enhancing patient care outcomes [
3].
In recent years, the drive to automate peripheral blood smear analysis has gained momentum within hematology. Our study leverages the “Peripheral Blood Cel” (PBC) dataset, encompassing 11 distinct blood cell classes, offering a comprehensive foundation for analysis [
4]. Challenges stemming from class imbalance in the PBC dataset are addressed with our innovative “Naturalize” augmentation technique.
The “Naturalize” method employs a two-step process to transform medical images, specifically peripheral blood cells. Initially, it utilizes the “Segment Anything Model” to selectively segment images into key cell classes. This segmentation is followed by the creation of composite images, where red and white blood cells are combined while maintaining authentic cell sizes and preventing overlap. Unlike conventional methods, “Naturalize” prioritizes specificity, providing precise control over image content and extending its adaptability beyond medical imaging to become a versatile tool for creating realistic and diverse datasets.
The predominant strength of the Naturalize augmentation technique lies in its strategic incorporation of random selection and subsequent random addition of segmented blood cells. By integrating these elements into its methodology, Naturalize introduces an inherent variability that significantly enhances the authenticity and diversity of the generated composite images. This approach sets “Naturalize” apart as a powerful tool for producing realistic and varied datasets in medical imaging and beyond.
In addition, our approach incorporates state-of-the-art deep learning models, including ImageNet ConvNets [
5] and Vision Transformer (ViT) [
6], through techniques like transfer learning [
7,
8,
9], fine-tuning, and ensembling [
10]. Evaluation encompasses quantitative assessments using confusion matrices, classification reports [
11], and visual evaluations using tools like Score-CAM [
12].
These advancements, combined with the pioneering application of “Naturalize”, signify substantial progress in automating peripheral blood smear analysis. This paper delves deep into the methodologies and outcomes of these cutting-edge approaches, illuminating their potential to reshape the field of hematology.
After this introduction, the rest of the paper will continue as follows:
Section 2 highlights the relevant literature related to the detection and classification of blood cells using pre-trained CNNs and ViTs, and
Section 3 describes the methodology used in this study. In addition,
Section 4 presents the experimental results obtained using pre-trained ImageNet models and Google ViT for the blood cell classification. In
Section 5, an in-depth analysis of results is made. Finally, the conclusions of this work are presented in
Section 6.
2. Related Works
Within the realm of machine learning, the conventional approach involved the manual extraction of image features followed by classification. The advent of deep learning revolutionized this process by automating image classification, particularly impactful in blood cell analysis. Previous studies primarily concentrated on five white blood cell (WBC) types: neutrophils, eosinophils, basophils, lymphocytes, and monocytes. Distinguishing our research is the comprehensive classification of 11 distinct blood cell types, inclusive of segmented and banded neutrophils, introducing Meta-myelocyte, Myelocyte, Pro-myelocyte, erythroblasts, and platelets to the array. This expansion broadens the classification spectrum, redefining the scope of blood cell analysis.
Jung et al. [
13] introduced W-Net, a CNN-based model for white blood cell (WBC) classification, achieving 97% accuracy with 10-fold cross-validation. Their work focused on classifying five WBC types: neutrophils, eosinophils, basophils, lymphocytes, and monocytes. Sahlol et al. [
14] combined VGG-16 and a feature reduction algorithm (SESSA) to achieve 95.67% accuracy for WBC leukemia image classification. They categorized WBCs into five classes.
Almezhghwi et al. [
15] used ImageNet pre-trained architectures (VGG, ResNet, DenseNet) and data augmentation, with DenseNet-169 achieving 98.8% accuracy. Their study involved the classification of five WBC types. Tavakoli et al. [
16] developed a segmentation algorithm and used SVM for WBC classification, achieving high accuracy in multiple datasets. They focused on five WBC types.
Chen et al. [
17] proposed a hybrid deep model combining ResNet and DenseNet with a spatial and channel attention module (SCAM), outperforming previous methods. They worked with datasets containing five WBC types. Katar et al. [
18] applied transfer learning with ImageNet models, with MobileNet-V3-Small achieving 98.86% accuracy. They classified five WBC types.
Nahzat et al. [
19] designed a CNN-based model using the Kaggle BCCD dataset, achieving competitive results. They also focused on five WBC types. Heni et al. [
20] introduced the EK-Means method for WBC image segmentation, achieving a validation accuracy of 96.24% with VGG-19. They categorized five WBC types. Ziquan Zhu [
21,
22] presented DLBCNet models that used ResNet-50 for feature extraction and achieved impressive accuracy. They worked with datasets containing five WBC types.
Other groups of researchers [
23,
24,
25,
26,
27,
28] worked on the classification of 8 blood classes in the the PBC dataset [
4].
Table 1 summarizes the work of those groups.
Distinguishing our research is the expansion of blood cell classification into 11 distinct classes and the groundbreaking “Naturalize” augmentation technique. The shift from 8 to 11 classes presents a notable challenge due to the increased complexity in differentiating these new classes, particularly in cases such as pro-myelocyte, myelocyte, and meta-myelocyte, where the number of available images is insufficient.
The “Naturalize” technique directly tackles two prominent challenges in deep learning: data insufficiency and class imbalance. In the realm of deep learning, the quality and balance of data significantly impact model performance. “Naturalize” effectively addresses these challenges by generating high-quality blood cell samples, thereby augmenting our dataset. This innovative approach substantially enhances the performance of blood cell classification, pushing the boundaries of deep learning in blood cell analysis. Not only does it improve accuracy, but it also ensures robustness and reliability when handling diverse and imbalanced blood cell classes.
By broadening the classification scope to encompass 11 blood cell types and introducing the transformative “Naturalize” method, our research ushers in a new era in automated blood cell analysis. It adeptly addresses persistent challenges in deep learning, creating a more consistent framework and promising significant enhancements in diagnostic precision. Ultimately, these advancements contribute to improved patient care and medical outcomes.
3. Materials and Methods
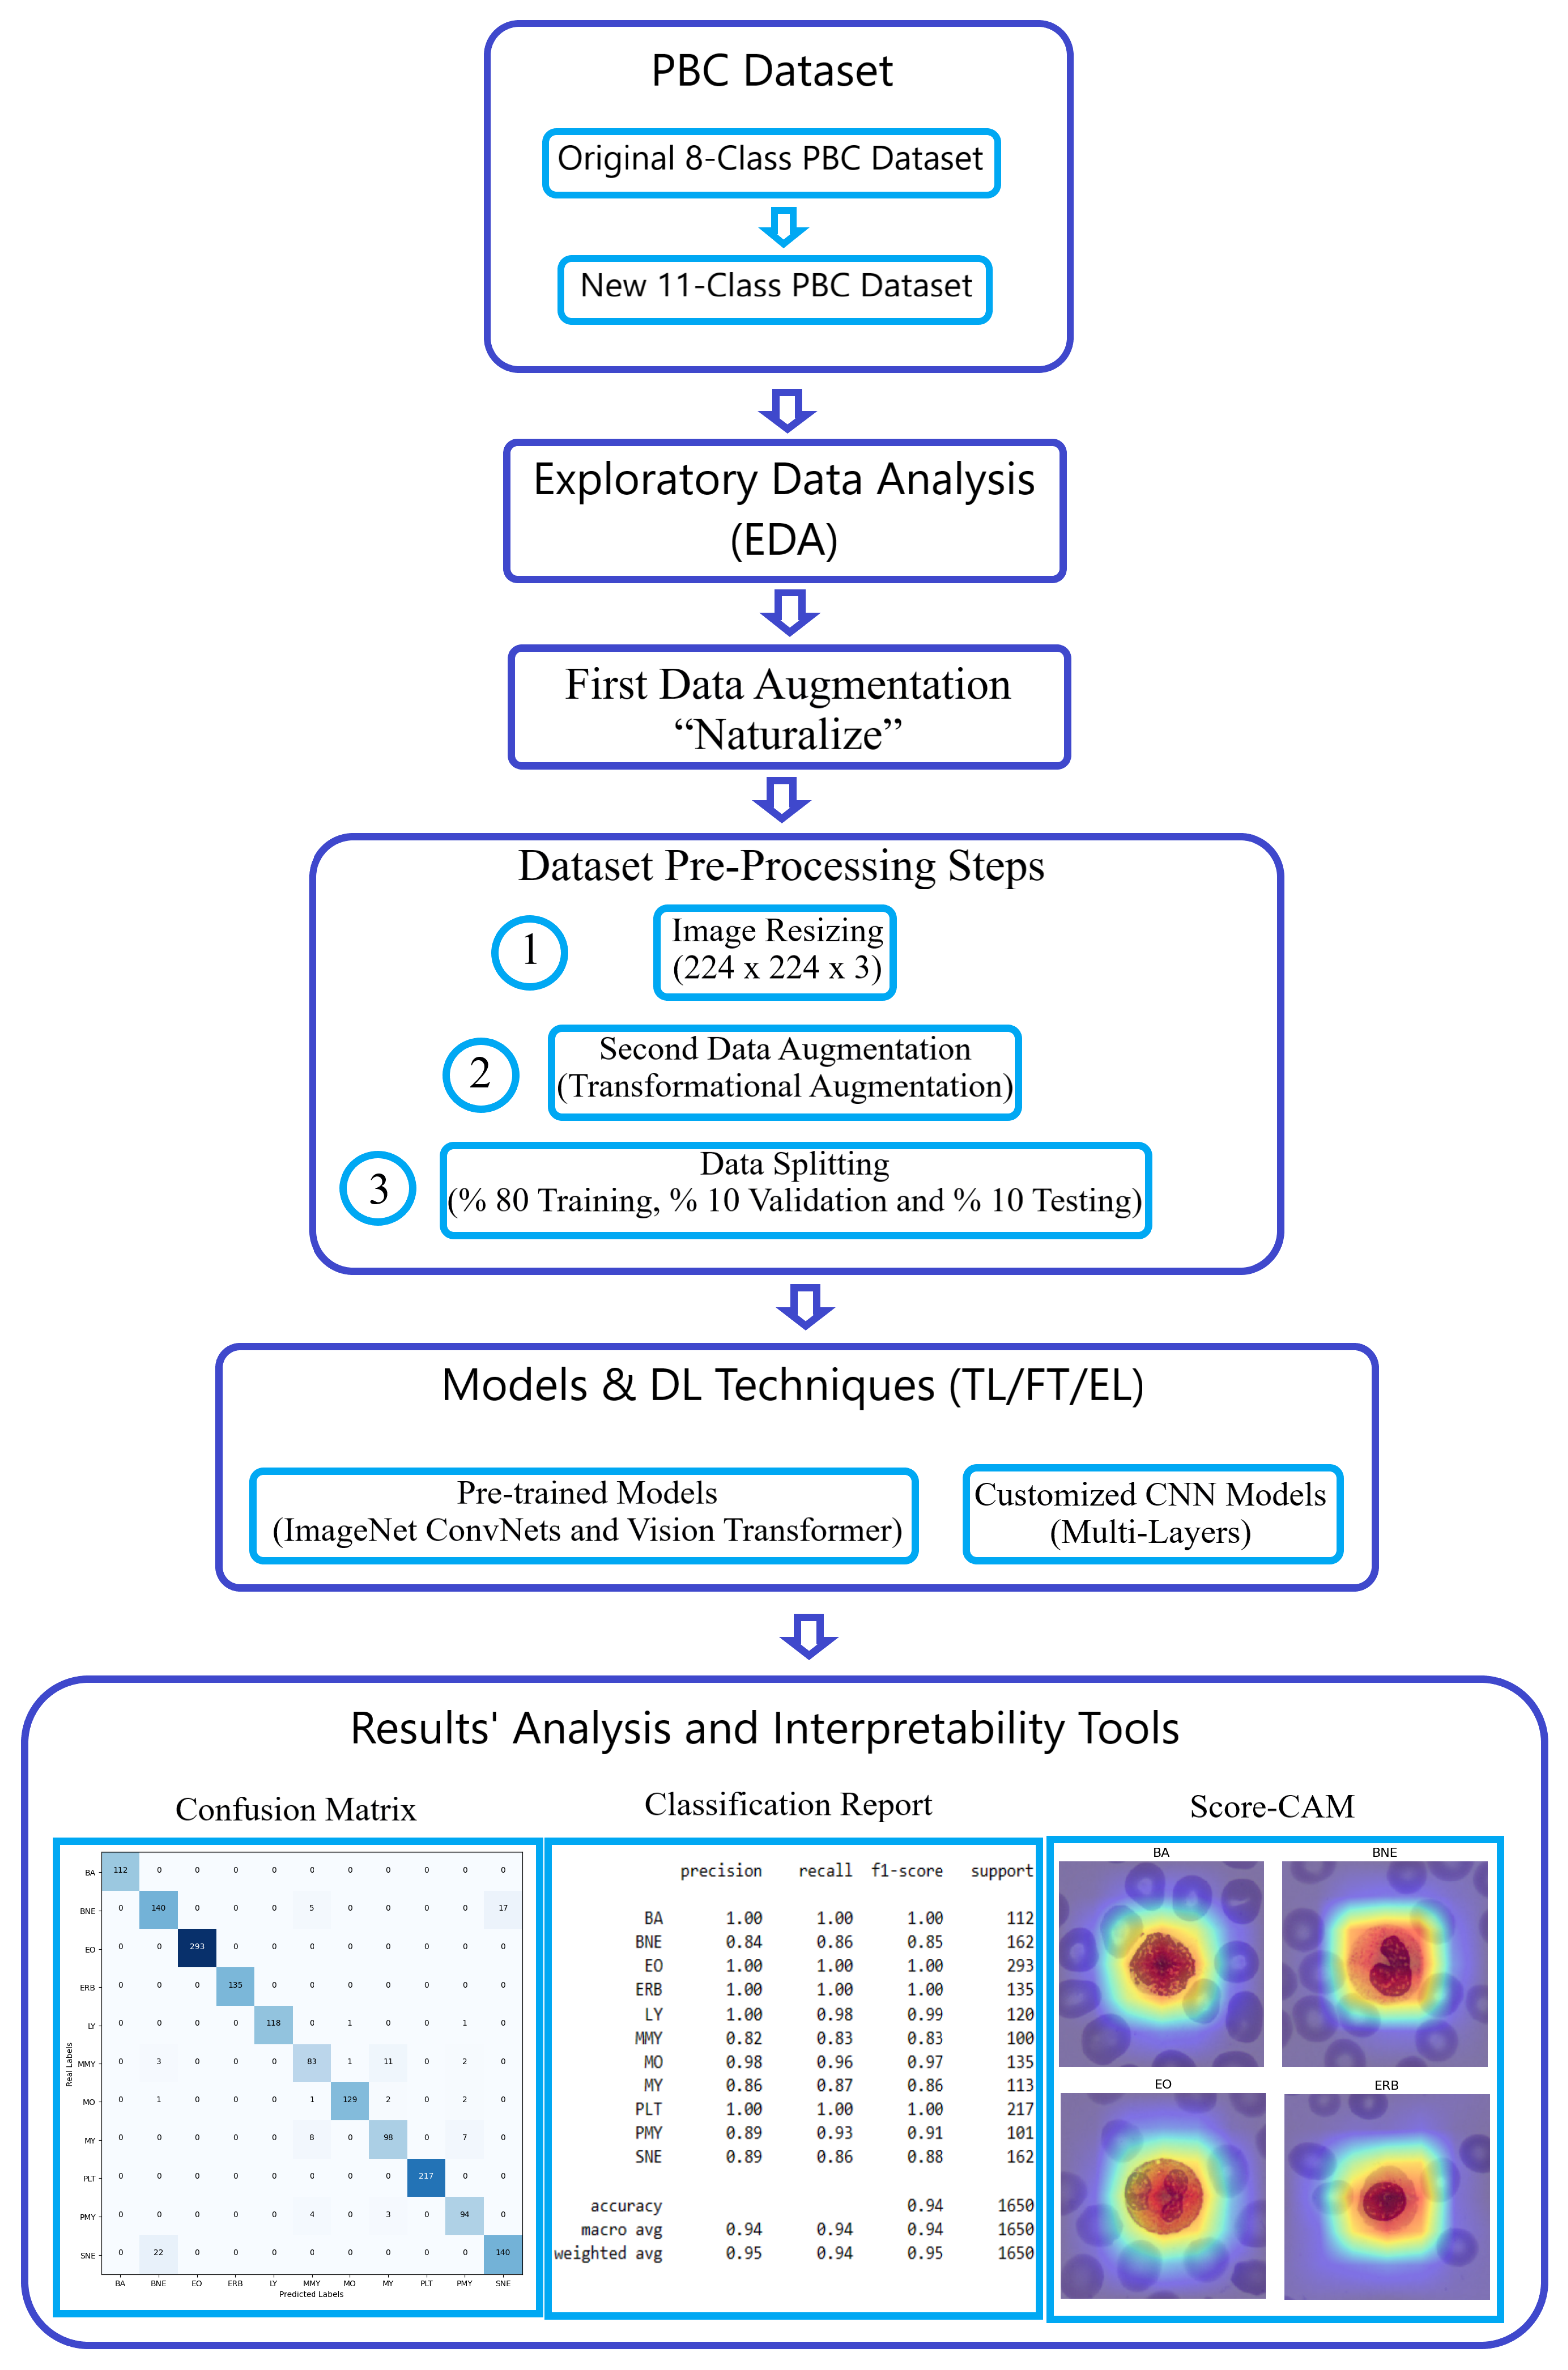
This section offers an detailed exposition of our methodology, designed to elevate blood cell image classification within the challenging Peripheral Blood Cell (PBC) dataset to an exceptional level of precision. Our classification endeavor leveraged the power of pre-trained Deep Learning (DL) architectures, prominently featuring the “ImageNet ConvNets” and “Keras Vision Transformers (ViT)”. We harnessed the ingenious “Naturalize” augmentation technique, strategically addressing data insufficiencies in certain classes, such as pro-myelocyte, while concurrently expanding the available image data in other classes. The sheer breadth and sophistication of our methodology are vividly depicted in
Figure 2, a testament to our unwavering commitment to advancing the frontiers of image classification.
3.1. PBC Dataset
3.1.1. Original 8-Class PBC Dataset
The original PBC dataset [
4], sourced from an online repository, encompasses 17,092 images categorized into eight distinct classes of blood cells. These eight classes include neutrophils, eosinophils, basophils, lymphocytes, monocytes, immature granulocytes, erythroblasts, and platelets (thrombocytes).
This means the original PBC contains 8 folders. The “Immature Cells” folder contains three classes labeled as “Pro-myelocyte”, “Myelocyte”, and “Meta-myelocyte”. Also, the “Neutrophil” folder contains two labeled classes “Banded Neutrophil” and “Segmented Neutrophil”. Thus, the total number of classes in the original PBC dataset is 11 classes.
Table 2 provides an overview of the distribution of the eight blood cell classes within the original PBC dataset.
The images in the PBC dataset adhere to a standard size of 360 × 363 pixels [
4], which closely matches the input size of ImageNet models and the Google ViT, minimizing the need for significant resizing.
3.1.2. New 11-Class PBC Dataset
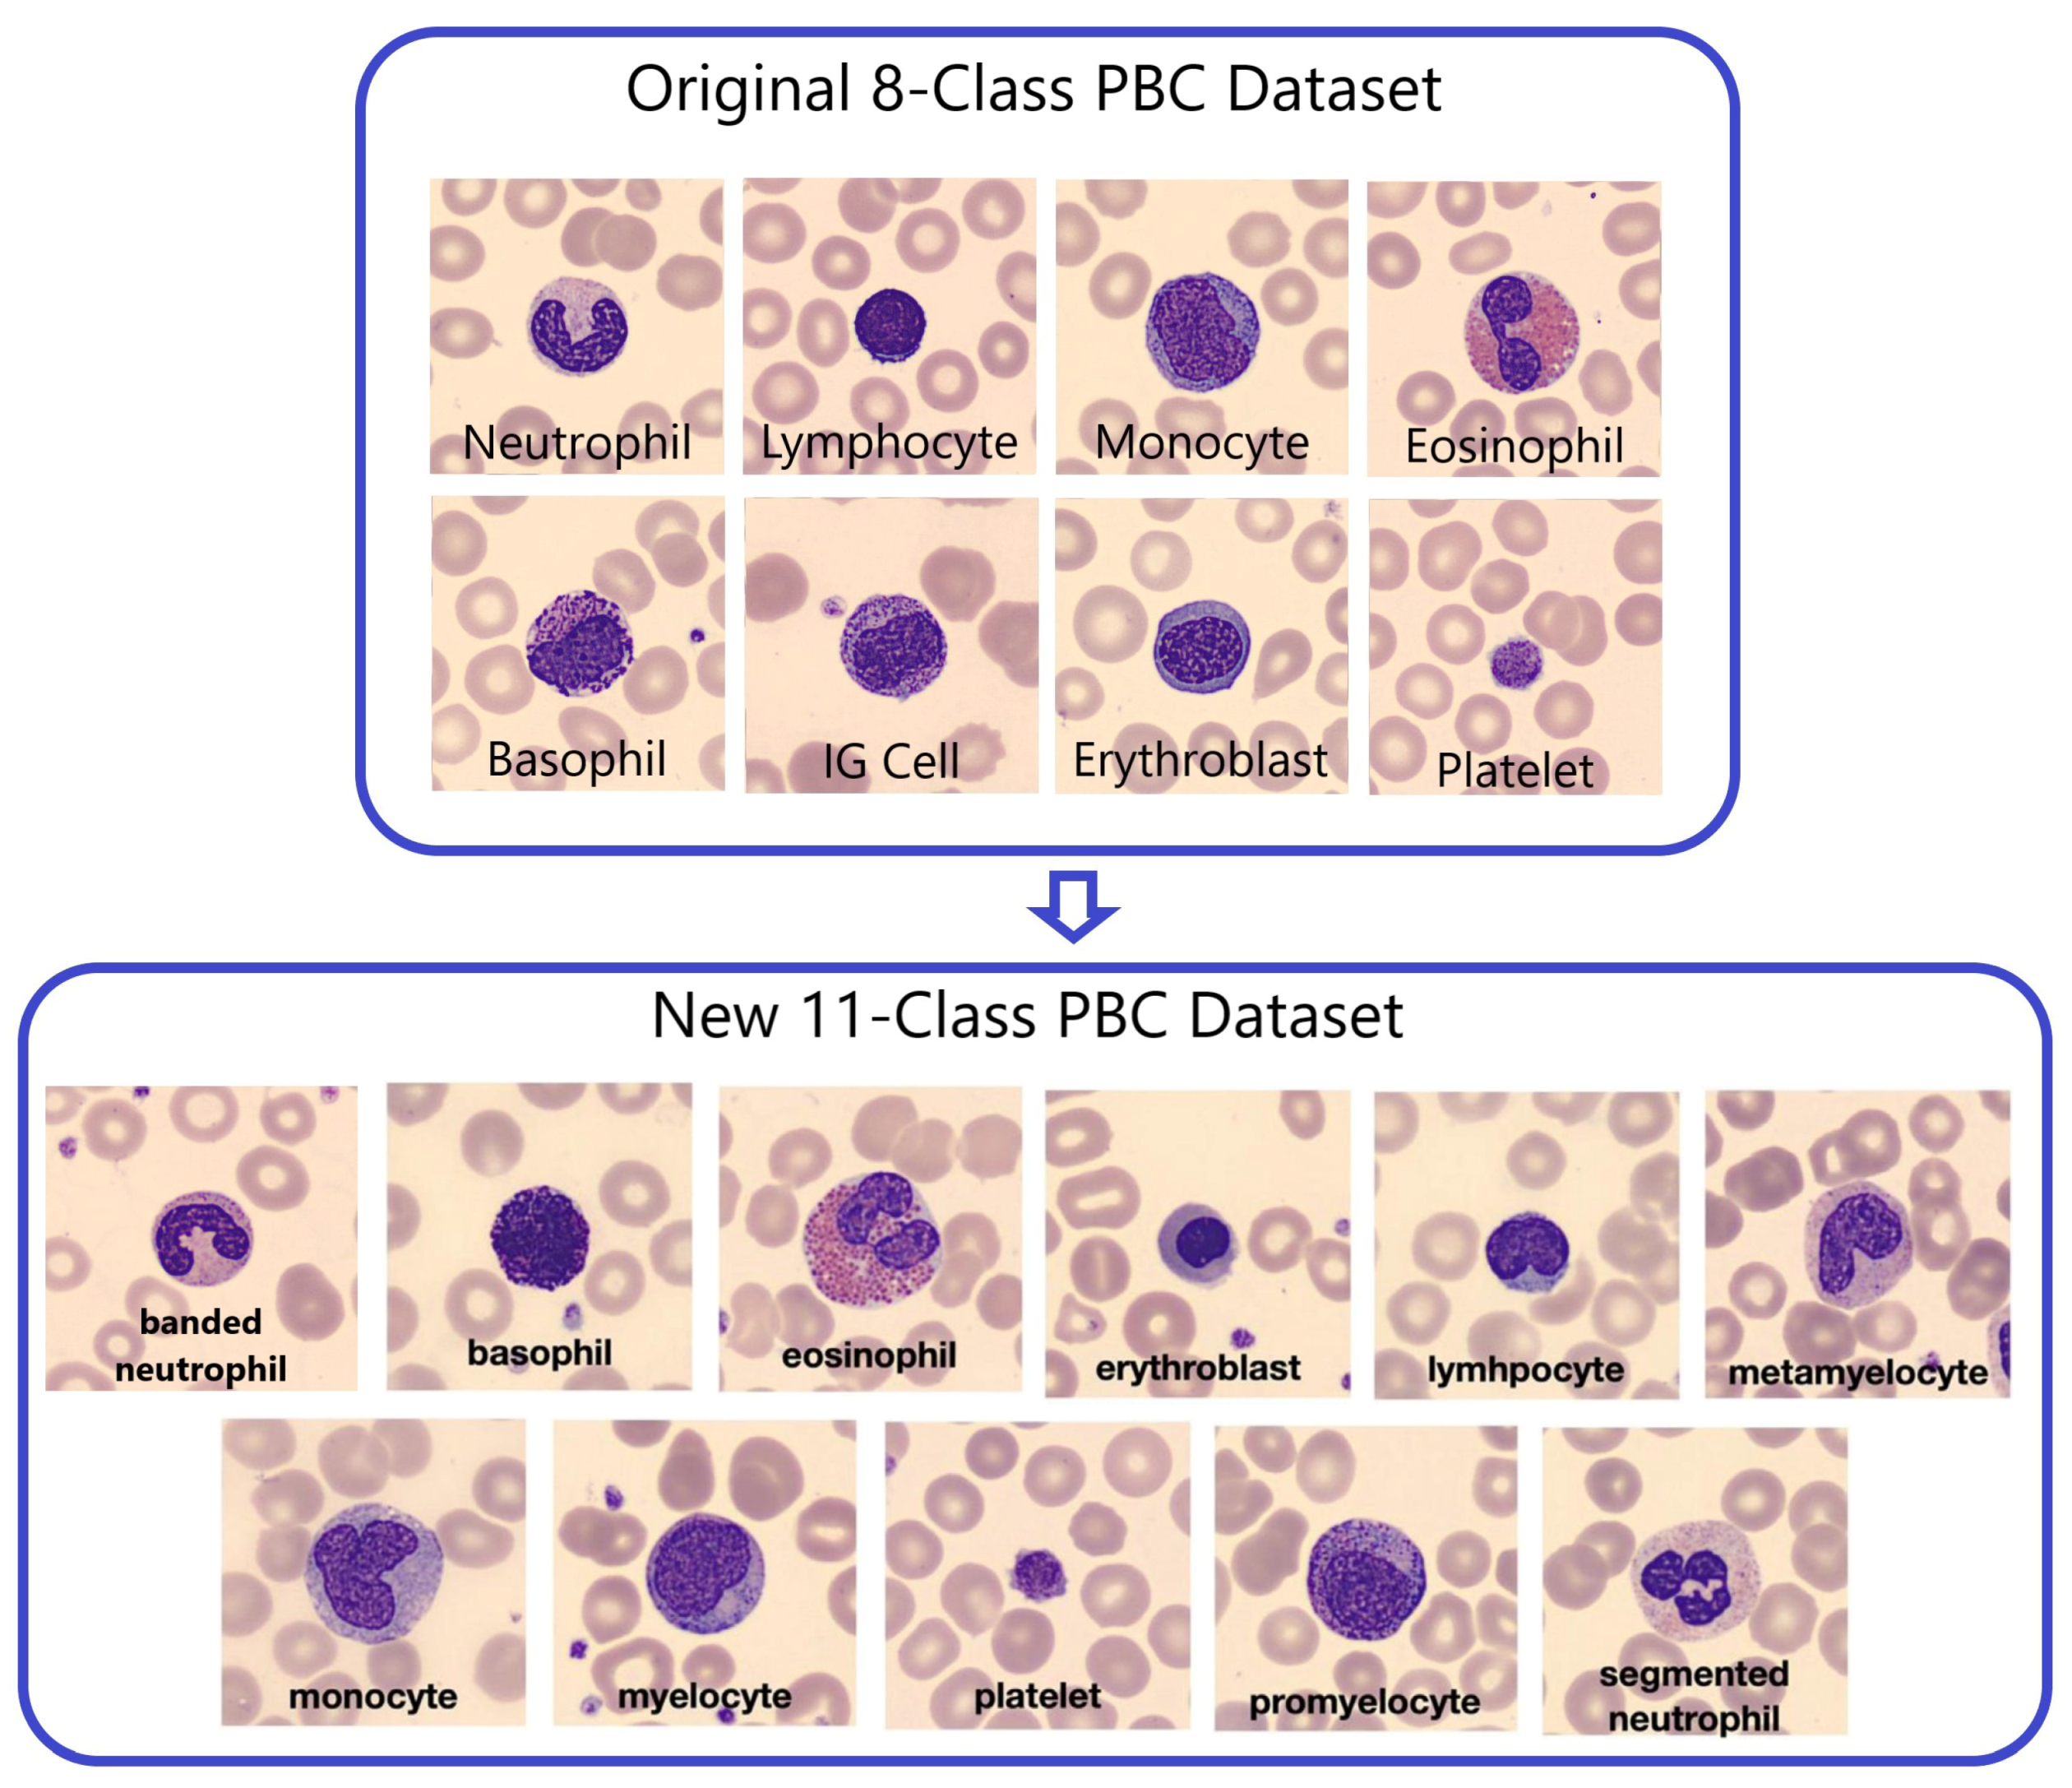
To expand the original 8-Class PBC dataset into 11 distinct blood cell types or classes, a separation of labeled classes in two PBC folders “Immature Granulocytes” and “Neutrophil” was applied, as illustrated in
Figure 3. These eleven classes include banded neutrophils, basophils, eosinophils, erythroblasts, lymphocytes, meta-myelocytes, monocytes, myelocytes, platelets, pro-myelocytes, and segmented neutrophils.
The new Peripheral Blood Cell (PBC) dataset has been grouped into 11 specific blood cell categories, as outlined in
Table 2 [
4]. To achieve this classification, certain entries from the original PBC dataset were eliminated because they did not align with the new 11 categories. For instance, 151 images initially categorized as immature granulocytes lacked further subclassification (pro-myelocyte, myelocyte, or meta-myelocyte), resulting in a reduction in the total number of images in the revised 11-class PBC dataset to 16,891. Notably, the analysis of
Table 3 reveals a significant underrepresentation of the Pro-myelocyte (PMY) category among these classes.
3.2. Exploratory Data Analysis (EDA)
Exploratory Data Analysis (EDA) was conducted to gain insights into the nature of the dataset. This involved training and testing pre-trained ImageNet models with the new 11-class PBC dataset, analyzing the confusion matrix, and generating a classification report.
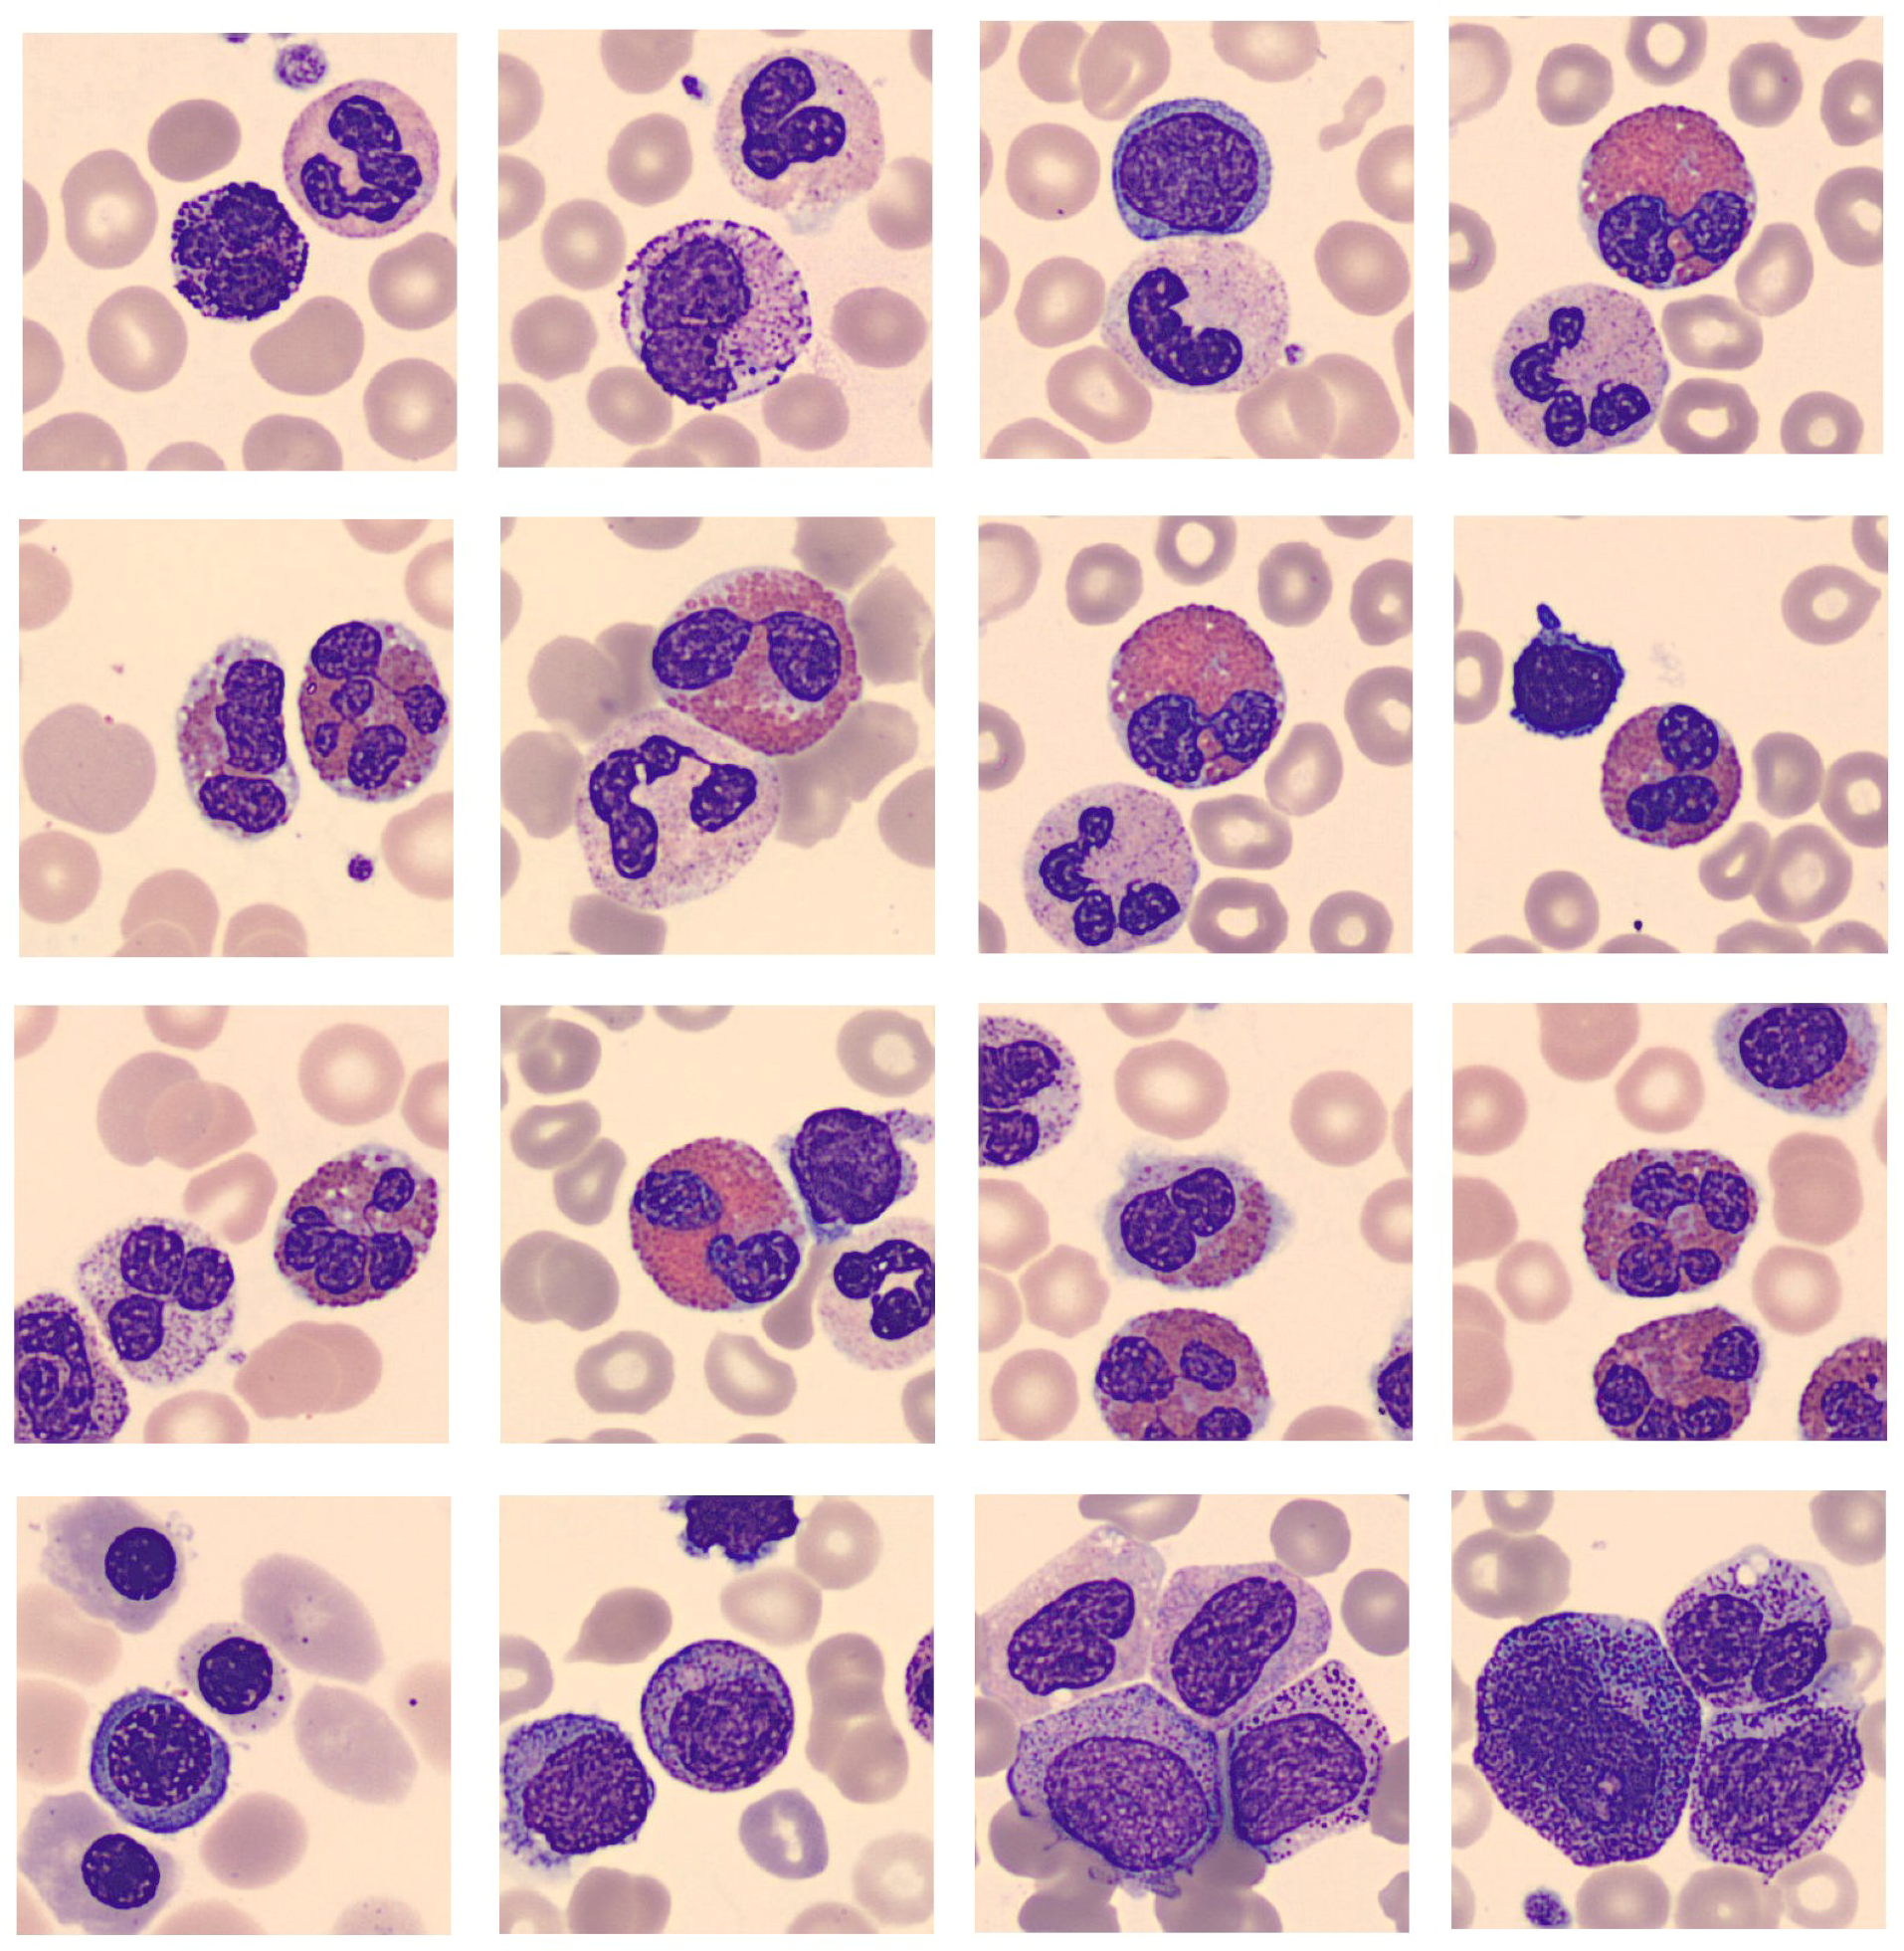
EDA uncovered issues: multi-class images caused confusion and were removed; fragments from other classes also confused models (
Figure 4). Scarce pro-myelocyte images affected performance, addressed with “Naturalize” augmentation to match original image quality.
3.3. First Data Augmentation “Naturalize”
The pseudocode shown in Algorithm 1 demonstrates the principle behind the “Naturalize” augmentation technique and how it works.
| Algorithm 1 Naturalize Algorithm |
- 1:
# Imports and Paths - 2:
import os, random, image_processing, SAM_model - 3:
Define file paths and import essential libraries - 4:
- 5:
# Load SAM_model and PBC Dataset - 6:
mount Google_drive - 7:
load peripheral blood smear images from PBC dataset - 8:
SAM = load_model(SAM_model) - 9:
- 10:
# Segment PBC Dataset Using SAM - 11:
segment all PBC images using SAM into segmented “RBCs, WBCs, PLTs” - 12:
save segmented “RBCs, WBCs, PLTs” into new datasets on Google_drive - 13:
- 14:
# Collision Function - 15:
function check_collision(positions, x, y, width, height) - 16:
Function to check for image collisions - 17:
end function - 18:
- 19:
# Composite Image Creation - 20:
for i in range(num_images) do - 21:
Load background image and initialize positions list - 22:
Add 1 WBC image - 23:
Add 8 RBC images with collision avoidance - 24:
Save the composite image on Google_drive - 25:
end for
|
The “Naturalize” augmentation technique consists of two primary steps:
Step 1—Segmentation:
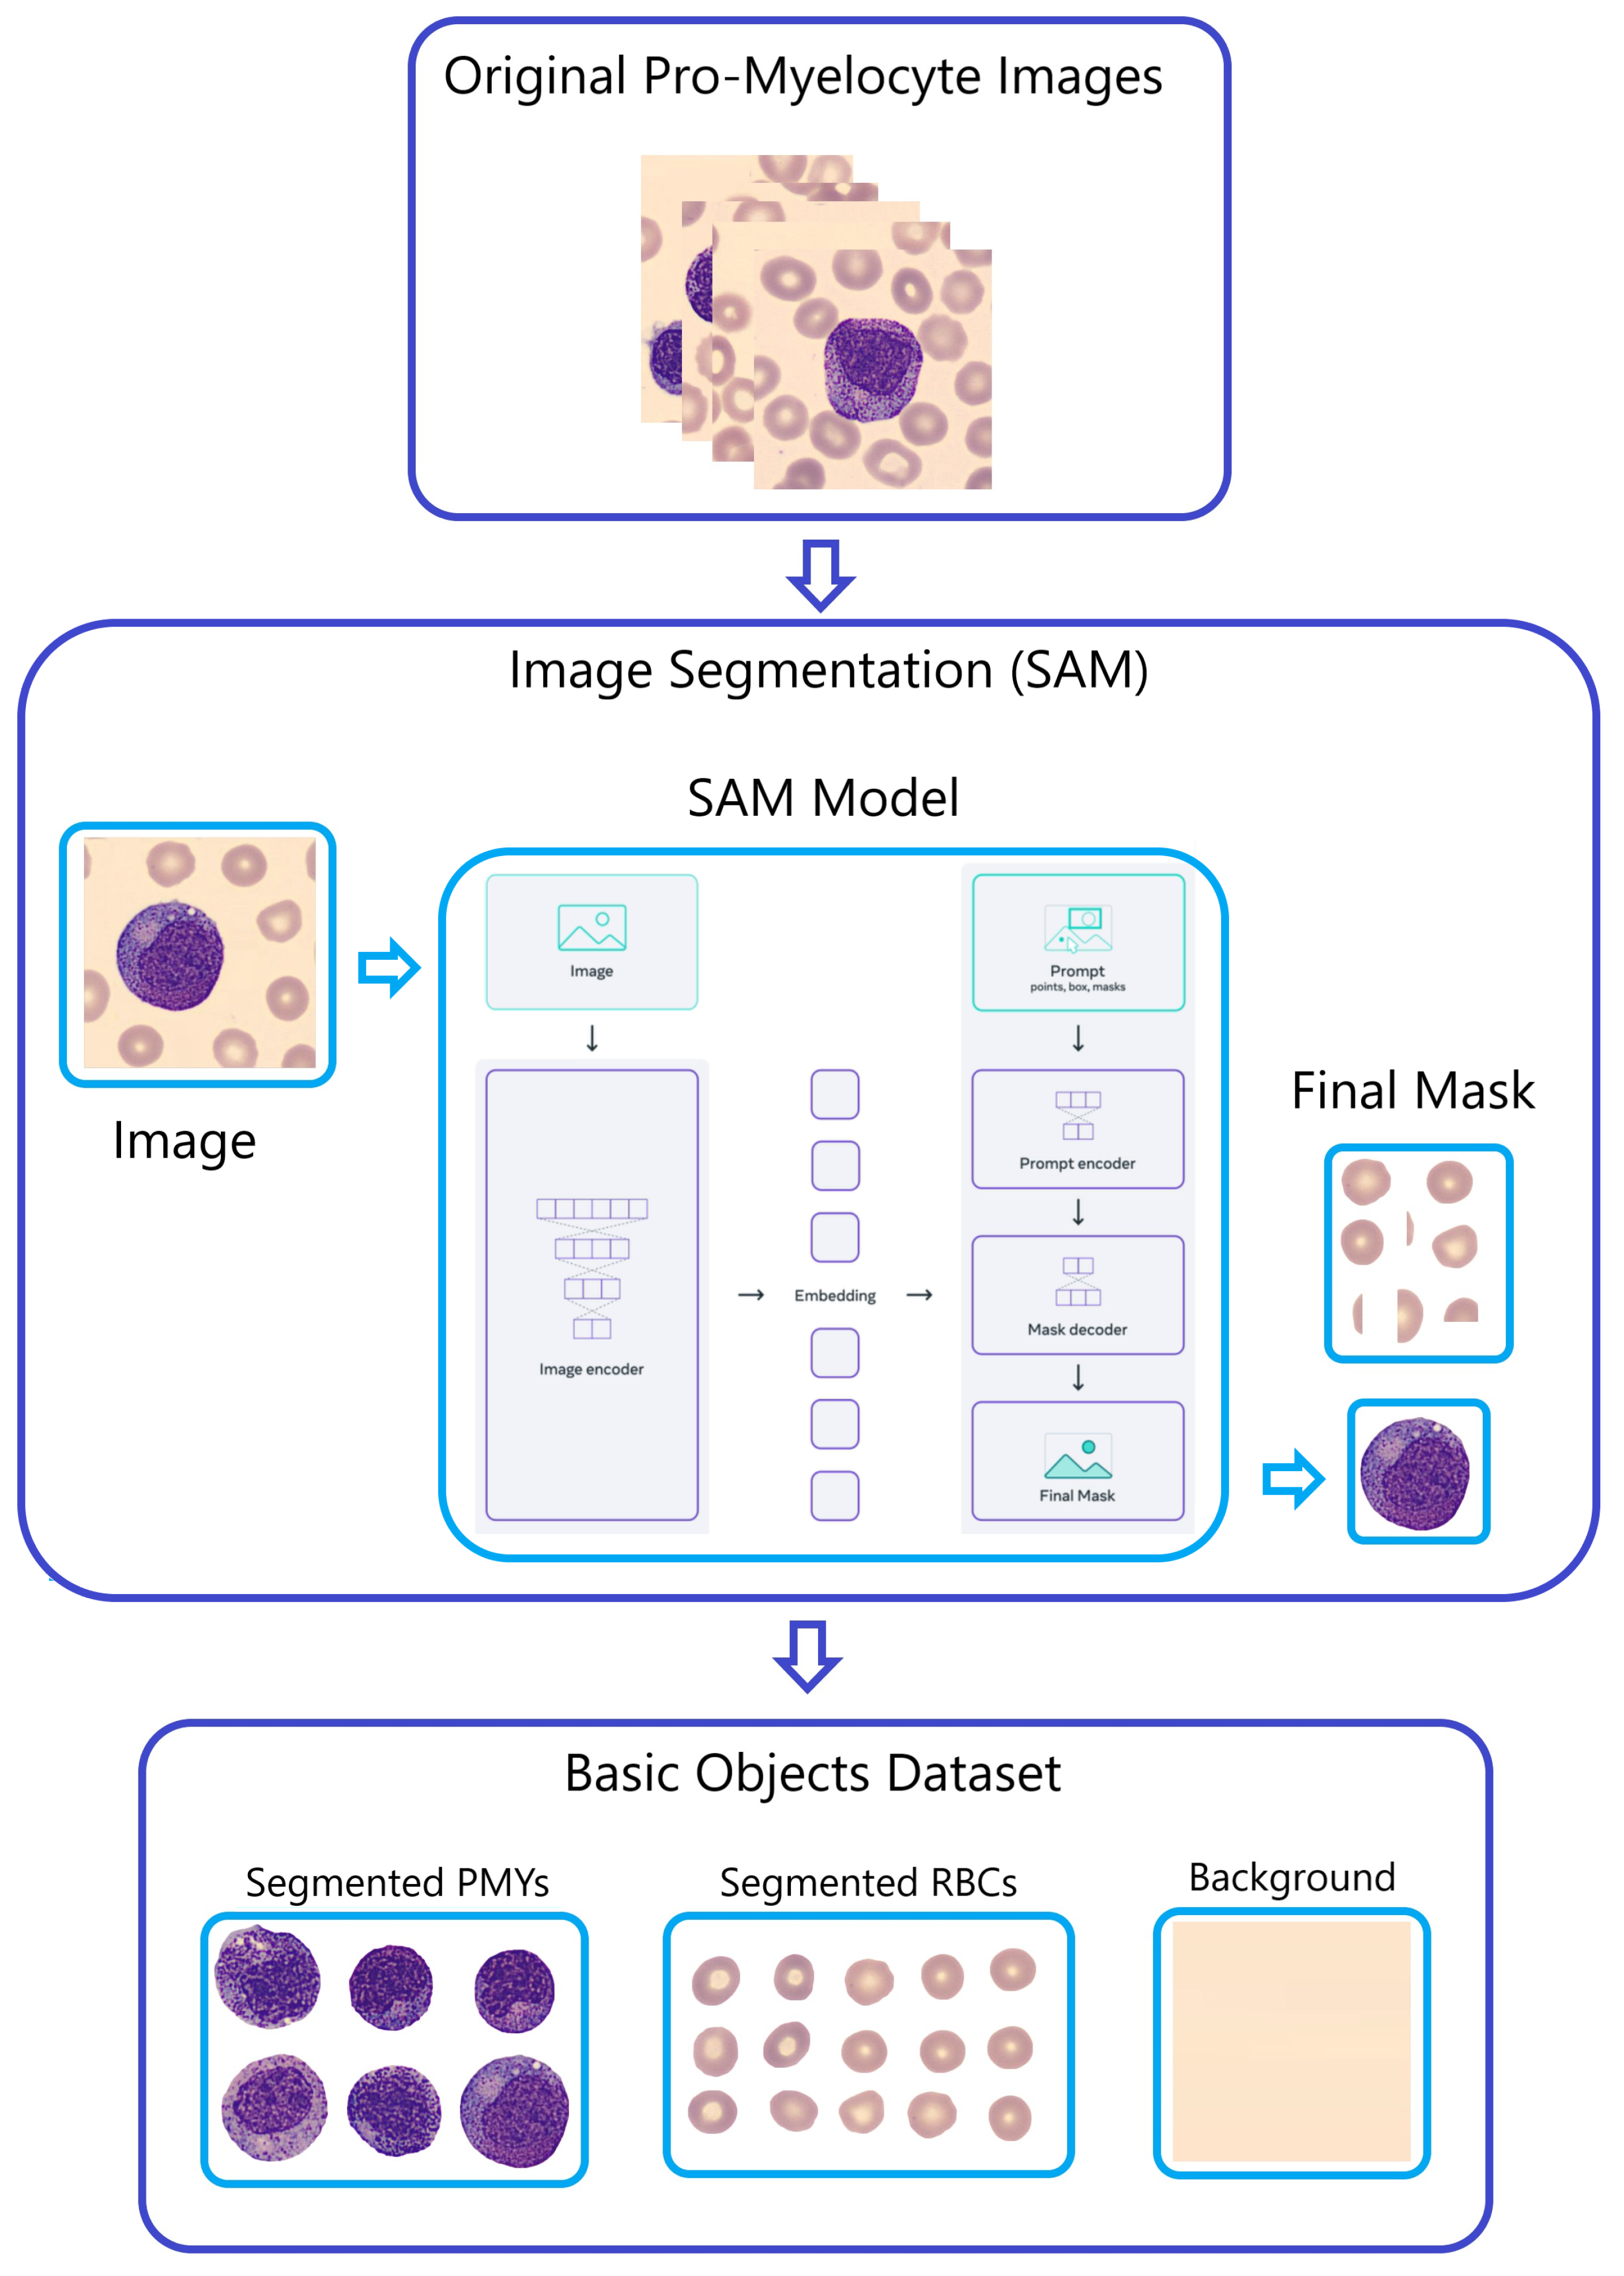
A portion of the initial PBC dataset images underwent segmentation and were separated into six distinct datasets employing the “Segment Anything Model (SAM)” developed by Meta AI [
29]. These datasets encompass segmented images of Red Blood Cells (RBC), Banded Neutrophils (BNE), Meta-myelocytes (MMY), Myelocytes (MY), Pro-myelocytes (PMY), and Segmented Neutrophils (SNE).
This selective approach, using only these six classes in SAM, was adopted based on the findings of our earlier Exploratory Data Analysis (EDA) and classification report, which demonstrated an overall enhancement in classification performance, contrasting with the use of all 11 classes. Notably, for each cell class, SAM generates masks that partition the images into three distinct components: background, segmented RBCs, and segmented WBCs.
To offer further clarification,
Figure 5 utilizes Pro-myelocytes (PMY) as a demonstration of the SAM model’s application. This figure showcases the segmentation process for PMY images, illustrating the division into background, segmented RBCs, and segmented PMYs.
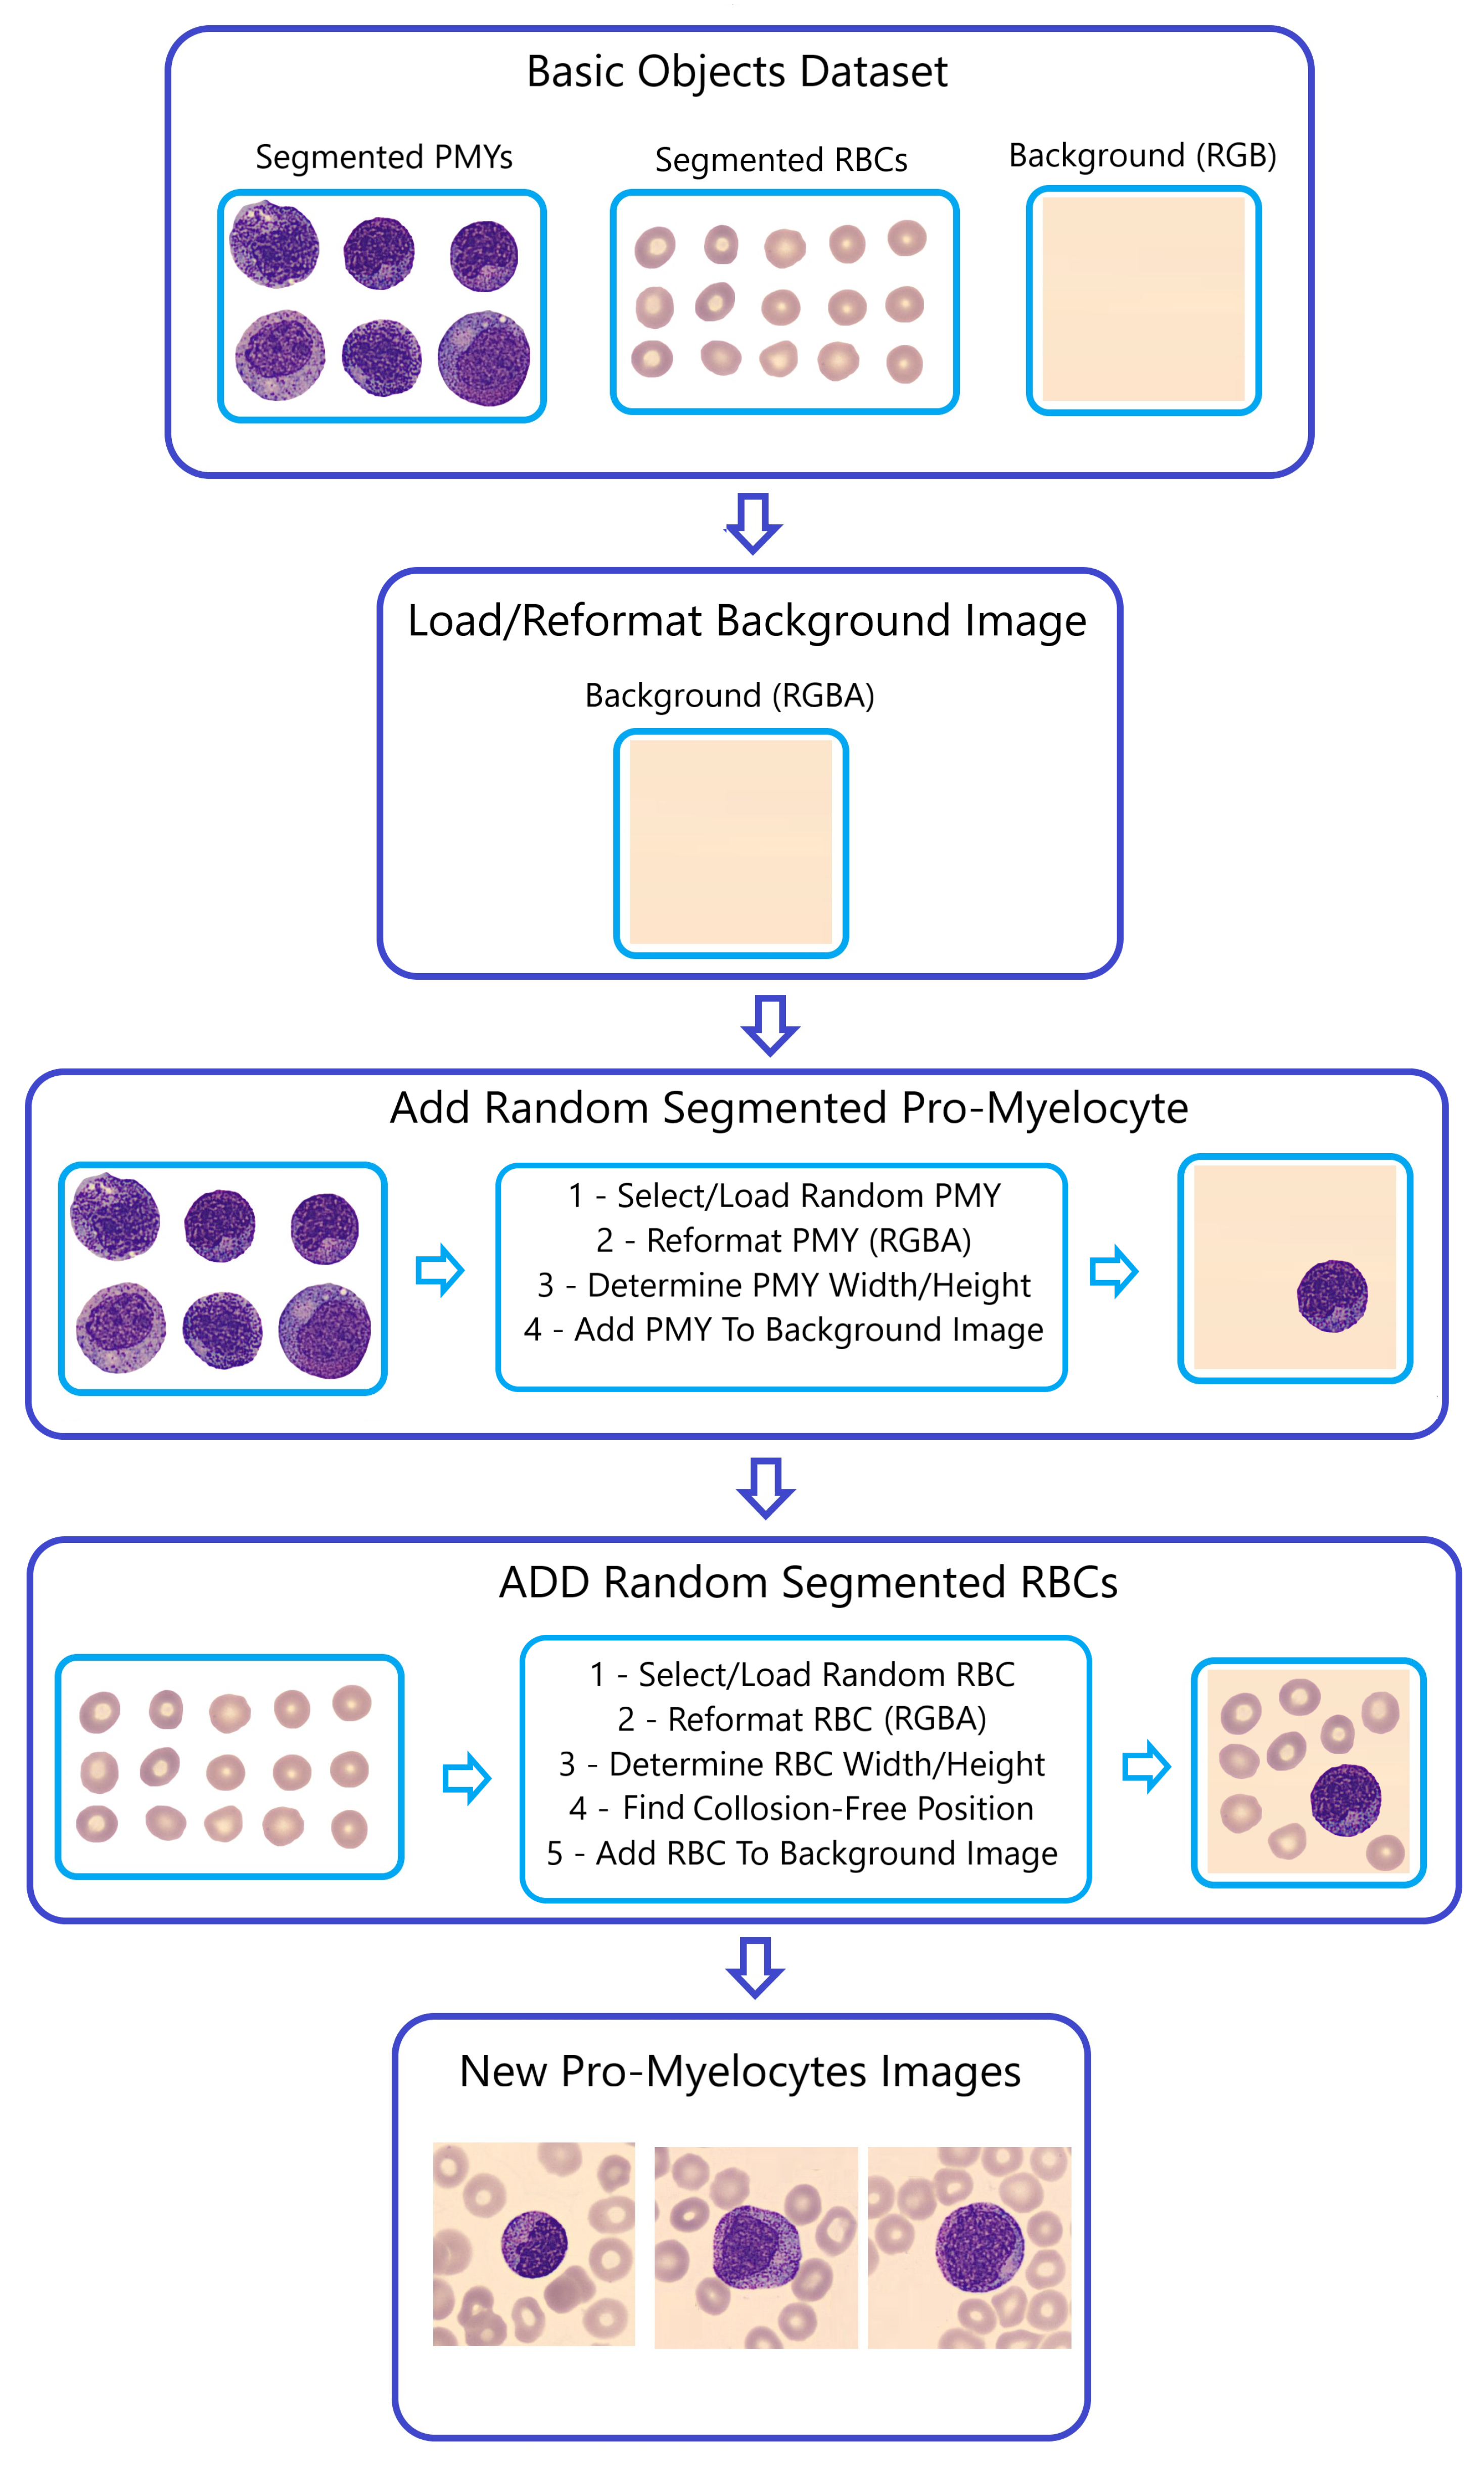
Step 2—Generating Composite Images (
Figure 6):
The SAM-segmented RBCs were combined with randomly selected WBCs from the “BNE, MMY, MY, PMY, and SNE” datasets to create composite images. The primary objective in this selection and fusion of segmented RBCs and WBCs is to generate entirely distinct images each time the Naturalize code is run.
Converting the segmented cells into the RGBA format is aimed at resetting the alpha transparency channel within these segments, preventing their black backgrounds from appearing in the newly generated images using the Naturalize method. However, the size of segmented RBCs and WBCs remains unchanged to mirror the real dimensions of blood cells in peripheral blood smears.
Determining the size (width and height) of the segmented RBCs and WBCs functions as input for the Collision-Free mechanism, ensuring that the segmented RBC images avoid overlapping or excessive stacking on either themselves or the segmented WBC images when added to the background image. This function’s output results in well-organized peripheral blood cell images without cells accumulating on top of each other.
This procedural demonstration is depicted in
Figure 5 and
Figure 6, highlighting the creation of composite PMY images as an illustrative example.
Figure 5.
The “Naturalize” first step—segmentation.
Figure 5.
The “Naturalize” first step—segmentation.
Figure 6.
The “Naturalize” second step—composite image generation.
Figure 6.
The “Naturalize” second step—composite image generation.
Informed by our comprehensive exploratory data analysis (EDA), we have carefully curated specific images across multiple classes, underscoring our dedication to maintaining data quality. For instance, upon the exclusion of multi-class images from the pro-myelocyte category, the count within the original 11-class PBC dataset reduced from 592 to 419 images, a process similarly carried out across other classes. Following this pruning process, the overall count of images in the original PBC dataset consolidates to 16,115 images.
During the initial application of the “Naturalize” technique, the count of pro-myelocytes surged from 419 images to 1011 images.
Table 4 vividly represents the remarkable evolution of the original 419-PMY PBC dataset across 11 distinct blood cell classes, notably bolstered by the addition of new created 592 PMY images. Consequently, the cumulative count of images within the augmented 419-PMY PBC dataset now elevates to 16,345 images.
The dataset underwent a significant expansion through two additional applications of the “Naturalize” augmentation technique, resulting in the creation of the 1K-PBC and 2K-PBC datasets. Each of these datasets was enriched by adding 1000 and 2000 images per sub-dataset from the following five blood classes: “BNE, MMY, MY, PMY, and SNE.” Consequently, the 1K-PBC dataset now comprises: 1123 BA, 2621 BNE, 2937 EO, 1351 ERB, 1202 LY, 2007 MMY, 1350 MO, 2134 MY, 2178 PLT, 2011 PMY, and 2620 SNE. Additionally, the 2K-PBC dataset includes: 1123 BA, 3621 BNE, 2937 EO, 1351 ERB, 1202 LY, 3007 MMY, 1350 MO, 3134 MY, 2178 PLT, 3011 PMY, and 3620 SNE.
The decision behind the sole inclusion of the following five blood cell classes “BNE, MMY, MY, PMY, and SNE” in the second and third “Naturalize” application is based on the results of the classification report and aims to improve classification performance.
This forward-thinking enhancement approach propelled the augmented 419-PMY dataset to an impressive 21,534 images, rebranded as the “1K-PBC” dataset, and further expanded it to 26,534 images, now recognized as the “2K-PBC” dataset. This heralds a transformative era of robust and enriched data resources.
The prior datasets, namely 419-PMY, 1K-PBC, and 2K-PBC, generated using the Naturalize augmentation technique, all exhibited imbalanced class distributions. In response to this imbalance issue, we have created a new dataset called Balanced PBC, where all classes have been rebalanced with 2000 images each. As a result, certain classes (BA, BNE, ERB, LY, MMY, MO, MY, PMY, and SNE) have been augmented to include 2000 images, while the number of images in the remaining classes (EO and PLT) has been reduced to 2000 each.
3.4. Comparison between Naturalize and Conventional Augmentation Techniques
Conventional image augmentation involves standard transformations such as rotation, flipping, and color adjustments to expand datasets. These techniques focus on general image manipulation to increase variety. On the other hand, the “Naturalize” augmentation method is more complex and specific. It employs a selective segmentation process using the “Segment Anything Model” to isolate particular cell classes from the dataset. This segmentation approach is based on findings from prior data analysis, emphasizing the enhanced performance of a subset of classes.
Moreover, the number of segmented Red Blood Cells (RBCs), White Blood Cells (WBCs), and Platelets (PLTs) generated from the original Peripheral Blood Cell (PBC) dataset using the SAM model is significantly large. The random addition of these segmented objects results in an incredibly vast number of unique and realistic replicas of the original PBC dataset.
In addition, “Naturalize” offers control over the quality of the created images by enabling the regulation of the number of added segmented RBCs with the selected segmented WBCs. For instance, one can selectively choose to include 4 or 8 segmented RBCs, providing a level of precision and control not commonly found in traditional augmentation techniques.
Furthermore, the versatility of the “Naturalize” technique extends beyond medical imaging. By segmenting all objects in the original images and reintroducing them into the background images, “Naturalize” can be applied to various applications, both within the medical field and beyond. This adaptability showcases the potential for widespread use, not limited to medical image augmentation.
This method maintains the realism of cell sizes, preserving the authentic dimensions of blood cells. It also ensures that the combined cells do not overlap excessively through a “Collision-Free” mechanism, a feature not typically found in traditional augmentation methods. Overall, “Naturalize” focuses on medical image authenticity and diversity, tailoring the augmentation process to suit specific requirements rather than applying generic transformations.
3.5. Augmented 419-PMY PBC Dataset Preprocessing
The preprocessing of the augmented 419-PMY PBC dataset involved three primary steps:
Step 1—Image Resizing: The images were resized to match the standard “224 × 224” image input size required by pre-trained ImageNet ConvNets and ViT models.
Step 2—Second Data Augmentation (Transformational): The training dataset underwent a second augmentation step, which included geometric transformations such as horizontal flips, vertical flips, and 90-degree rotations. This augmentation aimed to mitigate overfitting of models.
Step 3—Data Splitting: The final 11-class PBC dataset was split into three subsets: an 80% training set, a 10% validation set, and a 10% testing set.
3.6. Models and Dl Techniques (TL/FT/EL)
Three types of model architectures were utilized in this study: pre-trained ImageNet ConvNets, pre-trained Vision Transformers (ViT), and customized multi-layer CNN models. Additionally, three DL techniques were employed to train pre-trained models: Transfer Learning (TL), Fine-Tuning (FT), and Ensemble Learning (EL) [
30].
3.6.1. Pre-Trained ImageNet ConvNets
Pre-trained ImageNet models are an explicit example of ConvNets, which are trained on a large dataset.
Pre-trained ImageNet models were used as the foundation for the study. Notable models employed in this research included ConvNexTBase [
31], DenseNet-121 [
32], DenseNet-169 [
32], DenseNet-201 [
32], EfficientNetV2 B0 [
33], and VGG-19 [
34].
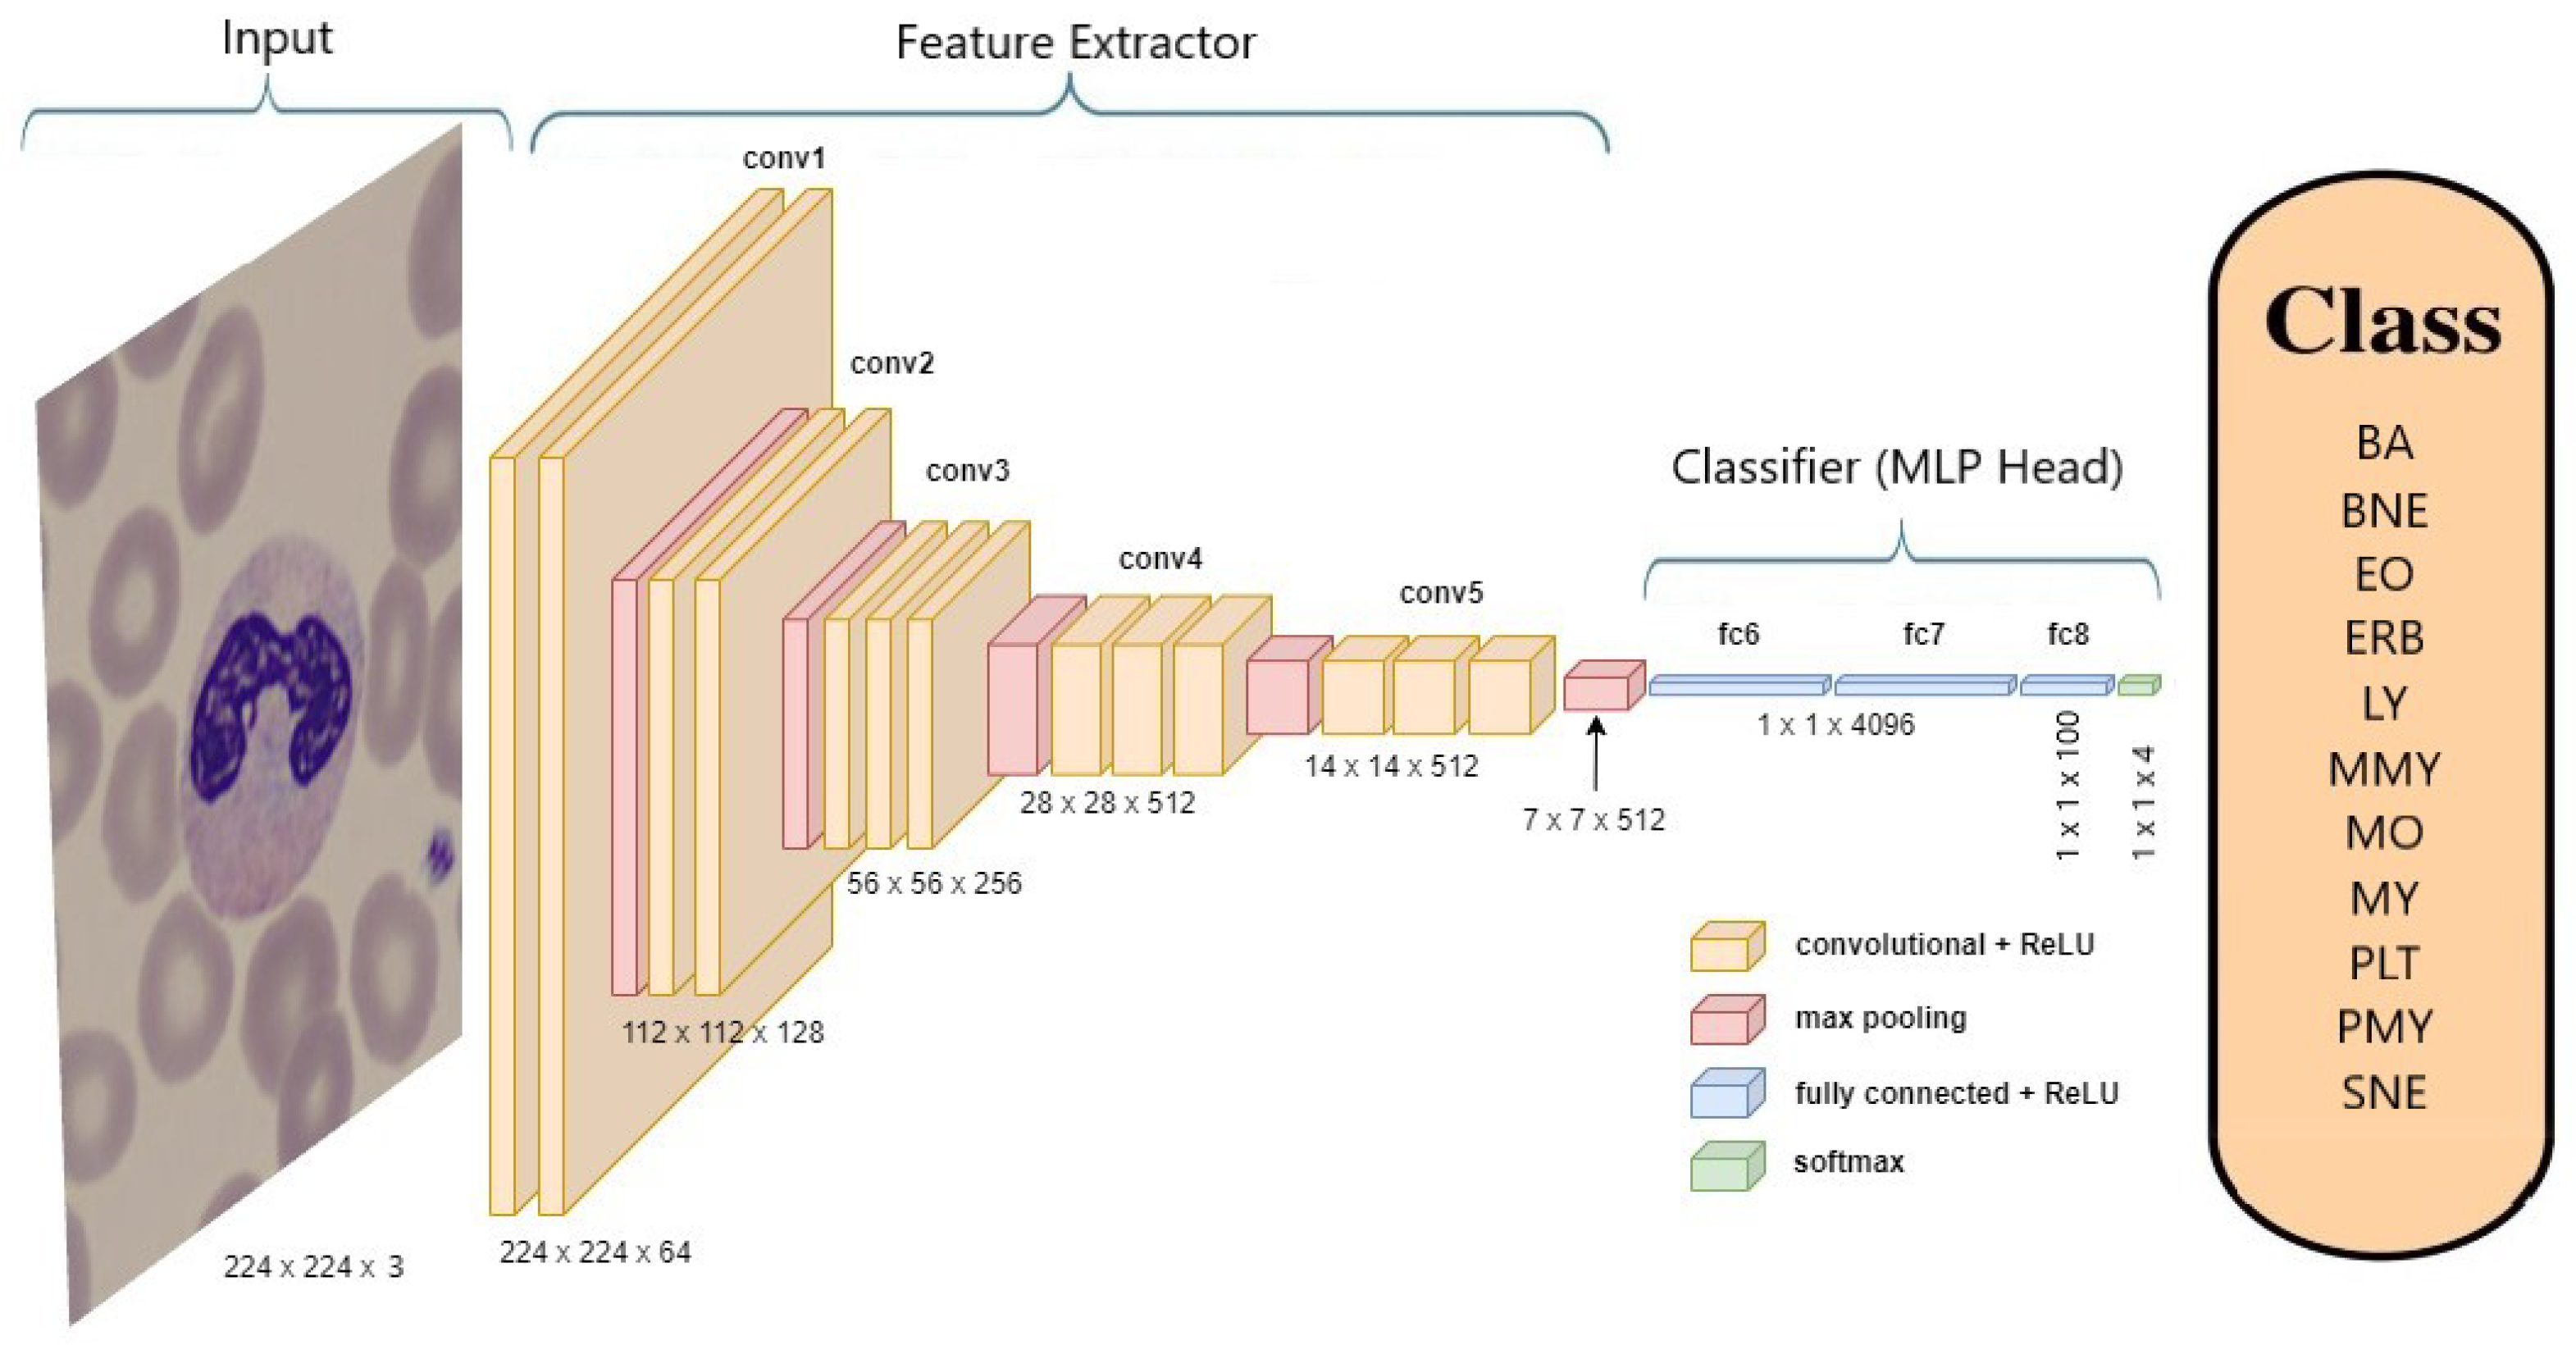
Figure 7 provides an example of the architecture of the VGG-19 model when applied to classify neutrophils.
3.6.2. Pre-Trained Vision Transformer (ViT)
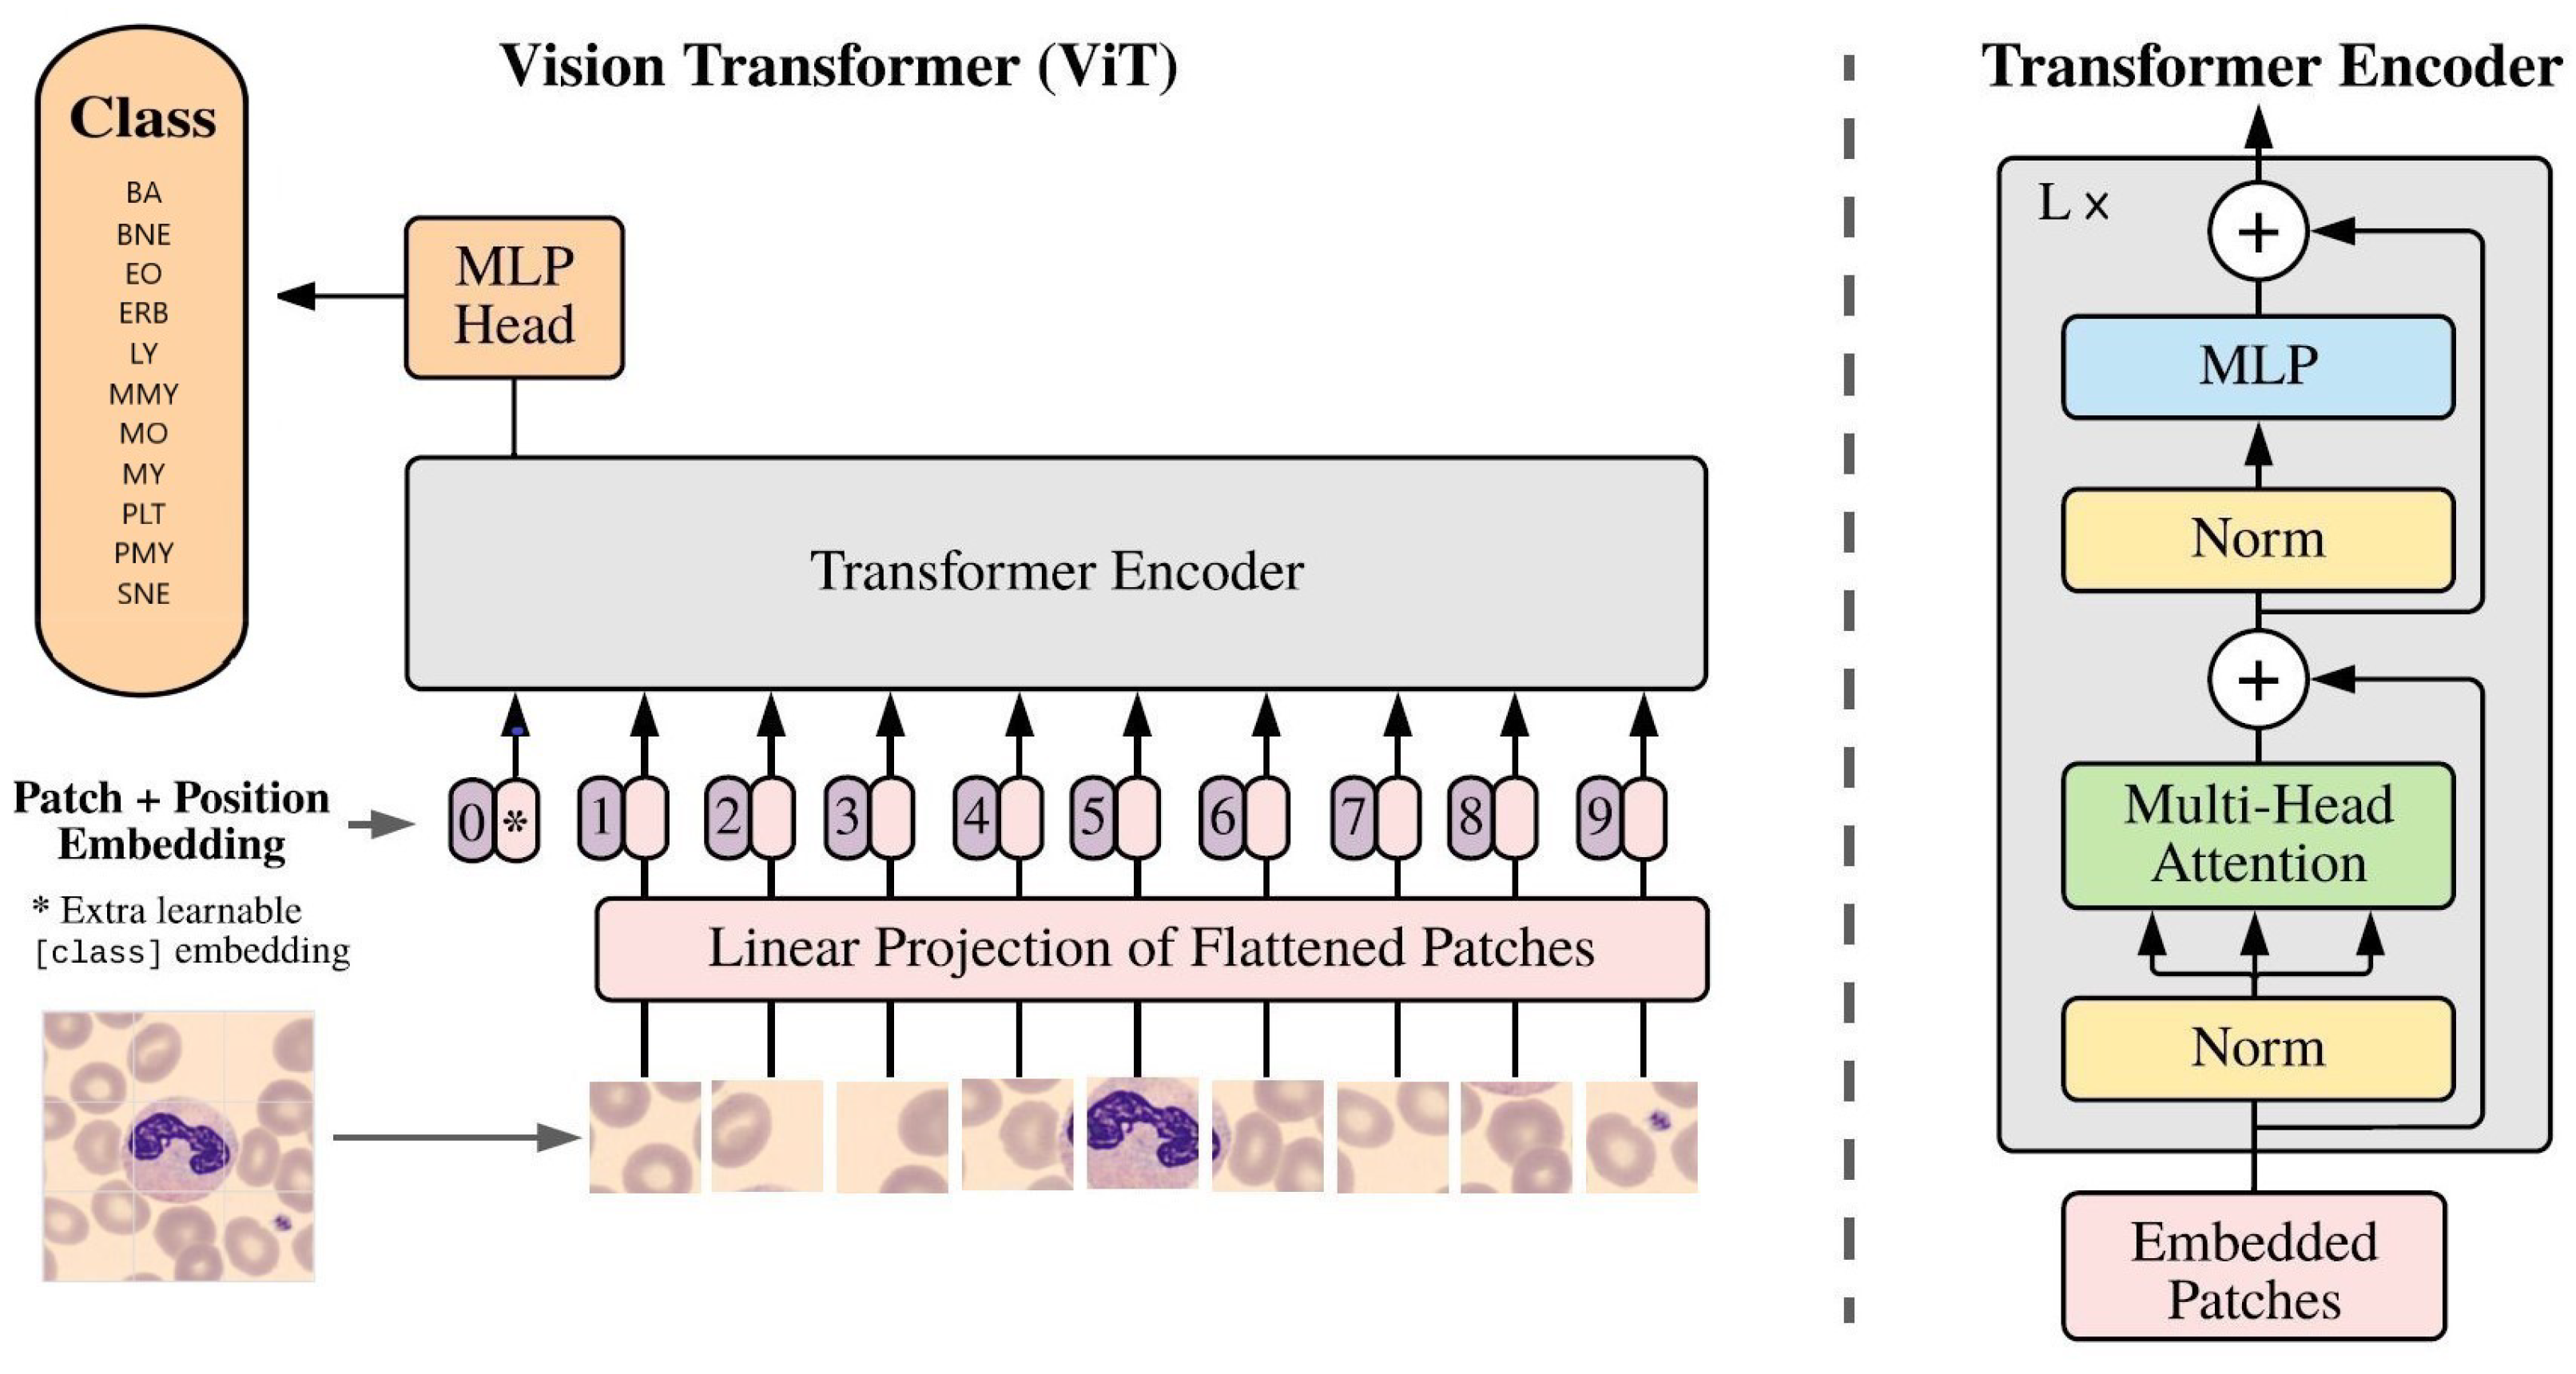
The Vision Transformer (ViT) [
6] architecture, based on the transformer architecture commonly used in Natural Language Processing (NLP), was applied. It involved splitting input images into small patches and processing each patch through a transformer encoder. Unlike convolutional layers, ViT used self-attention mechanisms to extract features from input images, enabling the model to consider the entire image at once. The study utilized the “ViTb16” architecture with 12 encoder blocks, and
Figure 8 illustrates its application to classify neutrophils [
6].
3.6.3. Customized Multi-Layer CNN
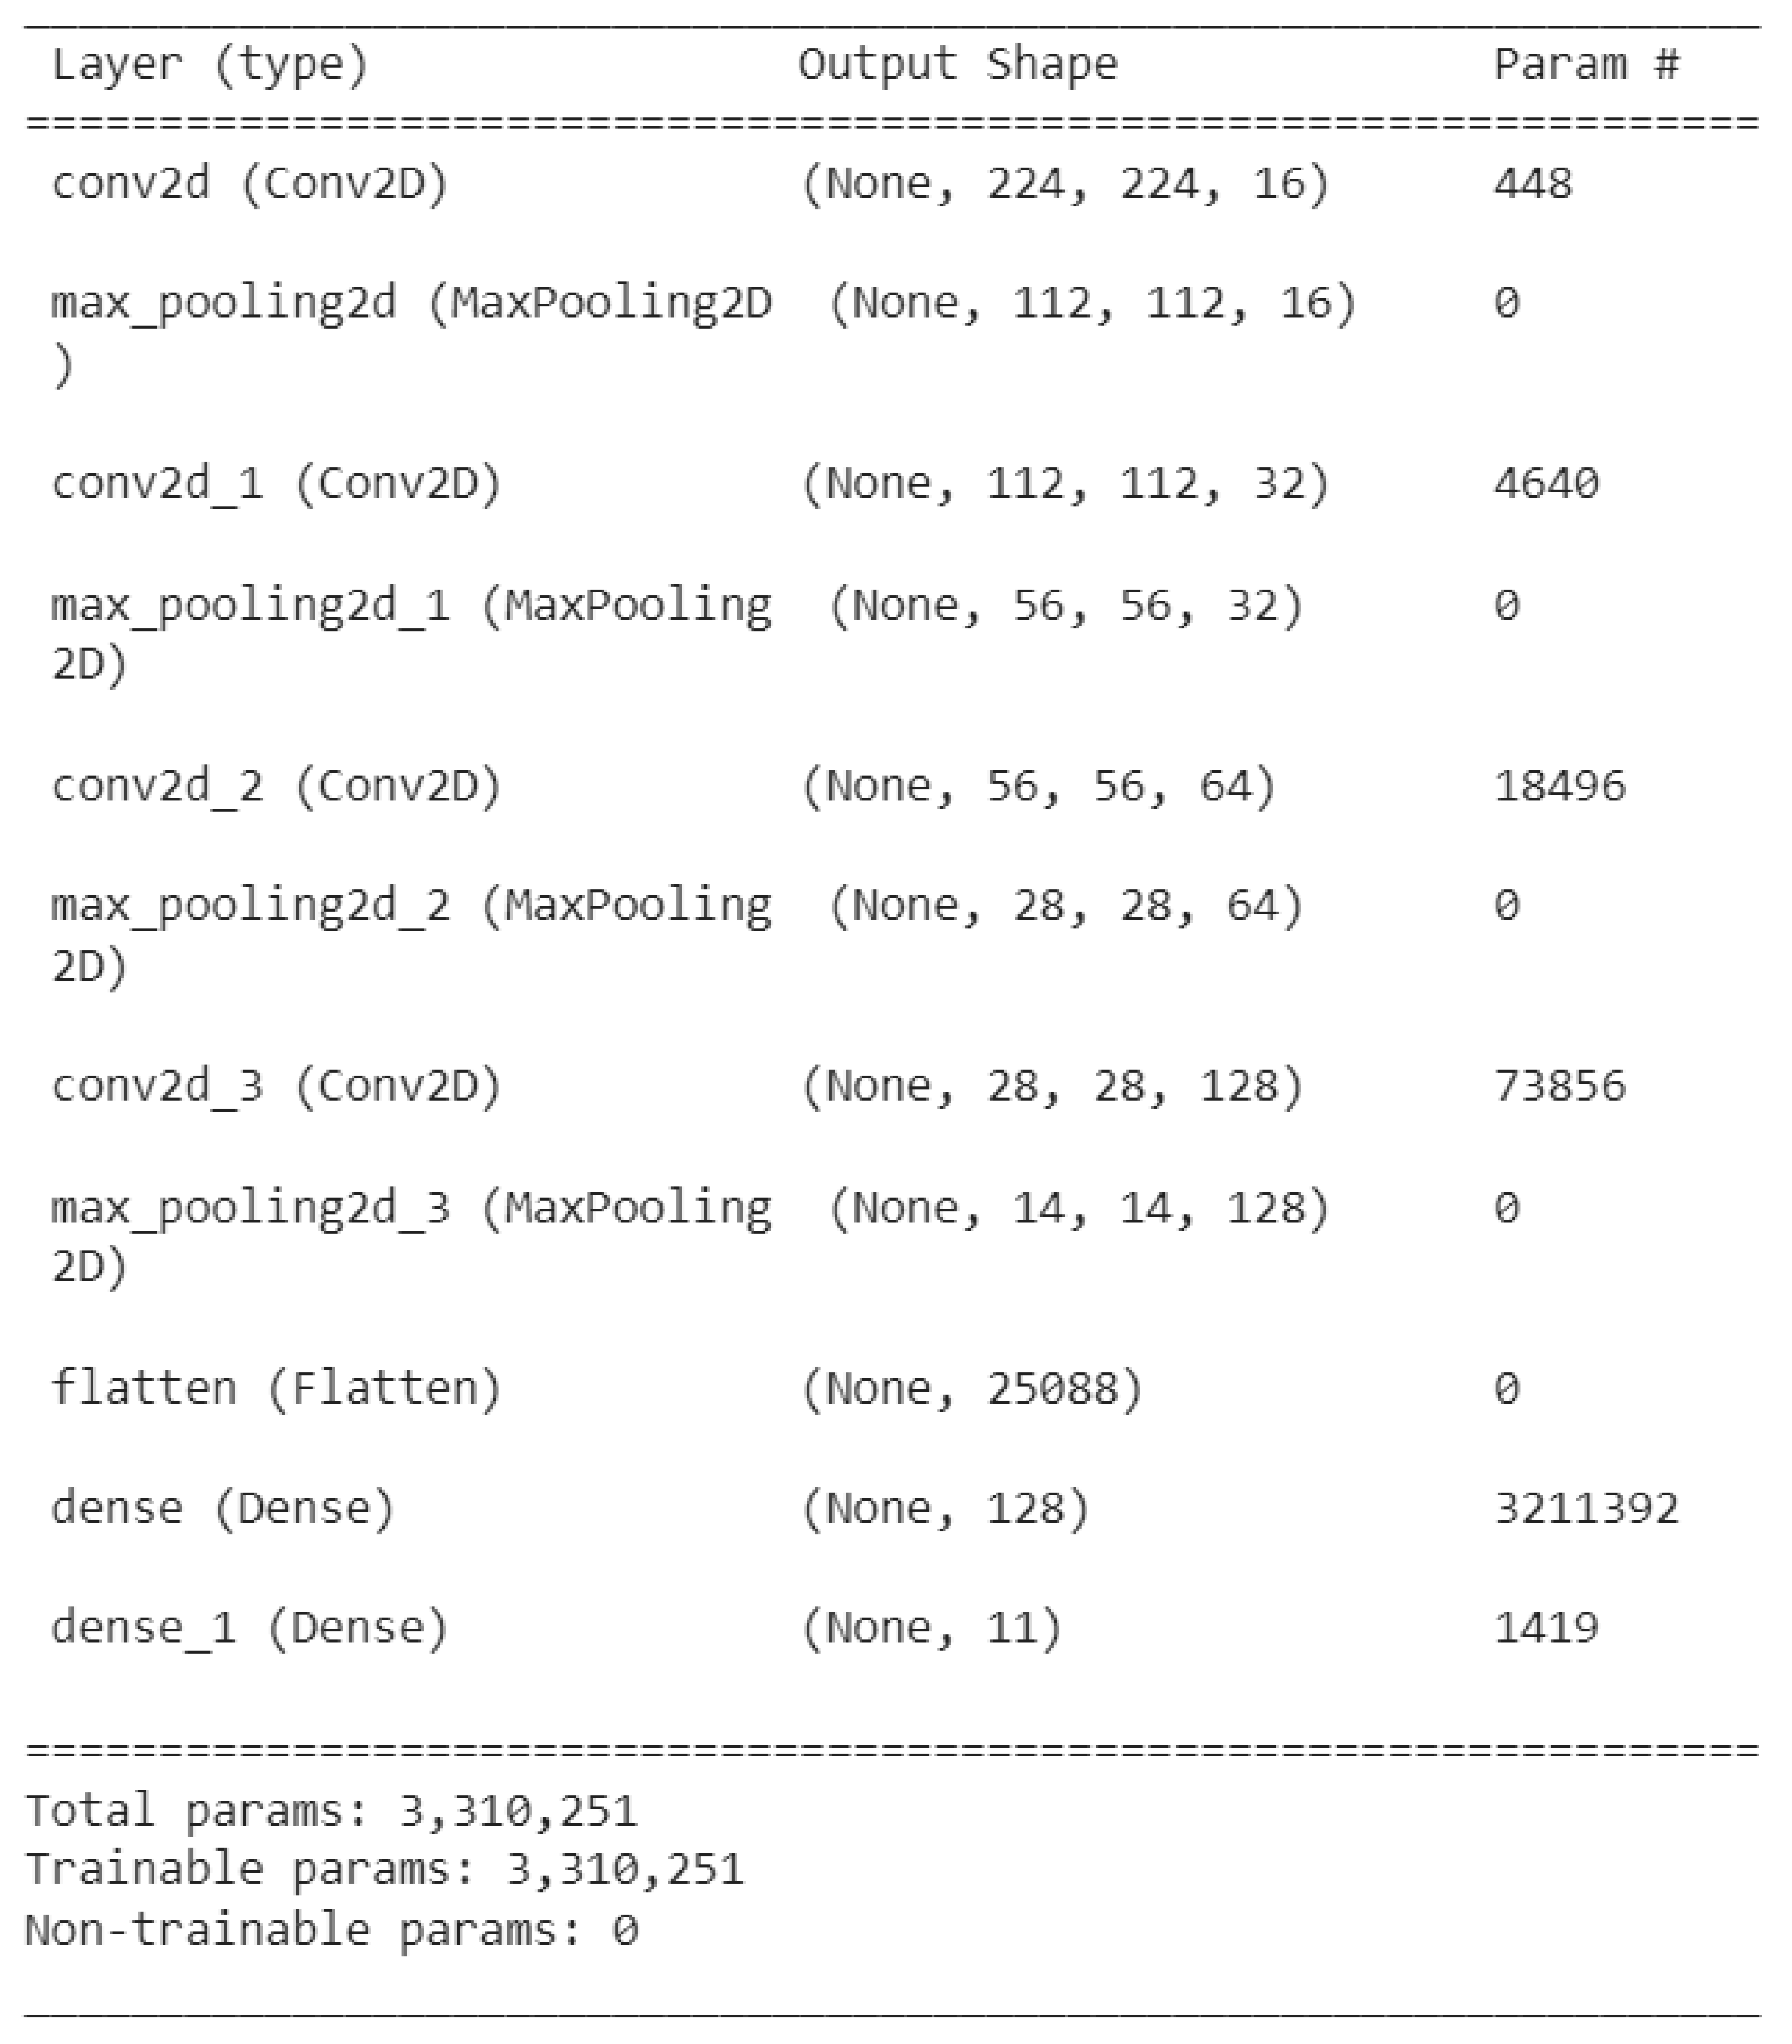
Customized multi-layer CNN models were developed and tested using the final 11-class PBC dataset.
Figure 9 provides a schematic representation of a typical customized CNN model architecture.
3.6.4. DL Techniques (TL/FT/EL)
Pre-trained ImageNet model has a Convolutional Base (feature extractor) and Classifier (MLP head). Transfer learning swaps MLP head for a new one, retraining on a custom dataset. the Convolutional Base stays non-trainable. Fine-tuning retrains the Convolutional Base and MLP head, adapting both for a new learning task.
Ensemble learning (EL) unites results from high-performing transfer-learned or fine-tuned models, utilizing either averaging or the Convolutional Block Attention Module (CBAM) [
35]. The objective is to attain enhanced overall model performance. In their study [
17], the authors applied Ensemble-CBAM with their top-scoring pre-trained models. To replicate their findings, this work also utilizes the Ensemble-CBAM model.
CBAM is a tool that turbocharges the effectiveness of convolutional neural networks (CNNs) by focusing on two critical aspects: the inter-dependencies among channels (channel attention) and the spatial locations within feature maps (spatial attention). When added to a CNN, CBAM directs the model’s attention toward relevant data while filtering out irrelevant noise, leading to better performance and more resilient representations. The CBAM module is performed on the merged features of the two nets (average or concatenation).
Equation (1) ([
36]) outlines how the channel attention block weights are computed:
Here, stands for the attention weights for channel c within the CNN’s output feature maps. represents the feature maps for channel c, which are the input to the CAM module. denotes the sigmoid function. MLP denotes a multi-layer perceptron. The MaxPool and AvgPool operations denote the max pooling and average pooling operations over the spatial dimensions of the feature maps, respectively.
Equation (2) ([
36]) demonstrates the calculation for the spatial attention block weights:
In this equation, represents the attention weight assigned to the spatial location in the input feature maps x. The global average pooling and max pooling operations, denoted by and respectively, are used to extract global information from the feature maps and reduce their spatial dimensionality. The concatenated feature vector for the spatial location is passed through an MLP layer, which applies a non-linear transformation to the feature vector. The output of the MLP layer is passed through a sigmoid activation function, denoted by , to obtain the final attention weight .
In the Ensemble-CBAM model, the top-performing models, namely “EfficientNetV2 B0 and DenseNet-169,” are combined using CBAM and an MLP head.
Three deep learning techniques (TL/FT/EL) are employed in this study to create an optimal DL PBS tool.
3.7. Results’ Analysis and Interpretability Tools
In addition to the accuracy metrics (accuracy and loss), three results’ analysis and interpretability tools are used. These are confusion matrix, classification reports, and Score-CAM.
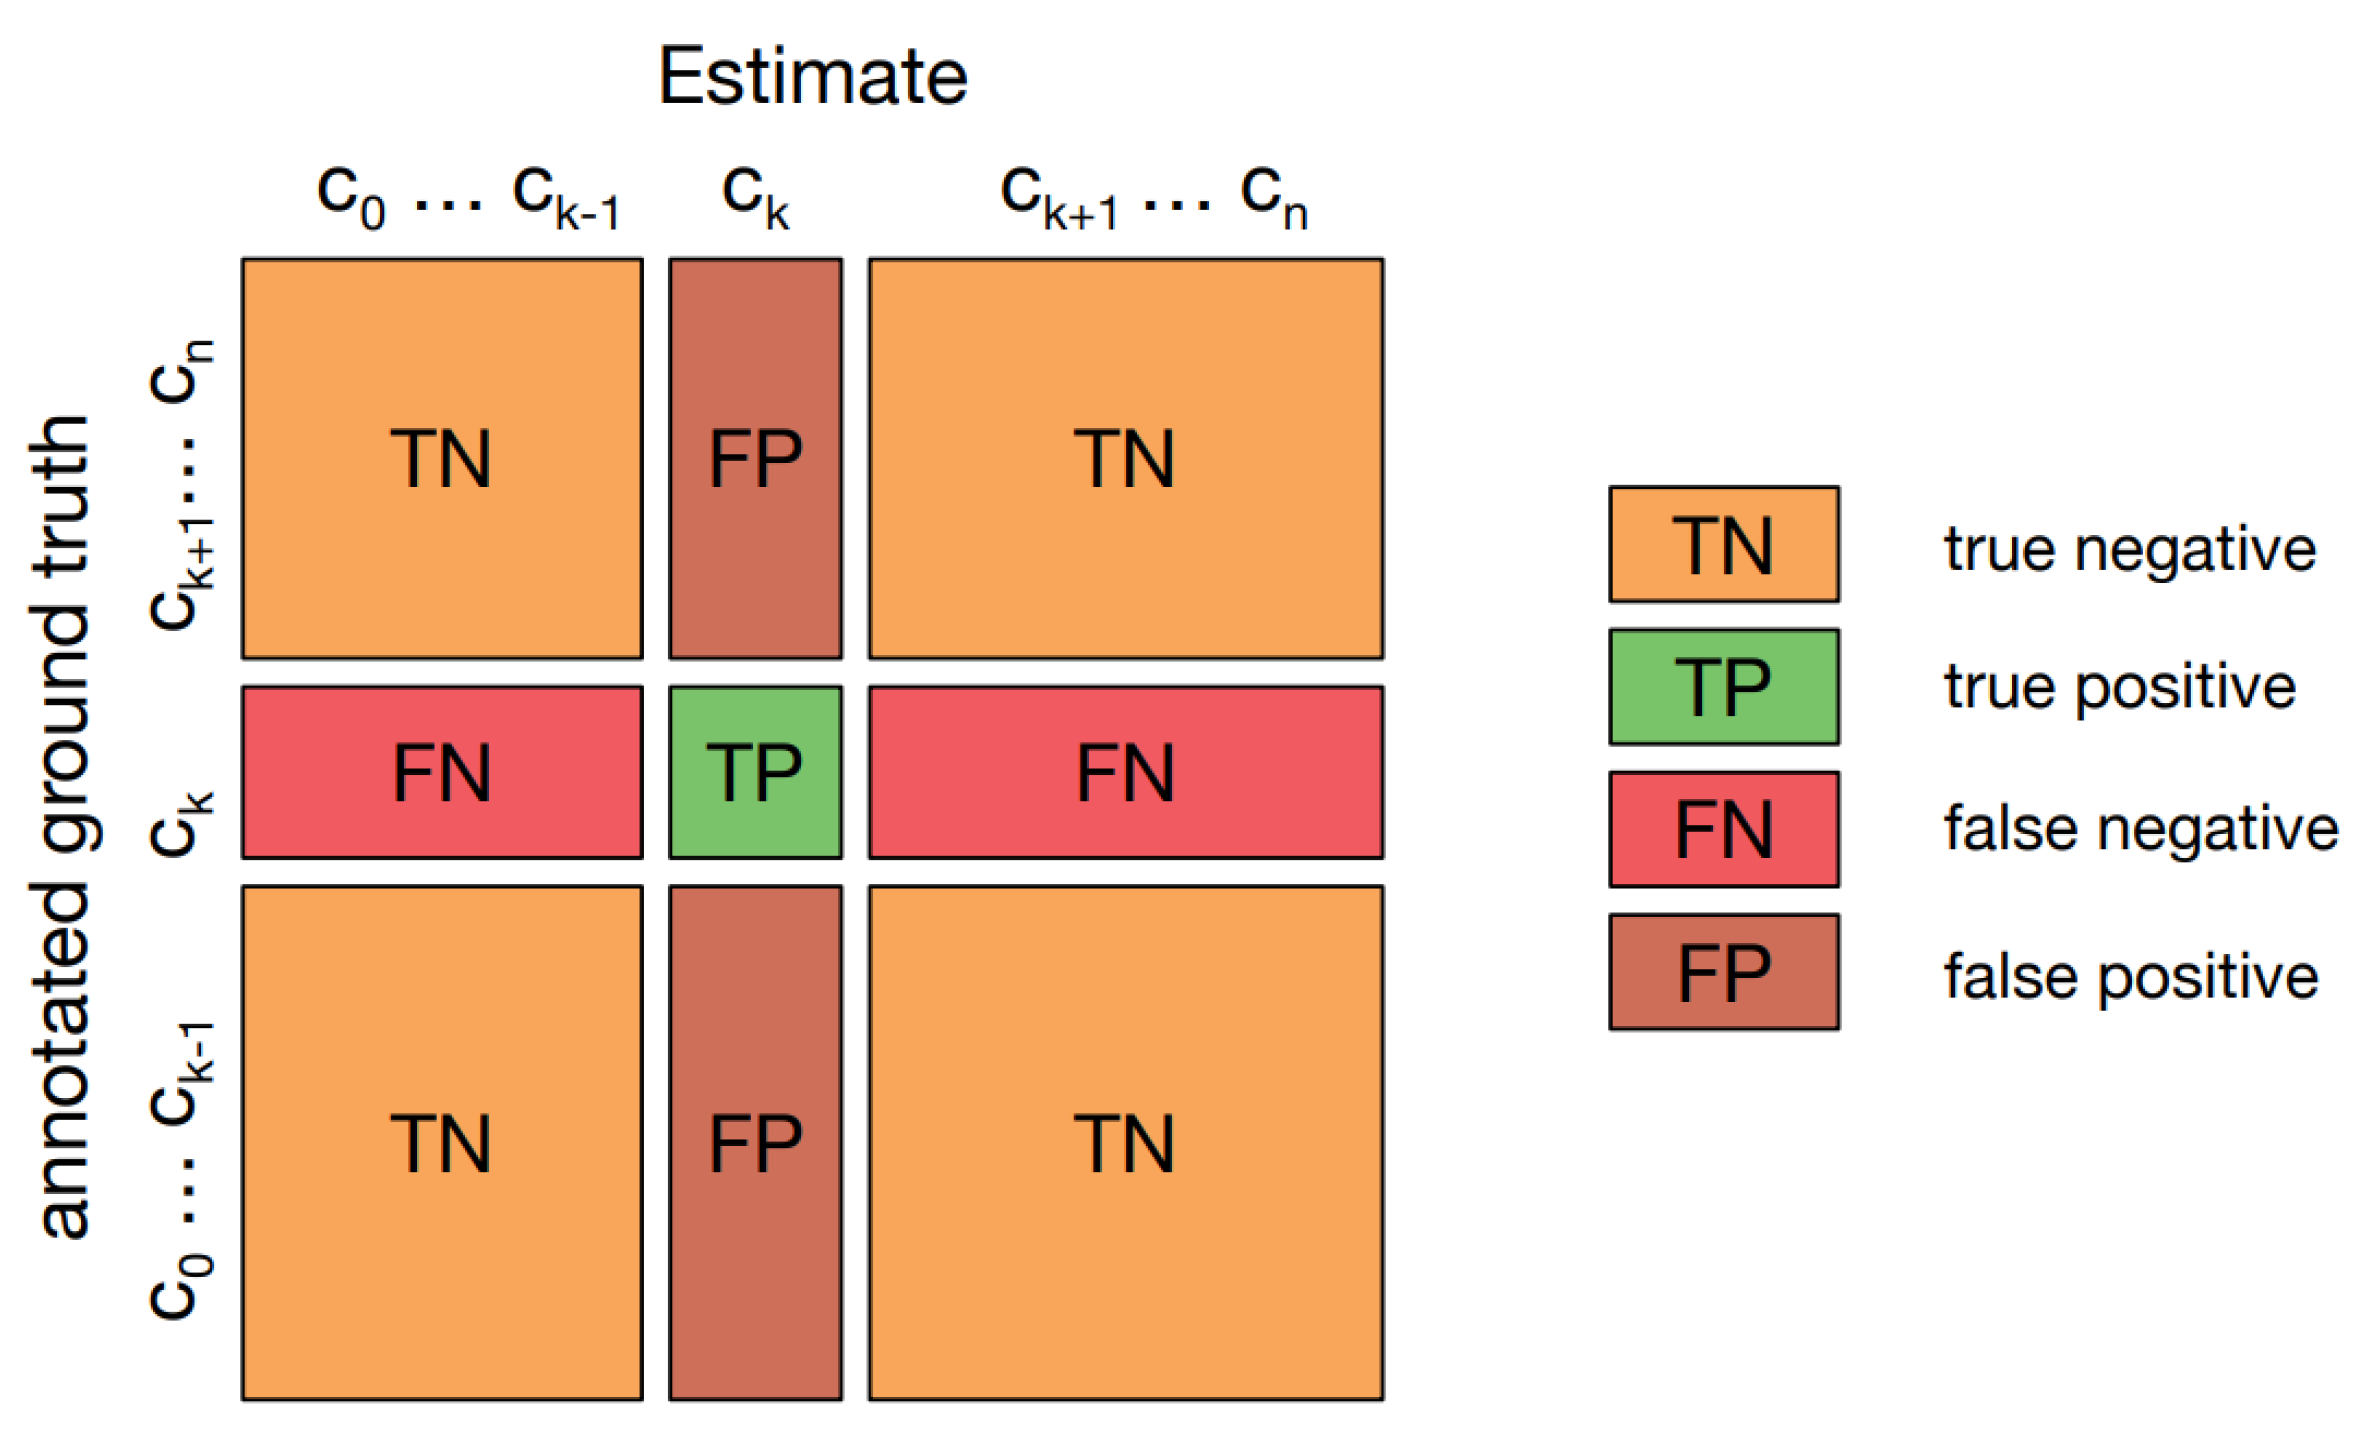
3.7.1. Confusion Matrix
A confusion matrix [
37], or error matrix, visualizes algorithm performance, especially in supervised learning. Rows represent actual classes; columns represent predicted classes.
Figure 10 displays one in multi-class classification, showing “TN and TP” for correctly classified negative and positive cases, and “FN and FP” for misclassified cases.
3.7.2. Classification Report
A classification report [
37] evaluates prediction quality using precision, recall, and F1-score per class, along with macro and weighted average accuracies.
Accuracy, calculated as a percentage of correct predictions, is determined by Equation (3) [
37]:
Precision measures the quality of a positive prediction made by the model and the Equation (4) [
37] demonstrates its computational process:
Recall measures how many of the true positives (TPs) were recalled (found) and calculated using the Equation (5) [
37]:
F1-Score is the harmonic mean of precision and recall and can be calculated using the Equation (6) [
37]:
3.7.3. Score-CAM
A Score-CAM [
12] is a score-weight visual explanation method based on a class activation mapping (CAM) for CNN models. It helps to understand the internal mechanism of CNN models.
5. Discussion
This research represents a significant step forward in the application of deep learning to automate the reading, analysis, and classification of blood cells.
Table 12 summarizes the macro-average precisions, recalls, F1-scores, and accuracy of the fine-tuned EfficientNetV2 B0 model across the testing subsets of the imbalanced “augmented 419-PMY,” “1K-PBC,” “2K-PBC” datasets, and the “Balanced PBC” dataset.
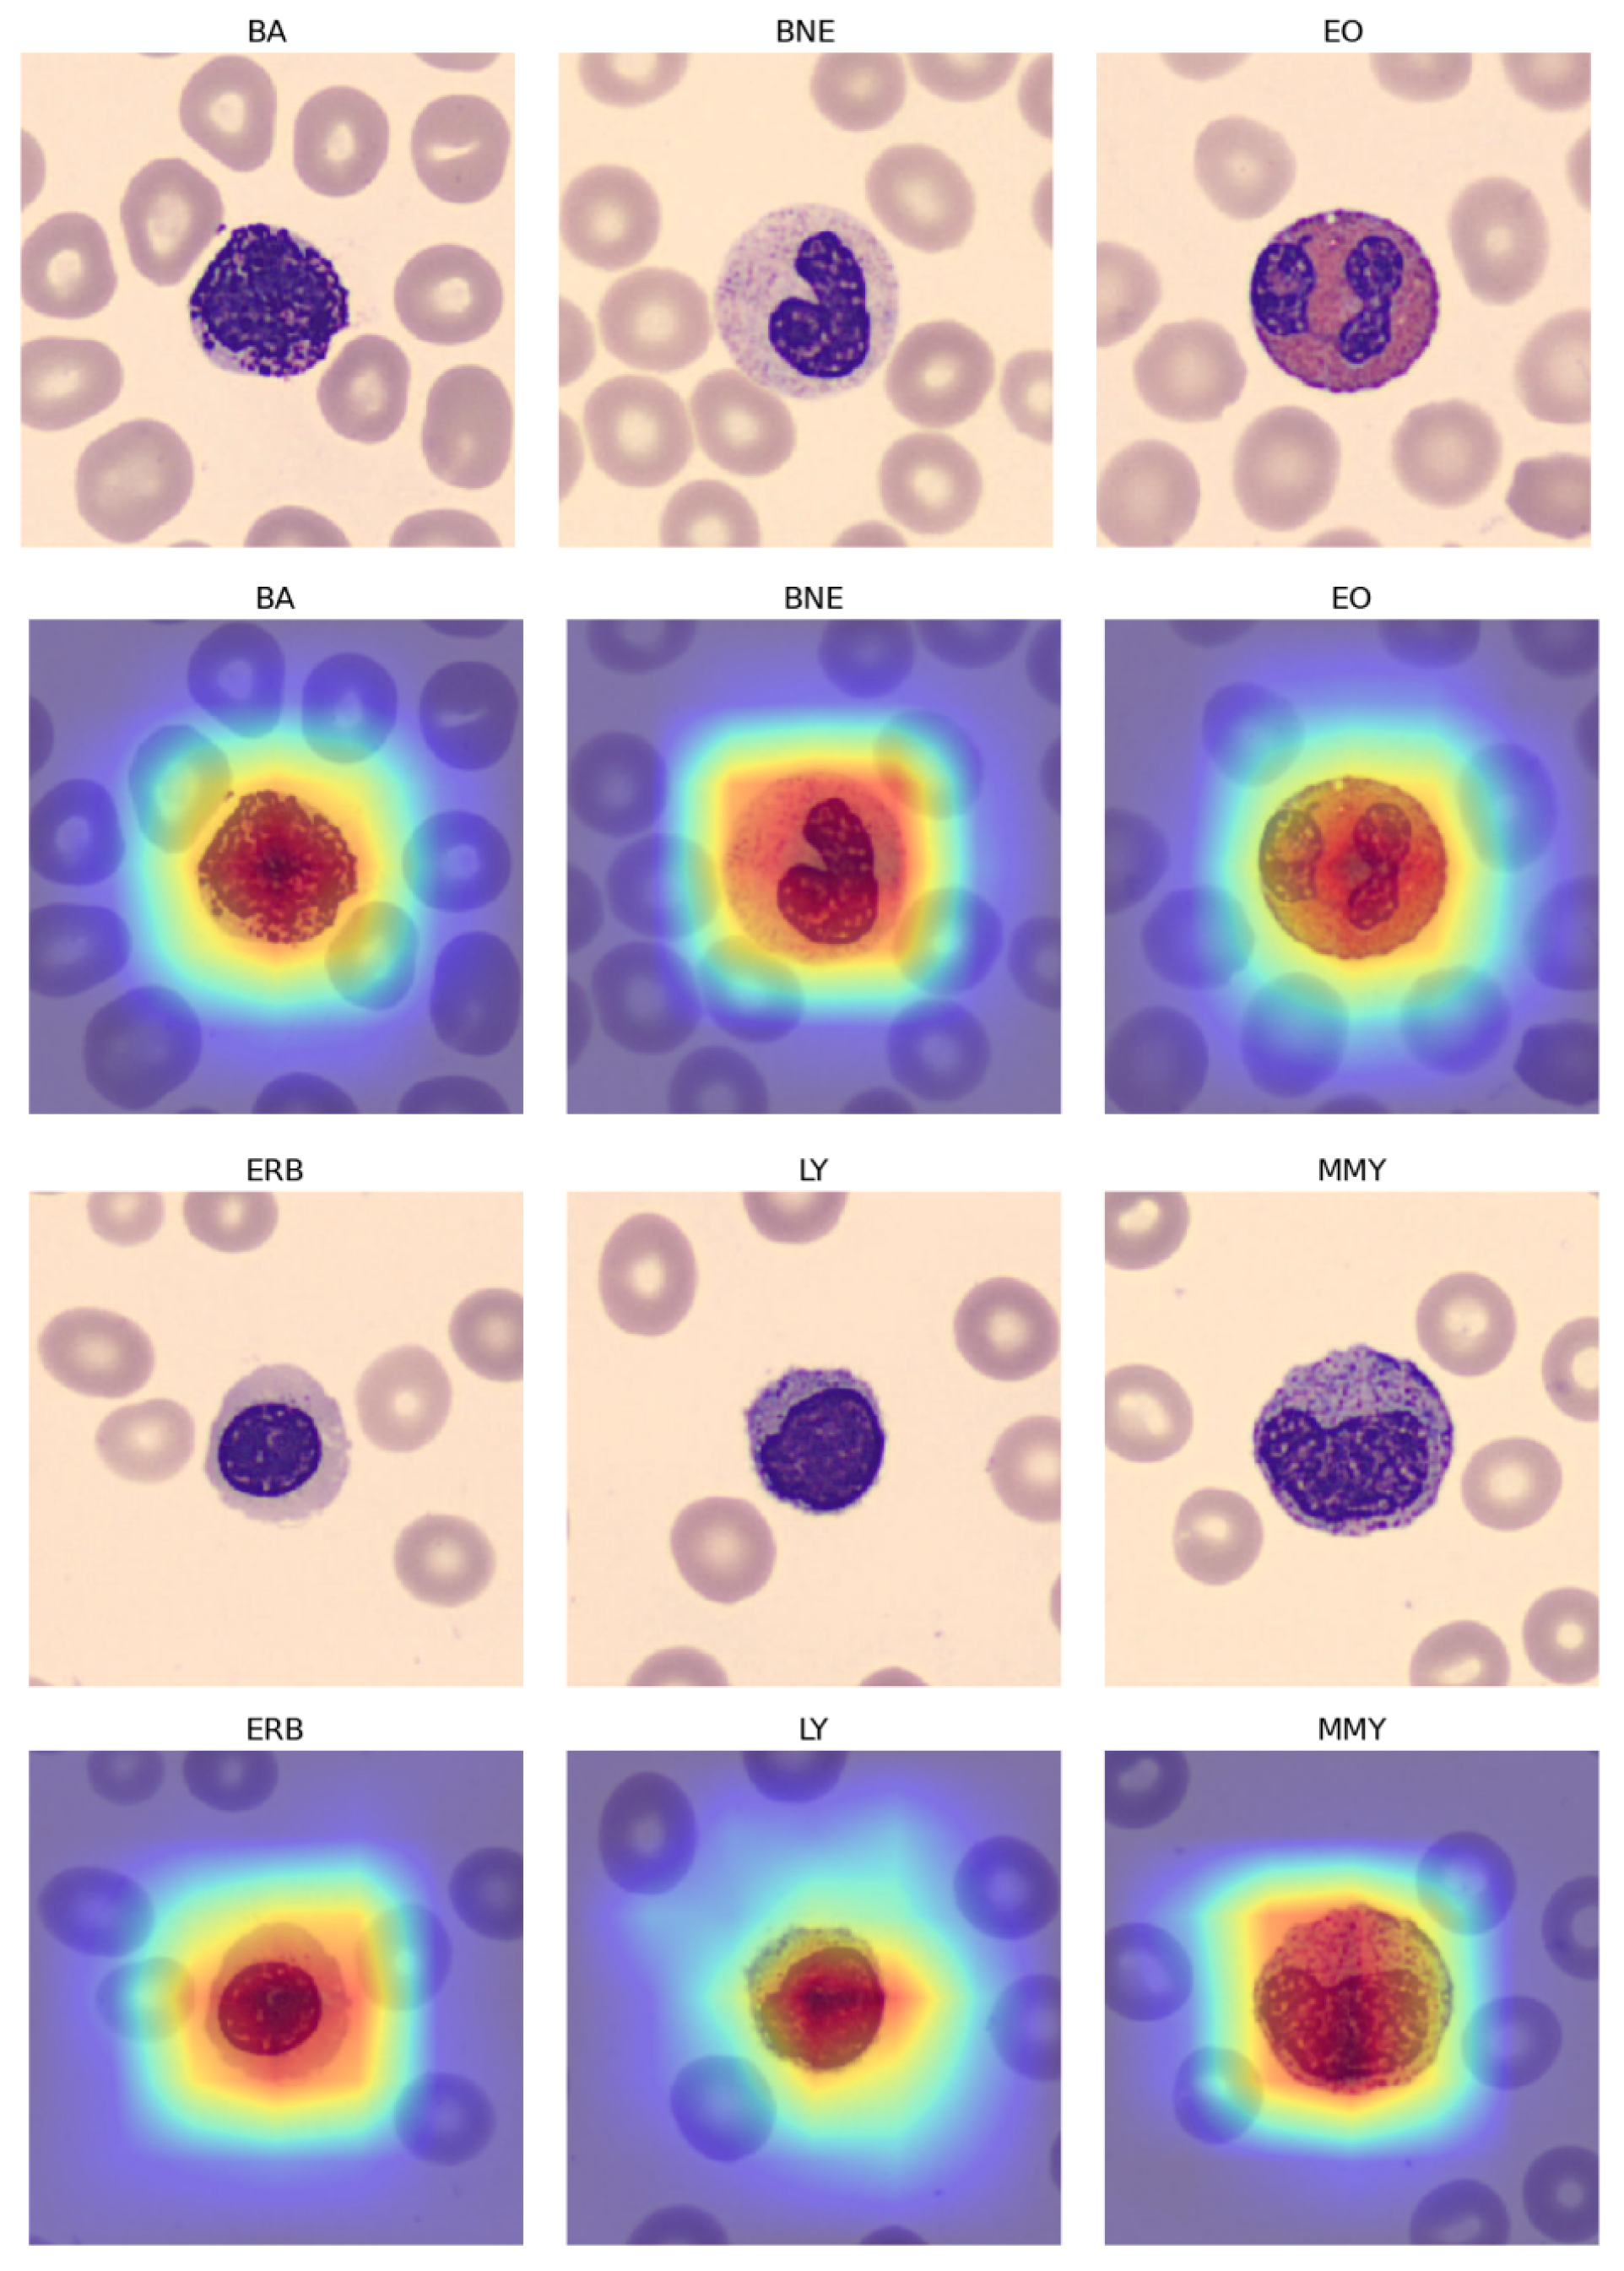
Table 12 demonstrates that while the imbalanced nature of the 11 blood classes led to some minor overfitting, the application of the “Naturalize” augmentation technique substantially improved macro-average precision, recall, and F1-score, increasing from 90% with the original PBC dataset to 97% with the 2K-PBC dataset. These findings are further supported by the use of Score-CAM, as shown in
Figure 11, which visualizes the fine-tuned pre-trained DenseNet-169 model with the augmented 419-PMY PBC dataset.
5.1. Model Performance across Datasets
The evaluation of the EfficientNetV2 B0 model across different datasets reveals compelling results. In the case of the “419-PMY PBC” dataset, where the limited number of pro-myelocytes posed a challenge, the model demonstrated commendable precision, recall, and F1-score improvements compared to the original PBC dataset. The effectiveness of the “Naturalize” augmentation technique is evident as it mitigated data insufficiency issues and improved overall model performance.
The model’s adaptability is further highlighted in its performance across the “1K-PBC” and “2K-PBC” datasets. Notably, the macro-average precision, recall, and F1-score consistently increased, showcasing the model’s capability to handle larger and more balanced datasets. The highest performance is observed in the “2K-PBC” dataset, where the model achieved impressive accuracy and balanced precision across all classes.
5.2. Impact of Naturalize Augmentation Technique
The successful implementation of the “Naturalize” augmentation technique emerges as a key contributor to the improved performance. The technique addressed challenges related to data insufficiency and class imbalance, resulting in a substantial enhancement in macro-average precision, recall, and F1-score. The augmentation technique not only overcame the limitations of the original PBC dataset but also demonstrated its effectiveness in creating balanced datasets, as evidenced by the performance on the “2K-class-PBC” dataset.
5.3. Insights from Score-CAM Visualization
In the context of blood cell classification using Score-CAM, the integration of the Jet colormap serves as a valuable visual aid in highlighting the regions of significance within the blood cell images. Leveraging Score-CAM, an interpretability technique in deep learning, the Jet colormap is applied to create a heatmap representation. This heatmap, overlaid onto the original blood cell images, employs a spectrum of colors transitioning through red, yellow, green, cyan, blue, and magenta. These colors depict the intensity and relevance of features identified by the neural network in its classification decision-making process. The Jet colormap emphasizes areas of high activation or importance, offering a clearer understanding of specific regions or structures within the blood cell images that contribute significantly to classification outcomes. This visualization approach enhances interpretability, providing insights into the neural network’s decision-making process for blood cell classification tasks.
The insights gleaned from the Score-CAM visualization further validate the effectiveness of the models.
Figure 11 presents an internal visualization of the fine-tuned DenseNet-169 model using the “augmented 419-PMY PBC” dataset. This visualization complements the quantitative results, illustrating the model’s focus on pertinent regions of the blood cell images for accurate classification. This alignment between quantitative metrics and visual insights bolsters the credibility of the findings.
5.4. Implications for Blood Cell Classification
The success of this study in addressing challenges related to data insufficiency and class imbalance has broader implications for the field of blood cell classification. The “Naturalize” augmentation technique not only improves model performance but also holds promise for creating extensive and balanced peripheral blood smear datasets. This breakthrough opens avenues for the widespread application of deep learning algorithms in clinical settings, enhancing the efficiency and accuracy of blood cell analysis.
5.5. Discussion Summary
In summary, the refined EfficientNetV2 B0 model, in conjunction with the innovative “Naturalize” augmentation technique, presents a robust solution for the automated classification of blood cells. The study’s findings contribute significantly to advancing the use of deep learning in medical image analysis, offering potential implications for diagnostic support in hematology.
Traditional image augmentation methods, encompassing actions like rotation and color adjustments, primarily aim to enhance overall diversity within datasets. In contrast, the “Naturalize” technique stands out as a sophisticated approach, utilizing precise segmentation to extract specific cell classes, such as Red Blood Cells (RBCs), White Blood Cells (WBCs), and Platelets (PLTs), from the dataset. Through the amalgamation of these segmented elements, “Naturalize” generates a comprehensive and authentic expansion of the original dataset. The distinguishing feature of this technique lies in its unparalleled control, facilitating the precise selection and regulation of specific cell quantities while maintaining realism and preventing overlap, thanks to a ’Collision-Free’ mechanism.
By effectively tackling challenges related to data insufficiency and class imbalance through the “Naturalize” augmentation method, this study establishes a solid foundation for the broader adoption of deep learning algorithms and models in blood cell classification. The implementation of “Naturalize” holds tremendous promise for the creation of comprehensive and balanced peripheral blood smear datasets.
Moreover, it is crucial to recognize that ’Naturalize’ transcends the realm of medical imaging alone; its adaptability extends to various fields, underscoring its potential for widespread application. This method distinguishes itself through its unwavering commitment to authenticity and tailored diversity, ensuring the preservation of genuine cell sizes and meeting specific augmentation requirements.
6. Conclusions
In this study, we have presented a comprehensive approach to automated blood cell classification, addressing the challenges posed by an imbalanced dataset and limited sample sizes within specific classes. Our methodology leverages state-of-the-art deep learning models, including pre-trained ConvNets and ViTb16, along with a customized multi-layer CNN model. Through the application of transfer learning, fine-tuning, and ensemble learning techniques, we have achieved remarkable results on the 11-class PBC dataset.
Our most significant achievement lies in the fully fine-tuned EfficientNetV2 B0 model, which demonstrated exceptional performance on the original PBC dataset, with a macro-average precision, recall, and F1-score of 91%, 90%, and 90%, respectively, and an impressive average accuracy of 93%. This success underscores the effectiveness of our approach in addressing the inherent challenges of blood cell classification.
Furthermore, we introduced the “Naturalize” augmentation technique, a novel and innovative approach to generating synthetic blood cell samples with the same quality as the original dataset. The resulting 2K-PBC dataset, augmented using “Naturalize,” achieved outstanding results, with a macro-average precision, recall, and F1-score of 97%, and an average accuracy of 96% when employing the fully fine-tuned EfficientNetV2 B0 model.
Our research not only provides a robust solution for blood cell classification but also contributes to the broader field of medical image analysis by addressing the common issues of insufficient and imbalanced data. The “Naturalize” augmentation technique opens up new possibilities for generating high-quality synthetic data, which can enhance the performance and generalization of deep learning models in various medical image analysis tasks.
In conclusion, this study represents a significant step forward in the automated classification of blood cells, offering a powerful tool for medical professionals and researchers. The combination of advanced deep learning models and innovative data augmentation techniques has the potential to revolutionize the field, leading to more accurate and reliable diagnostic tools for blood-related disorders and diseases. We anticipate that our work will inspire further research and advancements in this critical area of healthcare and medical imaging.


